1 Chapter 6. Section 6-5. Triola, Elementary Statistics, Eighth Edition. Copyright 2001. Addison...
25
1 Chapter 6. Section 6-5. Triola, Elementary Statistics, Eighth Edition. Copyright 2001. Addison Wesley Longman MARIO F. TRIOLA EIGHTH EDITION ELEMENTARY STATISTICS Section 6-5 Estimating a Population Proportion
-
Upload
julius-beasley -
Category
Documents
-
view
229 -
download
3
Transcript of 1 Chapter 6. Section 6-5. Triola, Elementary Statistics, Eighth Edition. Copyright 2001. Addison...

1Chapter 6. Section 6-5. Triola, Elementary Statistics, Eighth Edition. Copyright 2001. Addison Wesley Longman
MARIO F. TRIOLAMARIO F. TRIOLA EIGHTHEIGHTH
EDITIONEDITION
ELEMENTARY STATISTICS
Section 6-5 Estimating a Population Proportion

2Chapter 6. Section 6-5. Triola, Elementary Statistics, Eighth Edition. Copyright 2001. Addison Wesley Longman
Assumptions 1. The sample is a simple random
sample.
2. The conditions for the binomial distribution are satisfied
3. The normal distribution can be used to approximate the distribution of sample proportions because np 5 and nq 5 are both satisfied.
ˆ ˆ

3Chapter 6. Section 6-5. Triola, Elementary Statistics, Eighth Edition. Copyright 2001. Addison Wesley Longman
q = 1 - p = sample proportion of x failures in a sample size of n
p =ˆ xn sample proportion
ˆ
p = population proportion
(pronounced ‘p-hat’)
of x successes in a sample of size n
Notation for Proportions
ˆ

4Chapter 6. Section 6-5. Triola, Elementary Statistics, Eighth Edition. Copyright 2001. Addison Wesley Longman
DefinitionPoint Estimate
The sample proportion p is the best point estimate of the population
proportion p.
(In other books population proportion can be noted as )
ˆ

5Chapter 6. Section 6-5. Triola, Elementary Statistics, Eighth Edition. Copyright 2001. Addison Wesley Longman
Margin of Error of the Estimate of p
z
ME =
nˆ ˆp q

6Chapter 6. Section 6-5. Triola, Elementary Statistics, Eighth Edition. Copyright 2001. Addison Wesley Longman
Confidence Interval for Population Proportion
p - ME < < + ME where
ˆ p ˆ p
z
ME =
nˆ ˆp q

7Chapter 6. Section 6-5. Triola, Elementary Statistics, Eighth Edition. Copyright 2001. Addison Wesley Longman
Confidence Interval for Population Proportion
p - E < < + E
p = p + E
(p - E, p + E)
ˆ p ˆ p
ˆ
ˆ ˆ

8Chapter 6. Section 6-5. Triola, Elementary Statistics, Eighth Edition. Copyright 2001. Addison Wesley Longman
Round-Off Rule for Confidence Interval Estimates of p
Round the confidence interval limits to
three significant digits.

9Chapter 6. Section 6-5. Triola, Elementary Statistics, Eighth Edition. Copyright 2001. Addison Wesley Longman
Do people lie about voting?
• In a survey of 1002 people, 701 people said they voted in a recent election. Voting records showed that 61% of eligible voters actually did vote. Using these results, find the following about the people who “said” they voted:
• a) Find the point estimate• b) Find the 95% confidence interval estimate of
the proportion • c) Are the survey results are consistent with the
actual voter turnout of 61%?

10Chapter 6. Section 6-5. Triola, Elementary Statistics, Eighth Edition. Copyright 2001. Addison Wesley Longman
Do people lie about voting?
• In a survey of 1002 people, 701 people said they voted in a recent election. Voting records showed that 61% of eligible voters actually did vote. Using these results, find the following about the people who said they voted:
• a) Find the point estimate
701ˆ 0.6996 0.700
1002
xp
n

11Chapter 6. Section 6-5. Triola, Elementary Statistics, Eighth Edition. Copyright 2001. Addison Wesley Longman
Do people lie about voting?
• b) Find the 95% confidence interval estimate of the proportion
/ 2
ˆ ˆ (.70)(.30)1.96 .0284
1002
pqE z
n
ˆ ˆ
.7 .0284 .7 .0284
.671 .728
p E p p E
p
p

12Chapter 6. Section 6-5. Triola, Elementary Statistics, Eighth Edition. Copyright 2001. Addison Wesley Longman
Do people lie about voting?
• c) Are the survey results consistent with the actual voter turnout of 61%?
We are 95% confident that the true proportion of the people who said they vote is in the interval 67.1% <p<72.8% .
Because 61% does not fall inside the interval, we can conclude our survey results are not consistent with the actual voter turnout.

13Chapter 6. Section 6-5. Triola, Elementary Statistics, Eighth Edition. Copyright 2001. Addison Wesley Longman
( )2 ˆp q
Determining Sample Size
zME =
p qnˆ ˆ
(solve for n by algebra)
zn =
ˆME2

14Chapter 6. Section 6-5. Triola, Elementary Statistics, Eighth Edition. Copyright 2001. Addison Wesley Longman
Sample Size for Estimating Proportion p
When an estimate of p is known: ˆ
ˆ( )2 p qn =
ˆE2
z
When no estimate of p is known:
( )2 0.25n =
E2z
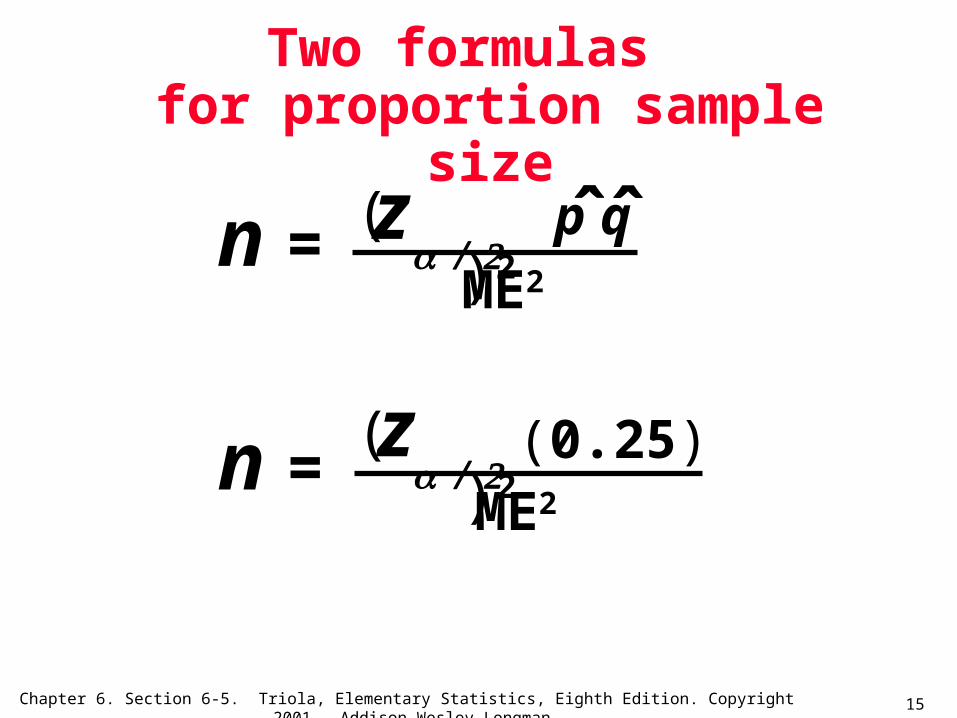
15Chapter 6. Section 6-5. Triola, Elementary Statistics, Eighth Edition. Copyright 2001. Addison Wesley Longman
ME2n =
z( )2(0.25)
Two formulas for proportion sample size
zn =
( )2 p q
ME2
ˆ ˆ

16Chapter 6. Section 6-5. Triola, Elementary Statistics, Eighth Edition. Copyright 2001. Addison Wesley Longman
Example: We want to determine, with a margin of error of four percentage points, the current percentage of U.S. households using e-mail. Assuming that we want 90% confidence in our results, how many households must we survey? A 1997 study indicates 16.9% of U.S. households used e-mail.

17Chapter 6. Section 6-5. Triola, Elementary Statistics, Eighth Edition. Copyright 2001. Addison Wesley Longman
n = [z/2 ]2 p q̂ˆ
E2
Example: We want to determine, with a margin of error of four percentage points, the current percentage of U.S. households using e-mail. Assuming that we want 90% confidence in our results, how many households must we survey? A 1997 study indicates 16.9% of U.S. households used e-mail.
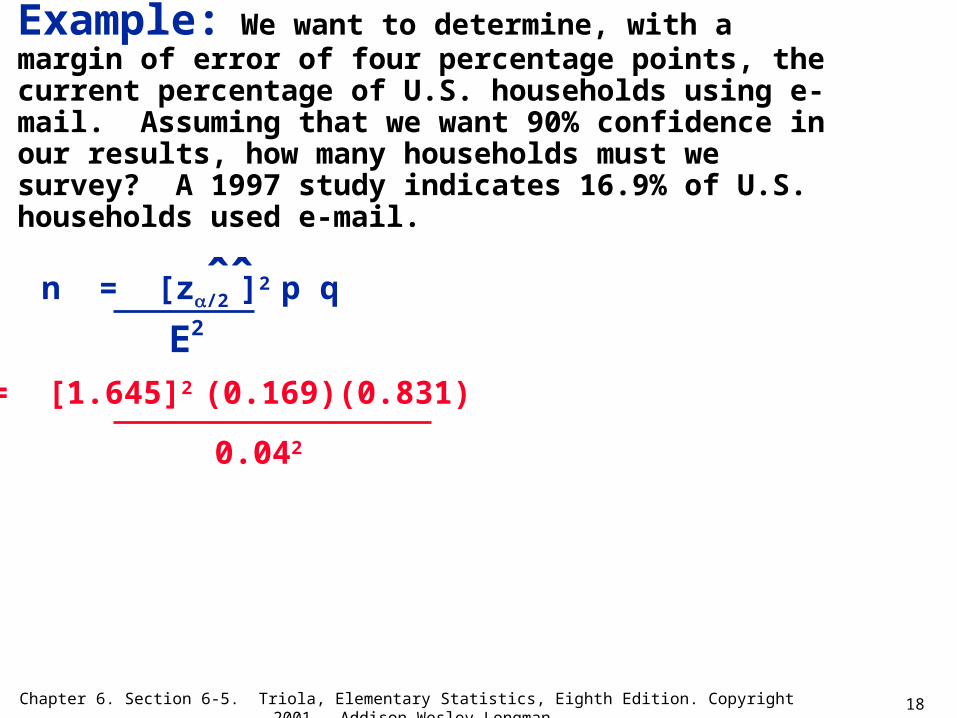
18Chapter 6. Section 6-5. Triola, Elementary Statistics, Eighth Edition. Copyright 2001. Addison Wesley Longman
n = [z/2 ]2 p q
E2
= [1.645]2 (0.169)(0.831)
0.042
Example: We want to determine, with a margin of error of four percentage points, the current percentage of U.S. households using e-mail. Assuming that we want 90% confidence in our results, how many households must we survey? A 1997 study indicates 16.9% of U.S. households used e-mail.
ˆˆ

19Chapter 6. Section 6-5. Triola, Elementary Statistics, Eighth Edition. Copyright 2001. Addison Wesley Longman
= [1.645]2 (0.169)(0.831)
n = [z/2 ]2 p q
E2
= 237.51965= 238 households
Example: We want to determine, with a margin of error of four percentage points, the current percentage of U.S. households using e-mail. Assuming that we want 90% confidence in our results, how many households must we survey? A 1997 study indicates 16.9% of U.S. households used e-mail.
To be 90% confident that our sample percentage is within four percentage points of the true percentage for all households, we should randomly select and survey 238 households.
0.042
ˆˆ

20Chapter 6. Section 6-5. Triola, Elementary Statistics, Eighth Edition. Copyright 2001. Addison Wesley Longman
Example: We want to determine, with a margin of error of four percentage points, the current percentage of U.S. households using e-mail. Assuming that we want 90% confidence in our results, how many households must we survey? There is no prior information suggesting a possible value for the sample percentage.

21Chapter 6. Section 6-5. Triola, Elementary Statistics, Eighth Edition. Copyright 2001. Addison Wesley Longman
n = [z/2 ]2 (0.25)
E
2
Example: We want to determine, with a margin of error of four percentage points, the current percentage of U.S. households using e-mail. Assuming that we want 90% confidence in our results, how many households must we survey? There is no prior information suggesting a possible value for the sample percentage.

22Chapter 6. Section 6-5. Triola, Elementary Statistics, Eighth Edition. Copyright 2001. Addison Wesley Longman
n = [z/2 ]2 (0.25)
E = (1.645)2 (0.25)
2
0.042
Example: We want to determine, with a margin of error of four percentage points, the current percentage of U.S. households using e-mail. Assuming that we want 90% confidence in our results, how many households must we survey? There is no prior information suggesting a possible value for the sample percentage.
= 422.81641 = 423 households

23Chapter 6. Section 6-5. Triola, Elementary Statistics, Eighth Edition. Copyright 2001. Addison Wesley Longman
n = [z/2 ]2 (0.25)
E = (1.645)2 (0.25)
2
= 422.81641 = 423 households
With no prior information, we need a larger sample to achieve the same results with 90% confidence and an error of no more than 4%.
Example: We want to determine, with a margin of error of four percentage points, the current percentage of U.S. households using e-mail. Assuming that we want 90% confidence in our results, how many households must we survey? There is no prior information suggesting a possible value for the sample percentage.
0.042

24Chapter 6. Section 6-5. Triola, Elementary Statistics, Eighth Edition. Copyright 2001. Addison Wesley Longman
Finding the Point Estimate and E from a Confidence Interval
Point estimate of p:
p = (upper confidence interval limit) + (lower confidence interval limit)
2
Margin of Error:
E = (upper confidence interval limit) - (lower confidence interval limit)
2
ˆˆ

25Chapter 6. Section 6-5. Triola, Elementary Statistics, Eighth Edition. Copyright 2001. Addison Wesley Longman
Finding the Point Estimate and E from a Confidence Interval
Find the point estimate of p:
p = .678 + .214 = .446
2ˆ
ˆ
Margin of Error:
E = .678 - .214 = .232
2
Given the confidence interval .214< p < .678