07 Ppc Ch7 Theory of Constraints
52
Constraint Management Chapter 7 07- 01
Transcript of 07 Ppc Ch7 Theory of Constraints

Constraint Management
Chapter 7 07- 01

What is a Constraint?
Constraint Any factor that limits the performance of a system and restricts its output.
Bottleneck A capacity constraint resource whose available capacity limits the organization’s ability to meet the product volume or mix, or demand fluctuations.
07- 02

Theory of Constraints
1. Identify the System Bottleneck(s)
2. Exploit the Bottleneck(s)
3. Subordinate All Other Decisions to Step 2
4. Elevate the Bottleneck(s)
5. Do Not Let Inertia Set In
07 - 03

Theory of Constraints and Financial Measures
07 - 04

Key Principles of the TOC
• The focus should be on balancing flow, not on balancing capacity.
• Maximizing the output and efficiency of every resource may not maximize the throughput of the entire system.
• An hour lost at a bottleneck or constrained resource is an hour lost for the whole system. – An hour saved does not make the system more
productive.
• Inventory is only needed in front of bottlenecks and in front of assembly and shipping points.
07 - 05
Key Principles of the TOC
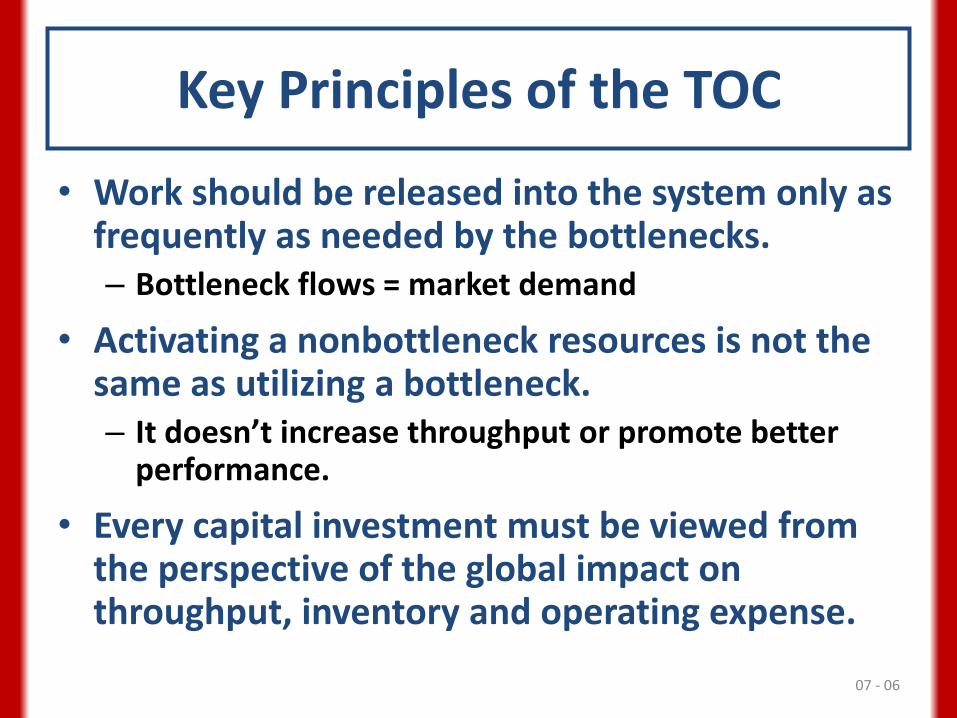
• Work should be released into the system only as frequently as needed by the bottlenecks. – Bottleneck flows = market demand
• Activating a nonbottleneck resources is not the same as utilizing a bottleneck. – It doesn’t increase throughput or promote better
performance.
• Every capital investment must be viewed from the perspective of the global impact on throughput, inventory and operating expense.
07 - 06

Identifying the Bottleneck Example 7.1
• Managers at the First Community Bank are attempting to shorten the time it takes customers with approved loan applications to get their paperwork processed. The flowchart for this process is shown in the next slide.
• Approved loan applications first arrive at activity or step 1, where they are checked for completeness and put in order.
• At step 2, the loans are categorized into different classes according to the loan amount and whether they are being requested for personal or commercial reasons.
• While credit checking commences at step 3, loan application data are entered in parallel into the information system for record-keeping purposes at step 4.
• Finally, all paperwork for setting up the new loan is finished at step 5. The time taken in minutes is given in parentheses.
07 - 07

Identifying the Bottleneck Example 7.1
Which single step is the bottleneck? The management is also interested in knowing the maximum number of approved loans this system can process in a 5-hour work day.
07- 08

Example 7.1
• We define the bottleneck as step 2, which has the highest time per loan processed.
• The throughput time to complete an approved loan application is 15 + 20 + max(15, 12) + 10 = 60 minutes.
• The actual time taken for completing an approved loan will be longer than 60 minutes due to nonuniform arrival of applications, variations in actual processing times, and the related factors.
• The capacity for loan completions is derived by translating the “minutes per customer” at the bottleneck step to “customer per hour.” At First Community Bank, it is 3 customers per hour because the bottleneck step 2 can process only 1 customer every 20 minutes (60/3).
07 - 09

Application Problem 7.1
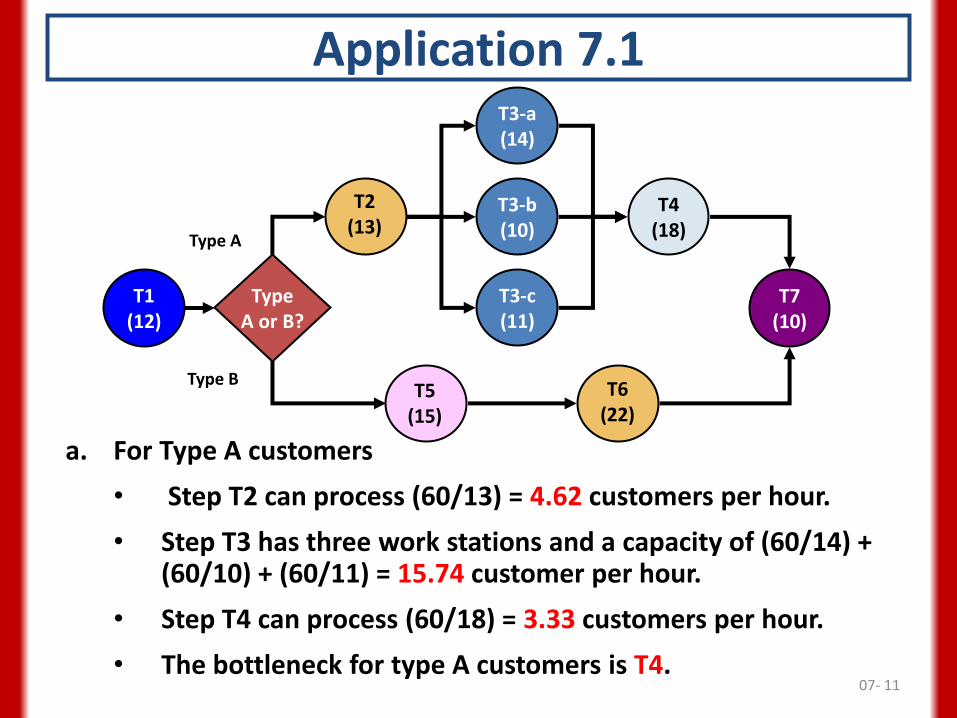
Two types of customers enter Barbara’s Boutique shop for customized dress alterations. After T1, Type A customers proceed to step T2 and then to any of the three workstations at T3, followed by steps T4 and T7. After step T1,Type B customers proceed to step T5 and then steps T6 and T7. The numbers in the parentheses are the minutes it takes that activity to process a customer.
a. What is the capacity per hour of Type A customers?
b. If 30 percent of the customers are Type A customers and 70 percent are Type B customers, what is the average capacity?
c. When would Type A customers experience waiting lines, assuming there are no Type B customers in the shop? Where would Type B customers have to wait, assuming no Type A customers?
07 - 10
Application 7.1
a. For Type A customers
• Step T2 can process (60/13) = 4.62 customers per hour.
• Step T3 has three work stations and a capacity of (60/14) + (60/10) + (60/11) = 15.74 customer per hour.
• Step T4 can process (60/18) = 3.33 customers per hour.
• The bottleneck for type A customers is T4.
T1 (12)
T7 (10)
T4 (18)
T3-a (14)
T3-c (11)
T3-b (10)
Type A or B?
Type A
Type B
T2 (13)
T6 (22)
T5 (15)
07- 11
Application 7.1
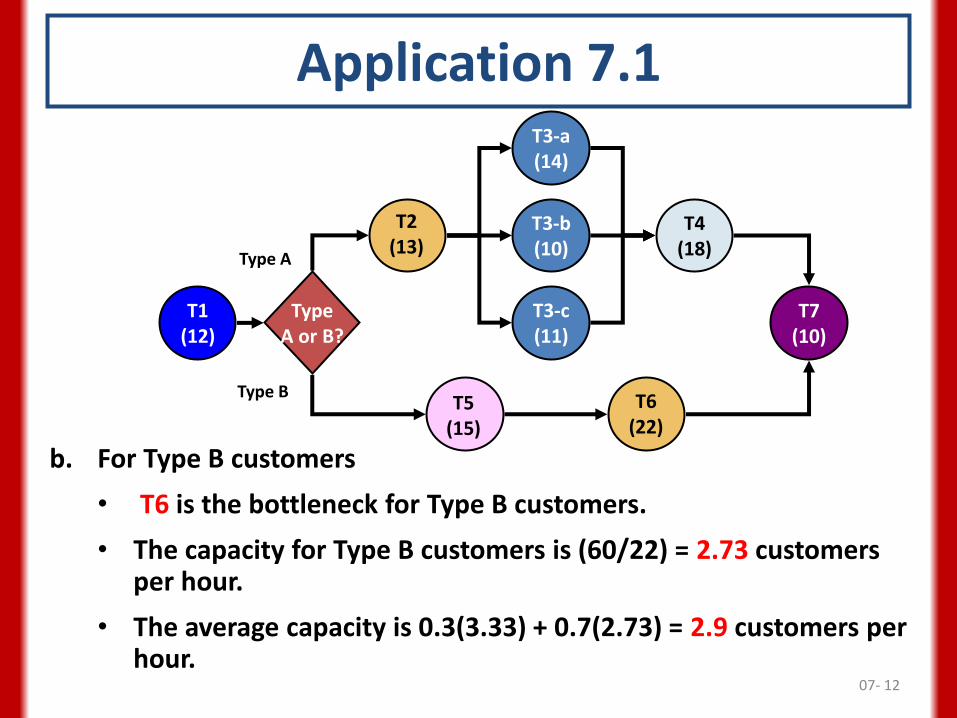
b. For Type B customers
• T6 is the bottleneck for Type B customers.
• The capacity for Type B customers is (60/22) = 2.73 customers per hour.
• The average capacity is 0.3(3.33) + 0.7(2.73) = 2.9 customers per hour.
T1 (12)
T7 (10)
T4 (18)
T3-a (14)
T3-c (11)
T3-b (10)
Type A or B?
Type A
Type B
T2 (13)
T6 (22)
T5 (15)
07- 12

before steps T2 and T4 because the activities immediately preceding them have a higher rate of output.
c. Type A customers would wait
Application 7.1
before steps T5 and T6 for the same reason. This assumes there are always new customers entering the shop.
Type B customers would wait
07- 13
T1 (12)
T7 (10)
T4 (18)
T3-a (14)
T3-c (11)
T3-b (10)
Type A or B?
Type A
Type B
T2 (13)
T6 (22)
T5 (15)

Identifying the Bottleneck Example 7.2
Diablo Electronics manufactures four unique products (A, B, C, and D) that are fabricated and assembled in five different workstations (V, W, X, Y, and Z) using a small batch process. Each workstation is staffed by a worker who is dedicated to work a single shift per day at an assigned workstation. Batch setup times have been reduced to such an extent that they can be considered negligible. Figure 7.2 is a flowchart of the manufacturing process. Diablo can make and sell up to the limit of its demand per week, and no penalties are incurred for not being able to meet all the demand.
Which of the five workstations (V, W, X, Y, or Z) has the highest utilization, and thus serves as the bottleneck for Diablo Electronics?
07 - 14

Identifying the Bottleneck - 7.2
Product A
$5 Raw materials
Purchased parts
Product: A Price: $75/unit Demand: 60 units/wk
Step 1 at workstation V
(30 min)
Finish with step 3
at workstation X (10 min)
Step 2 at workstation Y
(10 min)
$5
Product C
Raw materials Purchased parts
Product: C Price: $45/unit Demand: 80
units/wk
Finish with step 4
at workstation Y (5 min)
Step 2 at workstation Z
(5 min)
Step 3 at workstation X
(5 min)
Step 1 at workstation W
(5 min)
$2
$3
Product B
Raw materials Purchased parts
Product: B Price: $72/unit Demand: 80 units/wk
Finish with step 2 at workstation X
(20 min)
Step 1 at workstation Y
(10 min)
$3
$2
Product D
Raw materials Purchased parts
Product: D Price: $38/unit Demand: 100
units/wk
$4 Step 2 at
workstation Z (10 min)
Finish with step 3
at workstation Y (5 min)
Step 1 at workstation W
(15 min)
$6
07- 15
Example 7.2
• Identify the bottleneck by computing aggregate workloads at each workstation.
• The firm wants to satisfy as much of the product demand in a week as it can.
• Each week consists of 2,400 minutes of available production time.
• Multiplying the processing time at each station for a given product with the number of units demanded per week yields the workload represented by that product.
• These loads are summed across all products going through a workstation to arrive at the total load for the workstation, which is then compared with the others and the existing capacity of 2,400 minutes.
07 - 16

Identifying the Bottleneck – 7.2
These calculations show that workstation X is the bottleneck, because the aggregate work load at X exceeds the available capacity of 2,400 minutes per week.
Workstation Load from
Product A
Load from
Product B
Load from
Product C
Load from
Product D
Total Load
(min)
V
W
X
Y
Z
60 x 30 = 1800 0 0 0 1,800
0 0 80 x 5 = 400 100 x 15 = 1,500 1,900
60 10 = 600 80 x 20 = 1,600 80 x 5 = 400 0 2,600
60 10 = 600 80 x 10 = 800 80 x 5 = 400
80 x 5 = 400
100 x 5 = 500 2,300
0 0 100 x 10 = 1,000 1,400
07- 17

Application 7.2 • O’Neill Enterprises manufactures three unique products (A, B, C)
that are fabricated and assembled in four different workstations (W, X, Y, Z) using a small batch process.
• Each of the products visits every one of the four workstations, though not necessarily in the same order.
• Batch setup times are negligible.
• O’Neill can make and sell up to the limit of its demand per week, and there are no penalties for not being able to meet all the demand.
• Each workstation is staffed by a worker dedicated to work on that workstation alone, and is paid $12 per hour.
• Variable overhead costs are $8000/week. The plant operates one 8-hour shift per day, or 40 hours/week.
• Which of the four workstations W, X, Y, or Z has the highest total workload, and thus serves as the bottleneck for O’Neill Enterprises?
07 - 18

Application 7.2
Product B
Raw materials Purchased part
Product: B Price: $85/unit Demand:70 units/ wk
Finish with step 4
at workstation Z (13 min)
Step 2 at workstation W
(10 min)
Step 3 at workstation Y
(10 min)
Step 1 at workstation X
(12 min)
$9
$5
Product A
Raw materials Purchased part
Product: A Price: $90/unit Demand:65 units /wk
Finish with step 4
at workstation Z (16 min)
Step 2 at workstation Y
(15 min)
Step 3 at workstation X
(9 min)
Step 1 at workstation W
(10 min)
$7
$6
Product C
Raw materials Purchased part
Product: C Price: $80/unit Demand: 80
units/wk
Finish with step 4
at workstation Z (10 min)
Step 2 at workstation X
(10 min)
Step 3 at workstation W
(12 min)
Step 1 at workstation Y
(5 min)
$10
$5
Flowchart for Products A, B, and C
07- 19
Application Problem 7.2
SOLUTION
Identify the bottleneck by computing total workload at each workstation. The firm wants to satisfy as much of the product demand in a week as it can. Each week consists of 2400 minutes of available production time. Multiplying the processing time at each station for a given product with the number of units demanded per week yields the capacity load. These loads are summed across all products going through that workstation and then compared with the existing capacity of 2400 minutes.
07- 20

Application 7.2
These calculations show that workstation Z is the bottleneck, because the aggregate work load at Z exceeds the available capacity of 2400 minutes per week.
Work Station
Load from Product A
Load from Product B
Load from Product C
Total Load (minutes)
W
X
Y
Z
(65x10)=650 (70x10)=700 (80x12)=960 2310
(65x9)=585 (70x12)=840 (80x10)=800 2225
(65x15)=975 (70x10)=700 (80x5)=400 2075
(65x16)=1040 (70x13)=910 (80x10)=800 2750
07- 21

Drum-Buffer-Rope Systems
Drum-Buffer-Rope
A planning and control system that regulates the flow of work-in-process materials at the bottleneck or the capacity constrained resource (CCR) in a productive system.
07- 22

Drum-Buffer-Rope Systems
• The bottleneck schedule is the drum because it sets the beat or the production rate for the entire plant and is linked to market demand
• The buffer is the time buffer that plans early flows into the bottleneck and thus protects it from disruption
• The rope represents the tying of material release to the drum beat, which is the rate at which the bottleneck controls the throughput of the entire plant
07- 23

Drum-Buffer-Rope Systems
Buffer Drum
Market Demand
650 units/wk
Shipping Schedule
Rope
Shipping Buffer
Finished Goods Inventory
Non-constraint
PROCESS C Capacity
700 units/wk
PROCESS B Capacity
800 units/wk
CCR (Bottleneck)
Constraint Buffer
Time Buffer Inventory
Non-constraint
PROCESS A Capacity
800 units/wk
Material Release
Schedule
07- 24

A Line Process
• Line Balancing
– Assignment of work to stations in a line so as to achieve the desired output rate with the smallest number of workstations
– Achieving the goal is similar to the theory of constraints but it differs in how it addresses bottlenecks
• Precedence Diagram
– AON Diagram
07 - 25

Example 7.4 Green Grass, Inc., a manufacturer of lawn and garden equipment, is designing an assembly line to produce a new fertilizer spreader, the Big Broadcaster. Using the following information on the production process, construct a precedence diagram for the Big Broadcaster.
Work Element
Description Time (sec) Immediate
Predecessor(s)
A Bolt leg frame to hopper
40 None
B Insert impeller shaft 30 A
C Attach axle 50 A
D Attach agitator 40 B
E Attach drive wheel 6 B
F Attach free wheel 25 C
G Mount lower post 15 C
H Attach controls 20 D, E
I Mount nameplate 18 F, G
Total 244 07 - 26

Example 7.4
07- 27
A Line Process
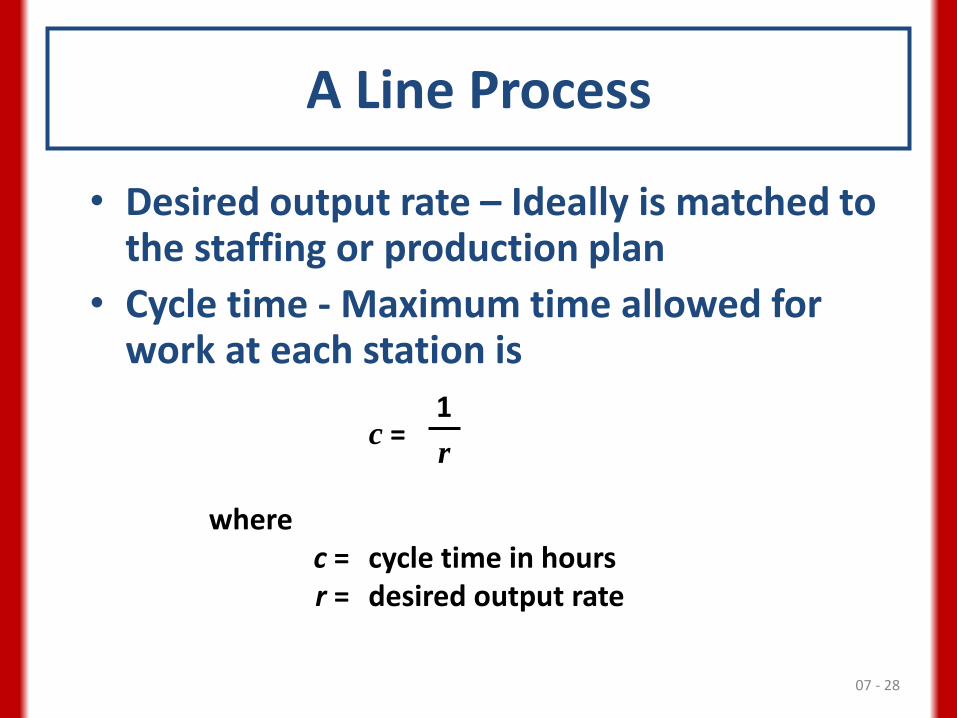
• Desired output rate – Ideally is matched to the staffing or production plan
• Cycle time - Maximum time allowed for work at each station is
where c = cycle time in hours r = desired output rate
07 - 28
c = 1
r

A Line Process
• Theoretical minimum number of stations
TM = t
c
where
t = total time required to assemble each unit
07 - 29

A Line Process
• Idle time
Idle time = nc – t
where
n = number of stations
C = cycle time
t = total time required to assemble each unit
07 - 30

A Line Process
• Efficiency and Balance Delay
Efficiency (%) = (100) t nc
Balance delay (%) = 100 – Efficiency
07 - 31

Example 7.5
Green Grass’s plant manager just received marketing’s latest forecasts of Big Broadcaster sales for the next year. She wants its production line to be designed to make 2,400 spreaders per week for at least the next 3 months. The plant will operate 40 hours per week.
a. What should be the line’s cycle time?
b. What is the smallest number of workstations that she could hope for in designing the line for this cycle time?
c. Suppose that she finds a solution that requires only five stations. What would be the line’s efficiency?
07 - 32

Example 7.5
a. First convert the desired output rate (2,400 units per week) to an hourly rate by dividing the weekly output rate by 40 hours per week to get units per hour. Then the cycle time is
c = 1/r =
b. Now calculate the theoretical minimum for the number of stations by dividing the total time, t, by the cycle time, c = 60 seconds. Assuming perfect balance, we have
TM = t
c
244 seconds
60 seconds = = 4.067 or 5 stations
1/60 (hr/unit) = 1 minute/unit = 60 seconds/unit
07 - 33
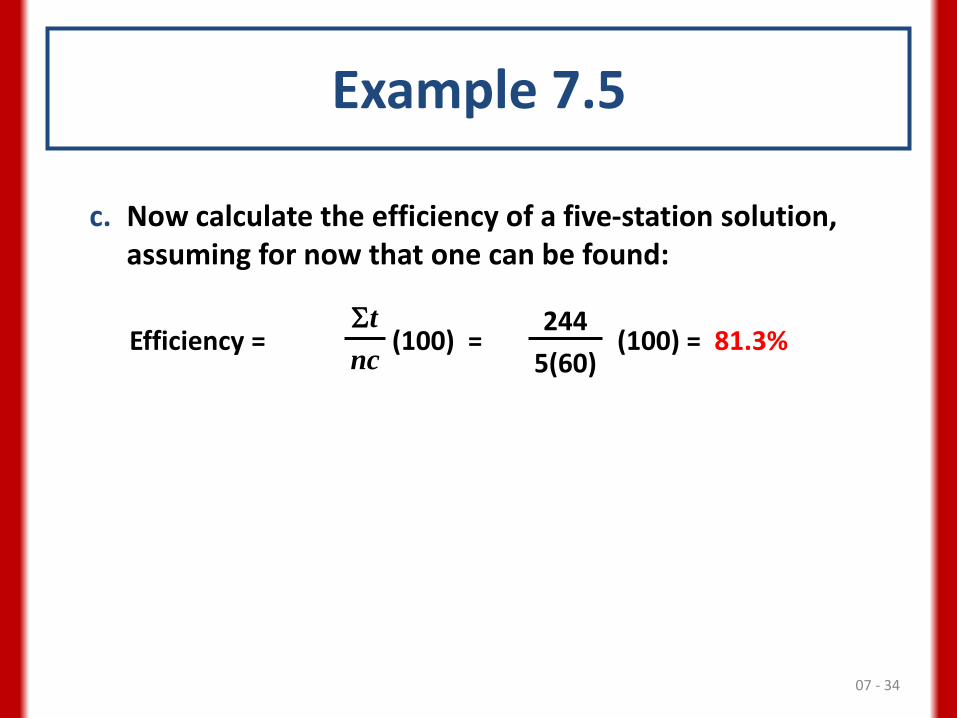
Example 7.5
c. Now calculate the efficiency of a five-station solution, assuming for now that one can be found:
Efficiency = (100) = t
nc
244
5(60) (100) = 81.3%
07 - 34

Finding a Solution
• The goal is to cluster the work elements into workstations so that
1. The number of workstations required is minimized
2. The precedence and cycle-time requirements are not violated
07 - 35

Finding a Solution
07- 36
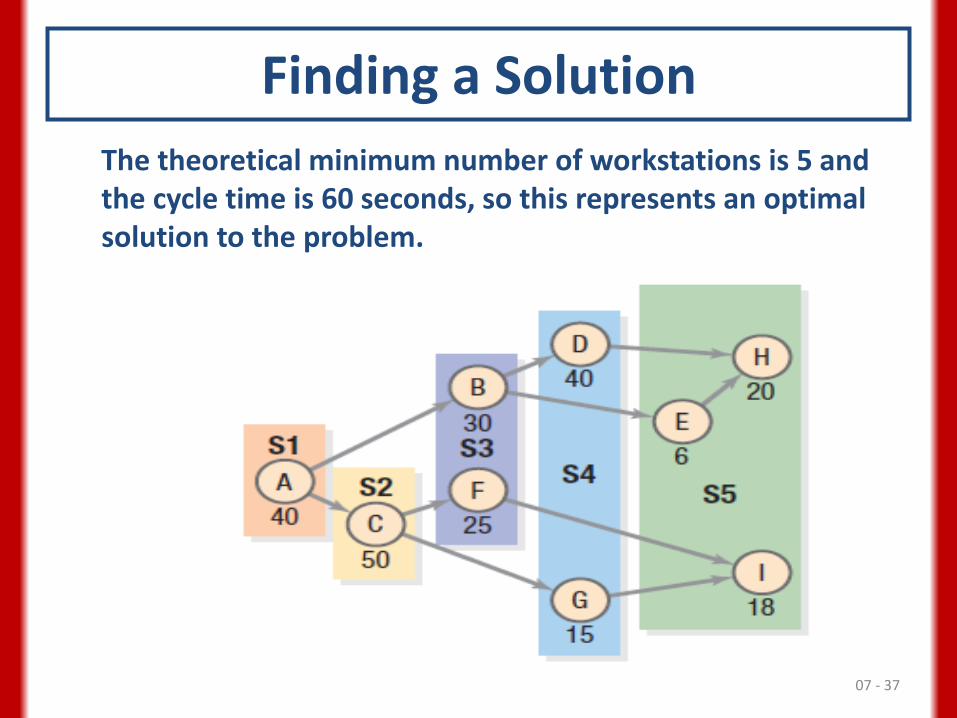
Finding a Solution
The theoretical minimum number of workstations is 5 and the cycle time is 60 seconds, so this represents an optimal solution to the problem.
07 - 37

Application Problem 7.4
A plant manager needs a design for an assembly line to assembly a new product that is being introduced. The time requirements and immediate predecessors for the work elements are as
follows:
Work Element
Time (sec) Immediate
Predecessor
A 12 ―
B 60 A
C 36 ―
D 24 ―
E 38 C, D
F 72 B, E
G 14 ―
H 72 ―
I 35 G, H
J 60 I
K 12 F, J
Total = 435
07 - 38

K
Application Problem 7.4 Draw a precedence diagram, complete I, F, J, and K
Work Element
Time (sec)
Immediate Predecess
or
A 12 ―
B 60 A
C 36 ―
D 24 ―
E 38 C, D
F 72 B, E
G 14 ―
H 72 ―
I 35 G, H
J 60 I
K 12 F, J
Total = 435
F
J
B
E
I
A
C
G
H
D
07 - 39

Application Problem 7.4
If the desired output rate is 30 units per hour, what are the cycle time and theoretical minimum?
c = = 1
r 1
30 (3600) = 120 sec/unit
TM = t
c = = 3.6 or 4 stations
435
120
07 - 40

Application Problem 7.4
Suppose that we are fortunate enough to find a solution with just four stations. What is the idle time per unit, efficiency, and the balance delay for this solution?
Idle time = nc – t
Efficiency (%) = (100) t
nc
Balance delay (%) = 100 – Efficiency
= 4(120) – 435 = 45 seconds
= 100 – 90.6 = 9.4%
= (100) = 90.6% 435
480
07 - 41

Application Problem 7.4
Using trial and error, one possible solution is shown below.
H, C, A 120 0
B, D, G 98 22
E, F 110 10
I, J, K 107 13
A fifth station is not needed
Station
Work Elements Assigned Cumulative Time
Idle Time (c = 120)
1
2
3
4
5
07 - 42

Solved Problem 1
7- 43
Bill’s Car Wash offers two types of washes: Standard and Deluxe. The process flow for both types of customers is shown in the following chart. Both wash types are first processed through steps A1 and A2. The Standard wash then goes through steps A3 and A4 while the Deluxe is processed through steps A5, A6, and A7. Both offerings finish at the drying station (A8). The numbers in parentheses indicate the minutes it takes for that activity to process a customer.
07 - 43

Solved Problem 1 a. Which step is the bottleneck for the Standard car wash
process? For the Deluxe car wash process?
b. What is the capacity (measured as customers served per hour) of Bill’s Car Wash to process Standard and Deluxe customers? Assume that no customers are waiting at step A1, A2, or A8.
c. If 60 percent of the customers are Standard and 40 percent are Deluxe, what is the average capacity of the car wash in customers per hour?
d. Where would you expect Standard wash customers to experience waiting lines, assuming that new customers are always entering the shop and that no Deluxe customers are in the shop? Where would the Deluxe customers have to wait, assuming no Standard customers?
07 - 44
Solved Problem 1
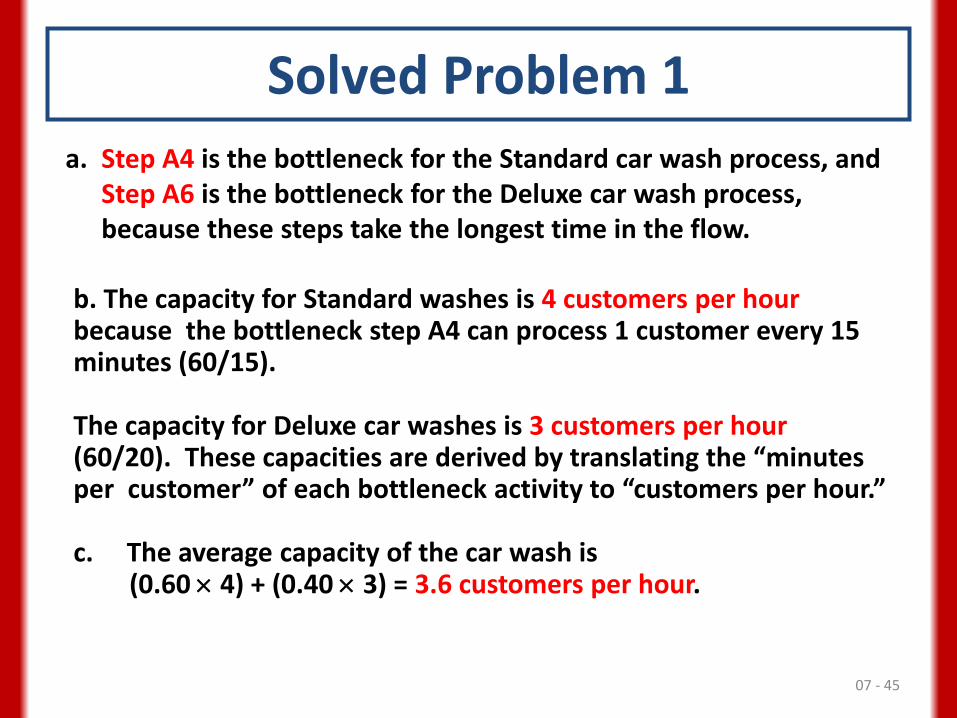
a. Step A4 is the bottleneck for the Standard car wash process, and Step A6 is the bottleneck for the Deluxe car wash process, because these steps take the longest time in the flow.
b. The capacity for Standard washes is 4 customers per hour because the bottleneck step A4 can process 1 customer every 15 minutes (60/15).
The capacity for Deluxe car washes is 3 customers per hour (60/20). These capacities are derived by translating the “minutes per customer” of each bottleneck activity to “customers per hour.”
c. The average capacity of the car wash is (0.60 4) + (0.40 3) = 3.6 customers per hour.
07 - 45

Solved Problem 1
d. Standard wash customers would wait before steps A1, A2, A3, and A4 because the activities that immediately precede them have a higher rate of output (i.e., smaller processing times). Deluxe wash customers would experience a wait in front of steps A1, A2, and A6 for the same reasons. A1 is included for both types of washes because the arrival rate of customers could always exceed the capacity of A1.
07 - 46

Solved Problem 2
A company is setting up an assembly line to produce 192 units per 8-hour shift. The following table identifies the work elements, times, and immediate predecessors:
Work Element Time (sec) Immediate Predecessor(s)
A 40 None
B 80 A
C 30 D, E, F
D 25 B
E 20 B
F 15 B
G 120 A
H 145 G
I 130 H
J 115 C, I
Total 720 07 - 47
Solved Problem 2
a. What is the desired cycle time (in seconds)?
b. What is the theoretical minimum number of stations?
c. Use trial and error to work out a solution, and show your solution on a precedence diagram.
d. What are the efficiency and balance delay of the solution found?
07 - 48
Solved Problem 2
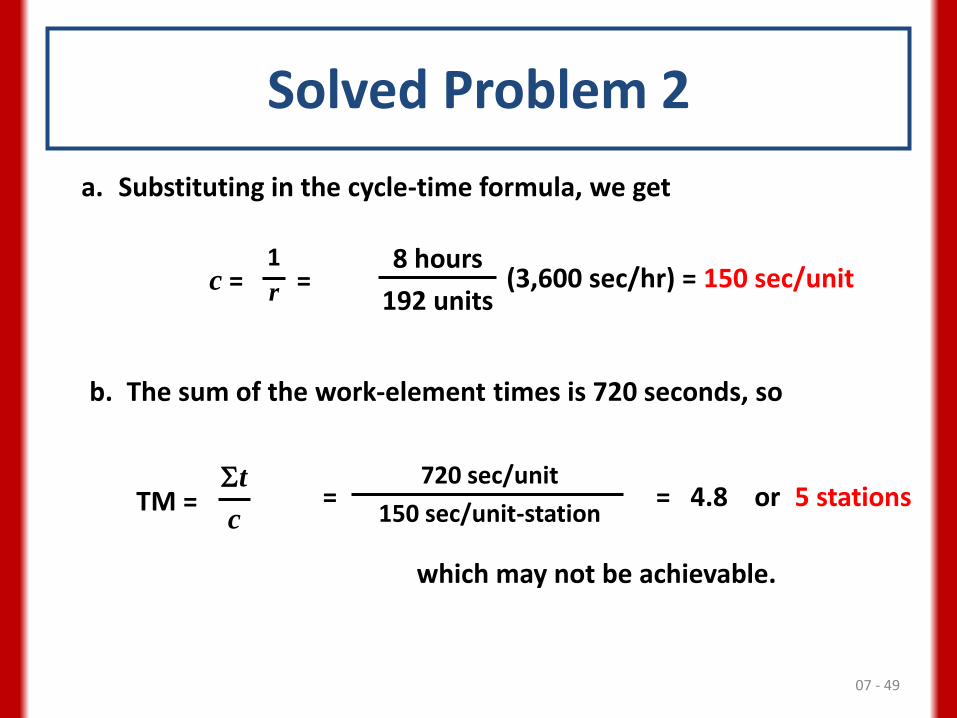
b. The sum of the work-element times is 720 seconds, so
TM = t
c = = 4.8 or 5 stations
720 sec/unit
150 sec/unit-station
which may not be achievable.
07 - 49
a. Substituting in the cycle-time formula, we get
8 hours
192 units (3,600 sec/hr) = 150 sec/unit c = =
1
r

Solved Problem 2
07- 50
Work Element
Immediate Predecessor(s)
A None
B A
C D, E, F
D B
E B
F B
G A
H G
I H
J C, I

Solved Problem 2 J
115
C
30
D
25
E
20
F
15 I
130 H
145
B
80
G
120
A
40
A A 40 40 110
B B 80 120 30
D, E, F D 25 145 5
E, F, G G 120 120 30
E, F E 20 140 10
F, H H 145 145 5
F, I I 130 130 20
F F 15 145 5
C C 30 30 120
J J 115 145 5
Station Candidate(s) Choice Work-Element
Time (sec)
Cumulative
Time (sec)
Idle Time
(c= 150 sec)
S1
S2
S3
S4
S5
07- 51

Solved Problem 2
d. Calculating the efficiency, we get
Thus, the balance delay is only 4 percent (100–96).
Efficiency (%) = (100) t
nc =
720 sec/unit
5(150 sec/unit)
= 96%
07 - 52
(100)