© OECD/IEA - 2008 Opportunities and Challenges in Deploying Renewables into the Mainstream...
13
INTERNATIONAL ENERGY AGENCY © OECD/IEA - 2008 Opportunities and Challenges in Deploying Renewables into the Mainstream demosEUROPA and Danish Embassy Joint Seminar Warsaw, 19 November 2008 Pieter Boot Director, Sustainable Energy Policy and Technology International Energy Agency
-
date post
21-Dec-2015 -
Category
Documents
-
view
213 -
download
0
Transcript of © OECD/IEA - 2008 Opportunities and Challenges in Deploying Renewables into the Mainstream...

INTERNATIONALENERGY AGENCY© OECD/IEA - 2008
Opportunities and Challenges in Deploying
Renewables into the Mainstream
demosEUROPA and Danish Embassy Joint Seminar
Warsaw, 19 November 2008
Pieter Boot
Director, Sustainable Energy Policy and Technology
International Energy Agency

© O
EC
D/IEA
- 2
00
8
2005 Baseline 2030
Baseline 2050
ACT Map 2050
BLUE Map 2050
0
10,000
20,000
30,000
40,000
50,000
60,000 Other re-newables
Solar
Wind
Biomass + CCS
Biomass
Hydro
Nuclear
Gas + CCS
Gas
Oil
Coal + CCS
Coal
Glo
ba
l e
lec
tric
ity
pro
du
cti
on
(T
Wh
)
Global Power Generation MixScenarios
46.5%
Renewables
[Source: ETP 2008]Renewables would have to play a particularly significant role in the power sector, increasing from 18% today to nearly 50% by 2050. Non-hydro renewables show the
highest growth rate.

© O
EC
D/IEA
- 2
00
8
Solar CSP
Solar PV
Wind-offshore
Wind-onshore
Hydro
Nuclear
Gas-fired with CCS
Coal-fired with CCS
0 10 20 30 40 50 60 70
Current capacity additions BLUE Map
35 CCS coal-fired plants (500 MW)
20 CCS gas-fired plant (500 MW)
32 Nuclear plants (1000 MW)
⅕ of Canada's hydropower capacity
14 000 Wind turbines (4 MW)
3 750 Wind turbines (4 MW)
215 km2 solar panels
80 CSP Plants (250 MW)G
lobal nuclear capacity growth in the 1980s
¼ current Chinese coal capacity increase
½ recent gas fired capacity increase in the U
S
GW/year
Average Annual Power Generation Capacity Additions,
2010 – 2050 An Energy Revolution
[Source: ETP 2008]

© O
EC
D/IEA
- 2
00
8Deploying Renewables:Principles for Effective Policies
Launched on 29 September in Berlin
Download Executive Summary at
http://www.iea.org/Textbase/npsum/DeployRenew2008SUM

© O
EC
D/IEA
- 2
00
8
Achieved (by 2005) and Additional realisable mid-term potential (by 2020) for RES-E
Achieved (2005) and additional realisable mid-term (up to 2020) potential for RES-Electricity by country (OECD+BRICS) – in absolute
terms (TWh)
0
500
1000
1500
2000
US
A
Can
ada
Mex
ico
Japa
n
Kor
ea
Aus
tral
ia
New
Zea
land
Icel
and
Nor
way
Sw
itzer
land
Tur
key
Rus
sia
Chi
na
Indi
a
Bra
zil
Sou
th A
fric
a
EU
27
Rea
lisab
le R
ES
-Ele
ctri
city
_ g
ener
atio
n p
ote
nti
al u
p t
o 2
020
[TW
h/y
ear] Additional potential
up to 2020
Achieved potential2005

© O
EC
D/IEA
- 2
00
8
Effectiveness & EfficiencyWind On-shore 2005 (OECD & BRICS)
Source: IEA & Fh-ISI, 2008
Long-term predictable incentives(FIT or FIP)
+Appropriate framework
Higher risk (TGC)+
Non-economic barriers
Eff
ecti
ven
ess
DEU
ESP
IRL
DNK
PRT
NLD
AUT
LUX
JPN
KOR
GRC
ITAGBRIND
BELUSA
AUSSWE
NZL
POLCAN FRAHUNSVKNOR
CHN
CZEBRA CHEFINTURRUS ZAF ISL MEX
-2%
0%
2%
4%
6%
8%
10%
12%
14%
16%
18%
20%
0.00 2.00 4.00 6.00 8.00 10.00 12.00 14.00 16.00 18.00
Eff
ect
ive
ne
ss in
dic
ato
r 20
04
/20
05
Annualised remuneration in [US cent / kWh]
u EU Countries Non EU OECD p BRICS
© O
EC
D/IEA
- 2
00
8
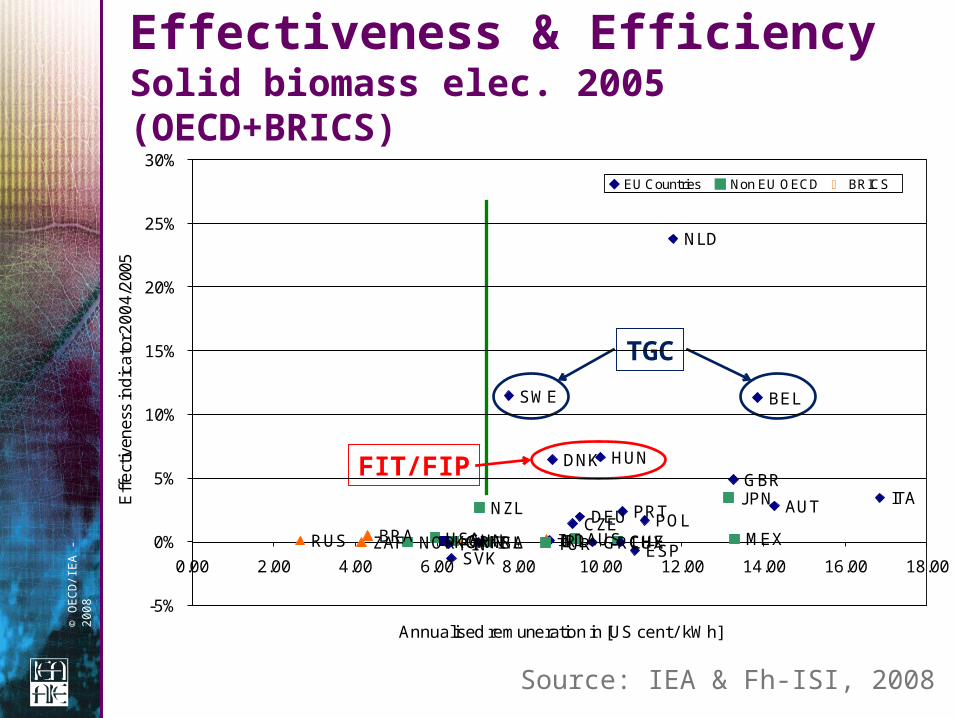
Effectiveness & EfficiencySolid biomass elec. 2005 (OECD+BRICS)
Source: IEA & Fh-ISI, 2008
TGC
FIT/FIP
NLD
SWE
DNK
BEL
GBRHUN
JPNDEU
ITANZL PRTPOL
BRA
AUT
RUSESP
INDCHN AUS MEXUSACAN CHECZE
IRL GRCISL LUXNORSVK
FRAZAF KOR TURFIN
-5%
0%
5%
10%
15%
20%
25%
30%
0.00 2.00 4.00 6.00 8.00 10.00 12.00 14.00 16.00 18.00
Eff
ect
iven
ess
ind
ica
tor 2
00
4/2
005
Annualised remuneration in [US cent / kWh]
u EU Countries Non EU OECD p BRICS

© O
EC
D/IEA
- 2
00
8
Main Lessons Learntand
Conclusions

© O
EC
D/IEA
- 2
00
8
Effective policies only in a limited set of countries Sometimes depending on specific technology
Perceived risk, more than profit, is key to policy effectiveness & efficiency
Price support can not be adequately addressed in isolation; non-economic barriers must be addressed concurrently Grid barriers Administrative barriers Social acceptance issues Other barriers (e.g. training, information, financial, etc.)
Effective systems have, in practice, frequently been the most cost efficient Technology-specific support is key for both effectiveness
and cost-efficiency
Main Lessons Learnt (1)

© O
EC
D/IEA
- 2
00
8Main Lessons Learnt (2)
‘Feed-In Tariff vs. Quota Obligation System/ Tradable Green Certificate’ debate misleading Both systems show success and failures
depending on specific country and technology
Precise design criteria and fine-tuning are key
Signs of convergence: Feed-In Tariff: Premium tariff option, time
digression Quota System/Tradable Green Certificate:
Technology banding

© O
EC
D/IEA
- 2
00
8
1. Remove non-economic barriers to improve market functioning
2. Establish predictable support framework - to attract investments
3. Set up transitional incentives decreasing over time – to foster and monitor technological innovation and move towards market competitiveness
4. Ensure specific support in function of technology maturity to exploit potential of large RET range
5. With increasing mass-scale RET penetration impact on overall energy system must be taken into account
Continuity
Certainty
Key Principles for Effective Renewable Energy Policies

© O
EC
D/IEA
- 2
00
8
Fostering RE’s transition towards mass market integration
Niche markets Mass market
Low cost-gap
(e.g. wind onshore)
High cost-gap
(e.g. PV)
Mature tech
(e.g. hydro)
Prototype & demo stage
(e.g. 2nd gen biofuels)
Time
Mar
ket D
eplo
ymen
t
Development
1. Development
RD&D financing,
capital cost support,
investment tax credits, rebates,
loan guarantees 2. Stable, low-risk, sheltered FIT, FIP, Tenders
3. Shared/imposed market risk, guaranteed minimum but declining
support FIP, TGC (technology banding)
4. Technology-neutral competition TGC, Carbon trading (e.g. EU ETS)

© O
EC
D/IEA
- 2
00
8
1. Realise urgency to implement effective policies to exploit major potential of RETs in terms of energy security and climate change mitigation
2. Remove and overcome non-economic barriers first
3. Exploit substantial potential for improvement of policy effectiveness and efficiency: learn from good practice
4. Focus on rigorous and coherent implementation of key policy design principles with regard to long-term cost efficiency and national circumstances
5. Create level playing field by pricing in GHG emissions and other externalities & removing subsidies for conventional energy
6. Allow a combination framework of incentive schemes in function of technology maturity level
Urgent action for Energy Technology Revolution
Recommendations