Forensic Report Wording and Statistics - Interpreting DNA ... · Forensic Report Wording and...
21
7/5/2016 1 - Interpreting DNA Results - Julie Conover Sikorsky, M.S., F-ABC Forensic Biology Unit Palm Beach County Sheriff’s Office Forensic Report Wording and Statistics East Coast Capital Litigant Initiative: Crime Scene to Courtroom Forensics Training Symposium July 11, 2016 Overview Introduction - background Report Wording – general definitions Statistics – options Conclusions – advice for litigants Standardization between and among Forensic Laboratories Not just a DNA laboratory challenge 2009 NAS Report Recognized significant improvements are needed in forensic science Ensure the reliability of the disciplines Establish enforceable standards Promote best practices and their application
Transcript of Forensic Report Wording and Statistics - Interpreting DNA ... · Forensic Report Wording and...

7/5/2016
1
- Interpreting DNA Results -
Julie Conover Sikorsky, M.S., F-ABCForensic Biology Unit
Palm Beach County Sheriff’s Office
Forensic Report Wording and Statistics
East Coast Capital Litigant Initiative:Crime Scene to Courtroom Forensics Training Symposium
July 11, 2016
Overview
Introduction - background
Report Wording – general definitions
Statistics – options
Conclusions – advice for litigants
Standardization between and among Forensic Laboratories
Not just a DNA laboratory challenge
2009 NAS Report Recognized significant
improvements are needed in forensic science
Ensure the reliability of the disciplines
Establish enforceable standards Promote best practices and
their application

7/5/2016
2
Standardization between and among Forensic Laboratories National Commission on Forensic Science In 2013, the Department of Justice established the National
Commission on Forensic Science in partnership with the National Institute of Standards and Technology to enhance the practice and improve the reliability of forensic science.
This unique partnership draws upon each agency's core strengths to promote scientific validity, reduce fragmentation, and improve federal coordination of forensic science.
https://www.justice.gov/ncfs
Work Products Adopted by the Commission
Standardization between and among Forensic Laboratories
Organization of Scientific Area Committees (OSAC) Created in 2014, part of an initiative by NIST and the Department of
Justice to strengthen forensic science in the United States. The organization is a collaborative body of more than 600 forensic
science practitioners and other experts who represent local, state, and federal agencies; academia; and industry.
NIST has established OSAC to create a sustainable organizational infrastructure that produces consensus documentary standards and guidelines to improve quality and consistency of work in the forensic science community.
http://www.nist.gov/forensics/osac/index.cfm

7/5/2016
3
Standardization between and among Forensic Laboratories: OSAC
Standardization between and among Forensic DNA Laboratories
Biology/DNA Scientific Area Committee (SAC)• Subcommittees
• Biological Methods
• Biological Data Interpretation and Reporting
• Wildlife Forensics
Standardization between and among Forensic DNA Laboratories Scientific Working Group on DNA
Analysis Methods (SWGDAM) Serves as a forum to discuss, share, and evaluate forensic
biology methods, protocols, training, and research to enhance forensic biology services as well as provide recommendations to the FBI Director on Quality Assurance Standards (QAS) for forensic DNA analysis.
Established in 1988 first as TWGDAM (Technical Working Group)
http://www.swgdam.org/

7/5/2016
4
Standardization between and among Forensic DNA Laboratories
SWGDAM Adherence to the FBI’s Quality Assurance Standards (QAS) is
required by Federal law as a condition of a laboratory’s participation in the national DNA Index System.
The Federal DNA Identification Act provides, in pertinent part, “the index described in subsection (a) shall include only information on DNA identification records and DNA analyses that are-- (1) based on analyses performed by or on behalf of a criminal justice agency in accordance with publicly available standards that satisfy or exceed the guidelines for a quality assurance program for DNA analysis, issued by the Director of the Federal Bureau of Investigation under
section 210303;” see 42 U.S.C. ' 14132(b)(1).
Standardization between and among Forensic DNA Laboratories
Then there’s the data…
Challenges in DNA Interpretation

7/5/2016
5
Understanding Results Obtained & Sharing Them
Interpretation
Stats ReportData
Ian Evett on Interpretation“The crucial element that the scientist brings to any case is the interpretation of those observations. This is the heart of forensic science: it is where the scientist adds value to the process.”
Evett, I.W., et al. (2000). The impact of the principles of evidence interpretation on the structure and content of statements. Science & Justice, 40, 233-239.

7/5/2016
6
Data cannot be standardizedChallenges in DNA Interpretation
DNA mixtures have always existed More than one contributor to a DNA profile
> 2 peaks at more than one marker.
Historical Perspective on DNA Mixture Approaches
1991
1996 2000
1992
Evett et al. describe LRs for
mixtures
CPI becomes routine in U.S.
RMNE (CPI) used in paternity testing
DAB Stats (Feb 2000) CPI
and LR okay
1985
Today
2008 NIJ burglary report increases touch
evidence
2006
LR commonly used in Europe and other labs
around the world
NRC I report (p.59) supports CPI
NRC II report (p.130) supports
LR
ISFG DNA Commission
LR over CPI
2012
ISFG DNA CommissionLR with drop-out
1997
Weir et al. describe LRs for
mixtures
2010SWGDAM guidelines
(RMP, CPI, LR)
LR = likelihood ratioCPI = combined probability of inclusionRMNE = random man not excluded
Slide adapted from J. Butler, AAFS2014
Probabilistic Genotyping
Data cannot be standardizedChallenges in DNA Interpretation
Increasing sensitivity of DNA kits over time Now detection of as little as 15pg of DNA vs. 1 ng of DNA,
i.e. 1 ng versus .015ng

7/5/2016
7
Data cannot be standardizedChallenges in DNA Interpretation
Increasing sensitivity of DNA kits over time
• Drop-out occurring, i.e. loss of data
• # of contributors?• Do you have confidence
in the data?
Data cannot be standardizedChallenges in DNA Interpretation
Increasing sensitivity of DNA kits over time
Analytical Threshold (AT)
AT: the minimum height at and above which detected peaks can be reliably distinguished from background noise.
Data cannot be standardizedChallenges in DNA Interpretation
Increasing sensitivity of DNA kits over time
Stochastic Threshold (ST)
ST: the minimum height above which it is reasonable to assume that allelic dropout has not occurred within a single source sample.

7/5/2016
8
Data cannot be standardizedChallenges in DNA Interpretation
Increasing sensitivity of DNA kits over time
?
Analyst Training Challenges in analyst training
Every analyst interprets the same way, every time…in every laboratory
“If you show 10 colleagues a mixture, you will probably end up with 10 different answers”– Peter Gill, Human Identification E-Symposium, April 14, 2005
Why? Different mixture interpretation “guidelines” Different levels of experience Different DNA kits Different instruments Different statistical toolsTherefore there is no concordance in current forensic practice on what constitutes a “correct” mixture solution.

7/5/2016
9
A Complexity/Uncertainty Threshold
New Scientist article (August 2010) How DNA evidence creates victims of chance
18 August 2010 by Linda Geddes
From the last paragraph: In really complex cases, analysts need to be able to draw a
line and say "This is just too complex, I can't make the call on it," says Butler. "Part of the challenge now, is that every lab has that line set at a different place. But the honest thing to do as a scientist is to say: I'm not going to try to get something that won't be reliable."
http://www.newscientist.com/article/mg20727743.300-how-dna-evidence-creates-victims-of-chance.html
Slide adapted from J. Butler, AAFS2014
How low can you go?
Hidden Perpetrator Absence of evidence is not evidence of absence A perpetrator does not always leave a DNA profile at a crime
scene.
How low should you go?
How low can you go?
Confirmation Bias – red herring Discovery of DNA must be significant in relation to a crime Is the DNA profile relevant to the crime event?
How low should you go?

7/5/2016
10
How low can you go?
Innocent transfer The transfer of DNA to an item may have occurred prior to or
have no relation to the crime event Is there an innocent explanation?
How low should you go?
Report Wording
In general, report wording will resemble the following…
“Cannot be excluded” = “Included”: the evidentiary profile is consistent with/ matches the profile from a known individual
What you should expect: A statistic
… unless it’s an intimate item (e.g. vaginal swabs) or there is a reasonable expectation a person’s profile is on an item.
What you don’t expect: The inclusion to change The statistic to change…
7/5/2016
11
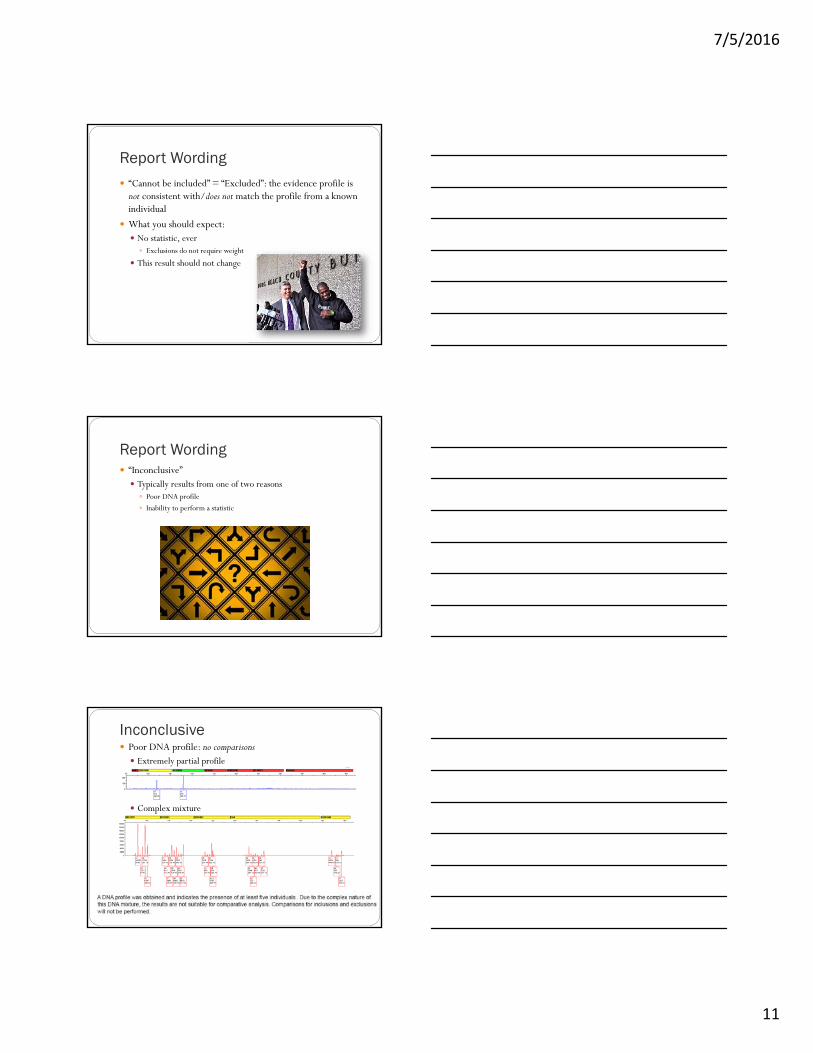
Report Wording “Cannot be included” = “Excluded”: the evidence profile is
not consistent with/does not match the profile from a known individual
What you should expect: No statistic, ever Exclusions do not require weight
This result should not change
Report Wording “Inconclusive” Typically results from one of two reasons Poor DNA profile
Inability to perform a statistic
Inconclusive Poor DNA profile: no comparisons Extremely partial profile
Complex mixture

7/5/2016
12
Inconclusive Cannot perform a statistic Cannot exclude an individual, but statistical “rules” do not allow
for a calculation to be generated To report an inclusion a statistic must be generated
Statistics
“All models are wrong, but some are useful”
- George Box (statistician)
Statistics The purpose of statistics is to give significance/weight to an
inclusion
The weight can be calculated by a variety of approved statistical tools – see NRC II
Statistical tools utilize population databases to determine the frequency (how often) of a piece of DNAappears in the population
NRC II

7/5/2016
13
The ideal (statistical) tool for the job?
RMP Random match probability Product rule
CPE/CPI Combined probability of exclusion/inclusion Random man not excluded
LR Likelihood ratio
RMP The probability of randomly selecting an individual that
would be included in the profile
Single-source profiles
Mixtures Number of contributors necessary Utilizes intensity differences to deduce major/minor profiles
CPE/CPI Mixtures
The probability that an individual randomly picked out of the general population would be excluded/included from matching a given DNA profile
Generally thought to be conservative
No assumption as to the number or identity of contributors
Does not take into account intensity differences within a profile
Requires that all data be present for a given profile

7/5/2016
14
Likelihood Ratios Single source or mixed DNA profiles
Whereas RMP and CPE/CPI generate individual probabilities, LR generates a probability for an entire profile
Number of contributors necessary
Compares two competing scenarios that may explain a DNA profile
Returns how likely the data are under one (or more) scenario than the other
LR – the road to probabilistic genotyping
LR + 2p Semi-Continuous
Fully Continuous
Probabilistic genotyping –Software determines the most probable explanation for the DNA profile
Note: the formula 2p may be incorporated into RMP as well as LR to account for drop out
Probabilistic Genotyping Semi-Continuous – information is determined from the
alleles present – peak heights are not considered.
Fully Continuous – incorporation of biological parameters (peak heights, mixture ratio, stutter percentage, etc…).
A B C
A B C Q
Q
Slide adapted from M. Coble, GRC2016

7/5/2016
15
3:1 Mixture Ratio Slide adapted from M. Coble, GRC2016
The ideal (statistical) tool Not all laboratories have the ideal tool in their toolbox
Why?
Mixture
CPE/CPI LR
Mixture
RMP/CPE
LR
Probabilistic Genotyping

7/5/2016
16
The evolution of statistics in forensics
The way statistical tools are applied to forensic DNA profiles has changed over time…and continues to evolve.
SWGDAM Interpretation Guidelines Approved in January 2010
SWGDAM Interpretation Guidelines Approved in January 2010

7/5/2016
17
SWGDAM Interpretation Guidelines Approved in January 2010
2010 SWGDAM Interpretation Guidelines
In the news…

7/5/2016
18
In the news What do these labs have in common?
Issues with: Low level and/or mixed samples Poor training/understanding of mixture interpretation and
statistics
, 2015
Began in May 2015

7/5/2016
19
Conclusions
1. Know how to read and interpret a laboratory report
Each laboratory is going to be different
Until there is standardization across forensics there will be variation in how inclusions and exclusions are reported.
Know which statistical tools your DNA laboratory uses and their limitations

7/5/2016
20
2. Communication with the laboratory If they are using a LR, what hypotheses were used Do they account for your explanation of the evidence? Are they fair?
Find out why a sample was inconclusive If it is because a statistic cannot be conducted by the lab can the
profile be outsourced for additional analysis?
3. Understand your samples
DNA is circumstantial; it is rarely a silver bullet
Be careful not to give DNA profiles more weight than they deserve Hidden perpetrator Uncertainty of association with a crime event Confirmation bias
Innocent transfer
Low level mixed samples vs. high level single source samples

7/5/2016
21
Bibliography National Commission on Forensic Science:
https://www.justice.gov/ncfs Organization of Scientific Area committees (OSAC):
http://www.nist.gov/forensics/osac/index.cfm Scientific Working Group on DNA Analysis Methods (SWGDAM):
http://www.swgdam.org/ Misleading DNA Evidence: Reasons for Miscarriages of Justice (Elsevier
2014) by Peter Gill NRC II: The Evaluation of Forensic DNA Evidence, National Research
council (US) Committee on DNA Forensic Science: An Update, 1996 DNA for the Defense Bar, NIJ publication, June 2012:
https://www.ncjrs.gov/pdffiles1/nij/237975.pdf