Effect of Strain Rate and Strain Softening on …...1 Effect of Strain Rate and Strain Softening on...
54
Effect of Strain Rate and Strain Softening on Embedment Depth of a 1 Torpedo Anchor in Clay 2 3 Y. Kim 1 , M. S. Hossain 2 and D. Wang 3 4 5 1 Research Associate (PhD), Centre for Offshore Foundation Systems (COFS), The University 6 of Western Australia, Tel: +61 8 6488 4316, Fax: +61 8 6488 1044, Email: 7 [email protected] 8 2 Corresponding Author, Associate Professor (BEng, MEng, PhD, MIEAust), ARC DECRA 9 Fellow, Centre for Offshore Foundation Systems (COFS), The University of Western 10 Australia, 35 Stirling highway, Crawley, WA 6009, Tel: +61 8 6488 7358, Fax: +61 8 6488 11 1044, Email: [email protected] 12 3 Associate Professor (PhD), Centre for Offshore Foundation Systems (COFS), The University 13 of Western Australia, Tel: +61 8 6488 3447, Fax: +61 8 6488 1044, Email: 14 [email protected] 15 16 Number of Words: 5462 (text only) 17 Number of Tables: 01 18 Number of Figures: 12 19
Transcript of Effect of Strain Rate and Strain Softening on …...1 Effect of Strain Rate and Strain Softening on...

Effect of Strain Rate and Strain Softening on Embedment Depth of a 1
Torpedo Anchor in Clay 2
3
Y. Kim1, M. S. Hossain2 and D. Wang3 4
5
1Research Associate (PhD), Centre for Offshore Foundation Systems (COFS), The University 6
of Western Australia, Tel: +61 8 6488 4316, Fax: +61 8 6488 1044, Email: 7
2Corresponding Author, Associate Professor (BEng, MEng, PhD, MIEAust), ARC DECRA 9
Fellow, Centre for Offshore Foundation Systems (COFS), The University of Western 10
Australia, 35 Stirling highway, Crawley, WA 6009, Tel: +61 8 6488 7358, Fax: +61 8 6488 11
1044, Email: [email protected] 12
3Associate Professor (PhD), Centre for Offshore Foundation Systems (COFS), The University 13
of Western Australia, Tel: +61 8 6488 3447, Fax: +61 8 6488 1044, Email: 14
16
Number of Words: 5462 (text only) 17
Number of Tables: 01 18
Number of Figures: 12 19

1
Effect of Strain Rate and Strain Softening on Embedment Depth of a 20
Torpedo Anchor in Clay 21
22
Abstract: Torpedo anchors (of diameter ~1 m) are released from a height of 50~100 m from 23
the seabed, achieving velocities up to 35 m/s at impacting the sediment. The strain rates 24
induced in the surrounding soil by this dynamic installation is therefore significantly higher 25
than those associated with installation of other offshore foundations and anchoring systems. 26
The high strain rates enhance the mobilised undrained shear strength compared to that 27
measured by in-situ penetrometer or laboratory tests. This paper reports the results from 28
dynamic installation of a torpedo anchor in strain softening, rate dependent soft clays, 29
quantifying the effects relative to results for ideal Tresca material. The three-dimensional 30
dynamic large deformation finite element (LDFE) analyses were carried out using the coupled 31
Eulerian-Lagrangian approach. The simple elastic-perfectly plastic Tresca soil model was 32
modified to allow strain softening and strain rate dependency of the shear strength. Parametric 33
analyses were undertaken varying the strain rate parameter, the sensitivity and ductility of the 34
soil, and the soil undrained shear strength. Overall, embedment depth for rate dependent, 35
strain softening clays lay below that for ideal Tresca material. Increased strain rate 36
dependency of the soil led to marked reduction in embedment depth, only partly compensated 37
by brittleness. Key results have been presented in the form of design charts, fitted by simple 38
expressions to estimate the embedment depth of a torpedo anchor. 39
KEYWORDS: torpedo anchors; clay sensitivity; strain rate dependency; dynamic installation; 40
embedment depth; numerical modelling 41

2
Nomenclature 42
AA anchor shaft cross-section area 43
AbF fins projected area 44
Ap anchor shaft and fins projected area 45
As total surface area of anchor 46
AsA embedded anchor shaft surface area 47
AsF embedded fin surface area 48
Cd drag coefficient 49
DA anchor shaft diameter 50
Dp anchor projected area equivalent diameter (including fins) 51
de,t installed anchor tip embedment depth 52
dt anchor tip penetration depth 53
Etotal total energy during anchor penetration 54
Fb end bearing resistance 55
Fb,bA end bearing resistance at base of anchor shaft 56
Fb,bF end bearing resistance at base of anchor fins 57
Fd inertial drag resistance 58
Ff frictional resistance 59

3
FfA frictional resistance along shaft 60
FfF frictional resistance along fins 61
F buoyant weight of soil displaced by anchor (calculated using effective unit weight of 62
soil) 63
g earth’s gravitational acceleration 64
k shear strength gradient with depth 65
LA anchor shaft length 66
LF fin length 67
LT anchor shaft tip length 68
m anchor mass 69
m anchor effective mass 70
Nc,bA anchor tip bearing capacity factor 71
Nc,bF fin bearing capacity factor 72
n factor relating operative shear strain rate to normalised velocity 73
Ra average strain rate coefficient for embedment prediction 74
Rb average strain rate coefficient for energy method 75
Rf1 factor related to effect of strain rate and softening for end bearing resistance 76
Rf2 factor related to effect of strain rate and softening for frictional resistance 77

4
St soil sensitivity 78
su undrained shear strength 79
su,bA undrained shear strength at bottom of anchor shaft 80
su,bF undrained shear strength at bottom of fins 81
su,ref reference undrained shear strength 82
su,sA average undrained shear strength over embedded length of shaft 83
su,sF average undrained shear strength over embedded length of fin 84
su,tip undrained shear strength at anchor tip level 85
sum undisturbed soil strength at mudline 86
sum,ref reference undisturbed soil strength at mudline 87
t time after anchor tip impacting seabed 88
tF fin thickness 89
v anchor penetration velocity 90
vi anchor impact velocity 91
wF fin width 92
Wd anchor dry weight 93
Ws anchor submerged weight in water 94
z depth below soil surface 95

5
interface friction ratio 96
shear-thinning index 97
tip anchor tip angle 98
t incremental time 99
1 cumulative major principal strain 100
3 cumulative minor principal strain 101
rem fully remoulded ratio 102
' effective unit weight of soil 103
refγ reference shear strain rate 104
γ shear strain rate 105
viscous property 106
c Coulomb friction coefficient 107
0 pullout angle at mudline 108
a pullout angle at padeye 109
s submerged soil density 110
max limiting shear strength at soil-anchor interface 111
cumulative plastic shear strain 112

6
a average cumulative plastic shear strain for embedment prediction 113
b average cumulative plastic shear strain for energy method 114
95 cumulative plastic shear strain required for 95% remoulding 115

7
Introduction 116
Dynamically installed anchors (DIAs) are the most recent generation of anchoring systems for 117
mooring floating facilities in deep waters. They have been identified as one of the most cost-118
effective and promising concepts for future oil and gas development in the emerging frontiers. 119
The anchor is released from a designed height above the seabed. This allows the anchor to 120
gain velocity as it falls freely through the water column before impacting and embedding 121
within the sediments. 122
The most commonly used DIAs are rocket-shaped, referred to as torpedo anchors, typically 123
12~17 m long and 0.8~1.2 m in diameter, with a dry weight (Wd) of 230~1150 kN, and may 124
feature up to 4 fins at the trailing edge (see Figure 1; Brandão et al. 2006). They are released 125
from a height of 50~100 m from the seabed, achieving velocities up to 35 m/s. Challenges 126
associated with dynamically penetrating anchors include prediction of the anchor embedment 127
depth and the subsequent capacity. The former is complicated by the very high strain rate 128
(exceeding 25 s-1) at the soil anchor interface, resulting from the high penetration velocities. 129
There is general agreement that the undrained strength increases with increasing shear strain 130
rate (e.g. Biscontin and Pestana 2001; DeGroot et al. 2007; Lunne and Andersen 2007; 131
Dejong et al. 2012). Furthermore, natural soils also undergo softening as they are sheared and 132
remoulded, with typical sensitivity values ranging from 2 to 5 for marine clays and 2 to 2.8 133
for reconstituted kaolin clay used widely in centrifuge tests (Kvalstad et al. 2001; Andersen 134
and Jostad 2004; Randolph 2004; Menzies and Roper 2008; Lunne et al. 2011; Gaudin et al. 135
2014). 136
The paper is a continuation of one that presents results from a parametric study: exploring the 137
relevant range of parameters in terms of anchor length; diameter; tip angle; number, width 138
and length of fins; impact velocity and soil undrained shear strength (Kim et al. 2015). In that 139

8
paper, large deformation finite element (LDFE) analyses were carried out, accounting for the 140
effect of strain rate and softening, but corresponding to a particular (kaolin) clay. In this 141
study, the reverse was undertaken i.e. a typical torpedo anchor geometry and impact velocity 142
were considered and parametric analyses were performed varying the soil sensitivity, 143
brittleness and strain rate properties. The influence of these parameters on the proposed 144
design expressions for anchor embedment depth was quantified. Analyses were also 145
conducted simulating ideal Tresca, i.e. rate independent and non-softening, material for 146
comparison. 147
Extensive background information to installation of torpedo anchors can be found in Hossain 148
et al. (2014, 2015) and Kim et al. (2015), which are not repeated here. For convenience, 149
Figures 1 and 2 from Kim et al. (2015) are used here, showing a typical anchor geometry 150
defining the nomenclature adopted for the problem and typical mesh details respectively. 151
152
Numerical Analysis 153
Geometry and Parameters 154
This study has considered a torpedo anchor, consisting of a circular shaft attached with 4 155
rectangular fins, penetrating dynamically into a soft non-homogeneous clay deposit as 156
illustrated schematically in Figure 1, where the mudline strength sum, increases linearly with 157
depth z, with a gradient k. The soil average effective unit weight is . The anchor shaft 158
diameter is DA of 1.07 m, shaft length LA of 17 m (including tip length, LT), fin length LF of 159
10 m (= LF1 + LF2 + LF3) and fin width wF of 0.9 m. Analyses were undertaken for anchors 160
with a 30 conical tip (tip = 30). The shape was chosen similar to the T-98 anchor in the 161
field, as illustrated by Medeiros (2002), de Araujo et al. (2004) and Brandão et al. (2006). 162

9
Analysis Details 163
3D LDFE analyses were carried out using the coupled Eulerian-Lagrangian (CEL) approach 164
in the commercial package ABAQUS/Explicit (Dassault 2011). To reduce the computational 165
effort, the anchor dynamic installation was modelled from the soil surface, with a given 166
velocity vi. 167
Considering the symmetry of the problem, only a quarter anchor and soil were modelled. The 168
radius and height of the soil domain were 40DA (~32Dp for 4-fin anchor) and ~8LA, 169
respectively, to ensure that the soil extensions are sufficiently large to avoid boundary effect 170
in dynamic analyses. A very fine soil mesh was necessary to capture the anchor-soil contact 171
accurately. Based on the mesh convergence studies from Kim et al. (2015), the typical soil 172
element size along the trajectory of the anchor is adopted as 0.019DA. A typical mesh is 173
shown in Figure 2. The mesh comprised 8-noded linear brick elements with reduced 174
integration, and a fine mesh zone is generated to accommodate the anchor trajectory during 175
the entire installation. A 5 m thick void (i.e. material free) layer was set above the soil surface 176
(see Figure 2c), allowing the soil to heave by flowing into the empty Eulerian elements during 177
the penetration process. The anchor was simplified as a rigid body. 178
The installation of torpedo anchors in clay is completed under nearly undrained conditions. 179
The soil was thus modelled as an elasto-perfectly plastic material obeying a Tresca yield 180
criterion, but extended as described later to capture strain rate and strain softening effects. A 181
user subroutine of Abaqus was coded to track the evolving soil undrained shear strength 182
profile. The elastic behaviour was defined by a Poisson’s ratio of 0.49 and Young’s modulus 183
of 500su throughout the soil profile (where su represents the current undrained strength of 184
clay). A uniform submerged unit weight of 6 kN/m3 was adopted over the soil depth, 185
representing a typical average value for field conditions. 186

10
The soil-anchor interface was modelled as frictional contact, using a general contact algorithm 187
and specifying a Coulomb friction law together with a limiting shear stress (max) along the 188
anchor-soil interface. The Coulomb friction coefficient was deliberated set to a high value of 189
C = 50, in order to allow the value of max to govern failure. Within the CEL, the value of the 190
limiting interface friction must be set prior to the analysis, before the value of the ‘adjacent’ 191
soil strength is known. To overcome this difficulty, for each case, the limiting interface 192
friction was determined by: (1) simulating anchor penetration with frictionless contact; (2) 193
obtaining the final anchor tip penetration depth and calculating su,ref at that depth; and (3) 194
setting max equal to an interface friction ratio, times the calculated su,ref at the final tip 195
depth (from frictionless contact), with taken as the inverse soil sensitivity, 1/St. Due to the 196
limitation of the current CEL approach, max is a constant value along the anchor surfaces 197
during the entire calculation. At shallow depth, where max may exceed the rate dependent 198
shear strength of the adjacent soil, failure may occur at the nearest integration points, rather 199
than at the interface. The contact interface is created between Lagrangian mesh and Eulerian 200
material, and automatically computed and tracked during the analysis. 201
Incorporation of Combined Effects of Strain Rate and Strain Softening 202
For this high velocity problem, a Herschel-Bulkley rheological model (H-B, Herschel and 203
Bulkley 1926) is considered to be superior to the semi-logarithmic rate law for simulating 204
geotechnical problems involving high strain rate (Raie and Tassoulas 2009; Zhu and 205
Randolph 2011; Boukpeti et al. 2012). Except for the rate dependency, the softening induced 206
by accumulated plastic strains is involved. The undrained shear strength at individual Gauss 207
points was modified immediately after each step, according to the average rate of maximum 208
shear strain in the previous time step and the current accumulated absolute plastic shear strain, 209
as 210

11
η)(1
s eδ1δ
γ
γη1s refu,/ξ3
remrem
β
refu
95
ξ
(1) 211
where su,ref is the shear strength at the reference shear strain rate of refγ . The first bracketed 212
term of Equation 1 augments the strength according to the operative shear strain rate, γ , 213
relative to a reference value, refγ , which is typically around 10-5 s-1 for laboratory element 214
tests and up to ~0.5 s-1 for field penetrometer testing (although in the latter case the high strain 215
rate is partly compensated for by strain softening). Ideally, the shear strength should be 216
deduced from a reference strain rate, refγ , that is relatively close (within 2 to 3 orders of 217
magnitude) to that relevant for the application. The parameter is a viscous property and 218
the shear-thinning index. Boukpeti et al. (2012) carried out a series of undrained shear 219
strength measurements on two different (kaolin and Burswood) clays from fall cone tests, 220
vane shear, T-bar and ball penetrometer tests. They reported typical values of and in the 221
range of 0.1 ~ 2.0 and 0.05 ~ 0.15, respectively, using refγ = 0.06 s-1. O’Loughlin et al. 222
(2013) and Chow et al. (2014) used refγ = 0.17 s-1 and 0.1 s-1 for analysing centrifuge test 223
data form installation of torpedo anchors and a dynamic cone penetrometer, respectively, in 224
kaolin clay. Based on these, here a value of refγ = 0.1 s-1 was adopted, and rate parameters 225
were varied as = 0.1 ~ 1.5 and 0.05 ~ 0.2. The shear strain rate, γ , within the soil was 226
evaluated according to 227
Δt
ΔεΔεγ 31 (2) 228
where 1 and 3 are the cumulative major and minor principal strains, respectively, over the 229
incremental time, t. 230

12
The second part of Equation 1 models the degradation of strength according to an exponential 231
function of cumulative plastic shear strain, , from the intact condition to a fully remoulded 232
ratio, rem (the inverse of the sensitivity, St). The relative ductility is controlled by the 233
parameter, 95, which represents the cumulative shear strain required for 95% remoulding. 234
Typical values of 95 have been estimated as around 10 ~ 30 (i.e. 1,000~3,000% shear strain; 235
Randolph 2004; Zhou and Randolph 2009). 236
The range of parameters considered is summarised in Table 1, encompassing most cases of 237
practical interest. The base-case parameters were taken as refγ = 0.1 s-1 and vi = 20 m/s. 238
239
Effects Evaluation and Discussion 240
Details of failure mechanisms and penetration trends associated with different torpedo anchor 241
configurations have been documented by Kim et al. (2015). Results in the following sections 242
will focus mainly on the effect of parameters pertinent to strain rate and strain softening 243
leading to development of quantitative design charts in relation to the results for ideal Tresca 244
material. 245
Effect on Failure Mechanisms 246
Figure 3a shows the anchor penetration depth, as a function of time, in a soil with su,ref = 5 + 247
2z kPa (kDA/sum,ref = 0.43, sum,ref/DA = 0.78; Table 1). Three profiles correspond to (i) the 248
ideal rate independent ( = 0), non-softening soil (rem = 1), (ii) rate dependent, strain 249
softening soil (95 = 20, refγ = 0.1 s-1, rem = 0.33), and (iii) rate dependent, 250
non-softening soil (95 = 20, refγ = 0.1 s-1, rem = 1). The soil failure 251
mechanisms and velocity profiles corresponding to (i) and (ii) are shown in Figure 3b. Clearly, 252

13
the anchor penetration profile and corresponding soil failure mechanisms can be divided into 253
two stages. Stage 1 corresponds to shallow penetration where the anchor accelerates although 254
it advances into the soil. The soil resistance was less than the submerged weight of the anchor. 255
The combined effect of various soil parameters in terms of rate dependency and strain 256
softening (, rem, 95) is minimal on the depth of stage 1. This is, at least partly, due to 257
separation of the shaft and fins from the adjacent soils at the sharp transition zones between 258
the anchor tip and shaft and shaft and fins (Figure 3c), and corresponding reduction in 259
frictional resistances. 260
In Stage 2, as soil strength increases with depth, the anchor penetration resistance (frictional 261
plus end bearing) overcome the submerged weight, negated by the buoyancy force, of the 262
anchor and the anchor decelerates. This leads to a reduction of the extent of soil deformation 263
at the tip and the base of the anchor shaft and fins (e.g. at t = 0.9 s; see Figure 3b). Finally, the 264
soil movement nearly diminishes with the anchor achieving its final embedment depth i.e. 265
coming to the rest. The penetration velocity for rate dependent and strength-softened soil 266
decreases faster compared to that for ideal Tresca material, leading to an increasingly lower 267
penetration depth. This is caused by the enhancement of the local shear strength (cross-268
coupling between the effects of strain rate and strain softening) and hence frictional and 269
bearing resistances. The final embedment depth for the rate dependent, strain softening soil is 270
lower than that for ideal Tresca material. This also confirms that rate dependency and 271
softening have influence on deep penetration. 272
Effect on Embedment Depth 273
The embedment depth of a torpedo anchor on non-homogeneous clays is affected by a 274
number of factors: (a) the strain rate parameters ( and ); (b) the strain softening parameter 275
(95); (c) the remoulded ratio (rem) and the soil sensitivity (St); (d) the reference strain rate 276

14
and ( refγ ); (e) the impact velocity (vi); and (f) the clay strength (su,ref). The results are 277
discussed below in relation to these various factors. In all the embedment depth curves, the 278
anchor penetration is plotted relative to the depth of the anchor tip below the original ground 279
surface. The computational parameters were adopted in the CEL analyses (e.g. the soil 280
element size along the trajectory of the anchor of 0.019DA) based on the results of the 281
convergence studies reported by Kim et al. (2015). 282
Effect of Rate Parameters ( and ) 283
The rate parameters, and , were varied between 0 and 1.5 and 0.05 and 0.2 respectively. 284
The effect on the embedment depth for upper (and), intermediate 285
(and) and lower bound (and) combinations of rate 286
parameters are plotted in Figure 4 for ductility parameter of 95 = 20 (all the results will be 287
discussed later). The result for ideal rate independent, non-softening soil is also included for 288
comparison. Overall, the embedment depth reduces with increasing viscous property () and 289
shear-thinning index (), indicating the effect of enhancing undrained shear strength. 290
Interestingly, it is apparent that for high rate dependency, and, the effect of 291
strain softening is small and the curve lies above the one for ideal Tresca material. However, 292
as the rate dependency becomes lower, the influence of softening becomes more marked, and 293
the curve lies below the one for ideal Tresca material. For instance, for vi = 20 m/s, 95 = 20 294
and rem = 0.33 (see Figure 4), the highest embedment depth de,t = 33.06 m was for = 0.1 295
and = 0.05, which is about 2.6% higher than that for ideal Tresca material. This gap reduces 296
gradually and finally the lowest embedment depth of de,t = 30.4 m was for = 1.5 and = 0.2, 297
which is about 5.6% lower than that for ideal Tresca material. 298
299

15
Effect of Strain softening Parameter (95) 300
In order to show the effect of soil ductility, time-penetration profiles are shown in Figure 5 for 301
95 = 20 and 30 (vi = 20 m/s, rem = 0.33, refγ = 0.1 /s, kDA/sum,ref = 0.43, 302
sum,ref/DA = 0.78; Table 1). The result for non-softening soil is included in the figure for 303
comparison. It is seen that the influence of soil brittleness on embedment is minimal and 304
increases slightly with decreasing strain softening parameter, 95 (i.e. increasing brittleness). 305
For instance, for vi = 20 m/s in Figure 5, the embedment depth de,t increases from 31.88 to 306
32.16 m (i.e. 0.8%) as 95 reduces from 30 to 20. 307
Effect of Soil Sensitivity (St) 308
Typical sensitivity values for marine clays may range from 2 to 5 (Kvalstad et al. 2001; 309
Andersen and Jostad 2004; Randolph 2004; Menzies and Roper 2008; Lunne et al. 2011; 310
Gaudin et al. 2014). The effect of soil sensitivity, and hence remoulded strength ratio, rem, 311
was explored varying rem from 0.2 to 0.5. The results are shown in Figure 6 with = 1.0 and 312
1.5, = 0.1 and 0.2, 95 = 20, refγ = 0.1 s-1 (kDA/sum,ref = 0.43 and sum,ref/DA = 0.78; Table 1). 313
As expected, the embedment depth increases with increasing soil sensitivity (St). For instance, 314
for = 1.0 and = 0.1, the highest embedment depth, de,t = 32.39 m for St = 5, which is about 315
2 % higher than that for St = 2. Similar difference can be quantified for higher rate parameters 316
( = 1.5, = 0.2). 317
Combined Effects of Strain Rate, Strain Softening, and Soil Sensitivity 318
In order to develop a design chart for estimating the embedment depth, the relationships 319
between strain rate and strength-softening were identified from all the anchor penetration 320
analyses tabulated in Table 1. It was found that the final embedment depth of anchor was 321

16
approximately inverse proportional to the strain rate parameters ( and ) and the strain 322
softening parameters (rem and95). 323
From the parametric study encompassing a range of relevant values of = 0~1.5, 324
95 = 20~30, and rem = 0.2~0.5 (see Table 1), it is attempted to develop an 325
approximate expression for anchor embedment depth, de,t, accounting for the combined 326
effects of strain rate and strain softening. The results for soil with su,ref = 5 + 2z kPa 327
(kDA/sum,ref = 0.43, sum,ref/DA = 0.78) are presented in Figures 7a~7d with the normalised 328
embedment depth, de,t/Dp, plotted against viscosity property for different and95. Values 329
for strain-softened clay follow the similar trend, but lie well below the curve for non-330
softening clay, reflecting the reduction in average strength ratio within the failure mechanism, 331
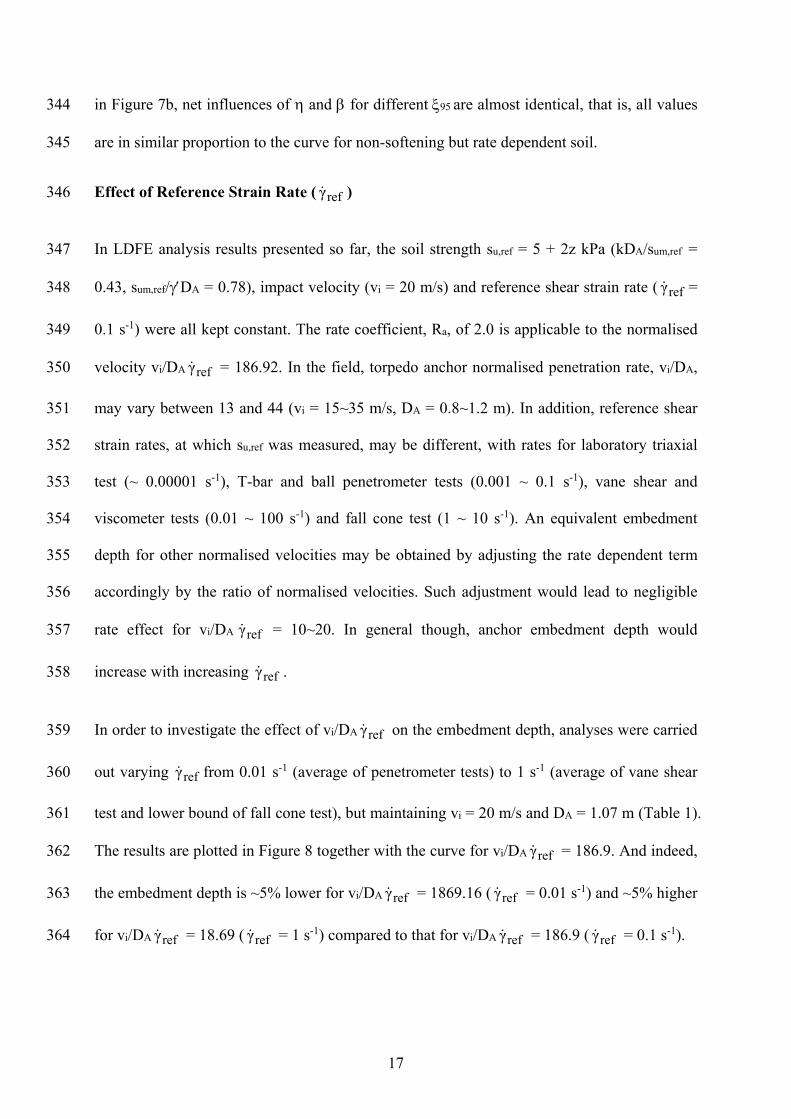
which increases final anchor embedment. 332
A convenient expression for estimating the normalised embedment depth, de,t/Dp, in rate 333
dependent and strain-softened clay is expressed as 334
idealp
te,
ξ3ξremrem
βap
te,
D
d
])eδ(1][δ)η(R[1
η1
D
d95a
/ (3) 335
where (de,t/Dp)ideal is the value of de,t/Dp obtained for an ideal rate independent, non-softening 336
Tresca material. This expression is calibrated with results from LDFE analyses in Figure 7 for 337
rem = 0.33 (a sensitivity of 3) and vi = 20 m/s. Although there is some cross-coupling 338
between the effects of strain rate and strain softening, the multiplicative factors given in 339
Equation 3 appear sufficiently accurate taking Ra = 2.0 and a = 0.35. The value of a 340
represents an average cumulative shear strain experienced by soil particles as they traverse the 341
flow mechanism around the anchor. The value of rate coefficient Ra reflects the higher 342
average shear strain rate in the flow mechanism compared with the reference value. As shown 343
17
in Figure 7b, net influences of and for different95 are almost identical, that is, all values 344
are in similar proportion to the curve for non-softening but rate dependent soil. 345
Effect of Reference Strain Rate ( refγ ) 346
In LDFE analysis results presented so far, the soil strength su,ref = 5 + 2z kPa (kDA/sum,ref = 347
0.43, sum,ref/DA = 0.78), impact velocity (vi = 20 m/s) and reference shear strain rate ( refγ = 348
0.1 s-1) were all kept constant. The rate coefficient, Ra, of 2.0 is applicable to the normalised 349
velocity vi/DA refγ = 186.92. In the field, torpedo anchor normalised penetration rate, vi/DA, 350
may vary between 13 and 44 (vi = 15~35 m/s, DA = 0.8~1.2 m). In addition, reference shear 351
strain rates, at which su,ref was measured, may be different, with rates for laboratory triaxial 352
test (~ 0.00001 s-1), T-bar and ball penetrometer tests (0.001 ~ 0.1 s-1), vane shear and 353
viscometer tests (0.01 ~ 100 s-1) and fall cone test (1 ~ 10 s-1). An equivalent embedment 354
depth for other normalised velocities may be obtained by adjusting the rate dependent term 355
accordingly by the ratio of normalised velocities. Such adjustment would lead to negligible 356
rate effect for vi/DA refγ = 10~20. In general though, anchor embedment depth would 357
increase with increasing refγ . 358
In order to investigate the effect of vi/DA refγ on the embedment depth, analyses were carried 359
out varying refγ from 0.01 s-1 (average of penetrometer tests) to 1 s-1 (average of vane shear 360
test and lower bound of fall cone test), but maintaining vi = 20 m/s and DA = 1.07 m (Table 1). 361
The results are plotted in Figure 8 together with the curve for vi/DA refγ = 186.9. And indeed, 362
the embedment depth is ~5% lower for vi/DA refγ = 1869.16 ( refγ = 0.01 s-1) and ~5% higher 363
for vi/DA refγ = 18.69 ( refγ = 1 s-1) compared to that for vi/DA refγ = 186.9 ( refγ = 0.1 s-1). 364

18
Reference shear strain rate refγ is directly linked to su,ref. Parametric analyses are carried out 365
isolating parameters. The effect of refγ is highlighted in this section, with the effect of 366
reference shear strength (and vi) discussed in the following sections. This systematic 367
investigation is consistent with the ones undertaken by e.g. Hossain and Randolph (2009) for 368
spudcan foundations. 369
Effect of Impact Velocity (vi) 370
Additionally, to show the effect of impact velocity (vi), time-penetration profiles are presented 371
in Figures 9a and 9b for varying vi (15 ~ 30 m/s) and rate parameters, but keeping other 372
parameters as constant (95 = 20 rem = 0.33, refγ = 0.1 s-1, kDA/sum,ref = 0.43, sum,ref/DA = 373
0.78; Table 1). From Figure 9, the net increase in velocity at shallow embedment (Stage 1) is 374
seen to reduce as the impact velocity increases. This is to be expected as the closer the impact 375
velocities approach the anchor’s terminal velocity, the less acceleration will occur within the 376
soil. The anchor penetration depth at which the anchor begins to decelerate is also seen to be 377
reduced with increasing impact velocity (see Figure 9b). A consistent trend was reported by 378
O’Loughlin et al. (2013) analysing centrifuge model test data. 379
Overall, the embedment depth increases significantly with increasing impact velocity. 380
Interestingly, the influencing ratio of strain rate and softening on the embedment depth is 381
similar despite different impact velocities. For instance, for vi = 15 m/s in Figure 9, the 382
highest embedment depth de,t = 30.01 m was for = 0.1, = 0.05, 95 = 20 and rem = 0.33 383
which is about 8.1 % higher than that for = 1.5, = 0.15 and rem = 1. This gap remains 384
somewhat constant (~8.0%) as the impact velocity increases from 20 m/s to 30 m/s. 385
386

19
Effect of Reference Shear Strength su,ref or Soil Strength Non-homogeneity (kDA/sum,ref) 387
and Normalised Strength (sum,ref/DA) 388
Initial use of torpedo anchors took place at Marlim Field, Albacora Leste Field and Corvina 389
Field in the Campos Basin (Medeiros 2002; Argiolas and Rosas 2003; de Araujo et al. 2004; 390
Brandão et al. 2006). A similar concept has been used at the Vøring Plateau, Troll Field and 391
Gjøa Field in the North Sea (Lieng et al. 2010; Sturm et al. 2011) and in the Gulf of Mexico 392
(Wodehouse et al. 2007; Zimmerman et al. 2009). Hossain et al. (2014) provided a summary 393
of these field tests. In these regions, seabed sediments are mostly composed of normally 394
consolidated clay, with strength increasing somewhat linearly with depth. Typical strengths at 395
the seabed level of sum = 2~15 kPa, and gradients, k, in the range of 0~3 kPa/m. The effective 396
unit weight of soil, , typically varies between 5 and 9 kN/m3. In order to examine the 397
corresponding effect on the embedment depth in rate dependent and strain softening clay, 398
analyses were also undertaken for su,ref = 1 + 1z kPa (kDA/sum,ref = 1.07, sum,ref/DA = 0.16) 399
and su,ref = 10 + 3z kPa (kDA/sum,ref = 0.32, sum,ref/DA = 1.56), and the results are shown in 400
Figure 10. The curve for su,ref = 5 + 2z kPa (kDA/sum,ref = 0.43, sum,ref/DA = 0.78) is also 401
included in Figure 10 for comparison. The curve for lower shear strength (lower non-402
homogeneity, but higher normalised strength) attain to a plateau earlier, resulting in a lower 403
embedment depth. It is seen that effect of su,ref and kDA/sum,ref, sum,ref/DA is markedly 404
profound relative to other effects as the soil undrained shear strength is the dominant factor 405
for anchor penetration resistance in stage 2 (see later Equation 4). Compared to that (de,t = 406
32.16 m) for su,ref = 5 + 2z kPa (kDA/sum,ref = 0.43, sum,ref/DA = 0.78), the embedment depth 407
for su,ref = 1 + 1z kPa (kDA/sum,ref = 1.07, sum,ref/DA = 0.16) is 35% higher and for su,ref = 10 + 408
3z kPa (kDA/sum,ref = 0.32, sum,ref/DA = 1.56) is 16% lower. 409
410

20
Prediction of Embedment Depth in Field 411
Extended Bearing Resistance Method 412
Validation was undertaken against field data on a 4-fin torpedo anchor, as reported by 413
Brandão et al. (2006). Eighteen torpedo anchors (Ws = 850 kN, DA = 1.07 m, LA = 17 m, LF = 414
10 m and wF = 0.9 m) were installed in a soft normally consolidated clay deposit (su,ref 5 + 415
2z kPa; kDA/sum,ref = 0.43 and sum,ref/DA = 0.78) at Campos basin, Brazil. The achieved 416
impact velocity was vi 26.8 m/s and the average penetrations were about 35.2 m. The 417
objective in this part is to compare predicted penetrating depth profile obtained using a 418
bearing resistance method. 419
The motion response of a torpedo anchor during dynamic embedment in soil may be 420
approached by considering Newton’s second law of motion and the forces acting on the 421
anchor during penetration. Several studies (Medeiros 2002; de Araujo et al. 2004; Brandão et 422
al. 2006; Richardson et al. 2009; O’Loughlin et al. 2009, 2013, Chow et al. 2014; Hossain et 423
al. 2014, 2015; Kim et al. 2015) have adopted such an approach, with variations on the 424
inclusion and formulation of the various forces acting on a torpedo anchor. A similar 425
approach is adopted here 426
2psd
sFsFu,sAsAu,f2bFbFu,bFc,AbAu,bAc,f1γs
dfFfAf2bFb,bAb,f1γs
dff2bf1γs2
2
vAρC2
1
)AsA(sαRAsNAsNRFW
FFFRFFRFW
FFRFRFWdt
zdm
(4) 427
The terms used in the above expression are defined under nomenclature. Rf1 and Rf2 are shear 428
strain rate and softening related terms for end bearing and frictional resistance, respectively. 429
The frictional resistance term (Ff) comprises friction along the shaft (FfA) and the fins (FfF), 430

21
while the bearing resistance term (Fb) includes end bearing at the base of the shaft (Fb,bA) and 431
fins (Fb,bF). In addition, if soil backflow occurs above the installing anchor, reverse end 432
bearing at the upper end of the shaft (Fb,tA) and fins (Fb,tF) must be accounted for. Ws is the 433
submerged weight (in water) of the anchor and F is a buoyancy force, calculated as the 434
displaced volume times the effective unit weight of the soil ('). Fd is the inertial ‘drag’ 435
resistance generally expressed in terms of a drag coefficient, Cd, as indicated (with s the 436
submerged soil density and v the velocity of the penetrating anchor). During the penetration 437
process, soil is displaced from the path of the advancing anchor. Soil elements are accelerated 438
from rest to a velocity sufficient to move them out of the path of the anchor. The force 439
required to accelerate the soil elements is known as an inertial force. The reaction to the 440
inertial force produces a resistance force on the anchor. Inertial drag resistance in soil is 441
analogous to the hydrodynamic drag experienced by an object passing through water. 442
Considering the very soft, viscous clay typically present at the seabed surface it seems 443
reasonable to assume that an inertial drag force exists during penetration (Richardson et al. 444
2009; Hasanloo et al. 2012). 445
The dependence of shear strength on shear strain rate and strain softening can be generally 446
formulated using Equation 5 and has been accounted for in Equation 4 by scaling the bearing 447
resistances by a rate function, Rf1, expressed as 448
95a ξ3ξremrem
β
ref
A1f eδ1δ
γ
nv/Dη1
η)(1
1R /
(5) 449
In this analysis, values for the various parameters were adopted as follows: Cd = 0.63 (Lieng 450
et al. 1999, 2000, 2010; Sturm et al. 2011; O’Loughlin et al. 2013), n = 1.0, Nc,bA = 13.56, 451
Nc,bF = 7.5, = 1.0, = 0.1rem = 1/St = 1/3, and95 = 20. For the frictional resistance, Rf2 452
was taken as 2Rf1 from the previous reports (Einav and Randolph 2006; Chow et al. 2014; 453

22
Steiner et al. 2014). The predictions made the same assumptions based on the findings from 454
the parametric studies, adopting refγ = 0.1 s-1 anda = 0.35. 455
Figure 11a shows the measured (Brandão et al. 2006), computed (LDFE analysis) and 456
predicted velocity-penetration profiles using Equations 4 and 5 (kDA/sum,ref = 0.43, sum,ref/DA 457
= 0.78). The estimated profiles assuming ideal rate independent, non-softening ( = 0, rem = 458
1; Equation 5) and rate dependent, non-softening (rem = 1; Equation 5) soil are also included 459
in the figure. Overall, the computed and predicted curves for rate dependent and softening soil 460
closely predict the general trend of the measured data, and the predicted embedment depth 461
(de,t) also shows a good agreement with an error of < ±4.0%. Lower and significantly higher 462
embedment depths were resulted for rate dependent, non-softening and rate independent, non-463
softening soil respectively, confirming the necessity of considering in particular rate 464
dependency for this dynamic installation problem. The motion of the anchor and hence the 465
magnitude of the penetration resistance forces may be estimated from Equations 4 and 5. The 466
contributions of these resistance forces are plotted in Figure 11b. The figure confirms that the 467
total resistance force at relatively shallow depths (Stage 1, acceleration stage) does not exceed 468
the weight of the anchor. 469
Extended Modified Energy Method 470
Recently, O’Loughlin et al. (2013) proposed a simple expression utilising a dataset of 471
centrifuge testing. Total energy (Etotal), defined as the sum of the kinetic energy of the anchor 472
at the mudline and the potential energy released as it penetrates in the seabed, normalised by k 473
and Dp4 (i.e. Etotal/kDp
4) were used to link to the normalised embedment depth (de,t/Dp). In an 474
attempt to improve the total energy method, Kim et al. (2015) carried out a series of LDFE 475
analyses for various anchor configurations (but with a fixed series of strain rate and softening 476
parameters: refγ = 0.1 s-1, = 1.0, = 0.1rem = 1/St = 1/3,95 = 20) and modified it as a 477

23
function of Etotal/kAsDp2 accounting for the contribution of the total surface area of the anchor 478
(As = AsA + AsF) as 479
0.389
2ps
total
p
te,
DkA
E04
D
d
. (6) 480
where 481
te,2itotal gdmmv
2
1E (7) 482
with m being the effective mass of the anchor (submerged in soil), g Earth’s gravitational 483
acceleration of 9.81 m/s2 and Dp the anchor projected area equivalent diameter (including 484
fins). Figure 12 shows the relationship following Equation 6, and data for various velocities 485
and strain rate and strain softening parameters. For each combination of and rem (or non-486
softening), four analyses were carried out varying as 0, 0.5, 1.0 and 1.5, as labelled in 487
Figure 12. By comparing the result for the set parameter ( = 1.0, = 0.1rem = 1/St = 488
1/3,95 = 20), anchor embedment depth decreases or increases depending on increasing or 489
decreasing of the degree of rate dependency and the inverse of the sensitivity of the soil. From 490
the parametric study encompassing a range of relevant values of = 0.1 ~ 1.5; = 0.05 ~ 491
0.2rem = 0.2 ~ 0.5; and95 = 20 ~ 30 (see Table 1), Equation 6, accounting for the 492
combined effects of strain rate and strain softening, may be re-written with a multiplicative 493
term as 494
3890
2ps
totalξ3
remremβ
bp
te,
DkA
E04
])eδ(1][δ)η(R[1
η1
D
d95b
.
/ξ.
(8) 495
By comparing this expression with modified energy method, as shown in Figure 12, values 496
for the parameters Rb and b may be estimated as Rb ~ 1.8 and b ~ 0.28. The rate coefficient 497

24
and average cumulative shear strain in Figure 7 are slightly higher (Ra = 2.0, a = 0.35), since 498
the last term of Equation 3 obtained for an ideal rate independent, non-softening clay. Figure 499
12 confirms, as shown by two bound lines, that the modified method with multiplication term 500
(Equation 8) can predict anchor embedment depths accurately for various range of strain rate 501
dependency, strain softening, soil strength and sensitivity, and anchor impact velocity. 502
503
Concluding Remarks 504
Dynamic installation of a typical torpedo anchor was investigated extensively through 3D 505
dynamic large deformation finite element analyses. The embedment depth of the anchor was 506
found to be a function of the impact velocity, strain rate dependency of the shear strength, 507
degree of remoulding during shearing (or strain softening) and hence sensitivity of the soil. 508
The effect of the geometric parameters of torpedo anchors such as the length and diameter of 509
the shaft; number, width and length of fins; and the undrained shear strength of seabed 510
sediments were reported by Kim et al. (2015). 511
Overall, the effect of strain rate dependency on the anchor penetration profile was found to 512
dominate. Although the effects of rate dependency were partly compensated for by an 513
increase in penetration depth resistance due to strain softening, the strain rates involved were 514
very high (i.e. the softening was relatively quite small), resulting in correspondingly small 515
strain softening effects. During penetration of the anchor, the mobilised soil strength was 516
affected by strain rate and accumulated strain softening simultaneously. The soil with larger 517
strain softening (lower strength) was also featured with higher strain rate, which tended to 518
increase the soil strength, i.e. the effects of strain softening and strain rate in ‘shear bands’ are 519
partly compensated each other. 520

25
A robust total energy approach, modified from that proposed by O’Loughlin et al. (2013), was 521
proposed (Equation 8), taking into account the effect of anchor mass, impact velocity, surface 522
area, projected area equivalent diameter of the anchor, the soil undrained shear strength, strain 523
rate dependency of the shear strength, degree of remoulding during shearing (or strain 524
softening) and hence sensitivity of the soil. 525
526
Acknowledgements 527
The research presented here was undertaken with support from the National Research 528
Foundation of Korea (NRF) grant funded by the Korea Government (Ministry of Education, 529
Science and Technology: No. 2011-0030842 and NRF-2011-357-D00235) and the Australian 530
Research Council through the Discover Early Career Researcher Award DE140100903. The 531
work forms part of the activities of the Centre for Offshore Foundation Systems (COFS), 532
currently supported as a node of the Australian Research Council Centre of Excellence for 533
Geotechnical Science and Engineering, through Centre of Excellence funding from the State 534
Government of Western Australia and in partnership with The Lloyd’s Register Foundation. 535
This support is gratefully acknowledged. 536
537
538
539
540

26
References 541
Andersen, K.H., and Jostad, H.P. (2004). “Shear strength along inside of suction anchor skirt 542
wall in clay.” Proc. Offshore Technology Conf., Houston, OTC 16844. 543
Argiolas, R., and Rosas C. M. M. (2003). “Barracuda and Caratinga integrated deepwater site 544
investigation, offshore Brazil.” Proc. Offshore Technology Conf., Houston, 545
OTC15265. 546
Biscontin, G., and Pestana, J. M. (2001). “Influence of peripheral velocity on vane shear 547
strength of an artificial clay.” Geotechnical Testing J., 24(4), 423–429. 548
Brandão, F. E. N., Henriques, C. C. D., de Araujo, J. B., Ferreira, O. C. G., and dos Santos 549
Amaral, C. (2006). “Albacora Leste field development – FPSO P-50 mooring system 550
concept and installation.” Proc. Offshore Technology Conf., Houston, OTC18243. 551
Boukpeti, N., White, D. J., and Randolph, M. F. (2012). “Strength of fine-grained soils at the 552
solid-fluid transition.” Géotechnique, 62(3), 213-226. 553
Chow, S. H., O’Loughlin, C. D., and Randolph, M. F. (2014). “A centrifuge investigation of 554
free-fall piezocone in clay.” Géotechnique, 64(10), 817-824. 555
Dassault Systemes (2011). ABAQUS, Version 6.11 EF Documentation. Rhode Island: Hibbitt, 556
Karlsson & Sorensen, Inc. 557
de Araujo, J. B., Machado, R. D., and de Medeiros Junior, C. J. (2004). “High holding power 558
torpedo pile – results for the first long term application.” Proc. 23rd Int. Conf. Offshore 559
Mechanics and Arctic Engineering, OMAE, Vancouver, OMAE2004-51201. 560

27
DeGroot, D. J., DeJong, J. T., Yafrate, N. J., Landon, M. M., and Sheahan, T. C. (2007). 561
“Application of recent developments in terrestrial soft sediment characterization 562
methods to offshore environments.” Proc. Offshore Technology Conf., Houston, 563
OTC18737. 564
DeJong, J., DeGroot, D., and Yafrate, N. (2012). “Evaluation of undrained shear strength 565
using full-flow penetrometers.” J. Geotechnical and Geoenvironmental Engineering 566
138(6), 765-767. 567
Einav, I., Randolph, M. F., (2006). “Effect of strain rate on mobilised strength and thickness 568
of curved shear bands.” Géotechnique , 56(7), 501-504. 569
Gaudin, C., O’Loughlin, C.D. Hossain, M.S., Randolph, M.F., and Colliat, J.-L. (2014). 570
“Installation of suction caissons in Gulf of Guinea clay.” Proc. 8th Int. Conf. on 571
Physical Modelling in Geotechnics, Perth, 1, 493-499. 572
Hasanloo, D. Pang, H., and Yu, G. (2012). “On the estimation of the falling velocity and drag 573
coefficient of torpedo anchor during acceleration.” Ocean Engineering, 42, 135-146. 574
Herschel, W. H., and Bulkley, T. (1926). “Measurement of consistency as applied to rubber-575
benzene solutions.” Am. Soc. Test Proc., 26(2), 621-633. 576
Hossain, M. S., and Randolph, M. F. (2009). “Effect of Strain Rate and Strain Softening on 577
the Penetration Resistance of Spudcan Foundations on Clay.” Int. J. Geomechanics, 578
ASCE, 9(3), 122-132. 579
Hossain, M. S., Kim, Y. H., and Gaudin, C. (2014). “Experimental investigation of 580
installation and pull-out of dynamically penetrating anchors in clay and silt.” J. 581
Geotechnical and Geoenvironmental Engineering, ASCE, 140(7), 04014026. 582

28
Hossain, M. S., O’Loughlin, C., and Kim, Y. H. (2015). “Dynamic Installation and 583
Monotonic Pullout of a Torpedo Anchor in Calcareous Silt.” Géotechnique, 65(2), 77-584
90. 585
Kim, Y. H., Hossain, M. S., Wang, D., and Randolph, M. F. (2015). “Numerical Investigation 586
of Dynamic Installation of Torpedo Anchors in Clay.” Ocean Engineering, Under 587
review. 588
Kvalstad, T.J., Nadim, F., and Harbitz, C.B. (2001). “Deepwater geohazards: geotechnical 589
concerns and solutions.” Proc. Offshore Technology Conf., Houston, OTC 16844. 590
Lieng, J. T., Hove, F., and Tjelta, T. I. (1999). “Deep Penetrating Anchor: Subseabed 591
Deepwater Anchor Concept for Floaters and other Installations.” Proc. 9th Int. 592
Offshore and Polar Engineering Conference, Brest, 613-619. 593
Lieng, J. T., Kavli, A., Hove, F.m and Tjelta, T. I. (2000). “Deep Penetrating Anchor: Further 594
Development, Optimization and Capacity Clarification.” Proc. 10th Int. Offshore and 595
Polar Engineering Conference, Seattle, 410-416. 596
Lieng, J. T., Tjelta, T. I., and Skaugset, K. (2010). “Installation of two prototype deep 597
penetrating anchors at the Gjoa Field in the North Sea.” Proc. Offshore Technology 598
Conf., Houston, OTC20758. 599
Lunne, T., and Andersen, K. H. (2007). “Soft clay shear strength parameters for deepwater 600
geotechnical design.” Keynote address, Proc. 6th Int. Offshore Site Investigation and 601
Geotechnics Conf., London, UK, 151–176. 602
Lunne, T., Anderson, K.H., Low, H.E., Randolph, M.F., and Sjursen, M. (2011). “Guidelines 603
for offshore in situ testing and interpretation in deepwater soft clays.” Canadian 604

29
Geotechnical Journal, 48, 543-556.Medeiros Jr., C. J. (2002). “Low cost anchor 605
system for flexible risers in deep waters.” Proc. 34th Offshore Technology Conf., 606
Houston, OTC14151. 607
Menzies, D., and Roper, R. (2008). “Comparison of jackup rig spudcan penetration methods 608
in clay.” Proc. 34th Offshore Technology Conf., Houston, OTC19545. 609
O’Loughlin, C. D., Richardson, M. D., and Randolph, M. F. (2009). “Centrifuge tests on 610
dynamically installed anchors.” Proc. 28th Int. Conf. on Ocean, Offshore and Arctic 611
Engineering, Honolulu, USA, OMAE80238. 612
O’Loughlin, C. D., Richardson, M. D., Randolph, M. F., and Gaudin, C. (2013). “Penetration 613
of dynamically installed anchors in clay.” Géotechnique, 63(11), 909-919. 614
Raie, M., and Tassoulas, J. (2009). “Installation of torpedo anchors: numerical modeling.” J. 615
Geotechnical and Geoenvironmental Engineering, ASCE, 135(12), 1805-1813. 616
Randolph, M. F. (2004). “Characterisation of soft sediments for offshore applications.” Proc. 617
2nd Int. Conf. on Geotechnical and Geophysical Site Characterisation, Porto 1, 209-618
231. 619
Richardson, M.D., O’Loughlin, C.D., Randolph, M.F., and Gaudin, C. (2009). “Setup 620
following installation of dynamic anchors in normally consolidated clay.” J. Geotech. 621
Geoenviron. Eng. ASCE, 135(4), 487-496. 622
Steiner A, Kopf A. J, L’Heureux J-S., Kreiter, S., Stegmann, S., Haflidason, H., and Moerz T. 623
(2014). “In situ dynamic piezocone penetrometer tests in natural clayey soils – a 624
reappraisal of strain-rate corrections.” Canadian Geotechnical Journal, 51, 272–288. 625

30
Sturm, H., Lieng, J. T., and Saygili, G. (2011). “Effect of soil variability on the penetration 626
depth of dynamically installed drop anchors.” Proc. Offshore Technology Conf., 627
Houston, OTC22396. 628
Wodehouse, J., George, B., and Luo, Y. (2007). “The Development of a FPSO for the 629
Deepwater Gulf of Mexico.” Proc. 39th Offshore Technology Conference, Houston, 630
USA, Paper No. 18560. 631
Zimmerman, E. H., Smith, M. W. and Shelton, J. T. (2009). Efficient gravity installed anchor 632
for deep water mooring. Proc. Offshore Technology Conf., Houston, OTC20117. 633
Zhou, H., and Randolph, M. F. (2009). “Resistance of full-flow penetrometers in rate-634
dependent and strain-softening clay.” Géotechnique, 59(2), 79-86. 635
Zhu, H., and Randolph, M. F. (2011). “Numerical analysis of a cylinder moving through rate-636
dependent undrained soil.” Ocean Engineering, 38, 943-953. 637
638

31
Table 1. Summary of Selected Parameters for LDFE Analysis 639
kDA/sum,ref sum,ref/DA vi/DArefγ 95
rem
(1/St) Notes
0.43 0.78 186.91 0, 0.1, 0.5, 1.0, and 1.5
0.05, 0.10, 0.15 and
0.20 20 0.33
Effect of and
0.43 0.78 186.91 0, 0.1, 0.5, 1.0, and 1.5
0.05, 0.10, 0.15 and
0.20 - -
Without softening
0.43 0.78 186.91 0.5, 1.0 and
1.5 0.10
20 and 30
0.33 Effect of 95
0.43 0.78 186.91 1.0 and 1.5 0.10 and
0.20 20
0.20, 0.33 and 0.50 (1/5, 1/3,
1/2)
Effect of rem
0.43 0.78 18.69 and
1869 1.0 0.10 20 0.33
Effect of
refγ
0.43 0.78 - - - - - Ideal Tresca
material
1.07 0.16 186.91 1.0 0.10 20 0.33
Effect of kDA/sum,ref 0.32 1.56
640
641
642
643
644

32
No. of Figure: 12 645
Figure 1. Schematic diagram of installed torpedo anchor in clay 646
Figure 2. Typical mesh used in CEL analysis: (a) Typical 3D mesh; (b) Detail plan view; 647
(c) Side view 648
Figure 3. Effect of strain rate and strain softening on embedment depths and soil failure 649
mechanisms (LA = 17 m, DA = 1.07 m, LF = 10 m, wF = 0.9): (a) Embedment 650
depths; (b) Instantaneous (resultant) velocity vectors with anchor embedment; 651
(c) Soil separation at shallow depth 652
Figure 4. Effect of strain softening parameters and on anchor embedment 653
Figure 5. Effect of strain softening parameter 95 on anchor embedment depth 654
Figure 6. Effect of remoulded strength ratio rem and soil sensitivity St on anchor 655
embedment depth 656
Figure 7. Combined effect of strain rate parameter and strain softening parameter 657
95 on anchor embedment depth: (a) = 0.05; (b) = 0.1; (c) = 0.15; (d) = 658
0.2 659
Figure 8. Effect of reference shear strain refγ on anchor embedment depth 660
Figure 9. Effect of impact velocity vi on anchor embedment depth: (a) Time-embedment 661
profile; (b) Velocity profile 662
Figure 10. Effect of soil undrained shear strength on anchor embedment depth 663
Figure 11. Measured vs estimated anchor installation profile using proposed bearing 664
resistance method: (a) Comparison between measured field installation data 665
and estimated profile; (b) Contribution of various resistance force components 666
(Equation 4: rate dependent & strain softening) 667

33
Figure 12. Modified energy method for assessing anchor embedment depths: (a) 668
Estimation using modified energy method; (b) Magnification of numerical 669
dataset 670
671

34
672
673
674
675
Figure 1. Schematic diagram of installed torpedo anchor in clay 676
677

35
678
(a) Typical 3D mesh (b) Detail plan view
(c) Side view
Figure 2. Typical mesh used in CEL analysis

36
679
3(a) Embedment depths 680
681
682
683

37
684
3(b) Instantaneous (resultant) velocity vectors with anchor embedment 685
686

38
687
688
3(c) Soil separation at shallow depth 689
690
Figure 3. Effect of strain rate and strain softening on embedment depths and soil failure 691 mechanisms (LA = 17 m, DA = 1.07 m, LF = 10 m, wF = 0.9) 692
693

39
694
695
696
697
Figure 4. Effect of strain softening parameters and on anchor embedment 698
699
700
701

40
702
703
704
Figure 5. Effect of strain softening parameter 95 on anchor embedment depth 705
706

41
707
708
Figure 6. Effect of remoulded strength ratio rem and soil sensitivity St on anchor 709 embedment depth 710
711

42
0 0.4 0.8 1.2 1.6 2
Viscous property,
28
27
26
25
24
23
22= 0.05
LDFE: non-softeningLDFE: softeningEquation 3: non-softeningEquation 3: softening
su,ref = 5 + 2z kPakDA/sum,ref = 0.43sum,ref/ 'DA = 0.78
vi = 20 m/s.ref = 0.1 s-1
a = 0.35
95 = 20
No strain softening:rate coefficient, Ra = 2.0
712
7(a) = 0.05 713
714

43
715
7(b) = 0.1 716

44
0 0.4 0.8 1.2 1.6 2
Viscous property,
28
27
26
25
24
23
22= 0.15
LDFE: non-softeningLDFE: softeningEquation 3: non-softeningEquation 3: softening
su,ref = 5 + 2z kPakDA/sum,ref = 0.43sum,ref/ 'DA = 0.78
vi = 20 m/s.ref = 0.1 s-1
a = 0.35
No strain softening:rate coefficient, Ra = 2.0
95 = 20
717
7(c) = 0.15 718
719

45
0 0.4 0.8 1.2 1.6 2
Viscous property,
28
27
26
25
24
23
22= 0.2
LDFE: non-softeningLDFE: softeningEquation 3: non-softeningEquation 3: softening
su,ref = 5 + 2z kPakDA/sum,ref = 0.43sum,ref/ 'DA = 0.78
vi = 20 m/s.ref = 0.1 s-1
No strain softening:rate coefficient, Ra = 2.0
a = 0.35
95 = 20
720
7(d) = 0.2 721
722
Figure 7. Combined effect of strain rate parameter and strain softening parameter 723 95 on anchor embedment depth 724

46
725
726
Figure 8. Effect of reference shear strain rate refγ on anchor embedment depth 727
728

47
Tippenetrationdepth,d t(m)
729
9(a) Time-penetration profile 730

48
731
9(b) Velocity-penetration profile 732
733
Figure 9. Effect of impact velocity vi on anchor embedment depth 734
735

49
736
737
Figure 10. Effect of soil undrained shear strength on anchor embedment depth 738
739

50
740
741
50
40
30
20
10
00 5 10 15 20 25 30
Anchor velocity, v (m/s)
su,ref = 5 + 2z kPa, vi = 26.8 m/s
Measured: Brandão et al. (2006)Numerical resultsEquation 4: rate dependent & strain softeningEquation 4: non-softeningEquation 4: Ideal Tresca material
= 1.0, = 0.1, rem= 0.33,= 20, a = 0.35, Cd = 0.63
LDFE:= 1.0, = 0.1,
rem= 0.33, = 20
Non-softening:( rem = 1, Cd = 0.63)
Ideal Tresca material:( = 0, rem = 1, Cd = 0.63)
742
11(a) Comparison between measured field installation data and estimated profile 743
744

51
40
30
20
10
00 500 1000 1500 2000 2500 3000
Penetration resistance (kN)
su,ref = 5 + 2z kPakDA/sum,ref = 0.43sum,ref/ 'DA = 0.78vi = 26.8 m/sCd = 0.63= 1.0= 0.1
rem= 0.33= 20
a = 0.35
ref = 0.1 s-1
Fd
F Fb Fb x Rf1 Ff Ff x Rf2
745
11(b) Contribution of various resistance force components (Equation 4: rate dependent & 746
strain softening) 747
748
Figure 11. Measured vs estimated anchor installation profile using proposed bearing 749 resistance method 750
751
752

52
d e,t/D
p
753
12(a) Estimation using modified energy method 754
755

53
756
12(b) Magnification of numerical dataset 757
758
Figure 12. Modified energy method for assessing anchor embedment depths 759
760