


Languages
Pages
Legal

Visible-wavelength two-photonexcitation microscopy for fluorescentprotein imaging
Masahito YamanakaKenta SaitoNicholas I. SmithYoshiyuki AraiKumiko UegakiYasuo YonemaruKentaro MochizukiSatoshi KawataTakeharu NagaiKatsumasa Fujita
Downloaded From: https://www.spiedigitallibrary.org/journals/Journal-of-Biomedical-Optics on 25 Jun 2020Terms of Use: https://www.spiedigitallibrary.org/terms-of-use
Visible-wavelength two-photon excitation microscopyfor fluorescent protein imaging
Masahito Yamanaka,a Kenta Saito,b Nicholas I. Smith,c Yoshiyuki Arai,b Kumiko Uegaki,a Yasuo Yonemaru,aKentaro Mochizuki,a Satoshi Kawata,a Takeharu Nagai,b and Katsumasa Fujitaa,*aOsaka University, Department of Applied Physics, 2-1 Yamadaoka, Suita, Osaka 565-0871, JapanbOsaka University, The Institute of Scientific and Industrial Research, 8-1 Mihogaoka, Ibaraki, Osaka 565-0871, JapancOsaka University, Immunology Frontier Research Center, 3-1 Yamadaoka, Suita, Osaka 565-0871, Japan
Abstract. The simultaneous observation of multiple fluorescent proteins (FPs) by optical microscopy isrevealing mechanisms by which proteins and organelles control a variety of cellular functions. Here weshow the use of visible-light based two-photon excitation for simultaneously imaging multiple FPs. We demon-strated that multiple fluorescent targets can be concurrently excited by the absorption of two photons fromthe visible wavelength range and can be applied in multicolor fluorescence imaging. The technique alsoallows simultaneous single-photon excitation to offer simultaneous excitation of FPs across the entire rangeof visible wavelengths from a single excitation source. The calculation of point spread functions shows thatthe visible-wavelength two-photon excitation provides the fundamental improvement of spatial resolution com-pared to conventional confocal microscopy. © The Authors. Published by SPIE under a Creative Commons Attribution 3.0 Unported
License. Distribution or reproduction of this work in whole or in part requires full attribution of the original publication, including its DOI. [DOI: 10.1117/1
.JBO.20.10.101202]
Keywords: fluorescence microscopy; fluorescent protein; visible-wavelength two-photon excitation; deep ultraviolet excitation;multicolor imaging; cell imaging.
Paper 140475SSRR received Jul. 23, 2014; accepted for publication Mar. 25, 2015; published online Aug. 3, 2015.
1 IntroductionSimultaneous observation of different types of biological mol-ecules is essential for investigating complex biological phenom-ena because most biological events are based on ensembles ofdifferent molecules or proteins.1 Fluorescence microscopy tech-niques allow the simultaneous visualization of different biologi-cal molecules by spectral separation of fluorescence emission.In typical confocal microscopy, multicolor excitation is usedto excite fluorescent proteins (FPs) with different emissionwavelengths.2 However, simultaneous irradiation of multipleexcitation lasers may restrict the usable wavelength band forfluorescence detection and introduce chromatic aberrationthat can interfere with detecting colocalization or the relativedistributions of different FPs. Switching the excitation wave-length is another approach; however, it causes a problem inmonitoring molecules acting in temporal and spatial harmony.Since it is clear that simultaneous visualization of multiple tar-gets provides much more information about complex biologicalphenomena,3,4 increasing the number of FP in simultaneousexcitation and detection is in great demand in the wide range ofbiological investigations.5
For simultaneous multicolor imaging, use of multiphotonexcitation has been intensively investigated.6,7 Since manykinds of fluorophores exhibit two-photon excitation spectrablueshifted or broadened from the single-photon counterpart,a single laser line can excite more fluorophores compared tosingle-photon excitation.6–10 As another approach, multiple
excitation lines in the near-infrared (NIR) region have beenutilized for exciting multiple proteins,4,11,12 which allows theuse of the whole visible wavelength range for detecting FPs,whereas multiwavelength excitation with single-photon excita-tion does not.
In this paper, we present a new concept of multiphoton exci-tation microscopy for multicolor imaging, where two-photonexcitation with a single visible wavelength laser light is usedfor concurrent excitation of multiple FPs. Two-photon excitationis already well characterized in the NIR/IR region and has beenapplied to the observation of the inside of a thick sample.13–16
Although fluorescent properties of FPs under two-photonexcitation with visible light have been studied,17,18 the feasibilityof using visible-wavelength two-photon excitation of FPs inlaser-scanning confocal microscopy have been restricted totheoretical investigation and the resultant imaging propertyremains virtually unknown. In addition to the capability ofmulticolor imaging, our concept offers an improved spatial res-olution in three dimensions due to the nonlinear excitation usingthe shorter-wavelength laser.
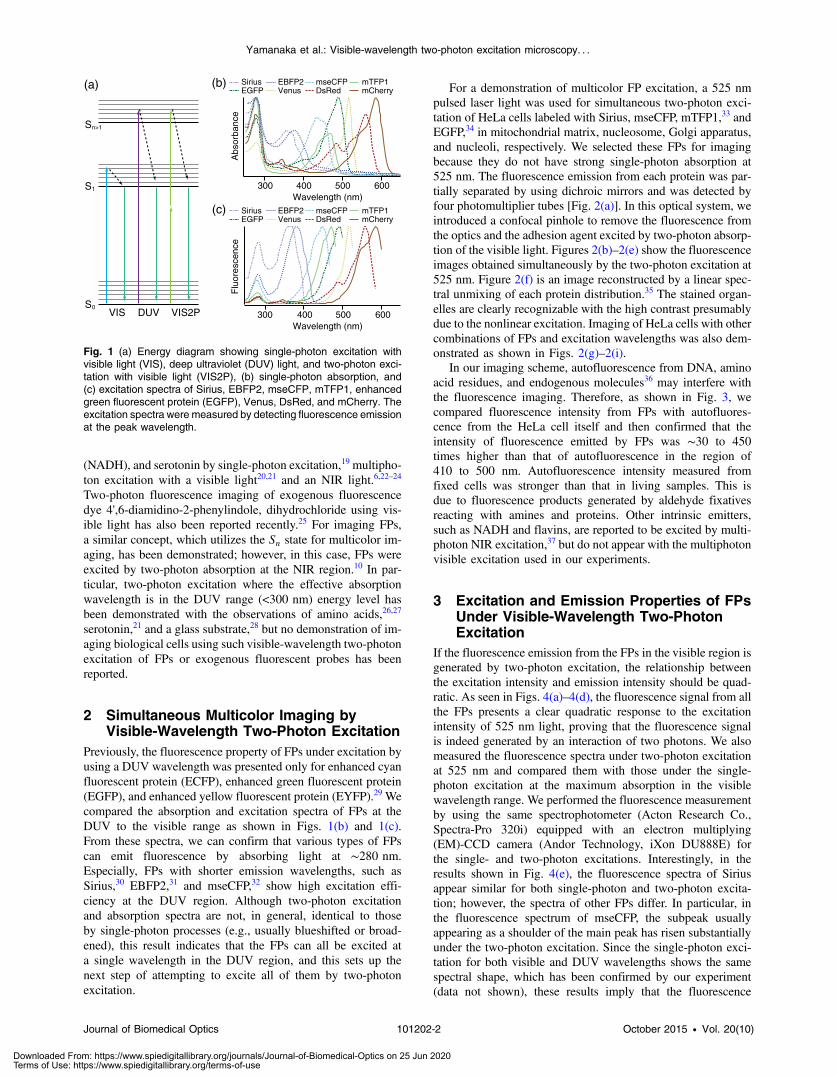
As described in the following section, many FPs can beexcited at a wavelength range of 250 to 300 nm. To accessthis deep UV (DUV) range for simultaneous multicolor imag-ing, we propose the use of a visible, in particular green, wave-length laser light and induce two-photon excited fluorescencefrom the FPs. As shown in Fig. 1(a), the simultaneous absorp-tion of two photons in the visible range can excite a fluorophorein a manner equivalent to that of a DUV wavelength. The useof fluorescence excitation in the UV region has been appliedin autofluorescence imaging of intrinsic fluorophores, suchas amino acids, biotin, nicotinamide adenine dinucleotide
*Address all correspondence to: Katsumasa Fujita, E-mail: [email protected]
Journal of Biomedical Optics 101202-1 October 2015 • Vol. 20(10)
Journal of Biomedical Optics 20(10), 101202 (October 2015)
Downloaded From: https://www.spiedigitallibrary.org/journals/Journal-of-Biomedical-Optics on 25 Jun 2020Terms of Use: https://www.spiedigitallibrary.org/terms-of-use
(NADH), and serotonin by single-photon excitation,19 multipho-ton excitation with a visible light20,21 and an NIR light.6,22–24
Two-photon fluorescence imaging of exogenous fluorescencedye 4',6-diamidino-2-phenylindole, dihydrochloride using vis-ible light has also been reported recently.25 For imaging FPs,a similar concept, which utilizes the Sn state for multicolor im-aging, has been demonstrated; however, in this case, FPs wereexcited by two-photon absorption at the NIR region.10 In par-ticular, two-photon excitation where the effective absorptionwavelength is in the DUV range (<300 nm) energy level hasbeen demonstrated with the observations of amino acids,26,27
serotonin,21 and a glass substrate,28 but no demonstration of im-aging biological cells using such visible-wavelength two-photonexcitation of FPs or exogenous fluorescent probes has beenreported.
2 Simultaneous Multicolor Imaging byVisible-Wavelength Two-Photon Excitation
Previously, the fluorescence property of FPs under excitation byusing a DUV wavelength was presented only for enhanced cyanfluorescent protein (ECFP), enhanced green fluorescent protein(EGFP), and enhanced yellow fluorescent protein (EYFP).29 Wecompared the absorption and excitation spectra of FPs at theDUV to the visible range as shown in Figs. 1(b) and 1(c).From these spectra, we can confirm that various types of FPscan emit fluorescence by absorbing light at ∼280 nm.Especially, FPs with shorter emission wavelengths, such asSirius,30 EBFP2,31 and mseCFP,32 show high excitation effi-ciency at the DUV region. Although two-photon excitationand absorption spectra are not, in general, identical to thoseby single-photon processes (e.g., usually blueshifted or broad-ened), this result indicates that the FPs can all be excited ata single wavelength in the DUV region, and this sets up thenext step of attempting to excite all of them by two-photonexcitation.
For a demonstration of multicolor FP excitation, a 525 nmpulsed laser light was used for simultaneous two-photon exci-tation of HeLa cells labeled with Sirius, mseCFP, mTFP1,33 andEGFP,34 in mitochondrial matrix, nucleosome, Golgi apparatus,and nucleoli, respectively. We selected these FPs for imagingbecause they do not have strong single-photon absorption at525 nm. The fluorescence emission from each protein was par-tially separated by using dichroic mirrors and was detected byfour photomultiplier tubes [Fig. 2(a)]. In this optical system, weintroduced a confocal pinhole to remove the fluorescence fromthe optics and the adhesion agent excited by two-photon absorp-tion of the visible light. Figures 2(b)–2(e) show the fluorescenceimages obtained simultaneously by the two-photon excitation at525 nm. Figure 2(f) is an image reconstructed by a linear spec-tral unmixing of each protein distribution.35 The stained organ-elles are clearly recognizable with the high contrast presumablydue to the nonlinear excitation. Imaging of HeLa cells with othercombinations of FPs and excitation wavelengths was also dem-onstrated as shown in Figs. 2(g)–2(i).
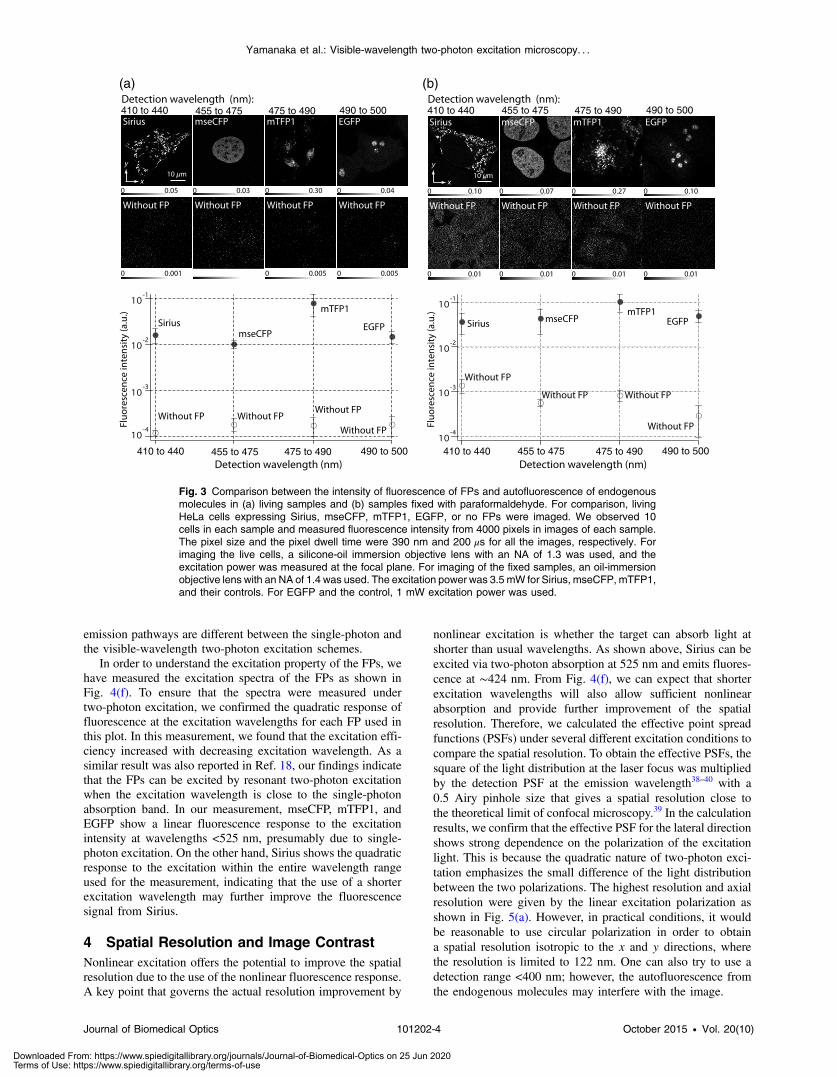
In our imaging scheme, autofluorescence from DNA, aminoacid residues, and endogenous molecules36 may interfere withthe fluorescence imaging. Therefore, as shown in Fig. 3, wecompared fluorescence intensity from FPs with autofluores-cence from the HeLa cell itself and then confirmed that theintensity of fluorescence emitted by FPs was ∼30 to 450times higher than that of autofluorescence in the region of410 to 500 nm. Autofluorescence intensity measured fromfixed cells was stronger than that in living samples. This isdue to fluorescence products generated by aldehyde fixativesreacting with amines and proteins. Other intrinsic emitters,such as NADH and flavins, are reported to be excited by multi-photon NIR excitation,37 but do not appear with the multiphotonvisible excitation used in our experiments.
3 Excitation and Emission Properties of FPsUnder Visible-Wavelength Two-PhotonExcitation
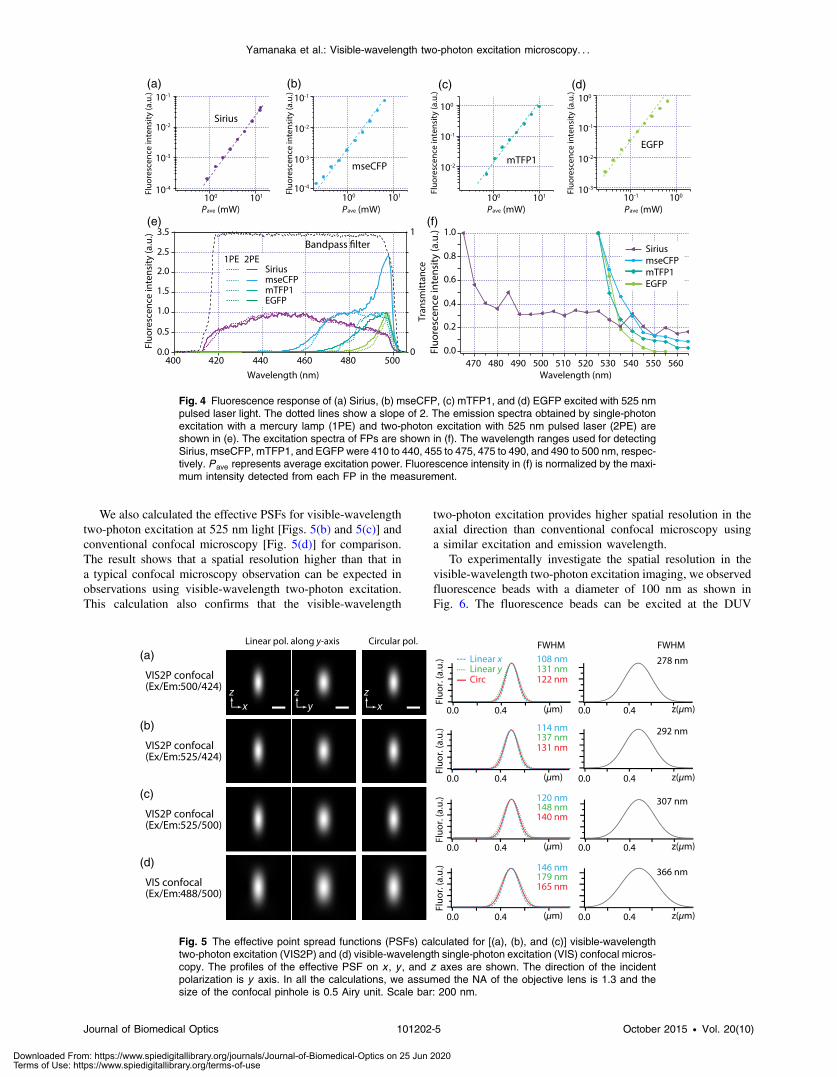
If the fluorescence emission from the FPs in the visible region isgenerated by two-photon excitation, the relationship betweenthe excitation intensity and emission intensity should be quad-ratic. As seen in Figs. 4(a)–4(d), the fluorescence signal from allthe FPs presents a clear quadratic response to the excitationintensity of 525 nm light, proving that the fluorescence signalis indeed generated by an interaction of two photons. We alsomeasured the fluorescence spectra under two-photon excitationat 525 nm and compared them with those under the single-photon excitation at the maximum absorption in the visiblewavelength range. We performed the fluorescence measurementby using the same spectrophotometer (Acton Research Co.,Spectra-Pro 320i) equipped with an electron multiplying(EM)-CCD camera (Andor Technology, iXon DU888E) forthe single- and two-photon excitations. Interestingly, in theresults shown in Fig. 4(e), the fluorescence spectra of Siriusappear similar for both single-photon and two-photon excita-tion; however, the spectra of other FPs differ. In particular, inthe fluorescence spectrum of mseCFP, the subpeak usuallyappearing as a shoulder of the main peak has risen substantiallyunder the two-photon excitation. Since the single-photon exci-tation for both visible and DUV wavelengths shows the samespectral shape, which has been confirmed by our experiment(data not shown), these results imply that the fluorescence
Wavelength (nm)300 400 500 600
Wavelength (nm)300 400 500 600
(b)(a)
(c)
VISS0
S1
Sn>1
DUV VIS2P
Flu
ores
cenc
eA
bsor
banc
e
SiriusEGFP
EBFP2Venus
mseCFPDsRed
mTFP1mCherry
SiriusEGFP
EBFP2Venus
mseCFPDsRed
mTFP1mCherry
Fig. 1 (a) Energy diagram showing single-photon excitation withvisible light (VIS), deep ultraviolet (DUV) light, and two-photon exci-tation with visible light (VIS2P), (b) single-photon absorption, and(c) excitation spectra of Sirius, EBFP2, mseCFP, mTFP1, enhancedgreen fluorescent protein (EGFP), Venus, DsRed, and mCherry. Theexcitation spectra were measured by detecting fluorescence emissionat the peak wavelength.
Journal of Biomedical Optics 101202-2 October 2015 • Vol. 20(10)
Yamanaka et al.: Visible-wavelength two-photon excitation microscopy. . .
Downloaded From: https://www.spiedigitallibrary.org/journals/Journal-of-Biomedical-Optics on 25 Jun 2020Terms of Use: https://www.spiedigitallibrary.org/terms-of-use
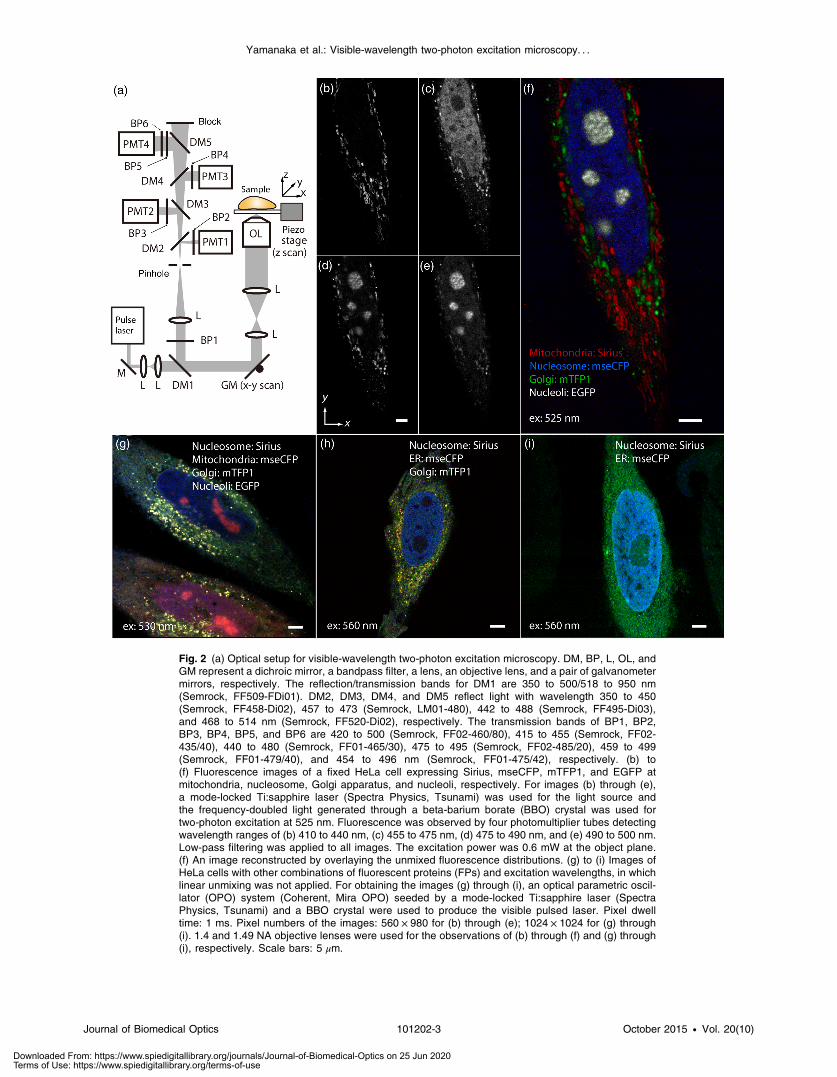
Fig. 2 (a) Optical setup for visible-wavelength two-photon excitation microscopy. DM, BP, L, OL, andGM represent a dichroic mirror, a bandpass filter, a lens, an objective lens, and a pair of galvanometermirrors, respectively. The reflection/transmission bands for DM1 are 350 to 500/518 to 950 nm(Semrock, FF509-FDi01). DM2, DM3, DM4, and DM5 reflect light with wavelength 350 to 450(Semrock, FF458-Di02), 457 to 473 (Semrock, LM01-480), 442 to 488 (Semrock, FF495-Di03),and 468 to 514 nm (Semrock, FF520-Di02), respectively. The transmission bands of BP1, BP2,BP3, BP4, BP5, and BP6 are 420 to 500 (Semrock, FF02-460/80), 415 to 455 (Semrock, FF02-435/40), 440 to 480 (Semrock, FF01-465/30), 475 to 495 (Semrock, FF02-485/20), 459 to 499(Semrock, FF01-479/40), and 454 to 496 nm (Semrock, FF01-475/42), respectively. (b) to(f) Fluorescence images of a fixed HeLa cell expressing Sirius, mseCFP, mTFP1, and EGFP atmitochondria, nucleosome, Golgi apparatus, and nucleoli, respectively. For images (b) through (e),a mode-locked Ti:sapphire laser (Spectra Physics, Tsunami) was used for the light source andthe frequency-doubled light generated through a beta-barium borate (BBO) crystal was used fortwo-photon excitation at 525 nm. Fluorescence was observed by four photomultiplier tubes detectingwavelength ranges of (b) 410 to 440 nm, (c) 455 to 475 nm, (d) 475 to 490 nm, and (e) 490 to 500 nm.Low-pass filtering was applied to all images. The excitation power was 0.6 mW at the object plane.(f) An image reconstructed by overlaying the unmixed fluorescence distributions. (g) to (i) Images ofHeLa cells with other combinations of fluorescent proteins (FPs) and excitation wavelengths, in whichlinear unmixing was not applied. For obtaining the images (g) through (i), an optical parametric oscil-lator (OPO) system (Coherent, Mira OPO) seeded by a mode-locked Ti:sapphire laser (SpectraPhysics, Tsunami) and a BBO crystal were used to produce the visible pulsed laser. Pixel dwelltime: 1 ms. Pixel numbers of the images: 560 × 980 for (b) through (e); 1024 × 1024 for (g) through(i). 1.4 and 1.49 NA objective lenses were used for the observations of (b) through (f) and (g) through(i), respectively. Scale bars: 5 μm.
Journal of Biomedical Optics 101202-3 October 2015 • Vol. 20(10)
Yamanaka et al.: Visible-wavelength two-photon excitation microscopy. . .
Downloaded From: https://www.spiedigitallibrary.org/journals/Journal-of-Biomedical-Optics on 25 Jun 2020Terms of Use: https://www.spiedigitallibrary.org/terms-of-use
emission pathways are different between the single-photon andthe visible-wavelength two-photon excitation schemes.
In order to understand the excitation property of the FPs, wehave measured the excitation spectra of the FPs as shown inFig. 4(f). To ensure that the spectra were measured undertwo-photon excitation, we confirmed the quadratic response offluorescence at the excitation wavelengths for each FP used inthis plot. In this measurement, we found that the excitation effi-ciency increased with decreasing excitation wavelength. As asimilar result was also reported in Ref. 18, our findings indicatethat the FPs can be excited by resonant two-photon excitationwhen the excitation wavelength is close to the single-photonabsorption band. In our measurement, mseCFP, mTFP1, andEGFP show a linear fluorescence response to the excitationintensity at wavelengths <525 nm, presumably due to single-photon excitation. On the other hand, Sirius shows the quadraticresponse to the excitation within the entire wavelength rangeused for the measurement, indicating that the use of a shorterexcitation wavelength may further improve the fluorescencesignal from Sirius.
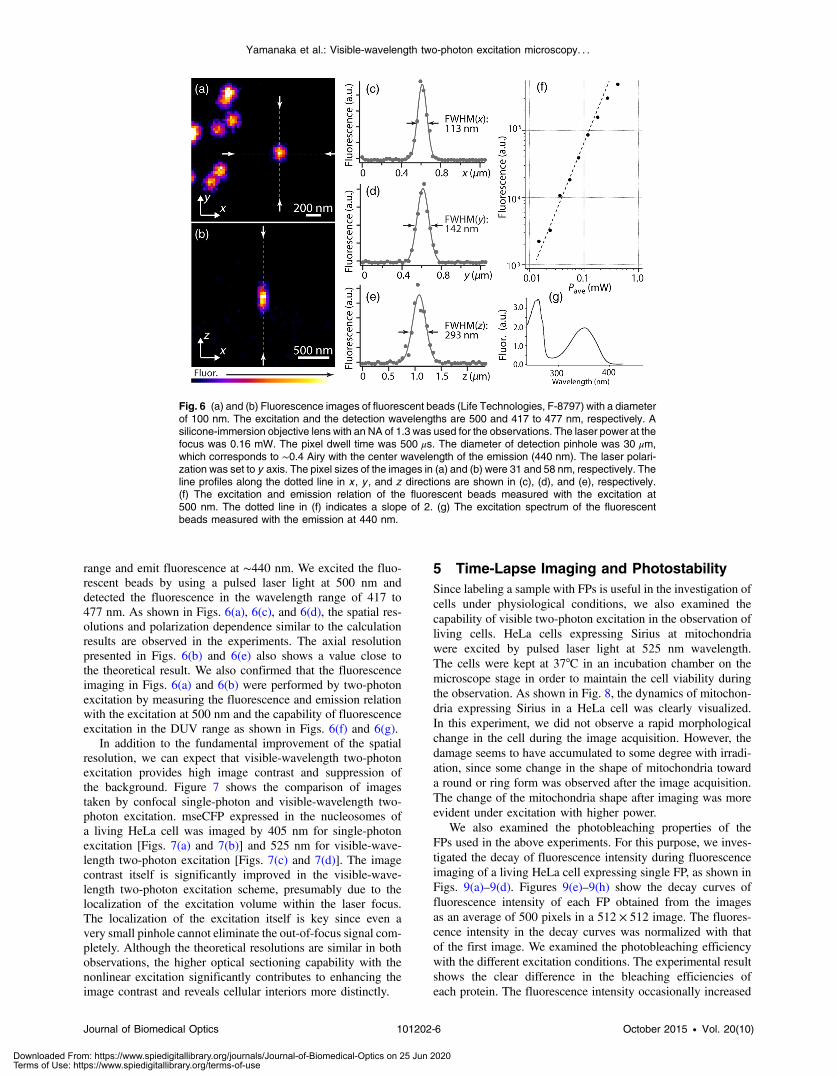
4 Spatial Resolution and Image ContrastNonlinear excitation offers the potential to improve the spatialresolution due to the use of the nonlinear fluorescence response.A key point that governs the actual resolution improvement by
nonlinear excitation is whether the target can absorb light atshorter than usual wavelengths. As shown above, Sirius can beexcited via two-photon absorption at 525 nm and emits fluores-cence at ∼424 nm. From Fig. 4(f), we can expect that shorterexcitation wavelengths will also allow sufficient nonlinearabsorption and provide further improvement of the spatialresolution. Therefore, we calculated the effective point spreadfunctions (PSFs) under several different excitation conditions tocompare the spatial resolution. To obtain the effective PSFs, thesquare of the light distribution at the laser focus was multipliedby the detection PSF at the emission wavelength38–40 with a0.5 Airy pinhole size that gives a spatial resolution close tothe theoretical limit of confocal microscopy.39 In the calculationresults, we confirm that the effective PSF for the lateral directionshows strong dependence on the polarization of the excitationlight. This is because the quadratic nature of two-photon exci-tation emphasizes the small difference of the light distributionbetween the two polarizations. The highest resolution and axialresolution were given by the linear excitation polarization asshown in Fig. 5(a). However, in practical conditions, it wouldbe reasonable to use circular polarization in order to obtaina spatial resolution isotropic to the x and y directions, wherethe resolution is limited to 122 nm. One can also try to use adetection range <400 nm; however, the autofluorescence fromthe endogenous molecules may interfere with the image.
(a) (b)
410 to 440 455 to 475 475 to 490 410 to 440490 to 500 455 to 475 475 to 490 490 to 500
410 to 440 455 to 475 475 to 490 410 to 440490 to 500 455 to 475 475 to 490 490 to 500
Fig. 3 Comparison between the intensity of fluorescence of FPs and autofluorescence of endogenousmolecules in (a) living samples and (b) samples fixed with paraformaldehyde. For comparison, livingHeLa cells expressing Sirius, mseCFP, mTFP1, EGFP, or no FPs were imaged. We observed 10cells in each sample and measured fluorescence intensity from 4000 pixels in images of each sample.The pixel size and the pixel dwell time were 390 nm and 200 μs for all the images, respectively. Forimaging the live cells, a silicone-oil immersion objective lens with an NA of 1.3 was used, and theexcitation power was measured at the focal plane. For imaging of the fixed samples, an oil-immersionobjective lens with an NA of 1.4 was used. The excitation power was 3.5 mW for Sirius, mseCFP, mTFP1,and their controls. For EGFP and the control, 1 mW excitation power was used.
Journal of Biomedical Optics 101202-4 October 2015 • Vol. 20(10)
Yamanaka et al.: Visible-wavelength two-photon excitation microscopy. . .
Downloaded From: https://www.spiedigitallibrary.org/journals/Journal-of-Biomedical-Optics on 25 Jun 2020Terms of Use: https://www.spiedigitallibrary.org/terms-of-use
We also calculated the effective PSFs for visible-wavelengthtwo-photon excitation at 525 nm light [Figs. 5(b) and 5(c)] andconventional confocal microscopy [Fig. 5(d)] for comparison.The result shows that a spatial resolution higher than that ina typical confocal microscopy observation can be expected inobservations using visible-wavelength two-photon excitation.This calculation also confirms that the visible-wavelength
two-photon excitation provides higher spatial resolution in theaxial direction than conventional confocal microscopy usinga similar excitation and emission wavelength.
To experimentally investigate the spatial resolution in thevisible-wavelength two-photon excitation imaging, we observedfluorescence beads with a diameter of 100 nm as shown inFig. 6. The fluorescence beads can be excited at the DUV
Fig. 4 Fluorescence response of (a) Sirius, (b) mseCFP, (c) mTFP1, and (d) EGFP excited with 525 nmpulsed laser light. The dotted lines show a slope of 2. The emission spectra obtained by single-photonexcitation with a mercury lamp (1PE) and two-photon excitation with 525 nm pulsed laser (2PE) areshown in (e). The excitation spectra of FPs are shown in (f). The wavelength ranges used for detectingSirius, mseCFP, mTFP1, and EGFPwere 410 to 440, 455 to 475, 475 to 490, and 490 to 500 nm, respec-tively. Pave represents average excitation power. Fluorescence intensity in (f) is normalized by the maxi-mum intensity detected from each FP in the measurement.
Fig. 5 The effective point spread functions (PSFs) calculated for [(a), (b), and (c)] visible-wavelengthtwo-photon excitation (VIS2P) and (d) visible-wavelength single-photon excitation (VIS) confocal micros-copy. The profiles of the effective PSF on x , y , and z axes are shown. The direction of the incidentpolarization is y axis. In all the calculations, we assumed the NA of the objective lens is 1.3 and thesize of the confocal pinhole is 0.5 Airy unit. Scale bar: 200 nm.
Journal of Biomedical Optics 101202-5 October 2015 • Vol. 20(10)
Yamanaka et al.: Visible-wavelength two-photon excitation microscopy. . .
Downloaded From: https://www.spiedigitallibrary.org/journals/Journal-of-Biomedical-Optics on 25 Jun 2020Terms of Use: https://www.spiedigitallibrary.org/terms-of-use
range and emit fluorescence at ∼440 nm. We excited the fluo-rescent beads by using a pulsed laser light at 500 nm anddetected the fluorescence in the wavelength range of 417 to477 nm. As shown in Figs. 6(a), 6(c), and 6(d), the spatial res-olutions and polarization dependence similar to the calculationresults are observed in the experiments. The axial resolutionpresented in Figs. 6(b) and 6(e) also shows a value close tothe theoretical result. We also confirmed that the fluorescenceimaging in Figs. 6(a) and 6(b) were performed by two-photonexcitation by measuring the fluorescence and emission relationwith the excitation at 500 nm and the capability of fluorescenceexcitation in the DUV range as shown in Figs. 6(f) and 6(g).
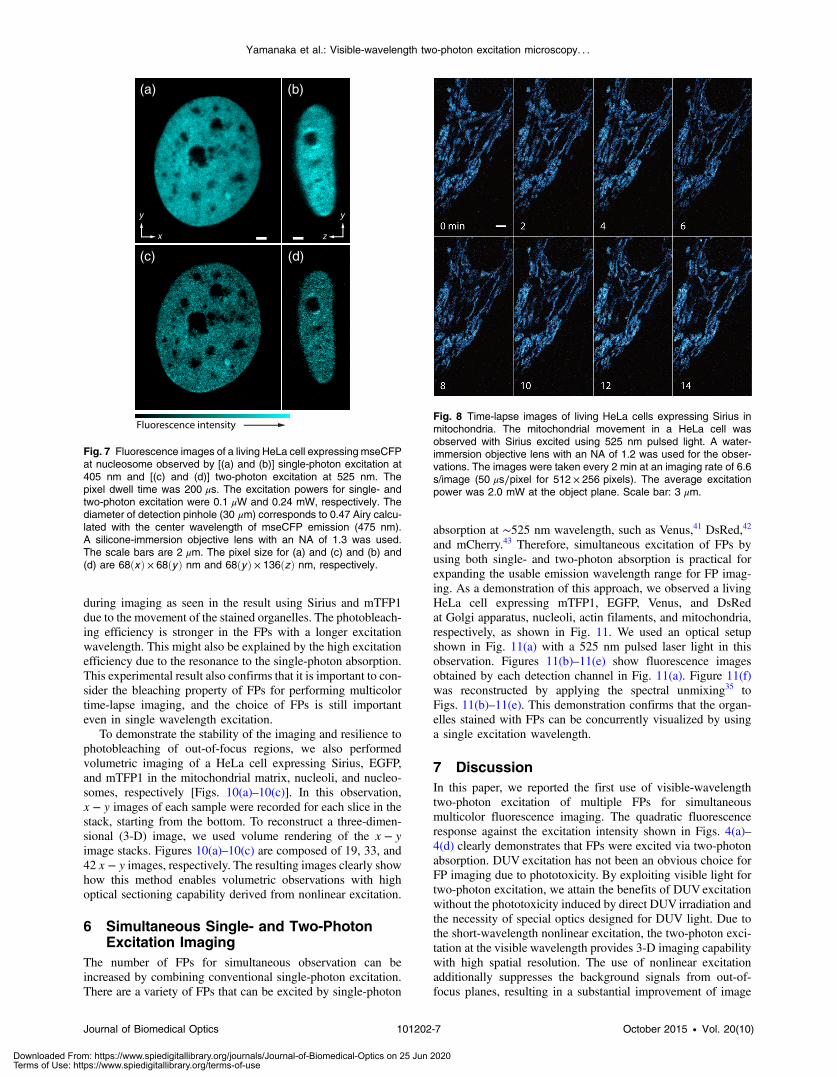
In addition to the fundamental improvement of the spatialresolution, we can expect that visible-wavelength two-photonexcitation provides high image contrast and suppression ofthe background. Figure 7 shows the comparison of imagestaken by confocal single-photon and visible-wavelength two-photon excitation. mseCFP expressed in the nucleosomes ofa living HeLa cell was imaged by 405 nm for single-photonexcitation [Figs. 7(a) and 7(b)] and 525 nm for visible-wave-length two-photon excitation [Figs. 7(c) and 7(d)]. The imagecontrast itself is significantly improved in the visible-wave-length two-photon excitation scheme, presumably due to thelocalization of the excitation volume within the laser focus.The localization of the excitation itself is key since even avery small pinhole cannot eliminate the out-of-focus signal com-pletely. Although the theoretical resolutions are similar in bothobservations, the higher optical sectioning capability with thenonlinear excitation significantly contributes to enhancing theimage contrast and reveals cellular interiors more distinctly.
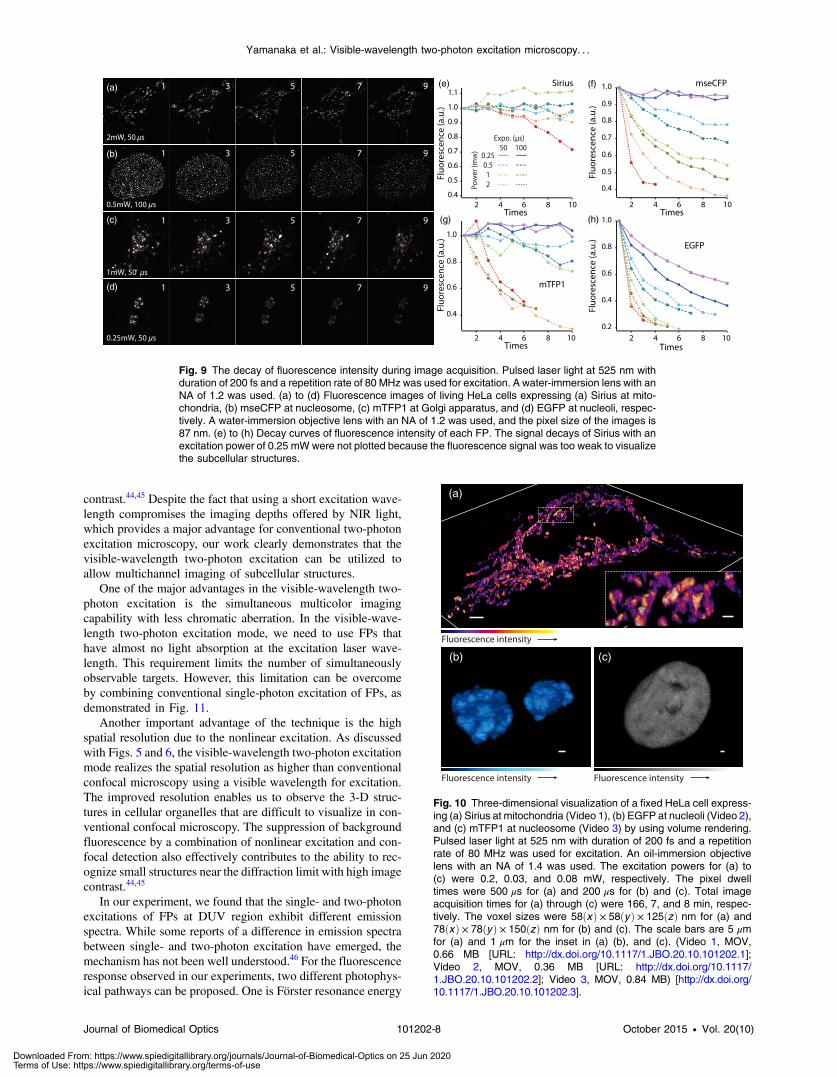
5 Time-Lapse Imaging and PhotostabilitySince labeling a sample with FPs is useful in the investigation ofcells under physiological conditions, we also examined thecapability of visible two-photon excitation in the observation ofliving cells. HeLa cells expressing Sirius at mitochondriawere excited by pulsed laser light at 525 nm wavelength.The cells were kept at 37°C in an incubation chamber on themicroscope stage in order to maintain the cell viability duringthe observation. As shown in Fig. 8, the dynamics of mitochon-dria expressing Sirius in a HeLa cell was clearly visualized.In this experiment, we did not observe a rapid morphologicalchange in the cell during the image acquisition. However, thedamage seems to have accumulated to some degree with irradi-ation, since some change in the shape of mitochondria towarda round or ring form was observed after the image acquisition.The change of the mitochondria shape after imaging was moreevident under excitation with higher power.
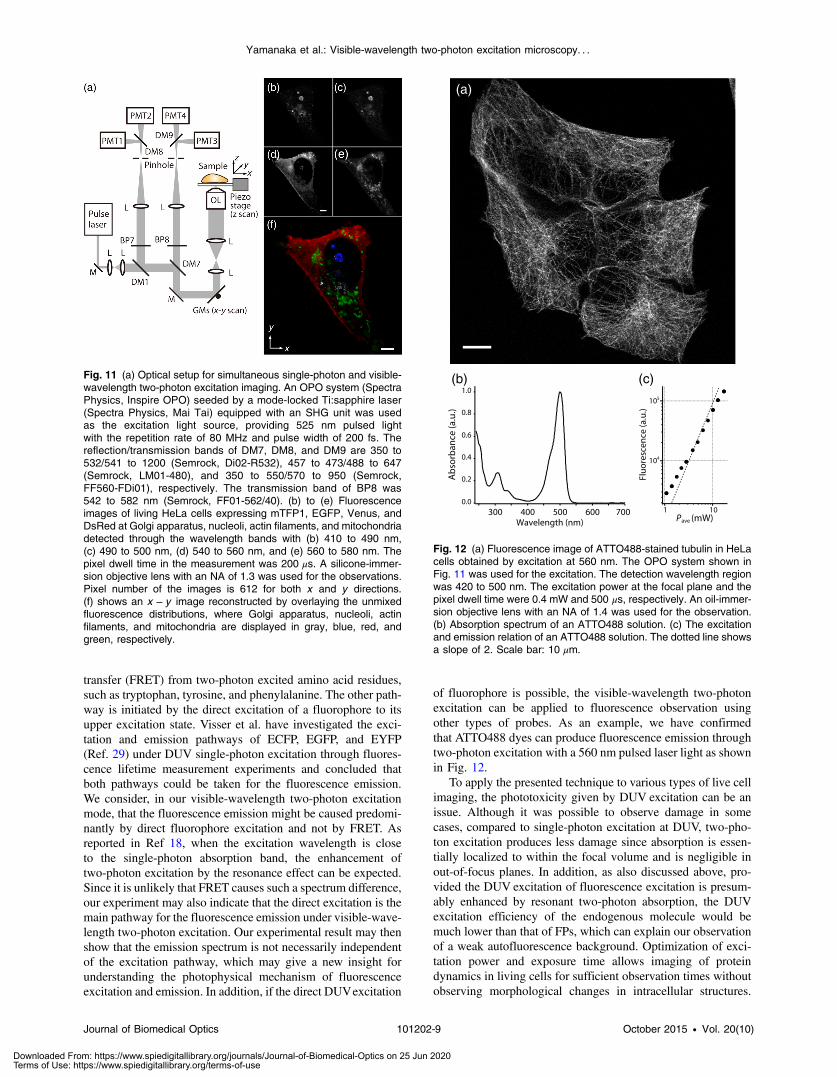
We also examined the photobleaching properties of theFPs used in the above experiments. For this purpose, we inves-tigated the decay of fluorescence intensity during fluorescenceimaging of a living HeLa cell expressing single FP, as shown inFigs. 9(a)–9(d). Figures 9(e)–9(h) show the decay curves offluorescence intensity of each FP obtained from the imagesas an average of 500 pixels in a 512 × 512 image. The fluores-cence intensity in the decay curves was normalized with thatof the first image. We examined the photobleaching efficiencywith the different excitation conditions. The experimental resultshows the clear difference in the bleaching efficiencies ofeach protein. The fluorescence intensity occasionally increased
Fig. 6 (a) and (b) Fluorescence images of fluorescent beads (Life Technologies, F-8797) with a diameterof 100 nm. The excitation and the detection wavelengths are 500 and 417 to 477 nm, respectively. Asilicone-immersion objective lens with an NA of 1.3 was used for the observations. The laser power at thefocus was 0.16 mW. The pixel dwell time was 500 μs. The diameter of detection pinhole was 30 μm,which corresponds to ∼0.4 Airy with the center wavelength of the emission (440 nm). The laser polari-zation was set to y axis. The pixel sizes of the images in (a) and (b) were 31 and 58 nm, respectively. Theline profiles along the dotted line in x , y , and z directions are shown in (c), (d), and (e), respectively.(f) The excitation and emission relation of the fluorescent beads measured with the excitation at500 nm. The dotted line in (f) indicates a slope of 2. (g) The excitation spectrum of the fluorescentbeads measured with the emission at 440 nm.
Journal of Biomedical Optics 101202-6 October 2015 • Vol. 20(10)
Yamanaka et al.: Visible-wavelength two-photon excitation microscopy. . .
Downloaded From: https://www.spiedigitallibrary.org/journals/Journal-of-Biomedical-Optics on 25 Jun 2020Terms of Use: https://www.spiedigitallibrary.org/terms-of-use
during imaging as seen in the result using Sirius and mTFP1due to the movement of the stained organelles. The photobleach-ing efficiency is stronger in the FPs with a longer excitationwavelength. This might also be explained by the high excitationefficiency due to the resonance to the single-photon absorption.This experimental result also confirms that it is important to con-sider the bleaching property of FPs for performing multicolortime-lapse imaging, and the choice of FPs is still importanteven in single wavelength excitation.
To demonstrate the stability of the imaging and resilience tophotobleaching of out-of-focus regions, we also performedvolumetric imaging of a HeLa cell expressing Sirius, EGFP,and mTFP1 in the mitochondrial matrix, nucleoli, and nucleo-somes, respectively [Figs. 10(a)–10(c)]. In this observation,x − y images of each sample were recorded for each slice in thestack, starting from the bottom. To reconstruct a three-dimen-sional (3-D) image, we used volume rendering of the x − yimage stacks. Figures 10(a)–10(c) are composed of 19, 33, and42 x − y images, respectively. The resulting images clearly showhow this method enables volumetric observations with highoptical sectioning capability derived from nonlinear excitation.
6 Simultaneous Single- and Two-PhotonExcitation Imaging
The number of FPs for simultaneous observation can beincreased by combining conventional single-photon excitation.There are a variety of FPs that can be excited by single-photon
absorption at ∼525 nm wavelength, such as Venus,41 DsRed,42
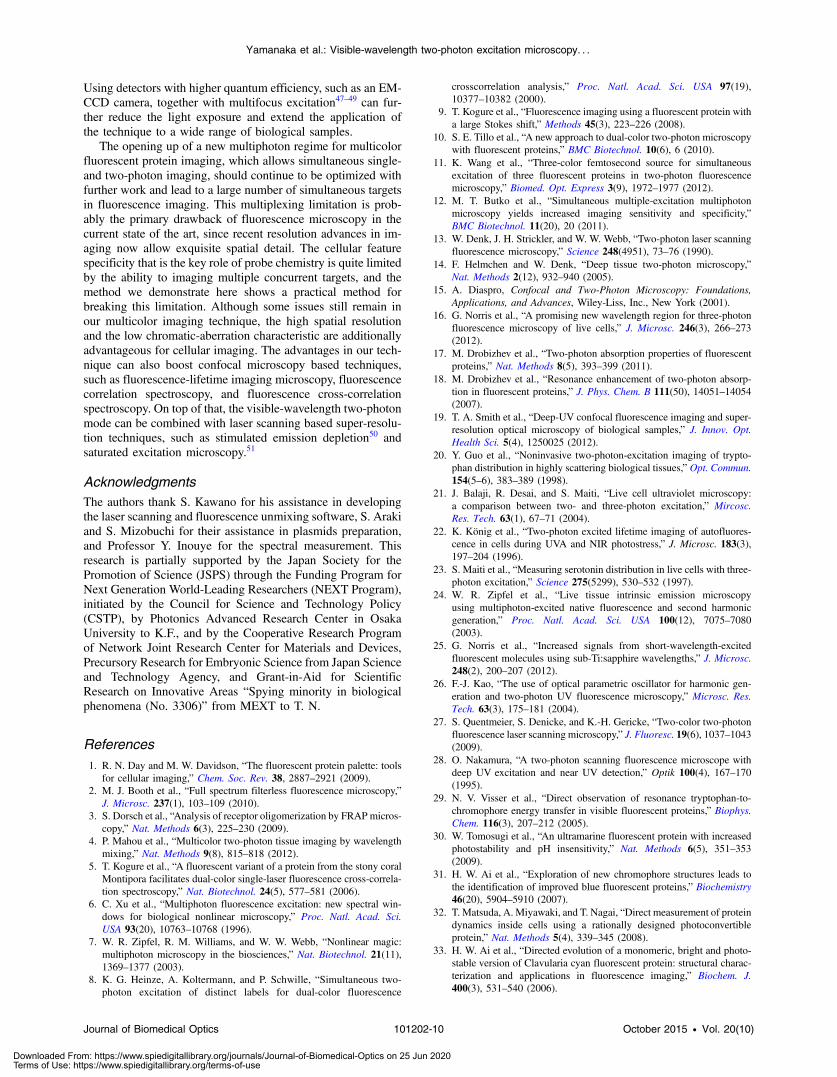
and mCherry.43 Therefore, simultaneous excitation of FPs byusing both single- and two-photon absorption is practical forexpanding the usable emission wavelength range for FP imag-ing. As a demonstration of this approach, we observed a livingHeLa cell expressing mTFP1, EGFP, Venus, and DsRedat Golgi apparatus, nucleoli, actin filaments, and mitochondria,respectively, as shown in Fig. 11. We used an optical setupshown in Fig. 11(a) with a 525 nm pulsed laser light in thisobservation. Figures 11(b)–11(e) show fluorescence imagesobtained by each detection channel in Fig. 11(a). Figure 11(f)was reconstructed by applying the spectral unmixing35 toFigs. 11(b)–11(e). This demonstration confirms that the organ-elles stained with FPs can be concurrently visualized by usinga single excitation wavelength.
7 DiscussionIn this paper, we reported the first use of visible-wavelengthtwo-photon excitation of multiple FPs for simultaneousmulticolor fluorescence imaging. The quadratic fluorescenceresponse against the excitation intensity shown in Figs. 4(a)–4(d) clearly demonstrates that FPs were excited via two-photonabsorption. DUV excitation has not been an obvious choice forFP imaging due to phototoxicity. By exploiting visible light fortwo-photon excitation, we attain the benefits of DUVexcitationwithout the phototoxicity induced by direct DUV irradiation andthe necessity of special optics designed for DUV light. Due tothe short-wavelength nonlinear excitation, the two-photon exci-tation at the visible wavelength provides 3-D imaging capabilitywith high spatial resolution. The use of nonlinear excitationadditionally suppresses the background signals from out-of-focus planes, resulting in a substantial improvement of image
Fig. 7 Fluorescence images of a living HeLa cell expressing mseCFPat nucleosome observed by [(a) and (b)] single-photon excitation at405 nm and [(c) and (d)] two-photon excitation at 525 nm. Thepixel dwell time was 200 μs. The excitation powers for single- andtwo-photon excitation were 0.1 μW and 0.24 mW, respectively. Thediameter of detection pinhole (30 μm) corresponds to 0.47 Airy calcu-lated with the center wavelength of mseCFP emission (475 nm).A silicone-immersion objective lens with an NA of 1.3 was used.The scale bars are 2 μm. The pixel size for (a) and (c) and (b) and(d) are 68ðxÞ × 68ðyÞ nm and 68ðyÞ × 136ðzÞ nm, respectively.
Fig. 8 Time-lapse images of living HeLa cells expressing Sirius inmitochondria. The mitochondrial movement in a HeLa cell wasobserved with Sirius excited using 525 nm pulsed light. A water-immersion objective lens with an NA of 1.2 was used for the obser-vations. The images were taken every 2 min at an imaging rate of 6.6s/image (50 μs∕pixel for 512 × 256 pixels). The average excitationpower was 2.0 mW at the object plane. Scale bar: 3 μm.
Journal of Biomedical Optics 101202-7 October 2015 • Vol. 20(10)
Yamanaka et al.: Visible-wavelength two-photon excitation microscopy. . .
Downloaded From: https://www.spiedigitallibrary.org/journals/Journal-of-Biomedical-Optics on 25 Jun 2020Terms of Use: https://www.spiedigitallibrary.org/terms-of-use
contrast.44,45 Despite the fact that using a short excitation wave-length compromises the imaging depths offered by NIR light,which provides a major advantage for conventional two-photonexcitation microscopy, our work clearly demonstrates that thevisible-wavelength two-photon excitation can be utilized toallow multichannel imaging of subcellular structures.
One of the major advantages in the visible-wavelength two-photon excitation is the simultaneous multicolor imagingcapability with less chromatic aberration. In the visible-wave-length two-photon excitation mode, we need to use FPs thathave almost no light absorption at the excitation laser wave-length. This requirement limits the number of simultaneouslyobservable targets. However, this limitation can be overcomeby combining conventional single-photon excitation of FPs, asdemonstrated in Fig. 11.
Another important advantage of the technique is the highspatial resolution due to the nonlinear excitation. As discussedwith Figs. 5 and 6, the visible-wavelength two-photon excitationmode realizes the spatial resolution as higher than conventionalconfocal microscopy using a visible wavelength for excitation.The improved resolution enables us to observe the 3-D struc-tures in cellular organelles that are difficult to visualize in con-ventional confocal microscopy. The suppression of backgroundfluorescence by a combination of nonlinear excitation and con-focal detection also effectively contributes to the ability to rec-ognize small structures near the diffraction limit with high imagecontrast.44,45
In our experiment, we found that the single- and two-photonexcitations of FPs at DUV region exhibit different emissionspectra. While some reports of a difference in emission spectrabetween single- and two-photon excitation have emerged, themechanism has not been well understood.46 For the fluorescenceresponse observed in our experiments, two different photophys-ical pathways can be proposed. One is Förster resonance energy
Fig. 9 The decay of fluorescence intensity during image acquisition. Pulsed laser light at 525 nm withduration of 200 fs and a repetition rate of 80 MHz was used for excitation. A water-immersion lens with anNA of 1.2 was used. (a) to (d) Fluorescence images of living HeLa cells expressing (a) Sirius at mito-chondria, (b) mseCFP at nucleosome, (c) mTFP1 at Golgi apparatus, and (d) EGFP at nucleoli, respec-tively. A water-immersion objective lens with an NA of 1.2 was used, and the pixel size of the images is87 nm. (e) to (h) Decay curves of fluorescence intensity of each FP. The signal decays of Sirius with anexcitation power of 0.25 mW were not plotted because the fluorescence signal was too weak to visualizethe subcellular structures.
Fig. 10 Three-dimensional visualization of a fixed HeLa cell express-ing (a) Sirius at mitochondria (Video 1), (b) EGFP at nucleoli (Video 2),and (c) mTFP1 at nucleosome (Video 3) by using volume rendering.Pulsed laser light at 525 nm with duration of 200 fs and a repetitionrate of 80 MHz was used for excitation. An oil-immersion objectivelens with an NA of 1.4 was used. The excitation powers for (a) to(c) were 0.2, 0.03, and 0.08 mW, respectively. The pixel dwelltimes were 500 μs for (a) and 200 μs for (b) and (c). Total imageacquisition times for (a) through (c) were 166, 7, and 8 min, respec-tively. The voxel sizes were 58ðxÞ × 58ðyÞ × 125ðzÞ nm for (a) and78ðxÞ × 78ðyÞ × 150ðzÞ nm for (b) and (c). The scale bars are 5 μmfor (a) and 1 μm for the inset in (a) (b), and (c). (Video 1, MOV,0.66 MB [URL: http://dx.doi.org/10.1117/1.JBO.20.10.101202.1];Video 2, MOV, 0.36 MB [URL: http://dx.doi.org/10.1117/1.JBO.20.10.101202.2]; Video 3, MOV, 0.84 MB) [http://dx.doi.org/10.1117/1.JBO.20.10.101202.3].
Journal of Biomedical Optics 101202-8 October 2015 • Vol. 20(10)
Yamanaka et al.: Visible-wavelength two-photon excitation microscopy. . .
Downloaded From: https://www.spiedigitallibrary.org/journals/Journal-of-Biomedical-Optics on 25 Jun 2020Terms of Use: https://www.spiedigitallibrary.org/terms-of-use
transfer (FRET) from two-photon excited amino acid residues,such as tryptophan, tyrosine, and phenylalanine. The other path-way is initiated by the direct excitation of a fluorophore to itsupper excitation state. Visser et al. have investigated the exci-tation and emission pathways of ECFP, EGFP, and EYFP(Ref. 29) under DUV single-photon excitation through fluores-cence lifetime measurement experiments and concluded thatboth pathways could be taken for the fluorescence emission.We consider, in our visible-wavelength two-photon excitationmode, that the fluorescence emission might be caused predomi-nantly by direct fluorophore excitation and not by FRET. Asreported in Ref 18, when the excitation wavelength is closeto the single-photon absorption band, the enhancement oftwo-photon excitation by the resonance effect can be expected.Since it is unlikely that FRET causes such a spectrum difference,our experiment may also indicate that the direct excitation is themain pathway for the fluorescence emission under visible-wave-length two-photon excitation. Our experimental result may thenshow that the emission spectrum is not necessarily independentof the excitation pathway, which may give a new insight forunderstanding the photophysical mechanism of fluorescenceexcitation and emission. In addition, if the direct DUVexcitation
of fluorophore is possible, the visible-wavelength two-photonexcitation can be applied to fluorescence observation usingother types of probes. As an example, we have confirmedthat ATTO488 dyes can produce fluorescence emission throughtwo-photon excitation with a 560 nm pulsed laser light as shownin Fig. 12.
To apply the presented technique to various types of live cellimaging, the phototoxicity given by DUV excitation can be anissue. Although it was possible to observe damage in somecases, compared to single-photon excitation at DUV, two-pho-ton excitation produces less damage since absorption is essen-tially localized to within the focal volume and is negligible inout-of-focus planes. In addition, as also discussed above, pro-vided the DUV excitation of fluorescence excitation is presum-ably enhanced by resonant two-photon absorption, the DUVexcitation efficiency of the endogenous molecule would bemuch lower than that of FPs, which can explain our observationof a weak autofluorescence background. Optimization of exci-tation power and exposure time allows imaging of proteindynamics in living cells for sufficient observation times withoutobserving morphological changes in intracellular structures.
Fig. 11 (a) Optical setup for simultaneous single-photon and visible-wavelength two-photon excitation imaging. An OPO system (SpectraPhysics, Inspire OPO) seeded by a mode-locked Ti:sapphire laser(Spectra Physics, Mai Tai) equipped with an SHG unit was usedas the excitation light source, providing 525 nm pulsed lightwith the repetition rate of 80 MHz and pulse width of 200 fs. Thereflection/transmission bands of DM7, DM8, and DM9 are 350 to532/541 to 1200 (Semrock, Di02-R532), 457 to 473/488 to 647(Semrock, LM01-480), and 350 to 550/570 to 950 (Semrock,FF560-FDi01), respectively. The transmission band of BP8 was542 to 582 nm (Semrock, FF01-562/40). (b) to (e) Fluorescenceimages of living HeLa cells expressing mTFP1, EGFP, Venus, andDsRed at Golgi apparatus, nucleoli, actin filaments, and mitochondriadetected through the wavelength bands with (b) 410 to 490 nm,(c) 490 to 500 nm, (d) 540 to 560 nm, and (e) 560 to 580 nm. Thepixel dwell time in the measurement was 200 μs. A silicone-immer-sion objective lens with an NA of 1.3 was used for the observations.Pixel number of the images is 612 for both x and y directions.(f) shows an x − y image reconstructed by overlaying the unmixedfluorescence distributions, where Golgi apparatus, nucleoli, actinfilaments, and mitochondria are displayed in gray, blue, red, andgreen, respectively.
(a)
(c)(b)1.0
0.8
0.6
0.4
0.2
0.0700600500
Wavelength (nm)
Abs
orba
nce
(a.u
.)
Fluo
resc
ence
(a.u
.)
400300Pave (mW)
104
105
1 10
Fig. 12 (a) Fluorescence image of ATTO488-stained tubulin in HeLacells obtained by excitation at 560 nm. The OPO system shown inFig. 11 was used for the excitation. The detection wavelength regionwas 420 to 500 nm. The excitation power at the focal plane and thepixel dwell time were 0.4 mW and 500 μs, respectively. An oil-immer-sion objective lens with an NA of 1.4 was used for the observation.(b) Absorption spectrum of an ATTO488 solution. (c) The excitationand emission relation of an ATTO488 solution. The dotted line showsa slope of 2. Scale bar: 10 μm.
Journal of Biomedical Optics 101202-9 October 2015 • Vol. 20(10)
Yamanaka et al.: Visible-wavelength two-photon excitation microscopy. . .
Downloaded From: https://www.spiedigitallibrary.org/journals/Journal-of-Biomedical-Optics on 25 Jun 2020Terms of Use: https://www.spiedigitallibrary.org/terms-of-use
Using detectors with higher quantum efficiency, such as an EM-CCD camera, together with multifocus excitation47–49 can fur-ther reduce the light exposure and extend the application ofthe technique to a wide range of biological samples.
The opening up of a new multiphoton regime for multicolorfluorescent protein imaging, which allows simultaneous single-and two-photon imaging, should continue to be optimized withfurther work and lead to a large number of simultaneous targetsin fluorescence imaging. This multiplexing limitation is prob-ably the primary drawback of fluorescence microscopy in thecurrent state of the art, since recent resolution advances in im-aging now allow exquisite spatial detail. The cellular featurespecificity that is the key role of probe chemistry is quite limitedby the ability to imaging multiple concurrent targets, and themethod we demonstrate here shows a practical method forbreaking this limitation. Although some issues still remain inour multicolor imaging technique, the high spatial resolutionand the low chromatic-aberration characteristic are additionallyadvantageous for cellular imaging. The advantages in our tech-nique can also boost confocal microscopy based techniques,such as fluorescence-lifetime imaging microscopy, fluorescencecorrelation spectroscopy, and fluorescence cross-correlationspectroscopy. On top of that, the visible-wavelength two-photonmode can be combined with laser scanning based super-resolu-tion techniques, such as stimulated emission depletion50 andsaturated excitation microscopy.51
AcknowledgmentsThe authors thank S. Kawano for his assistance in developingthe laser scanning and fluorescence unmixing software, S. Arakiand S. Mizobuchi for their assistance in plasmids preparation,and Professor Y. Inouye for the spectral measurement. Thisresearch is partially supported by the Japan Society for thePromotion of Science (JSPS) through the Funding Program forNext Generation World-Leading Researchers (NEXT Program),initiated by the Council for Science and Technology Policy(CSTP), by Photonics Advanced Research Center in OsakaUniversity to K.F., and by the Cooperative Research Programof Network Joint Research Center for Materials and Devices,Precursory Research for Embryonic Science from Japan Scienceand Technology Agency, and Grant-in-Aid for ScientificResearch on Innovative Areas “Spying minority in biologicalphenomena (No. 3306)” from MEXT to T. N.
References1. R. N. Day and M. W. Davidson, “The fluorescent protein palette: tools
for cellular imaging,” Chem. Soc. Rev. 38, 2887–2921 (2009).2. M. J. Booth et al., “Full spectrum filterless fluorescence microscopy,”
J. Microsc. 237(1), 103–109 (2010).3. S. Dorsch et al., “Analysis of receptor oligomerization by FRAP micros-
copy,” Nat. Methods 6(3), 225–230 (2009).4. P. Mahou et al., “Multicolor two-photon tissue imaging by wavelength
mixing,” Nat. Methods 9(8), 815–818 (2012).5. T. Kogure et al., “A fluorescent variant of a protein from the stony coral
Montipora facilitates dual-color single-laser fluorescence cross-correla-tion spectroscopy,” Nat. Biotechnol. 24(5), 577–581 (2006).
6. C. Xu et al., “Multiphoton fluorescence excitation: new spectral win-dows for biological nonlinear microscopy,” Proc. Natl. Acad. Sci.USA 93(20), 10763–10768 (1996).
7. W. R. Zipfel, R. M. Williams, and W. W. Webb, “Nonlinear magic:multiphoton microscopy in the biosciences,” Nat. Biotechnol. 21(11),1369–1377 (2003).
8. K. G. Heinze, A. Koltermann, and P. Schwille, “Simultaneous two-photon excitation of distinct labels for dual-color fluorescence
crosscorrelation analysis,” Proc. Natl. Acad. Sci. USA 97(19),10377–10382 (2000).
9. T. Kogure et al., “Fluorescence imaging using a fluorescent protein witha large Stokes shift,” Methods 45(3), 223–226 (2008).
10. S. E. Tillo et al., “A new approach to dual-color two-photon microscopywith fluorescent proteins,” BMC Biotechnol. 10(6), 6 (2010).
11. K. Wang et al., “Three-color femtosecond source for simultaneousexcitation of three fluorescent proteins in two-photon fluorescencemicroscopy,” Biomed. Opt. Express 3(9), 1972–1977 (2012).
12. M. T. Butko et al., “Simultaneous multiple-excitation multiphotonmicroscopy yields increased imaging sensitivity and specificity,”BMC Biotechnol. 11(20), 20 (2011).
13. W. Denk, J. H. Strickler, and W. W. Webb, “Two-photon laser scanningfluorescence microscopy,” Science 248(4951), 73–76 (1990).
14. F. Helmchen and W. Denk, “Deep tissue two-photon microscopy,”Nat. Methods 2(12), 932–940 (2005).
15. A. Diaspro, Confocal and Two-Photon Microscopy: Foundations,Applications, and Advances, Wiley-Liss, Inc., New York (2001).
16. G. Norris et al., “A promising new wavelength region for three-photonfluorescence microscopy of live cells,” J. Microsc. 246(3), 266–273(2012).
17. M. Drobizhev et al., “Two-photon absorption properties of fluorescentproteins,” Nat. Methods 8(5), 393–399 (2011).
18. M. Drobizhev et al., “Resonance enhancement of two-photon absorp-tion in fluorescent proteins,” J. Phys. Chem. B 111(50), 14051–14054(2007).
19. T. A. Smith et al., “Deep-UV confocal fluorescence imaging and super-resolution optical microscopy of biological samples,” J. Innov. Opt.Health Sci. 5(4), 1250025 (2012).
20. Y. Guo et al., “Noninvasive two-photon-excitation imaging of trypto-phan distribution in highly scattering biological tissues,” Opt. Commun.154(5–6), 383–389 (1998).
21. J. Balaji, R. Desai, and S. Maiti, “Live cell ultraviolet microscopy:a comparison between two- and three-photon excitation,” Mircosc.Res. Tech. 63(1), 67–71 (2004).
22. K. König et al., “Two-photon excited lifetime imaging of autofluores-cence in cells during UVA and NIR photostress,” J. Microsc. 183(3),197–204 (1996).
23. S. Maiti et al., “Measuring serotonin distribution in live cells with three-photon excitation,” Science 275(5299), 530–532 (1997).
24. W. R. Zipfel et al., “Live tissue intrinsic emission microscopyusing multiphoton-excited native fluorescence and second harmonicgeneration,” Proc. Natl. Acad. Sci. USA 100(12), 7075–7080(2003).
25. G. Norris et al., “Increased signals from short-wavelength-excitedfluorescent molecules using sub-Ti:sapphire wavelengths,” J. Microsc.248(2), 200–207 (2012).
26. F.-J. Kao, “The use of optical parametric oscillator for harmonic gen-eration and two-photon UV fluorescence microscopy,” Microsc. Res.Tech. 63(3), 175–181 (2004).
27. S. Quentmeier, S. Denicke, and K.-H. Gericke, “Two-color two-photonfluorescence laser scanning microscopy,” J. Fluoresc. 19(6), 1037–1043(2009).
28. O. Nakamura, “A two-photon scanning fluorescence microscope withdeep UV excitation and near UV detection,” Optik 100(4), 167–170(1995).
29. N. V. Visser et al., “Direct observation of resonance tryptophan-to-chromophore energy transfer in visible fluorescent proteins,” Biophys.Chem. 116(3), 207–212 (2005).
30. W. Tomosugi et al., “An ultramarine fluorescent protein with increasedphotostability and pH insensitivity,” Nat. Methods 6(5), 351–353(2009).
31. H. W. Ai et al., “Exploration of new chromophore structures leads tothe identification of improved blue fluorescent proteins,” Biochemistry46(20), 5904–5910 (2007).
32. T. Matsuda, A. Miyawaki, and T. Nagai, “Direct measurement of proteindynamics inside cells using a rationally designed photoconvertibleprotein,” Nat. Methods 5(4), 339–345 (2008).
33. H. W. Ai et al., “Directed evolution of a monomeric, bright and photo-stable version of Clavularia cyan fluorescent protein: structural charac-terization and applications in fluorescence imaging,” Biochem. J.400(3), 531–540 (2006).
Journal of Biomedical Optics 101202-10 October 2015 • Vol. 20(10)
Yamanaka et al.: Visible-wavelength two-photon excitation microscopy. . .
Downloaded From: https://www.spiedigitallibrary.org/journals/Journal-of-Biomedical-Optics on 25 Jun 2020Terms of Use: https://www.spiedigitallibrary.org/terms-of-use
34. R. Y. Tsien, “The green fluorescent protein,” Annu. Rev. Biochem. 67,509–544 (1998).
35. T. Zimmermann et al., “Spectral imaging and linear un-mixing enablesimproved FRET efficiency with a novel GFP2-YFP FRET pair,” FEBSLett. 531(2), 245–249 (2002).
36. J. R. Lakowicz, Principles of Fluorescence Spectroscopy, 3rd ed.,Springer Science+Business Media New York (2006).
37. S.-P. Jiang et al., “Two-photon excitation of proteins,” Chem. Phys. Lett.104(1), 109–111 (1984).
38. M. Gu, Principles of Three-Dimensional Imaging in ConfocalMicroscopes, World Scientific, Singapore (1996).
39. H. T. M. van der Voort and G. J. Brakenhoff, “3-D image formation inhigh-aperture fluorescence confocal microscopy: a numerical analysis,”J. Microsc. 158(1), 43–54 (1990).
40. S. Hell et al., “Aberrations in confocal fluorescence microscopy inducedby mismatches in refractive index,” J. Microsc. 169(3), 391–405(1993).
41. T. Nagai et al., “A variant of yellow fluorescent protein with fast andefficient maturation for cell-biological applications,” Nat. Biotechnol.20(1), 87–90 (2002).
42. M. V. Matz et al., “Fluorescent proteins from nonbioluminescentAnthozoa species,” Nat. Biotechnol. 17(10), 969–973 (1999).
43. N. C. Shaner et al., “Improved monomeric red, orange and yellowfluorescent proteins derived from Discosoma sp. red fluorescent pro-tein,” Nat. Biotechnol. 22(12), 1567–1572 (2004).
44. C. J. R. Sheppard and M. Gu, “Image formation in two-photon fluores-cence microscopy,” Optik 86(3), 104–106 (1990).
45. O. Nakamura, “Three-dimensional imaging characteristics of laserscan fluorescence microscopy: two-photon excitation vs. single-photonexcitation, Optik 93(1), 39–42 (1993).
46. L. Parma and N. Omenetto, “Fluorescence behavior of 7-hydroxycou-marine excited by one-photon and two-photon absorption by means ofa tunable dye laser,” Chem. Phys. Lett. 54(3), 544–546 (1978).
47. J. Bewersdorf, R. Pick, and S. W. Hell, “Multifocal multiphoton micros-copy,” Opt. Lett. 23(9), 655–657 (1998).
48. K. Fujita et al., “Confocal multipoint multiphoton excitation microscopewith microlens and pinhole arrays,” Opt. Commun. 174(1–4), 7–12(2000).
49. T. Shimozawa et al., “Improving spinning disk confocal microscopy bypreventing pinhole cross-talk for intravital imaging,” Proc. Natl. Acad.Sci. U. S. A 110(9), 3399–3404 (2013).
50. S. W. Hell and J. Wichmann, “Breaking the diffraction resolution limitby stimulated emission: stimulated-emission-depletion fluorescencemicroscopy,” Opt. Lett. 19(11), 780–782 (1994).
51. K. Fujita et al., “High-resolution confocal microscopy by saturatedexcitation of fluorescence,” Phys. Rev. Lett. 99(22), 228105 (2007).
Biographies of the authors are not available.
Journal of Biomedical Optics 101202-11 October 2015 • Vol. 20(10)
Yamanaka et al.: Visible-wavelength two-photon excitation microscopy. . .
Downloaded From: https://www.spiedigitallibrary.org/journals/Journal-of-Biomedical-Optics on 25 Jun 2020Terms of Use: https://www.spiedigitallibrary.org/terms-of-use
Top Related