![[377] Two-photon Excitation Fluorescence Microscopy](https://static.fdocuments.net/doc/165x107/577d1dd81a28ab4e1e8d18f5/377-two-photon-excitation-fluorescence-microscopy.jpg)
A Two-Photon Excitation Fluorescence Cross-Correlation ... · PDF fileA Two-Photon Excitation...
15
A Two-Photon Excitation Fluorescence Cross-Correlation Assay for a Model Ligand-Receptor Binding System Using Quantum Dots J. L. Swift, R. Heuff, and D. T. Cramb Department of Chemistry, University of Calgary, Calgary AB, T2N 1N4, Canada ABSTRACT Two-photon excitation fluorescence cross-correlation spectroscopy (TPE-XCS) is a very suitable method for studying interactions of two distinctly labeled fluorescent molecules. As such, it lends itself nicely to the study of ligand-receptor interactions. By labeling the ligand with one color of fluorescent dye and the receptor with another, it is possible to directly monitor ligand binding rather than inferring binding by monitoring downstream effects. One challenge of the TPE-XCS approach is that of separating the signal due to the receptor from that of the ligand. Using standard organic fluorescent labels there is almost inevitably spectral cross talk between the detection channels, which must be accounted for in TPE-XCS data analysis. However, using quantum dots as labels for both ligand and receptor this limitation can be alleviated, because of the dot’s narrower emission spectra. Using solely quantum dots as fluorescent labels is a novel approach to TPE-XCS, which may be generalizable to many pairs of interacting biomolecules after the proof of principle and the assessment of limitations presented here. Moreover, it is essential that relevant pharmacological parameters such as the equilibrium dissociation constant, K d , can be easily extracted from the XCS data with minimal processing. Herein, we present a modified expression for fractional occupancy based on the auto- and cross-correlation decays obtained from a well-defined ligand-receptor system. Nano- crystalline semiconductor quantum dots functionalized with biotin (l em ¼ 605 nm) and streptavidin (l em ¼ 525 nm) were used for which an average K d value of 0.30 6 0.04 3 10 ÿ9 M was obtained (cf. native system ;10 ÿ15 ). Additionally, the off-rate coefficient (k off ) for dissociation of the two quantum dots was determined as 5 3 10 ÿ5 s ÿ1 . This off-rate is slightly larger than for native biotin-streptavidin (5 3 10 ÿ6 s ÿ1 ); the bulky nature of the quantum dots and restricted motion/orientation of function- alized dots in solution can account for differences in the streptavidin-biotin mediated dot-dot binding compared with those for native streptavidin-biotin. INTRODUCTION Biochemical background Although ligand-receptor interactions have been historically difficult to quantify, recent advances in surface chemistry and fluorescence technology have provided intriguing possibili- ties for assay development. Recently, it was demonstrated that active receptor proteins can be adsorbed to several surfaces, including glass (1) to make fluorescence-based membrane protein microarrays. Using fluorescently labeled ligands, Fang et al. (1) were able to show binding to specific sites on microarrays. Additionally, they introduced a competition assay based on a nonfluorescent competitor ligand. This is excellent progress toward a heterogeneous ligand-receptor assay, but homogeneous assays (defined as one where the receptor is not bound to the microwell surface) for a specific ligand-receptor have been much slower to develop. A homogenous assay should be simple, not rely on filtration, and have the capability to deliver binding constants for new ligand entities. Fluorescence-based techniques can be used in this capacity, because fluorescence is inherently highly sensitive and can be selective by labeling ligand and receptor with different colored tags. Association between ligand and receptor could be monitored by fluorescence resonance energy transfer (FRET) or by quenching, but these are inherently high background techniques and suffer from the photochemical instability of organic fluorophores. How- ever, using nanocrystalline semiconductor quantum dots as labels in a two-photon excitation fluorescence cross- correlation spectroscopy (TPE-XCS) assay could mitigate these challenges. One can envisage a ligand-receptor binding assay where both entities are bound to nanoparticles, leading to the asso- ciation of the nanoparticles. The desirable stronger interac- tion of a new ligand with the receptor would be monitored by following the dissociation of nanoparticles. One would need to characterize the parameters of the ligand-receptor inter- actions and assess the influence of the nanoparticles on bind- ing. Once ligand-receptor binding between nanoparticles has been confirmed and quantified, the new ligand entities can be assessed by their ability to competitively knock the standard ligand-nanoparticles off the receptor nanoparticles. If the two nanoparticles emit light at different peak wave- lengths, then a successful test ligand would reduce the amount of associated nanoparticles with two-color emission. TPE-XCS can provide a zero-background approach to directly measure ligand receptor binding rather than monitor- ing the downstream effects of binding. In XCS, fluorescence intensities from two spectrally separate fluorophores are Submitted June 28, 2005, and accepted for publication October 27, 2005. Address reprint requests to Dr. David T. Cramb, Dept. of Chemistry, University of Calgary, 2500 University Dr. NW, Calgary AB, T2N 1N4, Canada. Tel.: 403-220-8138; Fax: 403-289-9488; E-mail: dcramb@ ucalgary.ca. Ó 2006 by the Biophysical Society 0006-3495/06/02/1396/15 $2.00 doi: 10.1529/biophysj.105.069526 1396 Biophysical Journal Volume 90 February 2006 1396–1410
Transcript of A Two-Photon Excitation Fluorescence Cross-Correlation ... · PDF fileA Two-Photon Excitation...
A Two-Photon Excitation Fluorescence Cross-Correlation Assay for aModel Ligand-Receptor Binding System Using Quantum Dots
J. L. Swift, R. Heuff, and D. T. CrambDepartment of Chemistry, University of Calgary, Calgary AB, T2N 1N4, Canada
ABSTRACT Two-photon excitation fluorescence cross-correlation spectroscopy (TPE-XCS) is a very suitable method forstudying interactions of two distinctly labeled fluorescent molecules. As such, it lends itself nicely to the study of ligand-receptorinteractions. By labeling the ligand with one color of fluorescent dye and the receptor with another, it is possible to directlymonitor ligand binding rather than inferring binding by monitoring downstream effects. One challenge of the TPE-XCS approachis that of separating the signal due to the receptor from that of the ligand. Using standard organic fluorescent labels there isalmost inevitably spectral cross talk between the detection channels, which must be accounted for in TPE-XCS data analysis.However, using quantum dots as labels for both ligand and receptor this limitation can be alleviated, because of the dot’snarrower emission spectra. Using solely quantum dots as fluorescent labels is a novel approach to TPE-XCS, which may begeneralizable to many pairs of interacting biomolecules after the proof of principle and the assessment of limitations presentedhere. Moreover, it is essential that relevant pharmacological parameters such as the equilibrium dissociation constant, Kd, canbe easily extracted from the XCS data with minimal processing. Herein, we present a modified expression for fractionaloccupancy based on the auto- and cross-correlation decays obtained from a well-defined ligand-receptor system. Nano-crystalline semiconductor quantum dots functionalized with biotin (lem ¼ 605 nm) and streptavidin (lem ¼ 525 nm) were usedfor which an average Kd value of 0.30 6 0.04 3 10�9 M was obtained (cf. native system ;10�15). Additionally, the off-ratecoefficient (koff) for dissociation of the two quantum dots was determined as 5 3 10�5 s�1. This off-rate is slightly larger than fornative biotin-streptavidin (5 3 10�6 s�1); the bulky nature of the quantum dots and restricted motion/orientation of function-alized dots in solution can account for differences in the streptavidin-biotin mediated dot-dot binding compared with those fornative streptavidin-biotin.
INTRODUCTION
Biochemical background
Although ligand-receptor interactions have been historically
difficult to quantify, recent advances in surface chemistry and
fluorescence technology have provided intriguing possibili-
ties for assay development. Recently, it was demonstrated that
active receptor proteins can be adsorbed to several surfaces,
including glass (1) to make fluorescence-based membrane
protein microarrays. Using fluorescently labeled ligands,
Fang et al. (1) were able to show binding to specific sites on
microarrays. Additionally, they introduced a competition
assay based on a nonfluorescent competitor ligand. This is
excellent progress toward a heterogeneous ligand-receptor
assay, but homogeneous assays (defined as one where the
receptor is not bound to the microwell surface) for a specific
ligand-receptor have been much slower to develop.
A homogenous assay should be simple, not rely on
filtration, and have the capability to deliver binding constants
for new ligand entities. Fluorescence-based techniques can
be used in this capacity, because fluorescence is inherently
highly sensitive and can be selective by labeling ligand and
receptor with different colored tags. Association between
ligand and receptor could be monitored by fluorescence
resonance energy transfer (FRET) or by quenching, but these
are inherently high background techniques and suffer from
the photochemical instability of organic fluorophores. How-
ever, using nanocrystalline semiconductor quantum dots
as labels in a two-photon excitation fluorescence cross-
correlation spectroscopy (TPE-XCS) assay could mitigate
these challenges.
One can envisage a ligand-receptor binding assay where
both entities are bound to nanoparticles, leading to the asso-
ciation of the nanoparticles. The desirable stronger interac-
tion of a new ligand with the receptor would be monitored by
following the dissociation of nanoparticles. One would need
to characterize the parameters of the ligand-receptor inter-
actions and assess the influence of the nanoparticles on bind-
ing. Once ligand-receptor binding between nanoparticles has
been confirmed and quantified, the new ligand entities can
be assessed by their ability to competitively knock the
standard ligand-nanoparticles off the receptor nanoparticles.
If the two nanoparticles emit light at different peak wave-
lengths, then a successful test ligand would reduce the
amount of associated nanoparticles with two-color emission.
TPE-XCS can provide a zero-background approach to
directly measure ligand receptor binding rather than monitor-
ing the downstream effects of binding. In XCS, fluorescence
intensities from two spectrally separate fluorophores are
Submitted June 28, 2005, and accepted for publication October 27, 2005.
Address reprint requests to Dr. David T. Cramb, Dept. of Chemistry,
University of Calgary, 2500 University Dr. NW, Calgary AB, T2N 1N4,
Canada. Tel.: 403-220-8138; Fax: 403-289-9488; E-mail: dcramb@
ucalgary.ca.
� 2006 by the Biophysical Society
0006-3495/06/02/1396/15 $2.00 doi: 10.1529/biophysj.105.069526
1396 Biophysical Journal Volume 90 February 2006 1396–1410
correlated. A cross correlation is only generated when the two
detection channels measure synchronous fluorescence fluctu-
ations. This suggests that the red and green labeled species
must be physically linked. Importantly, it is possible to work
at low concentrations with reasonable accuracy (2). Fluores-
cence contribution from individually labeled fluorophores in
solution time averages to zero, making XCS a zero back-
ground technique (3). Any change in the cross-correlation
signal is directly related to the ligand-receptor equilibrium
mixture, thus binding information can be directly extracted
from the fluorescence correlation and cross-correlation data
output. Two-photon excitation has the advantage over one-
photon XCS of facilitating simultaneous excitation of two or
more different fluorophores with a single laser, reduces out of
focus photodamage, eliminates the need for aligning two
different colored excitation laser beams, and removes the need
for pinholes on the detector side of the optical path.
There are a growing number of examples of correlation
spectroscopy used in the examination of ligand binding.
These studies have largely examined binding indirectly
through quantifying the loss of free fluorescently labeled
ligand in the presence of the receptor, both in solution and in
living cells. Examples of receptors recently examined
include 5-hydroxytryptamine type 3As receptor (4) A1-
adenosine receptor (5–6) and endothelin A receptor (7).
Also, in many of these studies ligand binding to a cell
receptor protein has been inferred through a drastic change in
the ligand’s diffusion behavior (5–7). In fact, it is only
possible to discern the binding of a fluorescently labeled
ligand through changes in the diffusion coefficient if the
relative molecular weight of the bound ligand is 4–8 times
greater than the free ligand (7). Therefore, it is in principle
more facile to use the correlation amplitudes (G(0)’sand GX(0)’s) derived from FCS and fluorescence cross-
correlation spectroscopy (XCS) because they are related
to the concentrations of the labeled species and can be used
to determine the concentration of bound species directly (2).
Although XCS has been applied to protein-protein (2),
DNA-DNA (8–9), and lipid-DNA (10) interactions and
vesicle fusion (11), XCS has been used to measure ligand-
receptor interactions (12) only once, likely because of the
challenges in fluorescently labeling receptor proteins. Tra-
ditionally, receptor proteins are labeled either using fluores-
cent protein constructs or via labeled antibodies. Fluorescent
proteins are challenging to work with in XCS because most
have a long red tail to their emission spectra, which leads to
significant cross talk in an XCS application. Detection filters
can be chosen to help eliminate this, but only at the sacrifice
of sensitivity, because a significant fraction of the emitted
photons would be rejected by the detection filter. Further-
more, the expression and purification of fluorescent protein
constructs is far from trivial. Hwang and Wohland (12) used
organic dye labeled streptavidin and biotin to show the proof
of principle for one-color single-photon excitation XCS for
ligand-receptor binding. In their communication, Hwang and
Wohland (12) also presented evidence for binding between
biotinylated fluorescein and a streptavidin functionalized
quantum dot (655 nm).
Luminescent semiconductor nanocrystals, or quantum
dots (QDs) have many potential advantages in the develop-
ment of TPE-XCS-based ligand-receptor binding assays.
QDs are now used as fluorescent labels for multicolor
imaging in biological samples (13). The major advantages of
QDs for imaging are: broad excitation spectra, narrow
Gaussian emission spectra, low photobleaching yield, and
large brightness. Additionally, QDs have several features
motivating their use as fluorescence labels for multiphoton
imaging in biological systems. Firstly, the particles them-
selves have significant two-photon absorption cross sections,
much larger than existing organic labels (14). Secondly, QDs
can be functionalized with a variety of biomolecules making
them compatible with a variety of environments and bio-
functionalized for nanosensor and fluorescence tagging ap-
plications (15–23). Water soluble QDs functionalized with
biotin or streptavidin are commercially available in a number
of emission wavelengths.
There are many potential advantages of a quantum dot
system for TPE-XCS. The first is the spectral characteristics
and brightness of quantum dot as labels allow interrogation
of ligand-receptor interactions at very low ligand concentra-
tions (approaching 0.1 nM). This physiologically relevant
concentration regime is not accessible using standard assays.
The narrow emission spectra of quantum dots provide
complete separation of signals for the ligand and receptor.
Thus, TPE-XCS becomes a truly background-free technique
using quantum dots. Also, it is important to determine the
limitations of quantum dots in binding assays. It is critical to
determine the degree to which the bulky quantum dots affect
the binding constants and kinetics of the system they label.
Therefore, in a study such as the current one, insight is
gained into the effect on the biomolecules because of
conjugation to the dot. Finally, the high sensitivity of the
quantum dot XCS approach could provide insight into the
ligand-receptor system itself.
The biotin-streptavidin system is a natural choice to study
ligand-receptor interactions using quantum dots, because it is
often used as a model for ligand-receptor binding (24,25). In
fact, this system represents a very tight binding interaction
with a high Kd (10�15) and a very slow off-rate for biotin (koff
;5 3 10�6 s�1) (24). Tetrameric streptavidin is composed
of four b-barrels and biotin fits into the end of each barrel
in a binding pocket. Thus, the binding ratio for free
streptavidin-biotin is 1:4. The main feature responsible for
tight binding is a surface loop, which then essentially closes
ensuring that the dissociation of biotin would come at a huge
energetic cost (24,25).
In this work, we describe a ligand-receptor binding assay
based on quantum dot technology and fluorescence corre-
lation spectroscopy. We have employed quantum dots
functionalized with streptavidin (QDS, lem ¼ 525 nm) or
Fluorescence Cross-Correlation Spectroscopy of Quantum Dot Binding 1397
Biophysical Journal 90(4) 1396–1410
biotin (QDB,lem¼ 605 nm) to follow the binding equilibrium
and kinetics for this model system. We have developed a
method of data analysis that is directly related to, and com-
parable with, conventional pharmacological theory. More-
over, we have used free biotin in a competition assay.We find
that conjugation to the quantum dot does affect the binding
constant and off-rate for the streptavidin-biotin interaction.
Background theory
At equilibrium it is possible to indirectly characterize the
receptor system by measuring the binding of particular
ligands. The simplest binding case (i.e., L 1 R � LR) is
described by the Hill-Langmuir theory and allows for the
experimental determination ofKd (dissociation constant). For
a ligand (L) and receptor (R) system the equilibrium can be
described in Eq. 1 (26):
PA ¼ CLR
CR 1CLR
(1a)
PA ¼ CL
Kd 1CL
; (1b)
where PA, or fractional occupancy, is defined as the molar
ratio of occupied receptor, CLR, to the total receptor con-
centration, CR 1 CLR (Eq. 1a). As will be shown below, PA
can be calculated directly using variables determined from
fitting to the cross-correlation and autocorrelation data. By
plotting the fractional occupancy versus the concentration of
added ligand, CL, it is possible to determine Kd using Eq. 1b
(26). In the literature, this is the most common method of
presenting binding data. Equation 1b will be used to examine
general trends in the data, but not to determine the value of
Kd for the quantum dot system. The assumptions for the
model represented by Eq. 1b include a 1:1 binding ratio, and
following the completion of the titration, the concentration of
the ligand far exceeds the concentration of the receptor.
Maximal changes in PA occur when the concentration of the
ligand receptor complex is equal to the concentration of free
receptors in the sample. For the quantum dot system used in
this study, the first assumption may prove to be invalid.
Because there are multiple receptors and multiple ligands
on each quantum dot, one may need to consider a multiple-
ligand equilibrium approach to binding. Thus, for n biotiny-
lated quantum dots (QDB) associating with a streptavidin
functionalized quantum dot (QDS) we have;
nQDB 1QDS5ðQDBÞnQDS; (2)
where n can be a whole number or a fraction, and possibly
,1, if multiple QDS bind to 1 QDB. It can be shown that
a standard analysis of this equilibrium produces the Hill
equation for multiligand binding (27):
lnPA
1� PA
� �¼ n lnðCBÞ � lnK9d; (3)
where PA is the fractional occupancy of available binding
sites on QDS, n is the ratio of QDB/QBS, CB is the con-
centration of biotinylated quantum dots, and K9d is the
dissociation constant for the equilibrium presented in Eq. 2.
Additionally, in the absence of cooperativity, taking the nthroot of the dissociation constant, K9d, gives the dissociation
constant, Kd, for the formation of an individual ligand-
receptor complex. In the case where n ¼ 1, Eq. 3 is
analogous to Eq. 1b.
FCS and XCS data analysis
Fluorescence correlation and cross-correlation spectroscopy
is based on the analysis of temporal intensity fluctuations
@F(t) in fluorescence about the time averages fluorescence
intensity, ÆFæ, from emitters in a well-defined interrogation
volume. In the system used presently, the fluorescence
signals from QDS and QDB are spectrally separable. In
general, the normalized fluorescence correlation function is
defined by:
GijðtÞ ¼ Æ@FiðtÞ@Fjðt1 tÞæÆFiæÆFjæ
: (4)
If we consider two emitting species, QDS and QDB, then
Gii(t) and Gjj(t) represent the autocorrelation functions for
the two species and Gij(t) is the cross-correlation function
between the signal from the two detection channels (one
channel for QDS and one for QDB). For bookkeeping, we in-
troduce the specific superscripts, S and B, to represent the
correlation functions relative to QDS and QDB.
Autocorrelation decays were modeled assuming a Gaus-
sian TPE volume using the following equation (10,11):
GSðBÞðtÞ ¼ GSðBÞð0Þ 118DSðBÞt
r2
0
� ��1
118DSðBÞt
z2
0
� ��½
;
(5)
where t is the lagtime, D is the diffusion constant of the
quantum dot, r0 is the laser beam radius at its focus, and z0 isthe 1/e2 radius in the z-direction. The TPE excitation volume
(V ¼ (p/2)3/2 r02z0) was calibrated by measuring the
autocorrelation decay for a 100-nM solution of Alexa 488
(D ¼ 2.8 3 10�10 m2/s) in 50 mM Tris-HCl, pH 8.0. The
excitation volume was found to be 3.3 fL (r0¼ 7.63 10�7 m
and z0 ¼ 3.0 3 10�6 m). The long working distance
objective used in this study makes for a slightly larger
excitation volume than with more typical high numerical
aperture lenses. In the case of bound dots, the diffusion
coefficient in Eq. 5 would represent that of the bound
species. Assuming no fluorescence cross talk between the
channels (as will be demonstrated in Fig. 2), the G(0) willchange according to Eq. 7 below.
Cross-correlation decays were modeled as above using the
following equation (10,11):
1398 Swift et al.
Biophysical Journal 90(4) 1396–1410
GXðtÞ ¼ GXð0Þ 118DSBt
r2
0
� ��1
118DSBt
z2
0
� ��½
; (6)
where the subscript SB represents streptavidin and biotin
quantum dots that are physically bound together and thus
dual-color labeled. Nonlinear least squares fitting to the data
was accomplished using the software package, Origin. The
equations contain no terms to account for quantum dot
blinking, the effects of which were minimized here by keep-
ing the excitation rates low. Also, we observed no fluores-
cence resonance energy transfer or fluorescence quenching
in the case of bound quantum dot systems.
It will be demonstrated that it is possible, simply using
G(0)’s, to calculate the fractional occupancy, PA. In the
absence of cross talk between the two detection channels, the
correlation and cross-correlation amplitudes are given by (8):
GSðBÞð0Þ ¼ ÆCSðBÞæ1 ÆCSBæNA VeffðÆCSðBÞæ1 ÆCSBæÞ2
; (7)
and
GSBð0Þ ¼ ÆCSBæNA VeffðÆCSæ1 ÆCSBæÞðÆCBæ1 ÆCSBæÞ; (8)
where, NA is Avogadro’s number, Veff is the effective TPE
volume, ÆCSBæ represents the time-averaged concentration of
dually labeled specie, and ÆCS(B)æ represents the time-
averaged concentration of streptavidin (or biotin) function-
alized quantum dots. Recall that fractional occupancy is
described as the fraction of occupied receptors (ÆCSBæ) overthe total number of receptors in the sample (ÆCSBæ 1 ÆCSæ).The expression that describes this relation in terms of con-
centrations of dually labeled, or occupied receptors and
unoccupied receptors are given by Eq. 9:
PA ¼ ÆCSBæÆCSæ1 ÆCSBæ
: (9)
This relation can be expressed in terms of G(0) values asshown in Eq. 10 and the resulting expression for fractional
occupancy is given by Eq. 11:
ÆCSBæÆCSæ1 ÆCSBæ
¼ GSBð0Þ � NA VeffGSð0ÞNAVeffGSð0Þ � GBð0Þ ; (10)
therefore,
PA ¼ ÆCSBæÆCSæ1 ÆCSBæ
¼ GSBð0ÞGBð0Þ : (11)
MATERIALS AND METHODS
Biotinylated and streptavidin conjugated quantum dots (QDot 605 and QDot
525, respectively) were purchased from Quantum Dot (Hayward, CA) and
used as delivered. Stock solutions were stored at 6�C and diluted to desired
concentrations using a borate buffer pH 8.3. Before dilution the stock was
gently vortexed for 5 min to uniformly disperse the QDots. The diluted
solutions of biotin (20 nM) and streptavidin (;1–2 nM) quantum dots were
again vortexed to obtain maximum dispersion. To characterize fully the
titration curve intermediate stock solutions of 10 and 5 nM QDB were also
prepared. For the titration experiments, 250 mL of the streptavidin solution
was placed in a homebuilt quartz sample chamber and placed on a Zeiss
Axiovert 200 (Mississauga, ON) microscope. A series of autocorrelation
decays were collected for 30, 60, 120, and 300 s. This was done to verify
adequate dispersion and limited aggregation of quantumdots in the sample. A
cross-correlation scan was collected in the absence of biotin to ensure no
green emission from the streptavidin was being detected in the red channel.
Once the streptavidin sample had been fully characterized, biotinylated
quantum dots were titrated into the sample in aliquots of 0.5–3 mL at a time,
until 25 mL of the 5–20 nM biotinylated QDots solution had been added.
Following each addition, the sample was agitated and left to equilibrate for
5 min before binding data were collected. Immediately following the
equilibration period, red and green autocorrelation decays were collected
followed by cross-correlation decays. Importantly, the total volume of biotin
added did not exceed 10% of the total volume to ensure that the concentration
of streptavidin (receptors) does not change substantially because of dilution.
Competition assays used unlabeled 99% pure d-biotin (Sigma Aldrich,
Oakville, ON). A stock solution of 1.61 3 10�3 M in pure water and stored
at 6�Cwas used. A further dilution to 1.613 10�7 M was made immediately
before each titration. Solutions were vortexed on a low to medium setting to
achieve maximum dispersion of d-biotin before sampling.
Samples were excited using 780-nm, 100-fs laser light from a Spectra
Physics (Palo Alto, CA) Tsunami laser operating at 82 MHz. The laser
power was attenuated to 20 mW with a neutral density filter to avoid
photodamage. QDot 525 and QDot 605 both have appreciable two-photon
excitation probability at 780 nm. The laser beam was expanded using a
Galilean telescope to slightly overfill the back aperture of a 403, 0.9 N.A.
Zeiss objective lens (working distance ¼ 2 mm) mounted on a Zeiss
Axiovert 200 fluorescence microscope. TPE-fluorescence was collected by
the same objective lens, passed through a broad bandpass filter to remove
laser light (Omega Optical, XF3100, Brattleboro, VT) and reflected off a
dichroic optic (Chroma, 700DCSPXR, Rockingham, VT) and through a tube
lens in the side port of the microscope. A second dichroic optic (Chroma
565DCLP) is used to separate the red and green fluorescence. The spectrally
separated light passes through bandpass filters (Chroma, E590LPv2 and
D535/503 for the red and green emission, respectively) and is coupled into
optical fibers located at the focus of the tube lens. Using the optical fibers,
the fluorescence is detected by two Si avalanche photodiodes (APDs,
Perkin-Elmer, SPCQ-200, Fremont, CA). The output of the APDs was
analyzed using a correlator card (ALV-5000, Langen, Germany).
RESULTS
To understand and quantify the binding between quantum
dots functionalized with streptavidin (QDS) and biotinylated
quantum dots (QDB), a titration of QDS with QDB was per-
formed as described in the Materials and Methods section.
Using TPE-FCS and TPE-XCS G(0) values and diffusion
coefficients for red, green, and dually labeled species were
determined. The G(0) values could then be used (Eq. 11)
to calculate the fractional occupancy for each titration point.
FCS of quantum dots
Control experiments that examine the behavior of GB(0)
and GS(0) under the titration conditions, were carried out. A
typical series of autocorrelation decays for a range of QDB
concentrations are given in Fig. 1. The solutions represented
in this figure were created by adding small aliquots (1–3 mL)of stock QDB solution (20 nM) into 250 mL of buffer. The
Fluorescence Cross-Correlation Spectroscopy of Quantum Dot Binding 1399
Biophysical Journal 90(4) 1396–1410
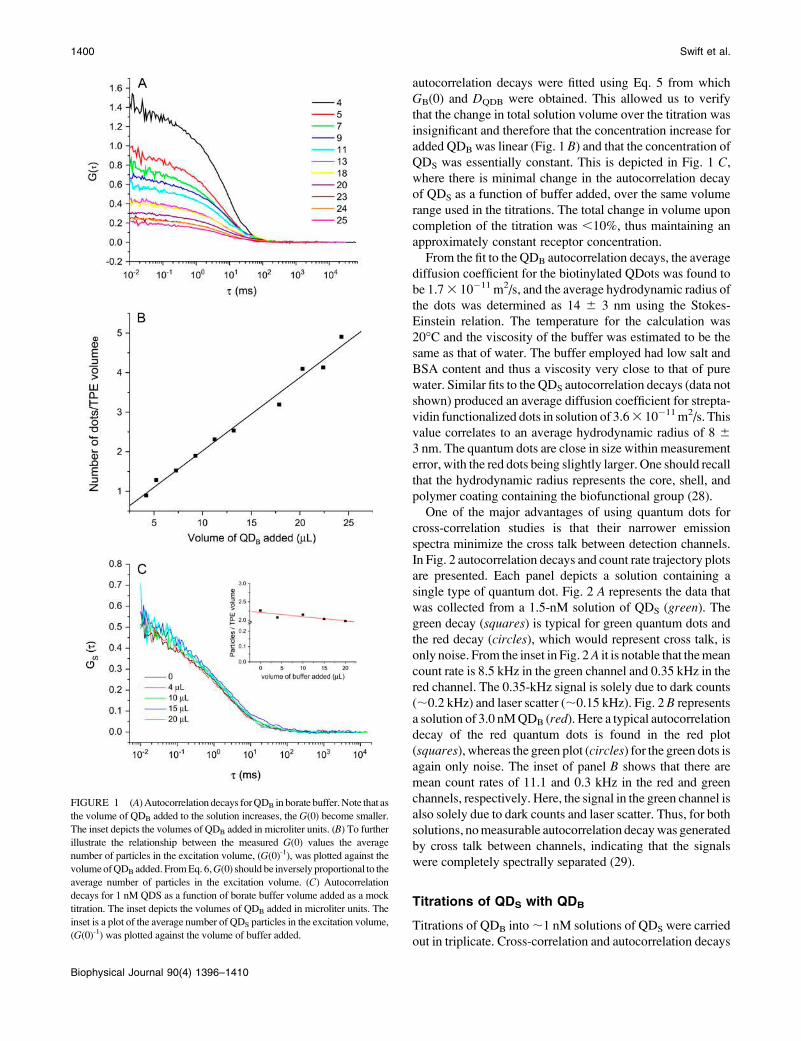
autocorrelation decays were fitted using Eq. 5 from which
GB(0) and DQDB were obtained. This allowed us to verify
that the change in total solution volume over the titration was
insignificant and therefore that the concentration increase for
added QDB was linear (Fig. 1 B) and that the concentration ofQDS was essentially constant. This is depicted in Fig. 1 C,where there is minimal change in the autocorrelation decay
of QDS as a function of buffer added, over the same volume
range used in the titrations. The total change in volume upon
completion of the titration was ,10%, thus maintaining an
approximately constant receptor concentration.
From the fit to the QDB autocorrelation decays, the average
diffusion coefficient for the biotinylated QDots was found to
be 1.73 10�11 m2/s, and the average hydrodynamic radius of
the dots was determined as 14 6 3 nm using the Stokes-
Einstein relation. The temperature for the calculation was
20�C and the viscosity of the buffer was estimated to be the
same as that of water. The buffer employed had low salt and
BSA content and thus a viscosity very close to that of pure
water. Similar fits to the QDS autocorrelation decays (data not
shown) produced an average diffusion coefficient for strepta-
vidin functionalized dots in solution of 3.63 10�11m2/s. This
value correlates to an average hydrodynamic radius of 8 63 nm. The quantum dots are close in size within measurement
error, with the red dots being slightly larger. One should recall
that the hydrodynamic radius represents the core, shell, and
polymer coating containing the biofunctional group (28).
One of the major advantages of using quantum dots for
cross-correlation studies is that their narrower emission
spectra minimize the cross talk between detection channels.
In Fig. 2 autocorrelation decays and count rate trajectory plots
are presented. Each panel depicts a solution containing a
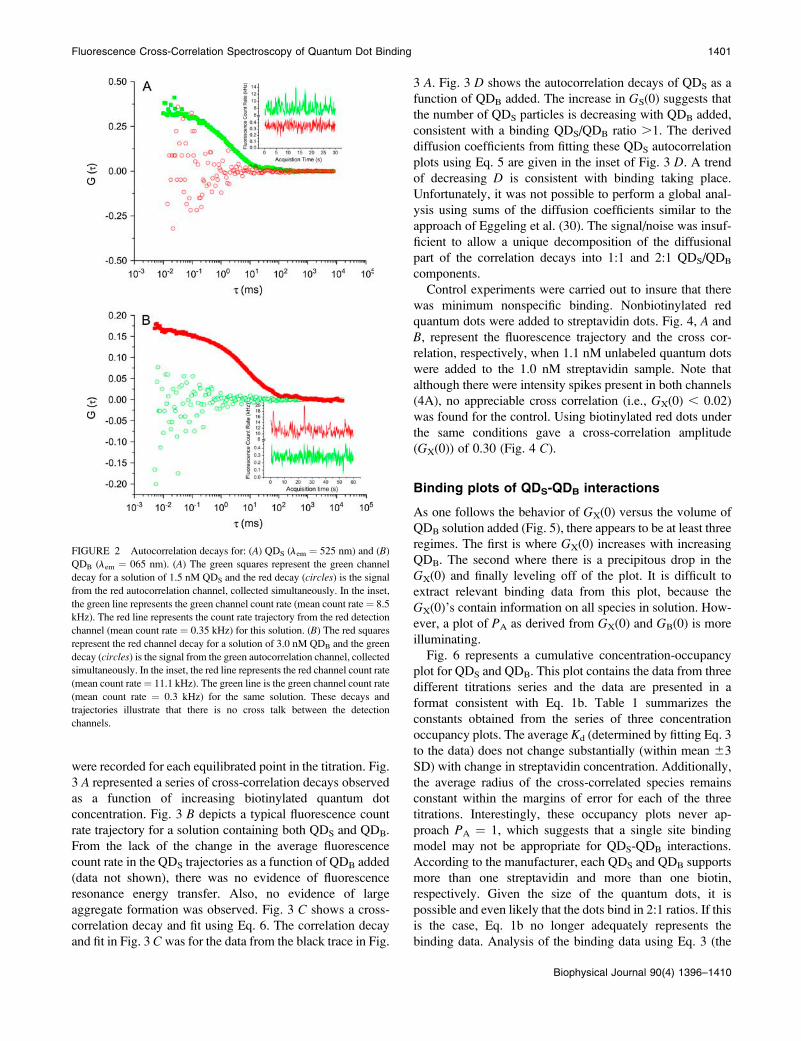
single type of quantum dot. Fig. 2 A represents the data that
was collected from a 1.5-nM solution of QDS (green). Thegreen decay (squares) is typical for green quantum dots and
the red decay (circles), which would represent cross talk, is
only noise. From the inset in Fig. 2A it is notable that themean
count rate is 8.5 kHz in the green channel and 0.35 kHz in the
red channel. The 0.35-kHz signal is solely due to dark counts
(;0.2 kHz) and laser scatter (;0.15 kHz). Fig. 2 B represents
a solution of 3.0 nMQDB (red). Here a typical autocorrelationdecay of the red quantum dots is found in the red plot
(squares), whereas the green plot (circles) for the green dots isagain only noise. The inset of panel B shows that there are
mean count rates of 11.1 and 0.3 kHz in the red and green
channels, respectively. Here, the signal in the green channel is
also solely due to dark counts and laser scatter. Thus, for both
solutions, nomeasurable autocorrelation decaywas generated
by cross talk between channels, indicating that the signals
were completely spectrally separated (29).
Titrations of QDS with QDB
Titrations of QDB into;1 nM solutions of QDS were carried
out in triplicate. Cross-correlation and autocorrelation decays
FIGURE 1 (A)Autocorrelation decays forQDB in borate buffer.Note that as
the volume of QDB added to the solution increases, the G(0) become smaller.
The inset depicts the volumes of QDB added in microliter units. (B) To furtherillustrate the relationship between the measured G(0) values the average
number of particles in the excitation volume, (G(0)-1), was plotted against the
volumeofQDB added. FromEq. 6,G(0) should be inversely proportional to the
average number of particles in the excitation volume. (C) Autocorrelationdecays for 1 nM QDS as a function of borate buffer volume added as a mock
titration. The inset depicts the volumes of QDB added in microliter units. The
inset is a plot of the average number of QDS particles in the excitation volume,
(G(0)-1) was plotted against the volume of buffer added.
1400 Swift et al.
Biophysical Journal 90(4) 1396–1410
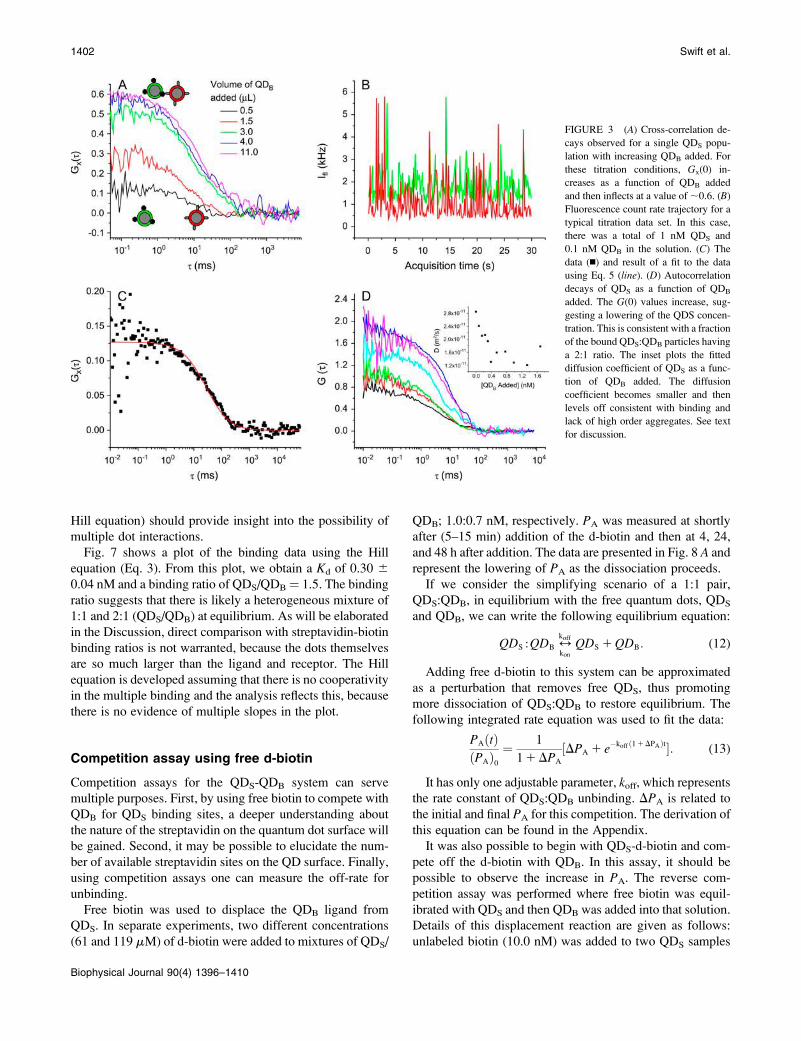
were recorded for each equilibrated point in the titration. Fig.
3 A represented a series of cross-correlation decays observed
as a function of increasing biotinylated quantum dot
concentration. Fig. 3 B depicts a typical fluorescence count
rate trajectory for a solution containing both QDS and QDB.
From the lack of the change in the average fluorescence
count rate in the QDS trajectories as a function of QDB added
(data not shown), there was no evidence of fluorescence
resonance energy transfer. Also, no evidence of large
aggregate formation was observed. Fig. 3 C shows a cross-
correlation decay and fit using Eq. 6. The correlation decay
and fit in Fig. 3 Cwas for the data from the black trace in Fig.
3 A. Fig. 3 D shows the autocorrelation decays of QDS as a
function of QDB added. The increase in GS(0) suggests that
the number of QDS particles is decreasing with QDB added,
consistent with a binding QDS/QDB ratio .1. The derived
diffusion coefficients from fitting these QDS autocorrelation
plots using Eq. 5 are given in the inset of Fig. 3 D. A trend
of decreasing D is consistent with binding taking place.
Unfortunately, it was not possible to perform a global anal-
ysis using sums of the diffusion coefficients similar to the
approach of Eggeling et al. (30). The signal/noise was insuf-
ficient to allow a unique decomposition of the diffusional
part of the correlation decays into 1:1 and 2:1 QDS/QDB
components.
Control experiments were carried out to insure that there
was minimum nonspecific binding. Nonbiotinylated red
quantum dots were added to streptavidin dots. Fig. 4, A and
B, represent the fluorescence trajectory and the cross cor-
relation, respectively, when 1.1 nM unlabeled quantum dots
were added to the 1.0 nM streptavidin sample. Note that
although there were intensity spikes present in both channels
(4A), no appreciable cross correlation (i.e., GX(0) , 0.02)
was found for the control. Using biotinylated red dots under
the same conditions gave a cross-correlation amplitude
(GX(0)) of 0.30 (Fig. 4 C).
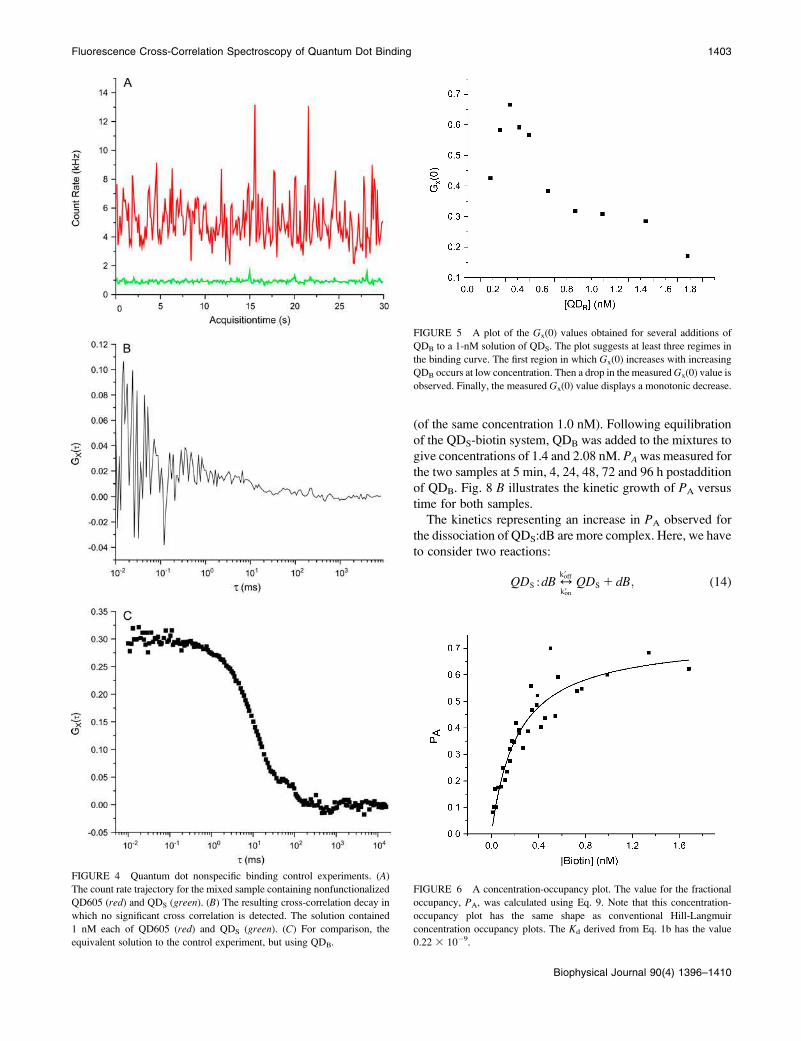
Binding plots of QDS-QDB interactions
As one follows the behavior of GX(0) versus the volume of
QDB solution added (Fig. 5), there appears to be at least three
regimes. The first is where GX(0) increases with increasing
QDB. The second where there is a precipitous drop in the
GX(0) and finally leveling off of the plot. It is difficult to
extract relevant binding data from this plot, because the
GX(0)’s contain information on all species in solution. How-
ever, a plot of PA as derived from GX(0) and GB(0) is more
illuminating.
Fig. 6 represents a cumulative concentration-occupancy
plot for QDS and QDB. This plot contains the data from three
different titrations series and the data are presented in a
format consistent with Eq. 1b. Table 1 summarizes the
constants obtained from the series of three concentration
occupancy plots. The average Kd (determined by fitting Eq. 3
to the data) does not change substantially (within mean 63
SD) with change in streptavidin concentration. Additionally,
the average radius of the cross-correlated species remains
constant within the margins of error for each of the three
titrations. Interestingly, these occupancy plots never ap-
proach PA ¼ 1, which suggests that a single site binding
model may not be appropriate for QDS-QDB interactions.
According to the manufacturer, each QDS and QDB supports
more than one streptavidin and more than one biotin,
respectively. Given the size of the quantum dots, it is
possible and even likely that the dots bind in 2:1 ratios. If this
is the case, Eq. 1b no longer adequately represents the
binding data. Analysis of the binding data using Eq. 3 (the
FIGURE 2 Autocorrelation decays for: (A) QDS (lem ¼ 525 nm) and (B)QDB (lem ¼ 065 nm). (A) The green squares represent the green channel
decay for a solution of 1.5 nM QDS and the red decay (circles) is the signal
from the red autocorrelation channel, collected simultaneously. In the inset,
the green line represents the green channel count rate (mean count rate¼ 8.5
kHz). The red line represents the count rate trajectory from the red detection
channel (mean count rate ¼ 0.35 kHz) for this solution. (B) The red squares
represent the red channel decay for a solution of 3.0 nM QDB and the green
decay (circles) is the signal from the green autocorrelation channel, collected
simultaneously. In the inset, the red line represents the red channel count rate
(mean count rate¼ 11.1 kHz). The green line is the green channel count rate
(mean count rate ¼ 0.3 kHz) for the same solution. These decays and
trajectories illustrate that there is no cross talk between the detection
channels.
Fluorescence Cross-Correlation Spectroscopy of Quantum Dot Binding 1401
Biophysical Journal 90(4) 1396–1410
Hill equation) should provide insight into the possibility of
multiple dot interactions.
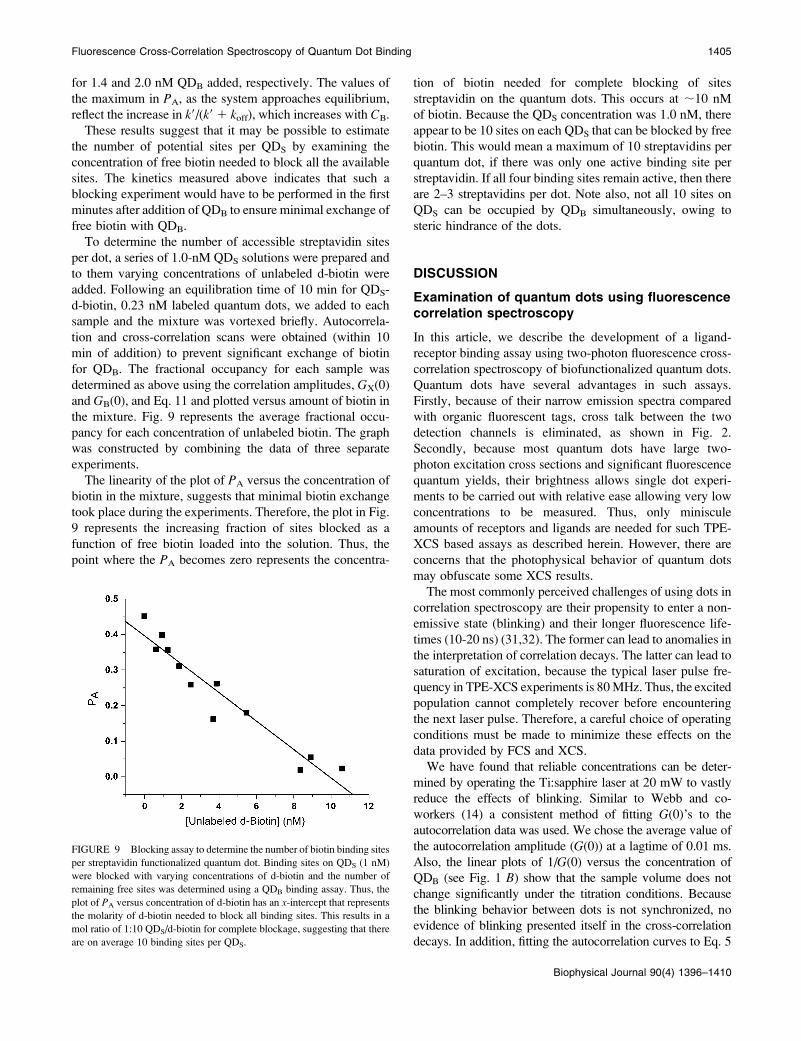
Fig. 7 shows a plot of the binding data using the Hill
equation (Eq. 3). From this plot, we obtain a Kd of 0.30 60.04 nM and a binding ratio of QDS/QDB¼ 1.5. The binding
ratio suggests that there is likely a heterogeneous mixture of
1:1 and 2:1 (QDS/QDB) at equilibrium. As will be elaborated
in the Discussion, direct comparison with streptavidin-biotin
binding ratios is not warranted, because the dots themselves
are so much larger than the ligand and receptor. The Hill
equation is developed assuming that there is no cooperativity
in the multiple binding and the analysis reflects this, because
there is no evidence of multiple slopes in the plot.
Competition assay using free d-biotin
Competition assays for the QDS-QDB system can serve
multiple purposes. First, by using free biotin to compete with
QDB for QDS binding sites, a deeper understanding about
the nature of the streptavidin on the quantum dot surface will
be gained. Second, it may be possible to elucidate the num-
ber of available streptavidin sites on the QD surface. Finally,
using competition assays one can measure the off-rate for
unbinding.
Free biotin was used to displace the QDB ligand from
QDS. In separate experiments, two different concentrations
(61 and 119 mM) of d-biotin were added to mixtures of QDS/
QDB; 1.0:0.7 nM, respectively. PA was measured at shortly
after (5–15 min) addition of the d-biotin and then at 4, 24,
and 48 h after addition. The data are presented in Fig. 8 A and
represent the lowering of PA as the dissociation proceeds.
If we consider the simplifying scenario of a 1:1 pair,
QDS:QDB, in equilibrium with the free quantum dots, QDS
and QDB, we can write the following equilibrium equation:
QDS :QDB 4koff
konQDS 1QDB: (12)
Adding free d-biotin to this system can be approximated
as a perturbation that removes free QDS, thus promoting
more dissociation of QDS:QDB to restore equilibrium. The
following integrated rate equation was used to fit the data:
PAðtÞðPAÞ0
¼ 1
11DPA
½DPA 1 e�koff ð11DPAÞt�: (13)
It has only one adjustable parameter, koff, which representsthe rate constant of QDS:QDB unbinding. DPA is related to
the initial and final PA for this competition. The derivation of
this equation can be found in the Appendix.
It was also possible to begin with QDS-d-biotin and com-
pete off the d-biotin with QDB. In this assay, it should be
possible to observe the increase in PA. The reverse com-
petition assay was performed where free biotin was equil-
ibrated with QDS and then QDB was added into that solution.
Details of this displacement reaction are given as follows:
unlabeled biotin (10.0 nM) was added to two QDS samples
FIGURE 3 (A) Cross-correlation de-
cays observed for a single QDS popu-
lation with increasing QDB added. For
these titration conditions, Gx(0) in-
creases as a function of QDB added
and then inflects at a value of;0.6. (B)
Fluorescence count rate trajectory for a
typical titration data set. In this case,
there was a total of 1 nM QDS and
0.1 nM QDB in the solution. (C) The
data (n) and result of a fit to the data
using Eq. 5 (line). (D) Autocorrelation
decays of QDS as a function of QDB
added. The G(0) values increase, sug-
gesting a lowering of the QDS concen-
tration. This is consistent with a fraction
of the bound QDS:QDB particles having
a 2:1 ratio. The inset plots the fitted
diffusion coefficient of QDS as a func-
tion of QDB added. The diffusion
coefficient becomes smaller and then
levels off consistent with binding and
lack of high order aggregates. See text
for discussion.
1402 Swift et al.
Biophysical Journal 90(4) 1396–1410
(of the same concentration 1.0 nM). Following equilibration
of the QDS-biotin system, QDB was added to the mixtures to
give concentrations of 1.4 and 2.08 nM. PAwas measured for
the two samples at 5 min, 4, 24, 48, 72 and 96 h postaddition
of QDB. Fig. 8 B illustrates the kinetic growth of PA versus
time for both samples.
The kinetics representing an increase in PA observed for
the dissociation of QDS:dB are more complex. Here, we have
to consider two reactions:
QDS :dB4k9off
k9onQDS 1 dB; (14)
FIGURE 5 A plot of the Gx(0) values obtained for several additions of
QDB to a 1-nM solution of QDS. The plot suggests at least three regimes in
the binding curve. The first region in which Gx(0) increases with increasing
QDB occurs at low concentration. Then a drop in the measuredGx(0) value is
observed. Finally, the measured Gx(0) value displays a monotonic decrease.
FIGURE 6 A concentration-occupancy plot. The value for the fractional
occupancy, PA, was calculated using Eq. 9. Note that this concentration-
occupancy plot has the same shape as conventional Hill-Langmuir
concentration occupancy plots. The Kd derived from Eq. 1b has the value
0.22 3 10�9.
FIGURE 4 Quantum dot nonspecific binding control experiments. (A)The count rate trajectory for the mixed sample containing nonfunctionalized
QD605 (red) and QDS (green). (B) The resulting cross-correlation decay in
which no significant cross correlation is detected. The solution contained
1 nM each of QD605 (red) and QDS (green). (C) For comparison, the
equivalent solution to the control experiment, but using QDB.
Fluorescence Cross-Correlation Spectroscopy of Quantum Dot Binding 1403
Biophysical Journal 90(4) 1396–1410
QDS 1QDB 4kon
koff
QDS :QDB: (15)
If we assume the free QDS is rapidly consumed by the free
QDB, then the reverse reaction in Eq. 15 can be neglected.
Therefore, the forward reaction of 14 is the rate-limiting step.
We can then write the following rate law:
PAðtÞ ¼ k9
k91 koff1� 1� k9off
k9
� �e�k9off t
� �; (16)
where k9 ¼ konCB. This equation essentially represents an
exponential increase in QDS:QDB as QDS:dB dissociates.
It has a limitation at long time in that this approach takes
into account only 1:1 QDS:QDB association. Nevertheless,
this approach should be sufficient to obtain an estimate of
the QDS:dB off-rate constant, k9off. The derivation of this
equation can also be found in the Appendix.
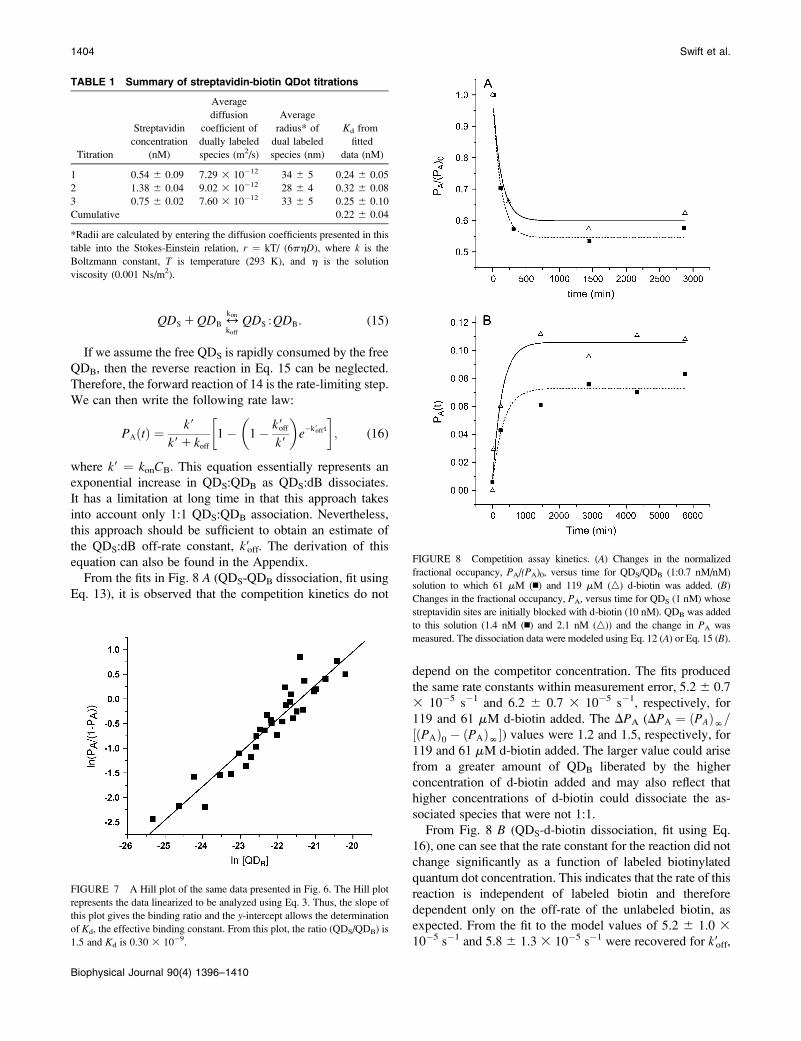
From the fits in Fig. 8 A (QDS-QDB dissociation, fit using
Eq. 13), it is observed that the competition kinetics do not
depend on the competitor concentration. The fits produced
the same rate constants within measurement error, 5.2 6 0.7
3 10�5 s�1 and 6.2 6 0.7 3 10�5 s�1, respectively, for
119 and 61 mM d-biotin added. The DPA (DPA ¼ ðPAÞN=½ðPAÞ0 � ðPAÞN�) values were 1.2 and 1.5, respectively, for
119 and 61 mM d-biotin added. The larger value could arise
from a greater amount of QDB liberated by the higher
concentration of d-biotin added and may also reflect that
higher concentrations of d-biotin could dissociate the as-
sociated species that were not 1:1.
From Fig. 8 B (QDS-d-biotin dissociation, fit using Eq.
16), one can see that the rate constant for the reaction did not
change significantly as a function of labeled biotinylated
quantum dot concentration. This indicates that the rate of this
reaction is independent of labeled biotin and therefore
dependent only on the off-rate of the unlabeled biotin, as
expected. From the fit to the model values of 5.2 6 1.0 310�5 s�1 and 5.8 6 1.3 3 10�5 s�1 were recovered for k9off,
TABLE 1 Summary of streptavidin-biotin QDot titrations
Titration
Streptavidin
concentration
(nM)
Average
diffusion
coefficient of
dually labeled
species (m2/s)
Average
radius* of
dual labeled
species (nm)
Kd from
fitted
data (nM)
1 0.54 6 0.09 7.29 3 10�12 34 6 5 0.24 6 0.05
2 1.38 6 0.04 9.02 3 10�12 28 6 4 0.32 6 0.08
3 0.75 6 0.02 7.60 3 10�12 33 6 5 0.25 6 0.10
Cumulative 0.22 6 0.04
*Radii are calculated by entering the diffusion coefficients presented in this
table into the Stokes-Einstein relation, r ¼ kT/ (6phD), where k is the
Boltzmann constant, T is temperature (293 K), and h is the solution
viscosity (0.001 Ns/m2).
FIGURE 7 A Hill plot of the same data presented in Fig. 6. The Hill plot
represents the data linearized to be analyzed using Eq. 3. Thus, the slope of
this plot gives the binding ratio and the y-intercept allows the determination
of Kd, the effective binding constant. From this plot, the ratio (QDS/QDB) is
1.5 and Kd is 0.30 3 10�9.
FIGURE 8 Competition assay kinetics. (A) Changes in the normalized
fractional occupancy, PA/(PA)0, versus time for QDS/QDB (1:0.7 nM/nM)
solution to which 61 mM (n) and 119 mM (n) d-biotin was added. (B)
Changes in the fractional occupancy, PA, versus time for QDS (1 nM) whose
streptavidin sites are initially blocked with d-biotin (10 nM). QDB was added
to this solution (1.4 nM (n) and 2.1 nM (n)) and the change in PA was
measured. The dissociation data were modeled using Eq. 12 (A) or Eq. 15 (B).
1404 Swift et al.
Biophysical Journal 90(4) 1396–1410
for 1.4 and 2.0 nM QDB added, respectively. The values of
the maximum in PA, as the system approaches equilibrium,
reflect the increase in k9/(k9 1 koff), which increases with CB.
These results suggest that it may be possible to estimate
the number of potential sites per QDS by examining the
concentration of free biotin needed to block all the available
sites. The kinetics measured above indicates that such a
blocking experiment would have to be performed in the first
minutes after addition of QDB to ensure minimal exchange of
free biotin with QDB.
To determine the number of accessible streptavidin sites
per dot, a series of 1.0-nM QDS solutions were prepared and
to them varying concentrations of unlabeled d-biotin were
added. Following an equilibration time of 10 min for QDS-
d-biotin, 0.23 nM labeled quantum dots, we added to each
sample and the mixture was vortexed briefly. Autocorrela-
tion and cross-correlation scans were obtained (within 10
min of addition) to prevent significant exchange of biotin
for QDB. The fractional occupancy for each sample was
determined as above using the correlation amplitudes, GX(0)
and GB(0), and Eq. 11 and plotted versus amount of biotin in
the mixture. Fig. 9 represents the average fractional occu-
pancy for each concentration of unlabeled biotin. The graph
was constructed by combining the data of three separate
experiments.
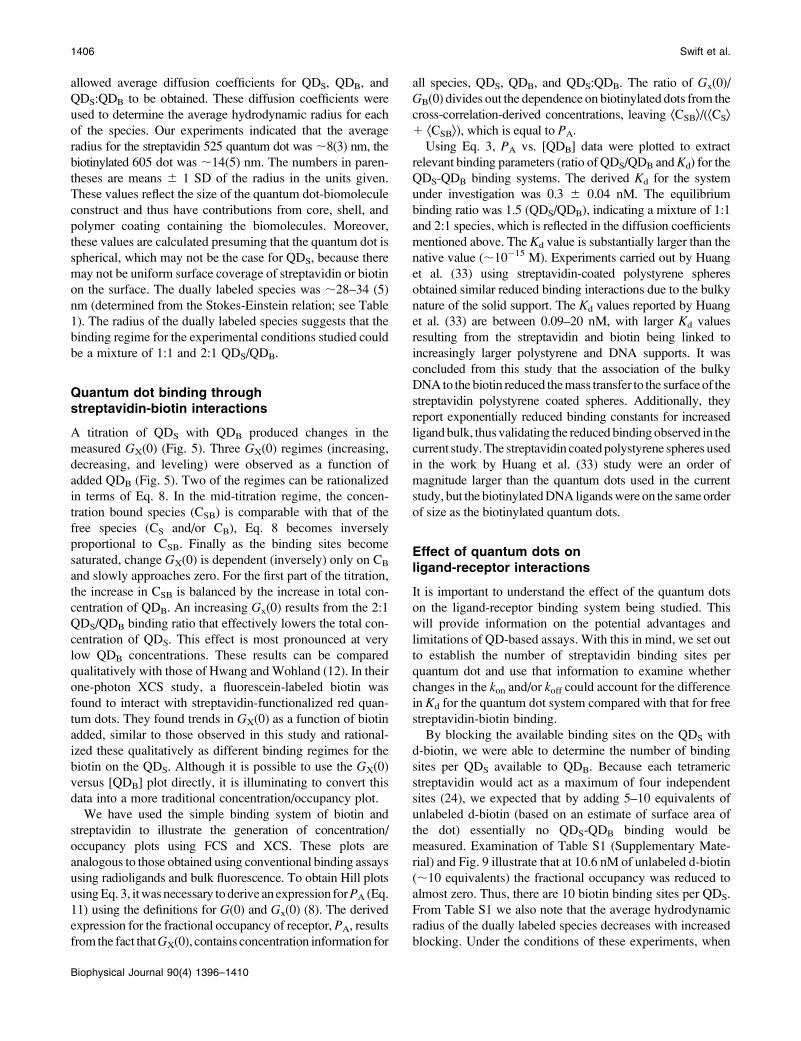
The linearity of the plot of PA versus the concentration of
biotin in the mixture, suggests that minimal biotin exchange
took place during the experiments. Therefore, the plot in Fig.
9 represents the increasing fraction of sites blocked as a
function of free biotin loaded into the solution. Thus, the
point where the PA becomes zero represents the concentra-
tion of biotin needed for complete blocking of sites
streptavidin on the quantum dots. This occurs at ;10 nM
of biotin. Because the QDS concentration was 1.0 nM, there
appear to be 10 sites on each QDS that can be blocked by free
biotin. This would mean a maximum of 10 streptavidins per
quantum dot, if there was only one active binding site per
streptavidin. If all four binding sites remain active, then there
are 2–3 streptavidins per dot. Note also, not all 10 sites on
QDS can be occupied by QDB simultaneously, owing to
steric hindrance of the dots.
DISCUSSION
Examination of quantum dots using fluorescencecorrelation spectroscopy
In this article, we describe the development of a ligand-
receptor binding assay using two-photon fluorescence cross-
correlation spectroscopy of biofunctionalized quantum dots.
Quantum dots have several advantages in such assays.
Firstly, because of their narrow emission spectra compared
with organic fluorescent tags, cross talk between the two
detection channels is eliminated, as shown in Fig. 2.
Secondly, because most quantum dots have large two-
photon excitation cross sections and significant fluorescence
quantum yields, their brightness allows single dot experi-
ments to be carried out with relative ease allowing very low
concentrations to be measured. Thus, only miniscule
amounts of receptors and ligands are needed for such TPE-
XCS based assays as described herein. However, there are
concerns that the photophysical behavior of quantum dots
may obfuscate some XCS results.
The most commonly perceived challenges of using dots in
correlation spectroscopy are their propensity to enter a non-
emissive state (blinking) and their longer fluorescence life-
times (10-20 ns) (31,32). The former can lead to anomalies in
the interpretation of correlation decays. The latter can lead to
saturation of excitation, because the typical laser pulse fre-
quency in TPE-XCS experiments is 80MHz. Thus, the excited
population cannot completely recover before encountering
the next laser pulse. Therefore, a careful choice of operating
conditions must be made to minimize these effects on the
data provided by FCS and XCS.
We have found that reliable concentrations can be deter-
mined by operating the Ti:sapphire laser at 20 mW to vastly
reduce the effects of blinking. Similar to Webb and co-
workers (14) a consistent method of fitting G(0)’s to the
autocorrelation data was used. We chose the average value of
the autocorrelation amplitude (G(0)) at a lagtime of 0.01 ms.
Also, the linear plots of 1/G(0) versus the concentration of
QDB (see Fig. 1 B) show that the sample volume does not
change significantly under the titration conditions. Because
the blinking behavior between dots is not synchronized, no
evidence of blinking presented itself in the cross-correlation
decays. In addition, fitting the autocorrelation curves to Eq. 5
FIGURE 9 Blocking assay to determine the number of biotin binding sites
per streptavidin functionalized quantum dot. Binding sites on QDS (1 nM)
were blocked with varying concentrations of d-biotin and the number of
remaining free sites was determined using a QDB binding assay. Thus, the
plot of PA versus concentration of d-biotin has an x-intercept that representsthe molarity of d-biotin needed to block all binding sites. This results in a
mol ratio of 1:10 QDS/d-biotin for complete blockage, suggesting that there
are on average 10 binding sites per QDS.
Fluorescence Cross-Correlation Spectroscopy of Quantum Dot Binding 1405
Biophysical Journal 90(4) 1396–1410
allowed average diffusion coefficients for QDS, QDB, and
QDS:QDB to be obtained. These diffusion coefficients were
used to determine the average hydrodynamic radius for each
of the species. Our experiments indicated that the average
radius for the streptavidin 525 quantum dot was;8(3) nm, the
biotinylated 605 dot was ;14(5) nm. The numbers in paren-
theses are means 6 1 SD of the radius in the units given.
These values reflect the size of the quantum dot-biomolecule
construct and thus have contributions from core, shell, and
polymer coating containing the biomolecules. Moreover,
these values are calculated presuming that the quantum dot is
spherical, which may not be the case for QDS, because there
may not be uniform surface coverage of streptavidin or biotin
on the surface. The dually labeled species was ;28–34 (5)
nm (determined from the Stokes-Einstein relation; see Table
1). The radius of the dually labeled species suggests that the
binding regime for the experimental conditions studied could
be a mixture of 1:1 and 2:1 QDS/QDB.
Quantum dot binding throughstreptavidin-biotin interactions
A titration of QDS with QDB produced changes in the
measured GX(0) (Fig. 5). Three GX(0) regimes (increasing,
decreasing, and leveling) were observed as a function of
added QDB (Fig. 5). Two of the regimes can be rationalized
in terms of Eq. 8. In the mid-titration regime, the concen-
tration bound species (CSB) is comparable with that of the
free species (CS and/or CB), Eq. 8 becomes inversely
proportional to CSB. Finally as the binding sites become
saturated, change GX(0) is dependent (inversely) only on CB
and slowly approaches zero. For the first part of the titration,
the increase in CSB is balanced by the increase in total con-
centration of QDB. An increasing Gx(0) results from the 2:1
QDS/QDB binding ratio that effectively lowers the total con-
centration of QDS. This effect is most pronounced at very
low QDB concentrations. These results can be compared
qualitatively with those of Hwang andWohland (12). In their
one-photon XCS study, a fluorescein-labeled biotin was
found to interact with streptavidin-functionalized red quan-
tum dots. They found trends in GX(0) as a function of biotin
added, similar to those observed in this study and rational-
ized these qualitatively as different binding regimes for the
biotin on the QDS. Although it is possible to use the GX(0)
versus [QDB] plot directly, it is illuminating to convert this
data into a more traditional concentration/occupancy plot.
We have used the simple binding system of biotin and
streptavidin to illustrate the generation of concentration/
occupancy plots using FCS and XCS. These plots are
analogous to those obtained using conventional binding assays
using radioligands and bulk fluorescence. To obtain Hill plots
usingEq. 3, itwas necessary to derive an expression forPA (Eq.11) using the definitions for G(0) and Gx(0) (8). The derived
expression for the fractional occupancy of receptor, PA, results
from the fact thatGX(0), contains concentration information for
all species, QDS, QDB, and QDS:QDB. The ratio of Gx(0)/
GB(0) divides out the dependence on biotinylated dots from the
cross-correlation-derived concentrations, leaving ÆCSBæ/(ÆCSæ1 ÆCSBæ), which is equal to PA.
Using Eq. 3, PA vs. [QDB] data were plotted to extract
relevant binding parameters (ratio of QDS/QDB andKd) for the
QDS-QDB binding systems. The derived Kd for the system
under investigation was 0.3 6 0.04 nM. The equilibrium
binding ratio was 1.5 (QDS/QDB), indicating a mixture of 1:1
and 2:1 species, which is reflected in the diffusion coefficients
mentioned above. The Kd value is substantially larger than the
native value (;10�15 M). Experiments carried out by Huang
et al. (33) using streptavidin-coated polystyrene spheres
obtained similar reduced binding interactions due to the bulky
nature of the solid support. The Kd values reported by Huang
et al. (33) are between 0.09–20 nM, with larger Kd values
resulting from the streptavidin and biotin being linked to
increasingly larger polystyrene and DNA supports. It was
concluded from this study that the association of the bulky
DNA to the biotin reduced themass transfer to the surface of the
streptavidin polystyrene coated spheres. Additionally, they
report exponentially reduced binding constants for increased
ligandbulk, thus validating the reduced binding observed in the
current study.The streptavidin coatedpolystyrene spheres used
in the work by Huang et al. (33) study were an order of
magnitude larger than the quantum dots used in the current
study, but the biotinylatedDNA ligandswere on the sameorder
of size as the biotinylated quantum dots.
Effect of quantum dots onligand-receptor interactions
It is important to understand the effect of the quantum dots
on the ligand-receptor binding system being studied. This
will provide information on the potential advantages and
limitations of QD-based assays. With this in mind, we set out
to establish the number of streptavidin binding sites per
quantum dot and use that information to examine whether
changes in the kon and/or koff could account for the differencein Kd for the quantum dot system compared with that for free
streptavidin-biotin binding.
By blocking the available binding sites on the QDS with
d-biotin, we were able to determine the number of binding
sites per QDS available to QDB. Because each tetrameric
streptavidin would act as a maximum of four independent
sites (24), we expected that by adding 5–10 equivalents of
unlabeled d-biotin (based on an estimate of surface area of
the dot) essentially no QDS-QDB binding would be
measured. Examination of Table S1 (Supplementary Mate-
rial) and Fig. 9 illustrate that at 10.6 nM of unlabeled d-biotin
(;10 equivalents) the fractional occupancy was reduced to
almost zero. Thus, there are 10 biotin binding sites per QDS.
From Table S1 we also note that the average hydrodynamic
radius of the dually labeled species decreases with increased
blocking. Under the conditions of these experiments, when
1406 Swift et al.
Biophysical Journal 90(4) 1396–1410
no d-biotin is present we note a 2:1 binding regime of QDS/
QDB based on the fitted diffusion coefficients. At 10.6 nM d-
biotin, the few remaining dually labeled species are present
in a 1:1 binding regime. As expected, the binding of d-biotin
lowers the number of available sites such that the most likely
complex is 1:1.
It is possible that the off-rate for QD-biotin from the
quantum dot-bound streptavidin contains information about
how the QD perturbs both the biotin binding site and the
biotin ligand. If the reduced binding coefficient is a result of
changes in the binding pocket or capping peptides (24), this
should manifest in a faster off-rate for the QDB- and d-biotin-
QDS than for native biotin-streptavidin. Competition assays
were used to obtain the off-rate coefficient for the QDB-QDS
and for the unlabeled d-biotin-QDS interactions. Fig. 8
indicates that the reaction rate does not change as a function
of competitor concentration. Thus, the results are consistent
with the dissociation of QDB-QDS or of QDS-d-biotin being
the rate-limiting step. The rate constant for both QDB-QDS
and QDS-d-biotin dissociation are approximately the same
(koff ; 5-63 10�5 s�1; Fig. 8 A) and have values 103 faster
than the off-rate (koff ; 53 10�6 s�1) (24) characteristic for
the native biotin-streptavidin system. The larger off-rate
constant for this study could result from inhibition of
streptavidin loop closure due to the bulk of the quantum dot.
The difference in off-rate constants does not account for
the difference in Kd between the dot system (33 10�10) and
the native system (10�15), which suggests that the changes in
binding also result from a lower value for the on-rate
coefficient (kon ¼ koff/Kd) for the quantum dot system. A
smaller value for kon could result from a combination of the
slower diffusion coefficient for the dot system and slower
orientation dynamics due to the bulk of the dot system. We
can make a simple estimate of the differences in konassuming that only the frequency factor, Afree vs. AQD,
changes in the Arrhenius expression for the rate coefficient.
Here the subscript, ‘‘free’’, represents the kinetics of freely
diffusing native streptavidin and biotin, and ‘‘QD’’ repre-
sents streptavidin and biotin bound to quantum dots. To ex-
amine this hypothesis qualitatively, we can use the ratio:
konfreekonQD
¼ Afree
AQD
¼ frac� availfree � ðrSBÞ 1=rS 1 1=rBð Þð Þfree
frac� availQD � ðrSBÞ 1=rS 1 1=rBð Þð ÞQD
;
(17)
where rSB is the encounter distance for binding, rS and rBare the radii of the colliding pair and frac-avail is the fractionof the surface area of the particle that is active for binding.
This is the fraction of collisions with the correct alignment
of ligand and receptor to allow binding to take place. For
the free system this fraction is nearly one, whereas for the
quantum dot system the fraction is vastly smaller than one
(see Fig. 10). The frac-avail factor is calculated using the
follow relation:
frac� avail ¼Yparticlesi¼1
nsites 3r2
site
r2
particle
!i
; (18)
where nsites is the number of binding sites per particle, rsiteand rparticle are the radii of the binding site and particle,
respectively. The product is over the two particles involved
in the collision; either QDS-QDB or streptavidin-biotin. Two
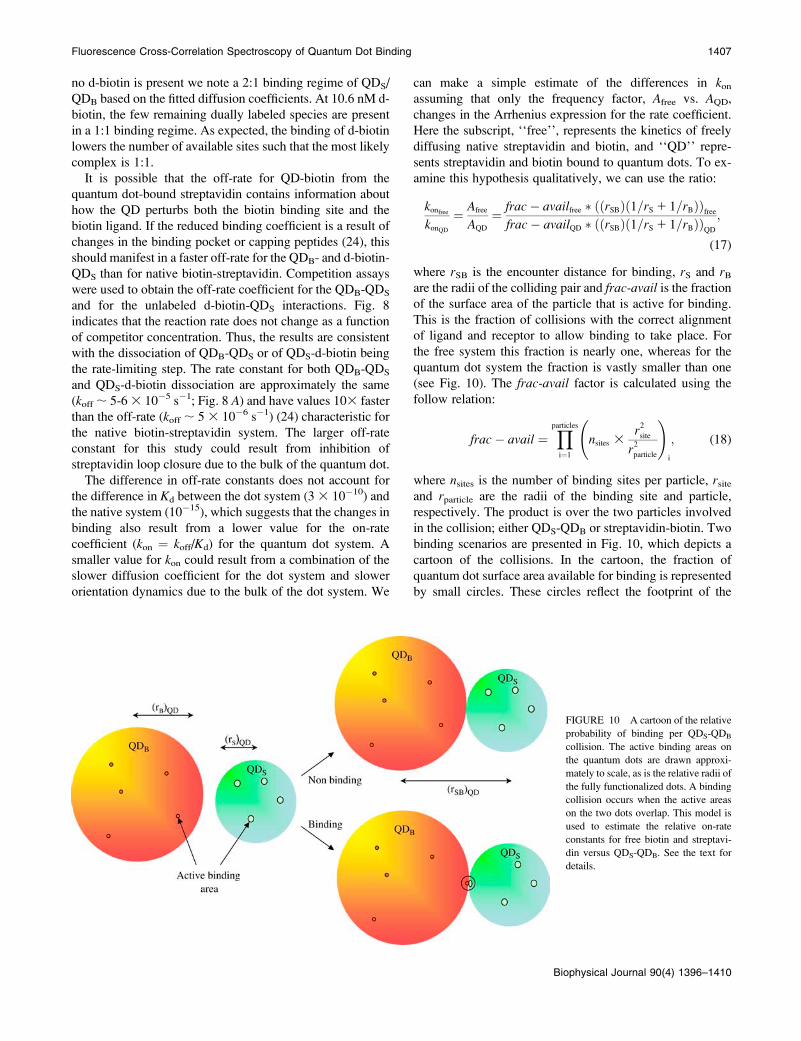
binding scenarios are presented in Fig. 10, which depicts a
cartoon of the collisions. In the cartoon, the fraction of
quantum dot surface area available for binding is represented
by small circles. These circles reflect the footprint of the
FIGURE 10 A cartoon of the relative
probability of binding per QDS-QDB
collision. The active binding areas on
the quantum dots are drawn approxi-
mately to scale, as is the relative radii of
the fully functionalized dots. A binding
collision occurs when the active areas
on the two dots overlap. This model is
used to estimate the relative on-rate
constants for free biotin and streptavi-
din versus QDS-QDB. See the text for
details.
Fluorescence Cross-Correlation Spectroscopy of Quantum Dot Binding 1407
Biophysical Journal 90(4) 1396–1410
streptavidin binding site and of biotin on the quantum dot
surface. In one case a collision between QDS and QDB
results in binding; in the other, it does not.
The ratio from Eq. 18 was calculated using the crystallo-
graphic data (34,35) for the streptavidin binding site radius
(0.5 nm), streptavidin radius (2.5 nm), and biotin radius (0.3
nm) and the radii of QDS and QDB from this work, (8 and
14 nm, respectively). Then using Eq. 17, a value of ;2200
was calculated for Afree/AQD. The ratio of on-rate constants
(free/QD) observed is 30,000. This value is calculated from
the ratio (koff/Kd)free/(koff/Kd)QD. Therefore, although this
approach moves toward the difference in kon, it does not
account for the entire difference. The difference between the
estimated and measured rate coefficient ratios could result
from rotational and orientational constraints for the quantum
dot bound system, not accounted for in our simple model.
Also, there may be a greater activation barrier to binding for
the quantum dot system. The solvation shell around the
quantum dots could be more extensive and require greater
energy to rearrange during QDS-QDB binding than is re-
quired for binding of the native system. Further effects of
fluorescence label size and chemistry on the dissociation
constant and kinetics for streptavidin-biotin interactions are
currently under investigation, but are beyond the scope of this
study.
CONCLUSION
We have shown that it is possible to obtain relevant binding
information for ligand-receptor systems that are bound to
quantum dot nanocrystals. These assays are simple and easy
to perform, making them ideal for future automation. In
addition, the derived expression for PA can be simply
extracted from the auto and cross-correlation data and is
independent of the excitation volume. The present assay
allows for the full characterization of binding at low ligand
concentrations, which are not achievable using other fluo-
rescent assays. Moreover, it was possible to assess the degree
to which binding to quantum dots perturbs the function of
streptavidin. Based on the measured Kd and off-rate for
unbinding, it appears that binding pocket of streptavidin is
not significantly altered. Therefore, it was possible to
attribute the lower value of Kd for the quantum dot system
to changes in both the dissociation rate coefficient, koff, andthe association rate coefficient, kon. Thus, a smaller Kd is
related to the smaller probability of binding per QDS-QDB
collision and the faster dissociation rate of the QDS-QDB
system compared with that for free streptavidin-biotin.
APPENDIX: DERIVATION OF INTEGRATEDRATE EQUATIONS FOR COMPETITION ASSAYS
If we consider the simplifying scenario of a 1:1 pair, QDS:QDB, in
equilibrium with the free quantum dots, QDS and QDB, we can write the
following equilibrium equation:
QDS : QDB 4koff
konQDS 1QDB: (A1)
Adding free d-biotin to this system can be approximated as a perturbation
that removes free QDS, thus promoting more dissociation of QDS:QDB to
restore equilibrium. The differential rate law for this is:
dCSB
dt¼ �koffCSB 1 konCSCB: (A2)
If we make the approximation that CB is constant, the differential rate law
above can be rewritten:
dCSB
dt¼ �koffCSB 1 k9ðCSBÞ0 � k9CSB
¼ �ðkoff 1 k9ÞCSB 1 k9ðCSBÞ0; (A3)
where k9 ¼ konCB. This differential rate equation can be integrated giving:
CSBðtÞ ¼ ðCSBÞ0koff
koff 1 k9
k9
koff1 e
�ðkoff 1 k9Þt� �
: (A4)
Dividing both sides by CSB 1 CS changes Eq. A4 to be relative to fractional
occupancy, PA:
PAðtÞ ¼ ðPAÞ0koff
koff 1 k9
k9
koff1 e
�ðkoff 1 k9Þt� �
: (A5)
Because we can measure both (PA)0 and (PA)N, we can rewrite k9 in terms of
koff by setting the equation above to the values at t ¼ N and solving for k9:
k9 ¼ koffðPAÞN
ðPAÞ0 � ðPAÞN¼ koff DPA: (A6)
Substituting this result into Eq. A5 and rearranging gives the final result:
PAðtÞðPAÞ0
¼ 1
11DPA
½DPA 1 e�koff ð11DPAÞt�: (A7)
This is the equation used to model the decline in fractional occupancy
after the addition of free d-biotin. It has only one adjustable parameter, koff,which represents the rate constant of QDS:QDB unbinding.
The kinetics representing an increase in PA observed for the dissociation
of QDS:dB are more complex. Here, we have to consider two reactions:
QDS :dB4k9off
k9onQDS 1 dB (A8)
QDS 1QDB 4kon
koff
QDS :QDB: (A9)
If we assume the free QDS is rapidly consumed by the free QDB, then the
reverse reaction in equation can be neglected. Therefore, the forward
reaction of A8 is the rate-limiting step. We can then set up the differential
rate equations for QDS:dB, QS and QDS:QDB.
dCSdB
dt¼ �k9off CSdB (A10)
dCS
dt¼ k9offCSdB � konCSCB 1 koffCSB (A11)
dCSB
dt¼ kon CS CB � koffCSB: (A12)
Under these conditions, the loss of QDS:dB will follow the standard
exponential decay. If we assume that the steady-state approximation holds
1408 Swift et al.
Biophysical Journal 90(4) 1396–1410
for Eq. A12, then we can solve for CS and substitute the result for the steady-
state approximation for the loss of QDS:dB into the mass balance equation:
CSB ¼ ðCSdBÞ0 � CSdB � CS; (A13)
to yield
CSB ¼ ðCSdBÞ011
koffkonCB
1� 1� k9offkonCB
� �e�k9off t
� �: (A14)
Recognizing that (CSdB)0 equals the total available QS (i.e., PA ¼ CSB/
(CSdB)0) and allowing for an excess of the competitor, QDB, such that CB is
approximately constant (i.e., k9 ¼ konCB), Eq. A14 can be rewritten:
PAðtÞ ¼ k9
k91 koff1� 1� k9off
k9
� �e�k9off t
� �: (A15)
SUPPLEMENTARY MATERIAL
An online supplement to this article can be found by visiting
BJ Online at http://www.biophysj.org.
The authors are indebted to Professor David Armstrong (Calgary) and
Professor Jolyon Jesty (SUNY, Stony Brook) for helpful discussions on
kinetics.
Funding for this project was made possible by the Natural Sciences and
Engineering Research Council of Canada (AGENO and CRD programs),
AstraZeneca, and the Canadian Institute for Photonics Innovation. J.L.S. is
grateful for a graduate scholarship from the Alberta Ingenuity Fund.
REFERENCES
1. Fang, Y., A. G. Frutos, and J. Lahiri. 2002. Membrane proteinmicroarrays. J. Am. Chem. Soc. 124:2394–2395.
2. Schwille, P. 2001. Fluorescence correlation spectroscopy and itspotential for intracellular applications. Cell Biochem. Biophys. 34:383–408.
3. Schwille, P. 2000. Cross-correlation analysis in FCS. In FluorescenceCorrelation Spectroscopy Theory and Applications. R. Rigler and E. S.Elson, editors. Springer, New York. 360–378
4. Wohland, T., K. Friedrich, R. Hovius, and H. Vogel. 1999. Study ofligand-receptor interactions by fluorescence correlation spectroscopywith different fluorophores: evidence that the homopentameric 5-hydroxytryptamine type 3As receptor binds only one ligand. Biochem-istry. 38:8671–8681.
5. Briddon, S. J., R. J. Middleton, A. S. Yates, M. W. George, B.Kellam, and S. J. Hill. 2004. Applications of fluorescence correlationspectroscopy to the measurement of agonist binding to a G-proteincoupled receptor at the single cell level. Faraday Discuss. 126:197–207.
6. Briddon, S. J., R. J. Middleton, Y. Cordeaux, F. M. Falvin, J. A.Weinstein, M. W. George, B. Kellam, and S. J. Hill. 2004. Quantitativeanalysis of the formation and diffusion of A1-adenosine receptorantagonist complexes in single living cells. Proc. Natl. Acad. Sci. USA.101:4673–4678.
7. Zemanova, L., A. Schenk, N. Hunt, G. U. Nienhaus, and R. Heiker.2004. Endothelin receptor in virus-like particles; ligand bindingobserved by fluorescence fluctuation spectroscopy. Biochemistry.43:9021–9028.
8. Heinze, K. G., A. Koltermann, and P. Schwille. 2000. Simultaneoustwo-photon excitation of distinct labels for dual: color fluorescencecrosscorrelation analysis. Proc. Natl. Acad. Sci. USA. 97:10377–10382.
9. Berland, K. M., P. T. So, and E. Gratton. 1995. Two-photonfluorescence correlation spectroscopy: method and application to theintracellular environment. Biophys. J. 68:694–701.
10. Merkle, D., S. P. Lees-Miller, and D. T. Cramb. 2004. Lipoplexstructure and dynamics examined using two-photon fluorescence cross-correlation spectroscopy. Biochemistry. 43:7263–7272.
11. Swift, J. L., A. Carnini, T. E. S. Dahms, and D. T. Cramb. 2004.Anesthetic-enhanced membrane fusion examined using two-photonfluorescence cross-correlation spectroscopy. I. Phys. Chem. B. 108:11133–11138.
12. Hwang, L. C., and T. Wohland. 2004. Dual-color fluorescence crosscorrelation spectroscopy using single laser wavelength excitation.ChemPhysChem. 5:549–551.
13. Chan, W. C. W., D. J. Maxwell, X. Gao, R. E. Bailey, M. Han, andS. Nie. 2002. Luminescent quantum dots for multiplexed biologicaldetection and imaging. Curr. Opin. Biotechnol. 13:40–46.
14. Larson, D. R., W. R. Zipfel, R. M. Williams, S. W. Clark, M. P.Bruchez, F. W. Wise, and W. W. Webb. 2003. Water soluble quantumdots for multiphoton fluorescence imaging in vivo. Science. 300:1434–1437.
15. Tran, P. T., G. P. Anderson, J. M. Mauro, and H. Mattoussi. 2002. Useof luminescent CdSe-ZnS nanocrystal bioconjugates in quantum dot-based nanosensors. Phys. Status Solidi. B. 229:427–432.
16. Schroeder, A., H. Weller, R. Eritja, W. E. Ford, and J. M. Wessels.2002. Biofunctionalization of silica-coated CdTe and gold nano-crystals. Nano Lett. 2:1363–1367.
17. Niemeyer, C. M. 2001. Nanoparticles, proteins, and nucleic acids:biotechnology meets materials science. Angew. Chem. Int. Ed. Engl.40:4128–4158.
18. Bruchez, M., Jr., and M. Maronne. 1998. Semiconductor nanocrystalsas fluorescent biological labels. Science. 281:2013–2017.
19. Dubertret, B., P. Skourides, D. J. Norris, V. Noireaux, A. H. Brivanlou,and A. Libchaber. 2002. In vivo imaging of quantum dots encapsulatedin phospholipid micelles. Science. 298:1759–1763.
20. Pathak, S., S. K. Choi, N. Arnheim, and M. E. Thompson. 2001.Hydroxylated quantum dots as luminescent probes for in situhybridization. J. Am. Chem. Soc. 123:4103–4104.
21. Akerman, M. E., W. C. W. Chan, P. Laakkonen, S. N. Bhatia, andE. Ruoslahti. 2002. Nanocrystal targeting in vivo. Proc. Natl. Acad.Sci. USA. 99:12617–12621.
22. Mitchell, G. P., C. A. Mirkin, and R. L. Letsinger. 1999. Programmedassembly of DNA functionalized quantum dots. J. Am. Chem. Soc.121:8122–8123.
23. Ispasoiu, R. G., Y. Jin, J. Lee, F. Papadimitrakopoulos, and T.Goodson. 2002. Two-photon absorption and photon-number squeezingwith CdSe nanocrystals. Nano Lett. 2:127–130.
24. Weber, P. C., D. H. Ohlendorf, J. J. Wendoloski, and F. R. Salemme.1998. Structural origins of high-affinity biotin binding to streptavidin.Science. 234:85–89.
25. Schwartz, B. L., J. E. Bruce, G. A. Anderson, S. A. Hofstadler, A. L.Rockwood, R. D. Smith, A. Chilkoti, and P. S. Stayton. 1995.Dissociation of tetrameric ions of non-covalent streptavidin complexesformed by electrospray ionization. J. Am. Soc. Mass Spectrom. 6:459–465.
26. Wiess, J. 1997. The Hill equation revisited: uses and misuses. FASEBJ. 11:835–841.
27. Cornish-Bowden, A., and D. E. Koshland. 1975. Diagnostic uses ofHill plots. J. Mol. Biol. 95:201–212.
28. Michalet, X., F. Pinaud, L. Bentolila, J. Tsay, S. Doose, J. Li,G. Sundaresan, A. Wu, S. Gambhir, and S. Weiss. 2005. Quantum dotsfor live cells, in vivo imaging, and diagnostics. Science. 307:538–544.
Fluorescence Cross-Correlation Spectroscopy of Quantum Dot Binding 1409
Biophysical Journal 90(4) 1396–1410
29. Baudendistel, N., G. Muller, W. Waldeck, P. Angel, and J. Langowski.2005. Two-hybrid fluorescence cross-correlation spectroscopy detectsprotein-protein interactions in vivo. ChemPhysChem. 6:984–990.
30. Eggeling, C., P. Kask, D. Winkler, and S. Jager. 2005. Rapid analysisof Forster resonance energy transfer by two-color global fluorescencecorrelation spectroscopy: trypsin proteinase reaction. Biophys. J. 89:605–618.
31. Pelton, M., D. G. Grier, and P. Guyot-Sionnest. 2004. Characterizingquantum-dot blinking using noise power spectra. Appl. Phys. Lett.85:819–821.
32. Hohng, S., and T. Ha. 2004. Near-complete suppression of quantumdot blinking in ambient conditions. J. Am. Chem. Soc. 126:1324–1325.
33. Huang, S. C., M. D. Stump, R. Weiss, and K. D. Caldwell. 1996.
Binding of biotinylated DNA to streptavidin coated polystyrene
latex: effects of chain length and particle size. Anal. Biochem.
237:115–122.
34. Hendrickson, W. A., A. Pahler, J. L. Smith, Y. Satow, E. A. Merritt,
and R. P. Phizackerley. 1989. Crystal structure of core streptavidin
determined from multiwavelength anomalous diffraction of synchatron
radiation. Proc. Natl. Acad. Sci. USA. 86:2190–2194.
35. Chilkoti, A., and P. S. Stayton. 1995. Molecular origins of the slow
streptavidin-biotin dissociation kinetics. J. Am. Chem. Soc. 117:10622–
10628.
1410 Swift et al.
Biophysical Journal 90(4) 1396–1410