


Languages
Pages
Legal


A step-by-step guide for developing ROI impact studies for programs, projects, and solutions in the following areas:
The ROI Methodology is a balanced approach to measurement that captures six types of data:
Reaction and Planned Action Level 1 Learning Level 2 Application and Implementation Level 3 Business Impact Level 4 Return on Investment Level 5 Intangibles
The process always includes a technique to isolate the effects of the project, program, solution, meeting, event, system, procedure, or initiative.
Human Resources/Human Capital Training/Learning/Development Leadership/Coaching/Mentoring Knowledge Management Organization Consulting/Development Policies/Procedures/Processes Recognition/Incentives/Engagement Change Management Technology/Systems/IT Green Projects/Sustainability Projects Safety and Health Programs
Talent Management/Retention Project Management Solutions Quality/Six Sigma/Lean Engineering Meetings/Events/Conferences Marketing/Advertising Communications/Public Relations Public Policy/Social Programs Risk Management Ethics/Compliance Healthcare Initiatives Wellness and Fitness Programs
Application Guide
The ROI Methodology
in 10 Easy Steps
ROI Institute Canada Phone: 613‐567‐9402 www.roiinstitutecanada.com [email protected]
© 2013 ROI Institute. All rights reserved.
™
Notes
© 2013 ROI Institute. All rights reserved.

1
Evaluation begins with the objectives of the program, project, or solution. The objectives must go beyond typical learning objectives and include up to five levels of data.
1. Reaction objectives describe desired immediate
reaction to the program, highlighting issues that are important to the success of the program and emphasizing planned action, if feasible. Examples- After completing this project, participants should: Indicate an intention to implement new
procedure(s) within two months Rate the program at least 4.5 out of 5.0 on
relevance to current job Perceive the project to be important for the
organization 2. Learning objectives communicate expectations
for obtaining new information, skills, and knowledge and describe competent performance that should be connected with learning. Examples- After completing this project, participants should: Score 75 or higher on the new product quiz Achieve a leadership simulation test score
average of 75 Be able to identify the five elements of the
new strategy 3. Application objectives describe intermediate
outcomes, including use of skills and knowledge, on-the-job performance changes, and program implementation.
Examples- After completing this project, participants should:
Use counseling skills in 90% of situations where performance is substandard
Complete all items on action plan in one month
Use the new software daily as reflected by an 80% score on a user profile in one month
4. Impact objectives describe consequence of
applying skills or implementing the project and are expressed as specific measures of output, quality, cost, time, and satisfaction.
Examples- As a result of implementing this project, there should be: A 10% increase in sales in six months A 20% decrease in the time required to
complete a project in three months A decrease in downtime of at least 30%
within six months 5. ROI objectives set the acceptable level of
monetary benefits versus costs of the program and may be expressed as an ROI percentage, a benefit-to-cost ratio, or a time for payback. Examples- After comparing the benefits to the costs, the project should: Achieve at least a 20% return on investment
within the first year Achieve a 2:1 benefit-cost ratio Realize an investment payback within six
months
Business Alignment Project objectives are developed based on needs. The needs assessment begins with a review of the opportunity to be realized if the proposed project is implemented. Is there an opportunity for a positive payoff? Is this a problem worth solving or an opportunity worth exploring? Next, the business needs are identified. What specific business measures will be influenced with this project? The business needs are met by changing individual performance. What should the participants do or stop doing to change the business measure? Performance needs are met by implementing new knowledge/skills presented to the participants. What specific knowledge, skills, or information do participants need for the new performance? Finally, preference needs focus on how the stakeholders, including the participants, should perceive the project in terms of value and need. The project is developed to achieve the objectives at each level. The project can be evaluated at each level, based on the objectives. The V Model on the next page illustrates this process as it presents the relationship between needs assessment, objectives, and evaluation.
Step 1: Develop Project Objectives
© 2013 ROI Institute. All rights reserved.

2
An HPT Model
Start Here End Here
Payoff Needs 5 ROI Objectives 5 ROI
Business Needs 4 Impact Objectives 4 Impact
Performance Needs 3 Application Objectives 3 Application
Learning Needs 2 Learning Objectives 2 Learning
Preference Needs 1 Reaction Objectives 1 Reaction
ROI Methodology Model Program Alignment with the V Model
Project
Initial Analysis
Measurement and Evaluation
Business Alignment and Forecasting The ROI Process Model
© 2013 ROI Institute. All rights reserved.

3
The 10 steps in the ROI Methodology are logical and systematic, often labeled the enhanced logical framework.
The Phillips ROI Methodology Model
Reporting Data Analysis Data Collection
3. Application and Implementation 4. Impact
1. Reaction and Planned Action
2. Learning
Develop Evaluation Plans and
Baseline Data
Collect Data During Project
Implementation
Collect Data After
Project Implementation
Isolate the Effects of Project
Convert Data to Monetary
Value
Develop Report and
Communicate Results
Develop Objectives
of Project
Capture Costs
of Project
Calculating the Return on Investment
Identify
Intangibles
• Input/Indicators
Evaluation Planning
© 2013 ROI Institute. All rights reserved.
ROI Methodology Model
5. ROI
• Intangible Benefits

4
Planning begins as soon as it is decided that an impact/ROI study should be conducted and typically involves key stakeholders. All important decisions for the study are made early through evaluation planning. This step involves completing three documents: data collection plan, ROI analysis plan, and evaluation project plan.
DATA COLLECTION PLAN Data collection planning answers fundamental questions about data collection: What, How, Who, When, Where, and How Much?
Project: Coaching for Business Impact Responsibility: Date:
Objectives Measures/Data Data Collection Method
Data Sources
Timing Responsibilities
Level 1 Reaction and Planned Action •Relevance and importance to the job
•Coach’s effectiveness •Recommendation to others
•4 out of 5 on a 1 to 5 rating scale
•Questionnaire •Executive •6 months after engagement
•NHLO Staff
Level 2 Learning •Uncovering strengths/weaknesses
•Translating feedback into action •Involving team members •Communicating effectively
•4 out of 5 on a 1 to 5 rating scale
•Questionnaire •Executive •Coach
•6 months after engagement begins
•NHLO Staff
Level 3 Application/Implementation •Complete and adjust action plan •Identify barriers and enablers •Show improvements in skills
•Checklist for action plan •4 out of 5 on a 1 to 5
rating scale
•Action Plan •Questionnaire
•Executive •Coach
•6 months after engagement begins
•NHLO Staff
Level 4 Impact 1. Sales growth 2. Productivity/efficiency 3. Direct cost reduction 4. Retention of key staff 5. Customer satisfaction
1. A change in monthly revenue
2. Varies with location 3. Direct monetary savings 4. Voluntary turnover 5. Customer impression
index
•Action Plan •Executive
•6 months after engagement begins
•NHLO Staff
Level 5 ROI • 25% ROI
Comments: Executives are committed to providing data. They fully understand all data collection issues prior to engaging in the coaching assignment.
Step 2: Plan for Evaluation
© 2013 ROI Institute. All rights reserved.
5
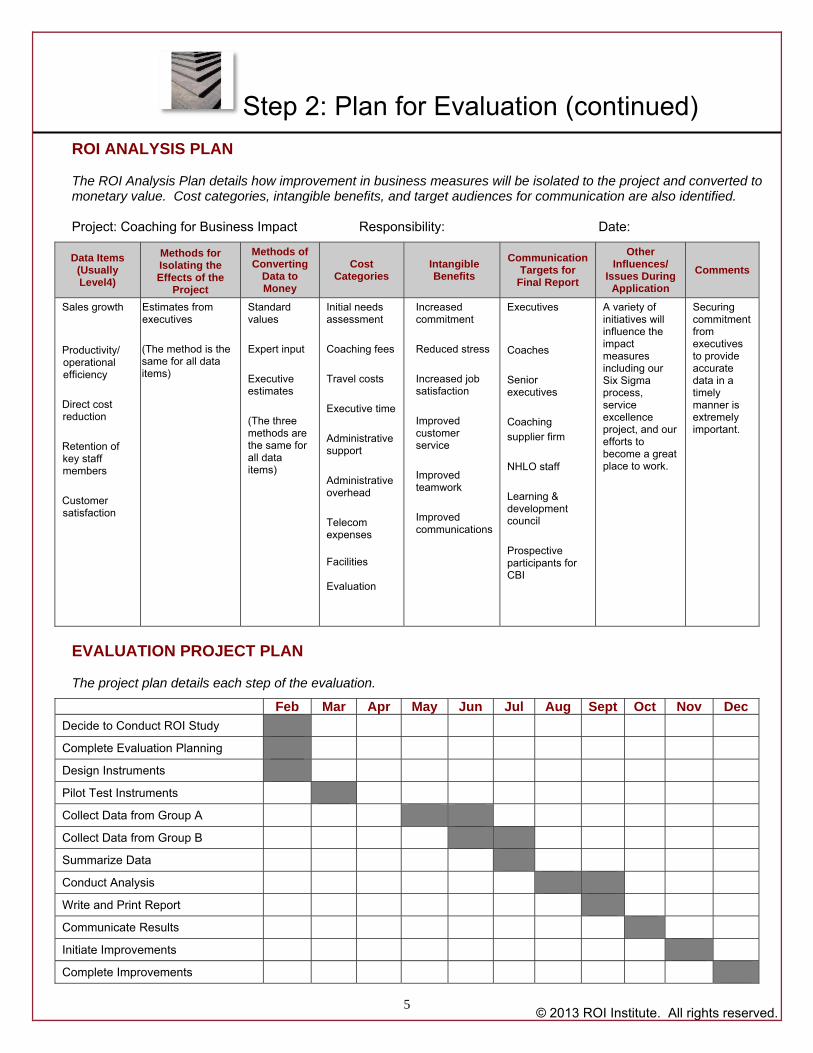
ROI ANALYSIS PLAN The ROI Analysis Plan details how improvement in business measures will be isolated to the project and converted to monetary value. Cost categories, intangible benefits, and target audiences for communication are also identified. Project: Coaching for Business Impact Responsibility: Date:
Data Items (Usually Level4)
Methods for Isolating the Effects of the
Project
Methods of Converting
Data to Money
Cost Categories
Intangible Benefits
Communication Targets for
Final Report
Other Influences/
Issues During Application
Comments
Sales growth
Productivity/ operational efficiency
Direct cost reduction
Retention of key staff members
Customer satisfaction
Estimates from executives
(The method is the same for all data items)
Standard values
Expert input
Executive estimates
(The three methods are the same for all data items)
Initial needs assessment
Coaching fees
Travel costs
Executive time
Administrative support
Administrative overhead
Telecom expenses
Facilities Evaluation
Increased commitment
Reduced stress
Increased job satisfaction
Improved customer service
Improved teamwork
Improved communications
Executives
Coaches
Senior executives
Coaching
supplier firm
NHLO staff
Learning & development council
Prospective participants for CBI
A variety of initiatives will influence the impact measures including our Six Sigma process, service excellence project, and our efforts to become a great place to work.
Securing commitment from executives to provide accurate data in a timely manner is extremely important.
EVALUATION PROJECT PLAN The project plan details each step of the evaluation.
Feb Mar Apr May Jun Jul Aug Sept Oct Nov Dec
Decide to Conduct ROI Study
Complete Evaluation Planning
Design Instruments
Pilot Test Instruments
Collect Data from Group A
Collect Data from Group B
Summarize Data
Conduct Analysis
Write and Print Report
Communicate Results
Initiate Improvements
Complete Improvements
Step 2: Plan for Evaluation (continued)
© 2013 ROI Institute. All rights reserved.
6
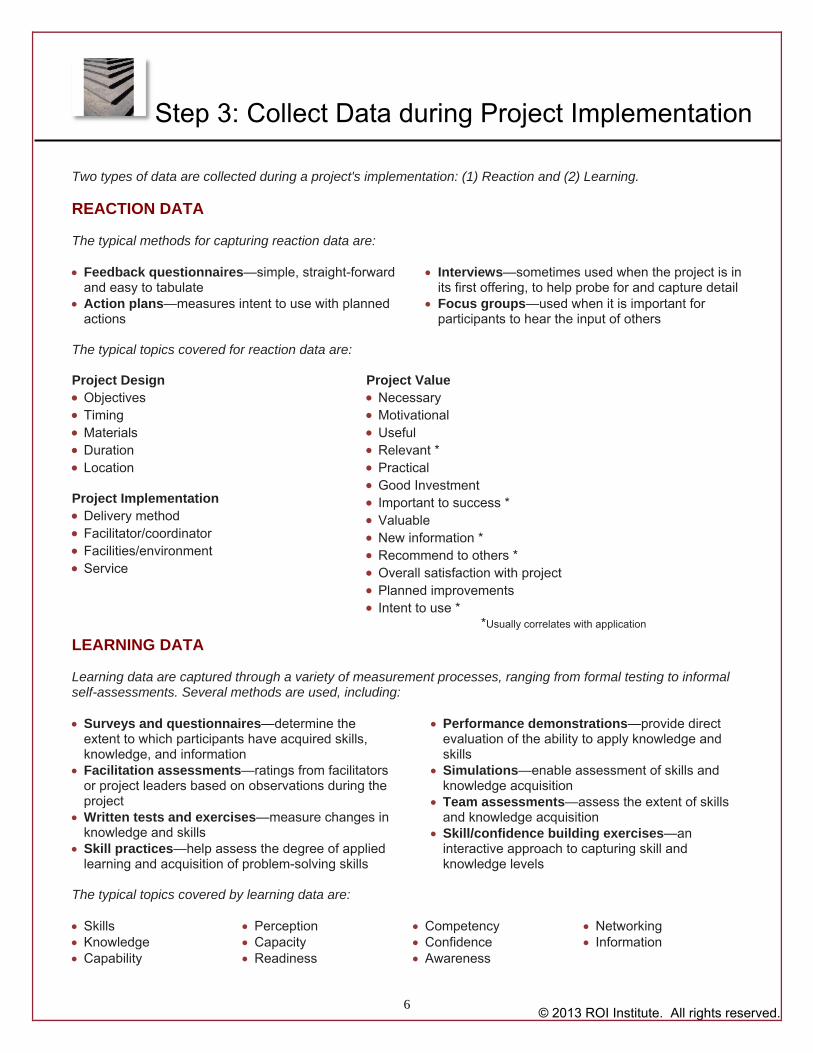
Two types of data are collected during a project's implementation: (1) Reaction and (2) Learning. REACTION DATA The typical methods for capturing reaction data are: Feedback questionnaires—simple, straight-forward
and easy to tabulate Action plans—measures intent to use with planned
actions
Interviews—sometimes used when the project is in its first offering, to help probe for and capture detail
Focus groups—used when it is important for participants to hear the input of others
The typical topics covered for reaction data are:
Project Design Objectives Timing Materials Duration Location Project Implementation Delivery method Facilitator/coordinator Facilities/environment Service
Project Value Necessary Motivational Useful Relevant * Practical Good Investment Important to success * Valuable New information * Recommend to others * Overall satisfaction with project Planned improvements Intent to use *
*Usually correlates with application
LEARNING DATA Learning data are captured through a variety of measurement processes, ranging from formal testing to informal self-assessments. Several methods are used, including: Surveys and questionnaires—determine the
extent to which participants have acquired skills, knowledge, and information
Facilitation assessments—ratings from facilitators or project leaders based on observations during the project
Written tests and exercises—measure changes in knowledge and skills
Skill practices—help assess the degree of applied learning and acquisition of problem-solving skills
Performance demonstrations—provide direct evaluation of the ability to apply knowledge and skills
Simulations—enable assessment of skills and knowledge acquisition
Team assessments—assess the extent of skills and knowledge acquisition
Skill/confidence building exercises—an interactive approach to capturing skill and knowledge levels
The typical topics covered by learning data are: Skills Knowledge Capability
Perception Capacity Readiness
Competency Confidence Awareness
Networking Information
© 2013 ROI Institute. All rights reserved.
Step 3: Collect Data during Project Implementation

7
© 2013 ROI Institute. All rights reserved.
Two types of data are collected after a project is implemented: (3) Application and (4) Impact.
APPLICATION AND IMPACT DATA
One of the most important challenges is to collect data after the project has been implemented using a variety of follow-up methods. The typical methods are:
Level 3 Level 4 Survey Questionnaires Observation Interviews Focus Groups Action Planning Performance Contracting Performance Monitoring
Surveys—taken to determine how extensively the participants have used various aspects of the project
Questionnaires—usually more detailed than surveys and can be used to uncover a wide variety of data in open-ended and forced-response options
Observation—captures actual skill application and use. Observations are particularly useful in customer service projects and are effective when the observer is either invisible or transparent
Interviews—conducted to determine how extensively the project is used
Focus groups—conducted to determine the extent to which the project is used
Action plans—developed by participants during the project and are implemented after the project is completed. Follow-up on action plans provides evidence of application and business impact success
Performance contracts—developed by the participant, the participant's supervisor, and the facilitator who all agree on performance outcomes
Performance monitoring—useful where various performance records and operational data are monitored for changes
Increasing Response Rates Improving response rates is a critical issue for post-project collection. When used consistently, the following techniques can achieve 70-80% response rate for questionnaires, surveys, or action plans: Provide advance communication about the follow-
up data collection Review the instrument at the end of the formal
session Clearly communicate the reason for the evaluation
and how the data will be used Indicate who will see the results Keep the instrument simple and as brief as
possible Keep responses anonymous–or at least
confidential Provide options that make responding easy: paper
(include a self-addressed, stamped envelope), email, web based
Use local managers to distribute the instruments, show support, and encourage response
If appropriate, let the target audience know that they are part of a carefully selected sample
Use one or two follow-up reminders Have the introduction letter signed by a top
executive Enclose a giveaway item with the instrument (pen,
money, etc.) Provide an incentive (or a chance of an incentive)
for a quick response Have a third party collect and analyze the data Communicate the time limit for submitting
responses Send a summary of results to the target audience Design the instrument with a professional format
to attract attention Let participants know what actions will be taken
with the data
TYPICAL IMPACT DATA Output Efficiency Absenteeism Employee Engagement
Revenue Costs Employee Turnover Cycle Time
Productivity Accidents Customer Satisfaction Downtime
Errors/Waste Incidents Employee Satisfaction Project Time
Step 4: Collect Data after Project Implementation

8
© 2013 ROI Institute. All rights reserved.
Step 5: Isolate the Effects of the Project
One of the most critical steps in the process is to isolate the effects of the project.
Control groups are used to isolate the project's impact. With this strategy, one group participates in a project, while another similar group (the control group) does not. Their performance is monitored in a parallel time frame.
Trend lines are used to show the values of specific output variables as if the project had not been undertaken. The projected trend is compared to the actual data after the project is conducted, and the difference represents the impact of the project, if certain conditions are met.
The amount attributed to the project is 62 gallons, if the pre project trend would have continued and no other new influences entered in the post period.
A forecasting model is used when mathematical relationships between other influences and output measures are known.
With this approach, the output measure is predicted using other known influences. After the project is conducted, the actual performance of the measure is compared with the forecasted value, which results in an estimate of the impact of the project. Other influencing factors are identified, when feasible, and the impact is estimated or calculated. The remaining, unexplained improvement is attributed to the project. Participants estimate the amount of improvement related to the project. Because they are not always accurate, the estimates are adjusted for error, using a confidence percentage.
Factor That Influenced
Improvement
Percentage of
Improvement Caused
By Project
Confidence Expressed as a % (error)
Adjusted % of Improvement Caused By Project
Green awareness 60% 80% 48%
Convenience for participation
15% 70% 10.5%
Discounts for participating
20% 80% 16%
Other 5% 60% 3%
Total 100%
The amount attributed to the green project is 50x48%=24 pounds. Supervisors or managers estimate the impact of the project on the output variables. Estimates are also adjusted for error. Experts provide an estimate of the impact of the project on the performance variable, based on previous studies. Customers estimate how the project has influenced their decisions to purchase or use a product or service.
The credibility of estimates is improved by following these specific steps:
1. Collect estimates from the most credible source 2. Start with facts (actual improvement) 3. Provide helpful information to the estimators 4. Collect the estimate in an unbiased and non-threatening way 5. Remove extreme data items, if applicable 6. Adjust for the error of the estimates 7. Report the data with proper explanation
While isolating the effects of the project with other influences is sometimes difficult, it is necessary for credibility of the study. Without this step, there is no proof that the project is connected to a business measure.
Fact: Recycling volume has increased by 50 pounds per household month
M1 Project
M2 M1 Control
Experimental Group M2
Control Group Design

9 © 2013 ROI Institute. All rights reserved.
To calculate the ROI, improvement in business measures must be converted to money. This step develops a monetary benefit for one or more impact measures linked to the project. It usually follows the step to isolate the impact of the project. To calculate the monetary value:
1. Identify the unit of improvement, e.g. one first aid treatment
2. Determine the value of each unit (V), e.g. $300, a standard value
3. Determine the unit performance change (∆), e.g. 6 incidents per month (experimental vs. control)
4. Determine the annual performance level change (∆P), 6x12=72
5. Calculate the annual improvement value (V times ∆P), e.g. $300x72=$21,600
Several techniques are available to determine the value of a measure: Standard values are available for most output and quality measures. Output data are converted to profit contribution or cost savings, based on their unit contribution to profit or the unit contribution to cost savings. Quality improvements are directly converted to cost savings. Standard values for these items are available in most organizations. Approximately 80% of measures that matter have been converted to monetary values by these functions:
Finance and
Accounting Production Operations Engineering IT
Marketing and Customer Service
Procurement Research and
Development HR
Participants’ wages plus employee benefits are used to develop the monetary value for time where employee time is saved. This is a standard formula in most organizations. The time saved must be legitimate, where the time savings is used on other productive work.
Historical costs, developed from cost statements and reports, are used to calculate the value for a specific measure. In this case, organizational cost data form the basis of monetary cost savings for a unit of measure. This approach often consumes more resources than can be allocated to the task.
Internal or external experts are used to estimate a value for a unit of measure, based on their Position Experience Neutrality
Knowledge Credentials Publications
External databases provide the value or cost of data items. Research, government, and industry databases– usually available through the Internet–can provide important information for these values. For example, the cost of employee turnover is readily available in a variety of databases accessible through the Internet. The value is expressed in a percent of annual pay for a target job group e.g. 1.2 times annual pay. Soft measures are sometimes linked mathematically to other measures that are easier to convert to money. This approach is used for measures that are very difficult to convert to monetary values, but have links to other measures. For example, customer satisfaction (hard to value) is usually linked to revenue (easy to value):
Participants estimate the value of the unit of data. For this approach to be effective, participants must be capable of providing a value for the improvement and adjustments must be made for the error of the estimate. Supervisors and managers provide estimates when they are capable of assigning values to the data item.
Positive Correlation
Cus
tom
er S
atis
fact
ion
Revenue
Step 6: Convert Data to Monetary Values

10 © 2013 ROI Institute. All rights reserved.
When should data be converted to money? To decide whether or not to convert a measure to monetary value, use this four-part test.
1. Does an acceptable, standard monetary value exist for the measure? If yes, use it in the ROI calculation; if not, go to the next step.
2. Can a method be used to convert the measure to money? If not, list it as an intangible; if yes, go to the next step.
3. Can the conversion be accomplished with minimum resources? If not, list it as an intangible; if yes, go to the next step.
4. Can the conversion process be described to an executive audience and secure buy-in in two minutes? If yes, use it in the ROI calculation; if not, list it as an intangible.
Step 7: Identify Intangible Benefits Intangible benefits are project benefits that we choose not to convert to money. They are measures that cannot be converted to money credibly with minimal resources. Intangible data should be collected in some way, even if participants must indicate the degree to which the project has influenced intangible measures. Intangible benefits are usually reported in a table in the complete report.
IDENTIFYING INTANGIBLES
1. During needs assessment, the intangibles are sometimes identified as directly connected to the project, and a decision is made not to convert them to monetary values. They are listed as intangibles, but only if they are connected to the project.
2. In the planning phase of the ROI study, intangible measures are often suggested as outcomes.
3. During data collection, participants and other stakeholders may offer additional intangibles, usually unintended, that are connected to the project.
4. Finally, during data analysis, when measures cannot be converted to monetary values credibly with minimum resources, they are listed as intangibles
Typical intangibles
Image Customer Service Networking Job Satisfaction Complaints Partnering Organizational Commitment Conflicts Brand Awareness Employee Engagement Stress Creativity Teamwork Communications Social Responsibility
Connecting the intangibles to the project The most credible source (usually the participants) provides input about the influence of the project on the intangibles.
Please indicate the extent to which the project has influenced the following measures:
Intangible Measure
Not
Applicable
No
Influence
Some
Influence
Moderate Influence
Significant Influence
Very Significant Influence
Image
Teamwork
Brand
Engagement
Stress
Customer Satisfaction
Communications
Job Satisfaction
11 © 2013 ROI Institute. All rights reserved.
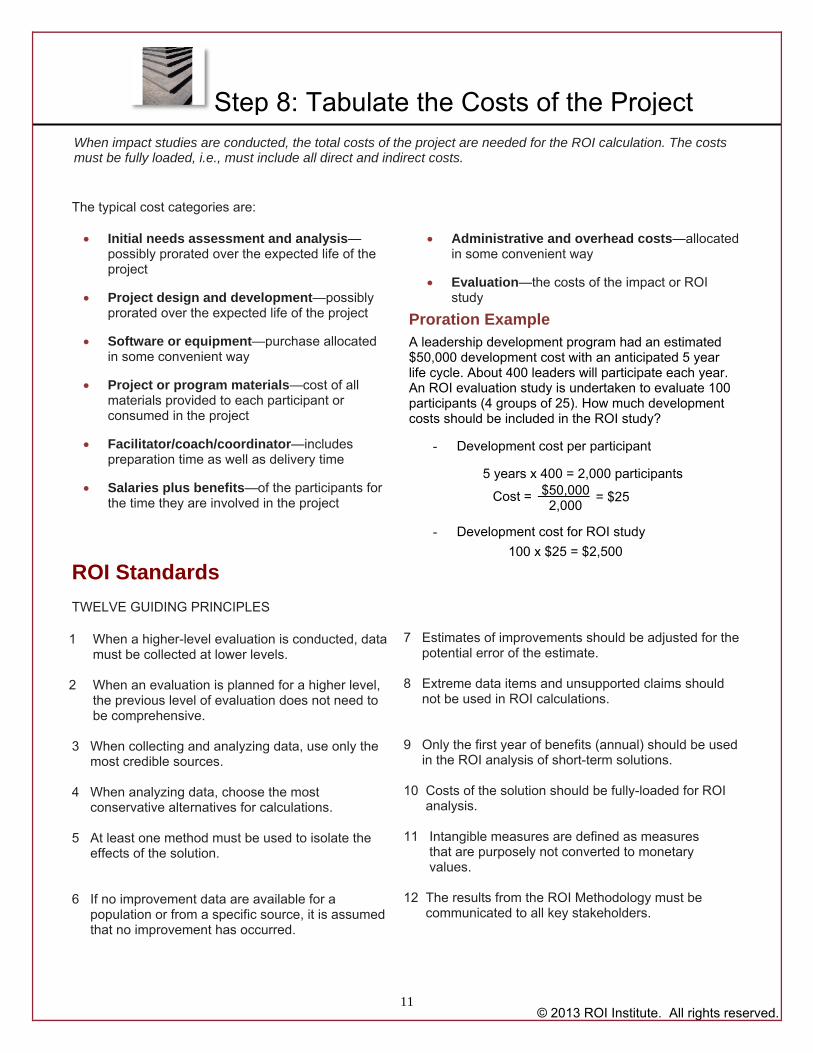
The typical cost categories are: Initial needs assessment and analysis—
possibly prorated over the expected life of the project
Project design and development—possibly prorated over the expected life of the project
Software or equipment—purchase allocated in some convenient way
Project or program materials—cost of all materials provided to each participant or consumed in the project
Facilitator/coach/coordinator—includes preparation time as well as delivery time
Salaries plus benefits—of the participants for the time they are involved in the project
ROI Standards
Administrative and overhead costs—allocated in some convenient way
Evaluation—the costs of the impact or ROI study
TWELVE GUIDING PRINCIPLES
1 When a higher-level evaluation is conducted, data must be collected at lower levels.
2 When an evaluation is planned for a higher level,
the previous level of evaluation does not need to be comprehensive.
3 When collecting and analyzing data, use only the most credible sources. 4 When analyzing data, choose the most conservative alternatives for calculations. 5 At least one method must be used to isolate the effects of the solution. 6 If no improvement data are available for a population or from a specific source, it is assumed that no improvement has occurred.
7 Estimates of improvements should be adjusted for the potential error of the estimate. 8 Extreme data items and unsupported claims should not be used in ROI calculations. 9 Only the first year of benefits (annual) should be used in the ROI analysis of short-term solutions. 10 Costs of the solution should be fully-loaded for ROI analysis. 11 Intangible measures are defined as measures that are purposely not converted to monetary values. 12 The results from the ROI Methodology must be communicated to all key stakeholders.
Step 8: Tabulate the Costs of the Project When impact studies are conducted, the total costs of the project are needed for the ROI calculation. The costs must be fully loaded, i.e., must include all direct and indirect costs.
Proration Example
A leadership development program had an estimated $50,000 development cost with an anticipated 5 year life cycle. About 400 leaders will participate each year. An ROI evaluation study is undertaken to evaluate 100 participants (4 groups of 25). How much development costs should be included in the ROI study?
- Development cost per participant
5 years x 400 = 2,000 participants
- Development cost for ROI study
100 x $25 = $2,500
Cost =
$50,000
2,000 = $25
12 © 2013 ROI Institute. All rights reserved.
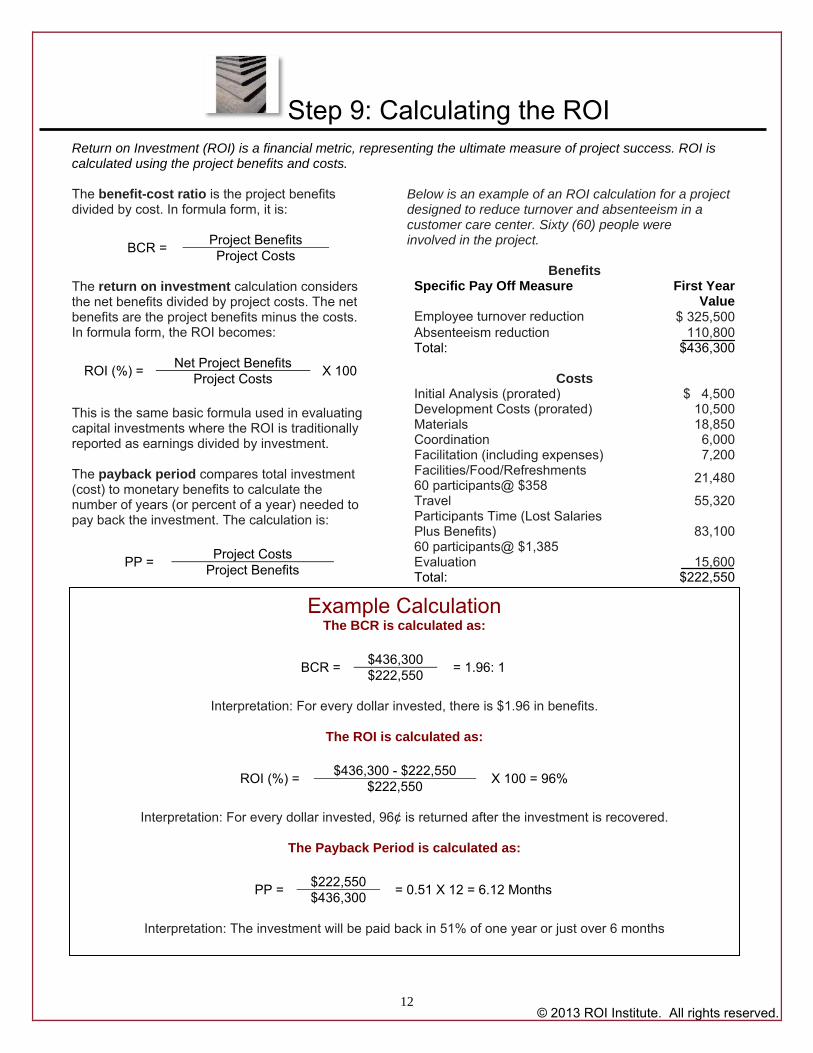
Step 9: Calculating the ROI Return on Investment (ROI) is a financial metric, representing the ultimate measure of project success. ROI is calculated using the project benefits and costs. The benefit-cost ratio is the project benefits divided by cost. In formula form, it is:
BCR = Project Benefits Project Costs
The return on investment calculation considers the net benefits divided by project costs. The net benefits are the project benefits minus the costs. In formula form, the ROI becomes:
ROI (%) = Net Project Benefits
X 100 Project Costs
This is the same basic formula used in evaluating capital investments where the ROI is traditionally reported as earnings divided by investment. The payback period compares total investment (cost) to monetary benefits to calculate the number of years (or percent of a year) needed to pay back the investment. The calculation is:
PP = Project Costs
Project Benefits
Below is an example of an ROI calculation for a project designed to reduce turnover and absenteeism in a customer care center. Sixty (60) people were involved in the project.
Benefits Specific Pay Off Measure First Year
ValueEmployee turnover reduction $ 325,500Absenteeism reduction 110,800Total: $436,300
Costs
Initial Analysis (prorated) $ 4,500Development Costs (prorated) 10,500Materials 18,850Coordination 6,000Facilitation (including expenses) 7,200Facilities/Food/Refreshments 60 participants@ $358
21,480
Travel 55,320Participants Time (Lost Salaries Plus Benefits) 60 participants@ $1,385
83,100
Evaluation 15,600Total: $222,550
Example Calculation The BCR is calculated as:
BCR = $436,300
= 1.96: 1 $222,550
Interpretation: For every dollar invested, there is $1.96 in benefits.
The ROI is calculated as:
ROI (%) = $436,300 - $222,550
X 100 = 96% $222,550
Interpretation: For every dollar invested, 96¢ is returned after the investment is recovered.
The Payback Period is calculated as:
PP = $222,550
= 0.51 X 12 = 6.12 Months $436,300
Interpretation: The investment will be paid back in 51% of one year or just over 6 months
13
© 2013 ROI Institute. All rights reserved.
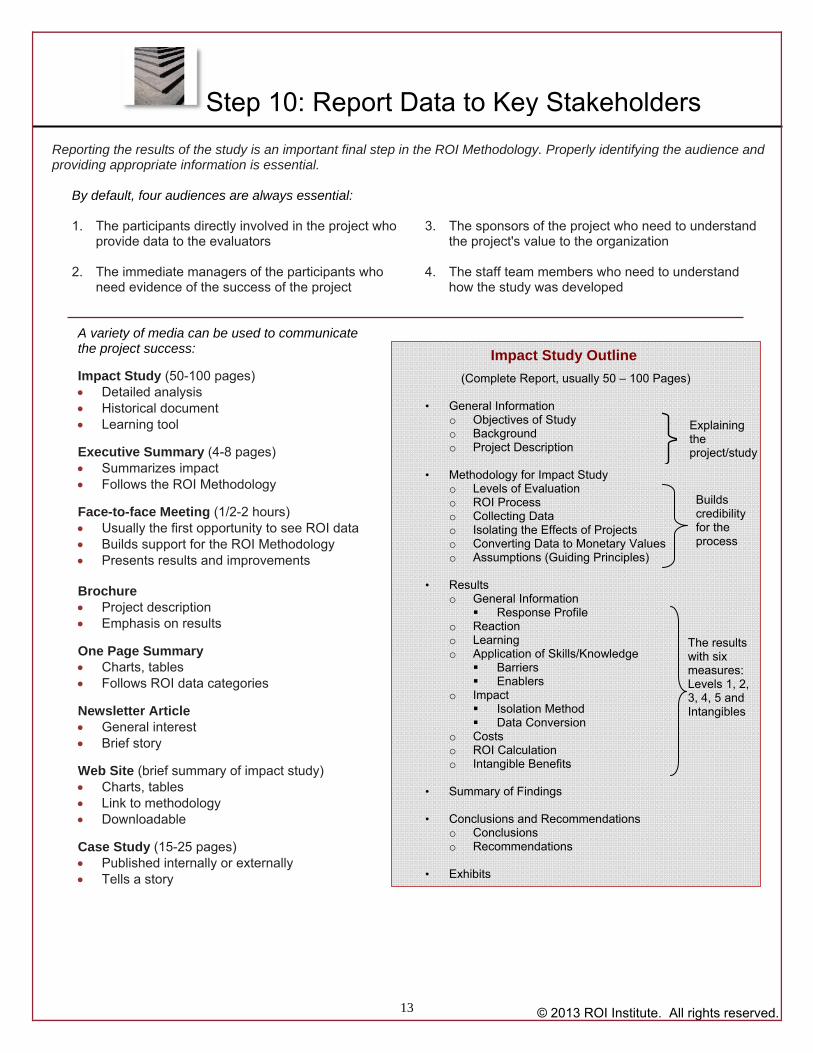
By default, four audiences are always essential: 1. The participants directly involved in the project who
provide data to the evaluators
2. The immediate managers of the participants who need evidence of the success of the project
3. The sponsors of the project who need to understand the project's value to the organization
4. The staff team members who need to understand
how the study was developed A variety of media can be used to communicate the project success: Impact Study (50-100 pages) Detailed analysis Historical document Learning tool
Executive Summary (4-8 pages) Summarizes impact Follows the ROI Methodology
Face-to-face Meeting (1/2-2 hours) Usually the first opportunity to see ROI data Builds support for the ROI Methodology Presents results and improvements
Brochure Project description Emphasis on results
One Page Summary Charts, tables Follows ROI data categories
Newsletter Article General interest Brief story
Web Site (brief summary of impact study) Charts, tables Link to methodology Downloadable
Case Study (15-25 pages) Published internally or externally Tells a story
Impact Study Outline
(Complete Report, usually 50 – 100 Pages) • General Information
o Objectives of Study o Background o Project Description
• Methodology for Impact Study
o Levels of Evaluation o ROI Process o Collecting Data o Isolating the Effects of Projects o Converting Data to Monetary Values o Assumptions (Guiding Principles)
• Results
o General Information Response Profile
o Reaction o Learning o Application of Skills/Knowledge
Barriers Enablers
o Impact Isolation Method Data Conversion
o Costs o ROI Calculation o Intangible Benefits
• Summary of Findings
• Conclusions and Recommendations
o Conclusions o Recommendations
• Exhibits
Step 10: Report Data to Key Stakeholders Reporting the results of the study is an important final step in the ROI Methodology. Properly identifying the audience and providing appropriate information is essential.
The results with six measures: Levels 1, 2, 3, 4, 5 and Intangibles
Builds credibility for the process
Explaining the project/study
14 © 2013 ROI Institute. All rights reserved.
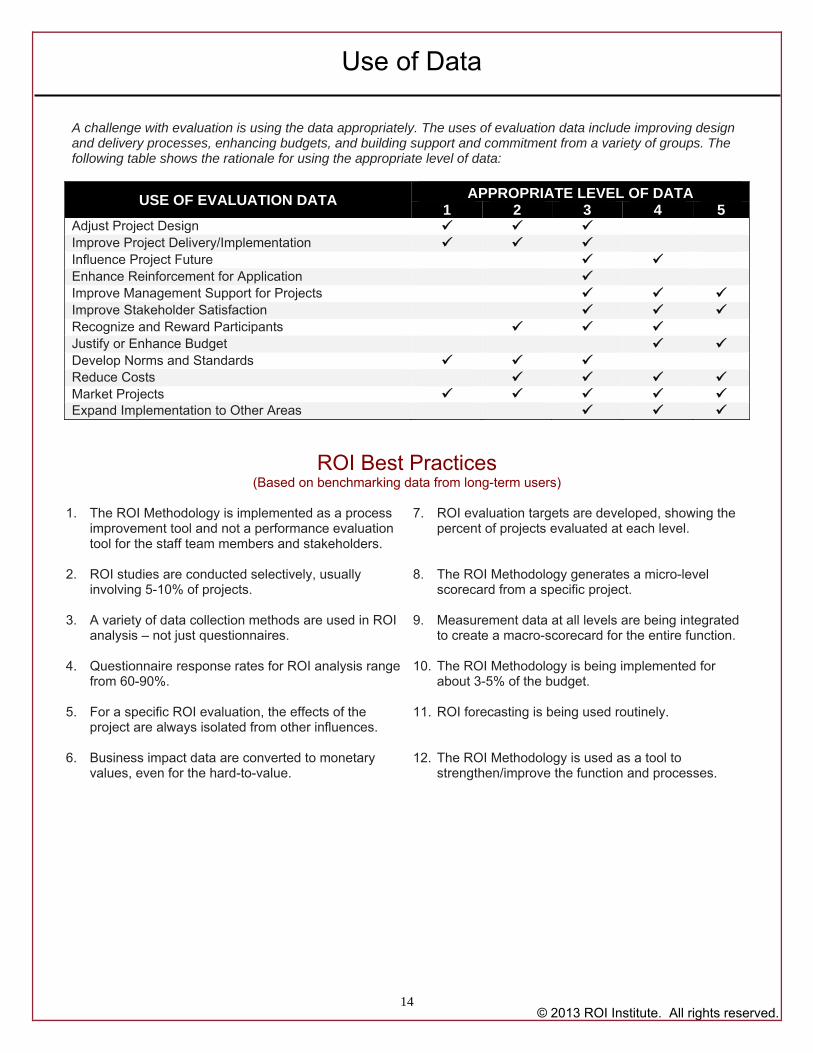
A challenge with evaluation is using the data appropriately. The uses of evaluation data include improving design and delivery processes, enhancing budgets, and building support and commitment from a variety of groups. The following table shows the rationale for using the appropriate level of data:
USE OF EVALUATION DATA APPROPRIATE LEVEL OF DATA 1 2 3 4 5
Adjust Project Design Improve Project Delivery/Implementation Influence Project Future Enhance Reinforcement for Application Improve Management Support for Projects Improve Stakeholder Satisfaction Recognize and Reward Participants Justify or Enhance Budget Develop Norms and Standards Reduce Costs Market Projects Expand Implementation to Other Areas
ROI Best Practices (Based on benchmarking data from long-term users)
1. The ROI Methodology is implemented as a process
improvement tool and not a performance evaluation tool for the staff team members and stakeholders.
2. ROI studies are conducted selectively, usually involving 5-10% of projects.
3. A variety of data collection methods are used in ROI
analysis – not just questionnaires.
4. Questionnaire response rates for ROI analysis range from 60-90%.
5. For a specific ROI evaluation, the effects of the project are always isolated from other influences.
6. Business impact data are converted to monetary
values, even for the hard-to-value.
7. ROI evaluation targets are developed, showing the
percent of projects evaluated at each level.
8. The ROI Methodology generates a micro-level scorecard from a specific project.
9. Measurement data at all levels are being integrated to create a macro-scorecard for the entire function.
10. The ROI Methodology is being implemented for about 3-5% of the budget.
11. ROI forecasting is being used routinely.
12. The ROI Methodology is used as a tool to
strengthen/improve the function and processes.
Use of Data

15 © 2013 ROI Institute. All rights reserved.
All programs are not evaluated to every level. How does your use of the levels compare to the recommended use?
Level Measurement Category Current Status* Recommended* Comments
About Status
0
Inputs Measures inputs into projects including number of projects, attendees, audience, costs, and efficiencies
100% This is being accomplished now
1
Reaction Measure reaction to, and satisfaction with, the experience, ambiance, content, and value of the project
90-100%
Need more focus on content and perceived value
2
Learning Measures what participants learned in the project – information, knowledge, skills, and contacts (takeaways from the project)
60-80% Must use simple learning measures
3
Application and Implementation Measures progress after the project – the use of information, knowledge, skills, and contacts
30% Need more follow-up
4
Impact Measures changes in business impact variables such as output, quality, time, and cost-linked to the project
10-20% This is the connection to business impact
5
ROI Compares the monetary benefits of the business impact measures to the costs of the project
5-10% The ultimate evaluation
*Percent of projects evaluated at this level *Add your numbers in each box Specific Actions
Status of Measurement and Evaluation
16 © 2013 ROI Institute. All rights reserved.
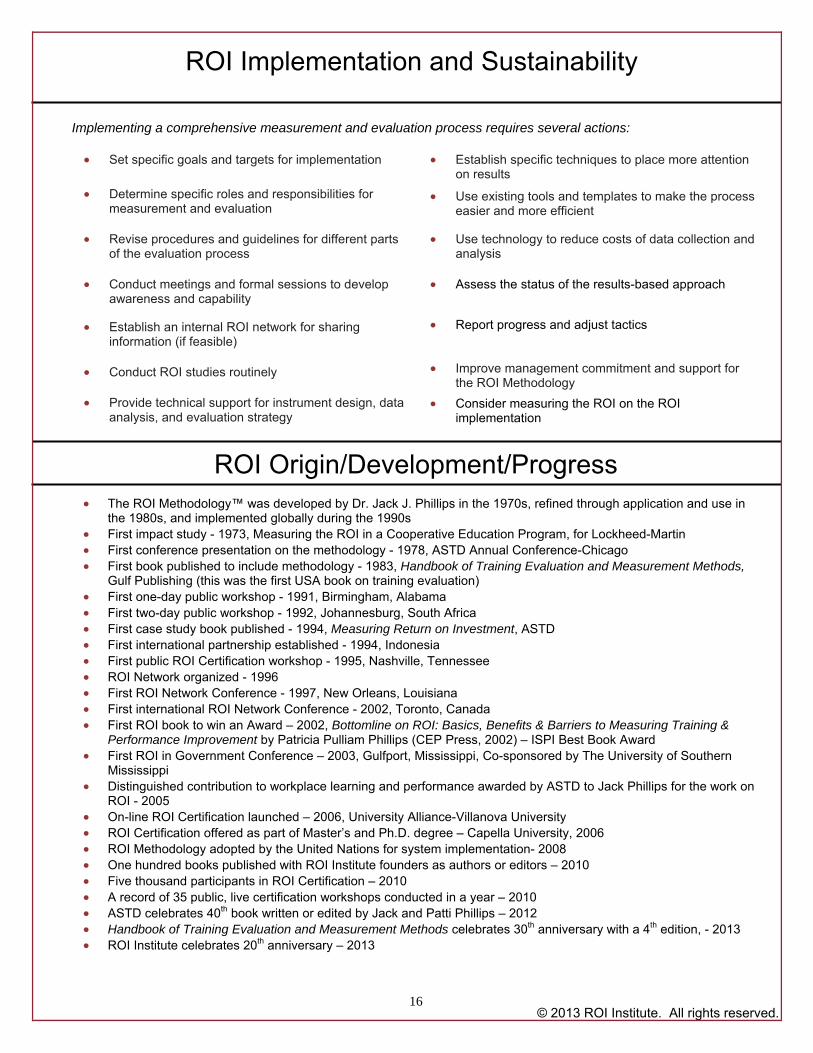
Implementing a comprehensive measurement and evaluation process requires several actions: Set specific goals and targets for implementation Determine specific roles and responsibilities for
measurement and evaluation Revise procedures and guidelines for different parts
of the evaluation process Conduct meetings and formal sessions to develop
awareness and capability
Establish an internal ROI network for sharing information (if feasible)
Conduct ROI studies routinely
Provide technical support for instrument design, data
analysis, and evaluation strategy
Establish specific techniques to place more attention on results
Use existing tools and templates to make the process easier and more efficient
Use technology to reduce costs of data collection and analysis
Assess the status of the results-based approach
Report progress and adjust tactics
Improve management commitment and support for
the ROI Methodology
Consider measuring the ROI on the ROI implementation
ROI Origin/Development/Progress The ROI Methodology™ was developed by Dr. Jack J. Phillips in the 1970s, refined through application and use in
the 1980s, and implemented globally during the 1990s First impact study - 1973, Measuring the ROI in a Cooperative Education Program, for Lockheed-Martin First conference presentation on the methodology - 1978, ASTD Annual Conference-Chicago First book published to include methodology - 1983, Handbook of Training Evaluation and Measurement Methods,
Gulf Publishing (this was the first USA book on training evaluation) First one-day public workshop - 1991, Birmingham, Alabama First two-day public workshop - 1992, Johannesburg, South Africa First case study book published - 1994, Measuring Return on Investment, ASTD First international partnership established - 1994, Indonesia First public ROI Certification workshop - 1995, Nashville, Tennessee ROI Network organized - 1996 First ROI Network Conference - 1997, New Orleans, Louisiana First international ROI Network Conference - 2002, Toronto, Canada First ROI book to win an Award – 2002, Bottomline on ROI: Basics, Benefits & Barriers to Measuring Training &
Performance Improvement by Patricia Pulliam Phillips (CEP Press, 2002) – ISPI Best Book Award First ROI in Government Conference – 2003, Gulfport, Mississippi, Co-sponsored by The University of Southern
Mississippi Distinguished contribution to workplace learning and performance awarded by ASTD to Jack Phillips for the work on
ROI - 2005 On-line ROI Certification launched – 2006, University Alliance-Villanova University ROI Certification offered as part of Master’s and Ph.D. degree – Capella University, 2006 ROI Methodology adopted by the United Nations for system implementation- 2008 One hundred books published with ROI Institute founders as authors or editors – 2010 Five thousand participants in ROI Certification – 2010 A record of 35 public, live certification workshops conducted in a year – 2010 ASTD celebrates 40th book written or edited by Jack and Patti Phillips – 2012 Handbook of Training Evaluation and Measurement Methods celebrates 30th anniversary with a 4th edition, - 2013 ROI Institute celebrates 20th anniversary – 2013
ROI Implementation and Sustainability

17 © 2013 ROI Institute. All rights reserved.
Workshops – Learning experiences to meet your needs:
• Five-day certification workshop (Public and Internal) • 1, 2 or 3 day workshops (Public and Internal) • Online and self-study options available
Consulting – Working with private businesses and public sector organizations, offering a range of services from developing complete impact studies to coaching organizations through all levels of measurement and evaluation, including ROI. Publishing – Books and articles are available to professionals, practitioners, academics and students. We often request contributions of case studies, tools, templates and success stories for inclusion in our books. Partners – Our strategic partnerships yield mutual and collaborative delivery of services. Our international partnerships foster the implementation of the ROI Methodology around the world. Web Site and Internet Activities – www.roiinstitute.net provides information about the ROI Institute, the ROI Methodology, ROI Certification workshops, and so much more, including a wealth of resources on accountability, measurement and evaluation. ROI Institute members, who have completed the ROI Certification workshop, gain access to our Members Only web site with even more information and resources supporting ROI implementation. The ROI Resource Center provides books, case studies, research reports, briefing papers, tools, templates, and specialty items.
ROI Methodology™
More than 4,000 organizations have implemented the ROI Methodology
More than 7,000 professionals have attended ROI Certification Workshops
More than 30,000 professionals have participated in two-day ROI workshops
International and Local ROI Networks
Over 50 books translated into 38 languages
Jack J. Phillips, Ph.D.
Chairman – developed the ROI Methodology in the 1970s and instills it in latest applications for the 21st century.
Patti P. Phillips, Ph.D.
President and CEO – leads the application and implementation of ROI Methodology worldwide.
Plus …
More than 100 ROI certified consultants provide coaching, consulting and workshops in more than 50 countries around the world.
The ROI Methodology™– Realize the value of programs, projects and solutions by capturing and measuring data for Reaction, Learning, Application, Impact, ROI and Intangible Benefits
For additional copies of this document or additional information about the ROI Methodology, please contact ROI Institute Canada : 613-567-9402 : [email protected] : www.roiinstitutecanada.com

18 © 2013 ROI Institute. All rights reserved.
Action Plan
Top Related