


Languages
Pages
Legal

June 9, 2015
The Financial Impact of Hospital Readmissions
HFMA Tennessee Chapter
Copyright, Disclaimer and Terms of Use• The material contained within this presentation is proprietary. Reproduction without permission is strictly prohibited.
• This document may not be copied, reproduced in any manner or format or furnished to others, and derivative works that comment on or otherwise explain it or assist in its implementation may not be prepared, copied, published and distributed, in whole or in part, without written permission of BESLER Consulting. This document may not be modified in any way, (such as, for example, removing the copyright notice or references to the BESLER Consulting or other organizations).
• This presentation does not represent legal advice.
• The information herein is valid for the date of the presentation only
Learning Objectives• Understand the history and current state of the CMS Hospital Readmissions Reduction Program
• Review the impact of the CMS Hospital Readmissions Reduction Program on hospitals, nationally and in Tennessee
• Calculate an individual hospital’s readmission penalty and the financial impact related to reducing excess readmissions
• Identify underlying readmissions trends based on the QualityNetHospital‐Specific Readmissions Report
• Review the ways in which new reimbursement policies will influence provider efforts to reduce readmissions

History of the CMS Hospital Readmissions Reduction Program


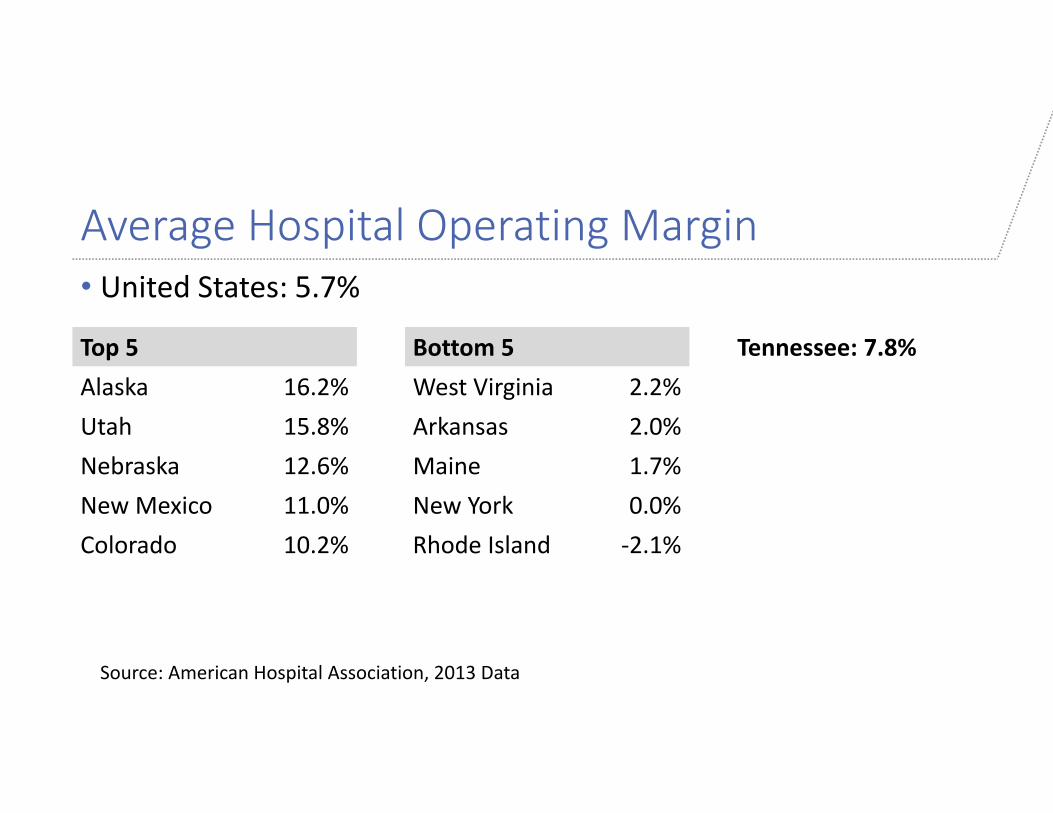
Average Hospital Operating Margin• United States: 5.7%
Source: American Hospital Association, 2013 Data
Top 5 Bottom 5 Tennessee: 7.8%Alaska 16.2% West Virginia 2.2%Utah 15.8% Arkansas 2.0%Nebraska 12.6% Maine 1.7%New Mexico 11.0% New York 0.0%Colorado 10.2% Rhode Island ‐2.1%
“Excess Readmissions” Definition• More readmissions than CMS predicts…
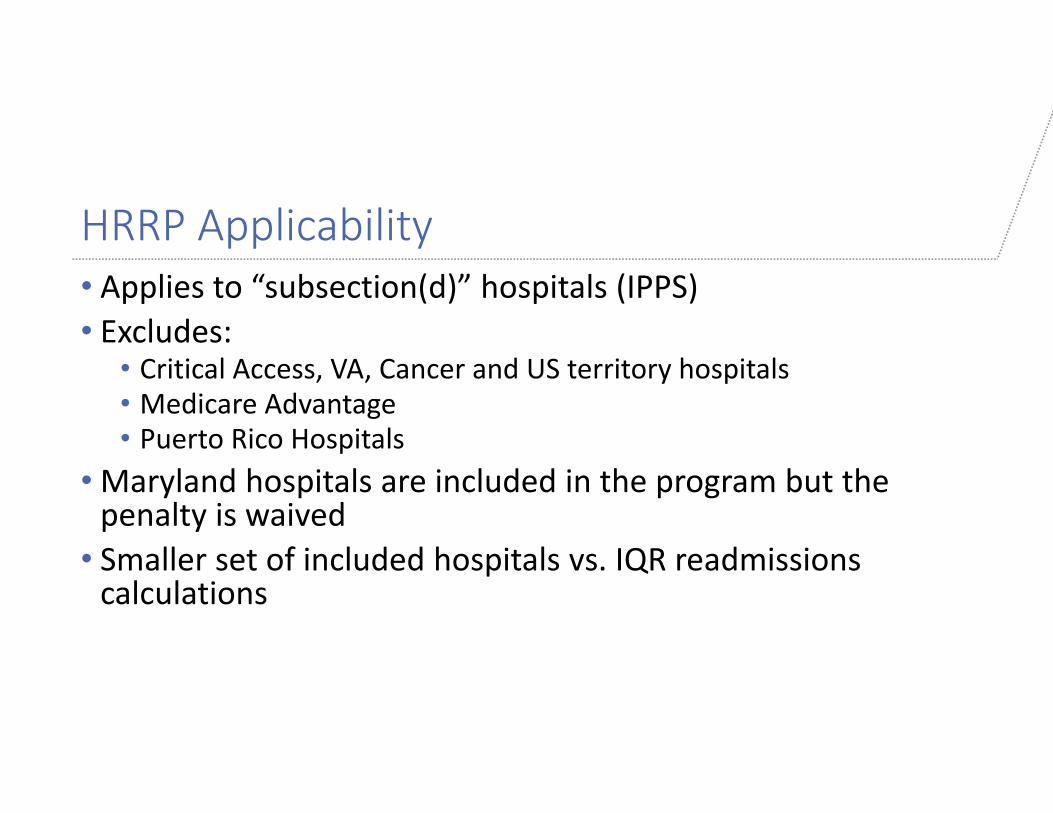
HRRP Applicability• Applies to “subsection(d)” hospitals (IPPS)• Excludes:
• Critical Access, VA, Cancer and US territory hospitals• Medicare Advantage• Puerto Rico Hospitals
• Maryland hospitals are included in the program but the penalty is waived
• Smaller set of included hospitals vs. IQR readmissions calculations

Readmissions Measures• AMI• Heart Failure• Pneumonia• COPD• Total Hip and/or Knee Replacement
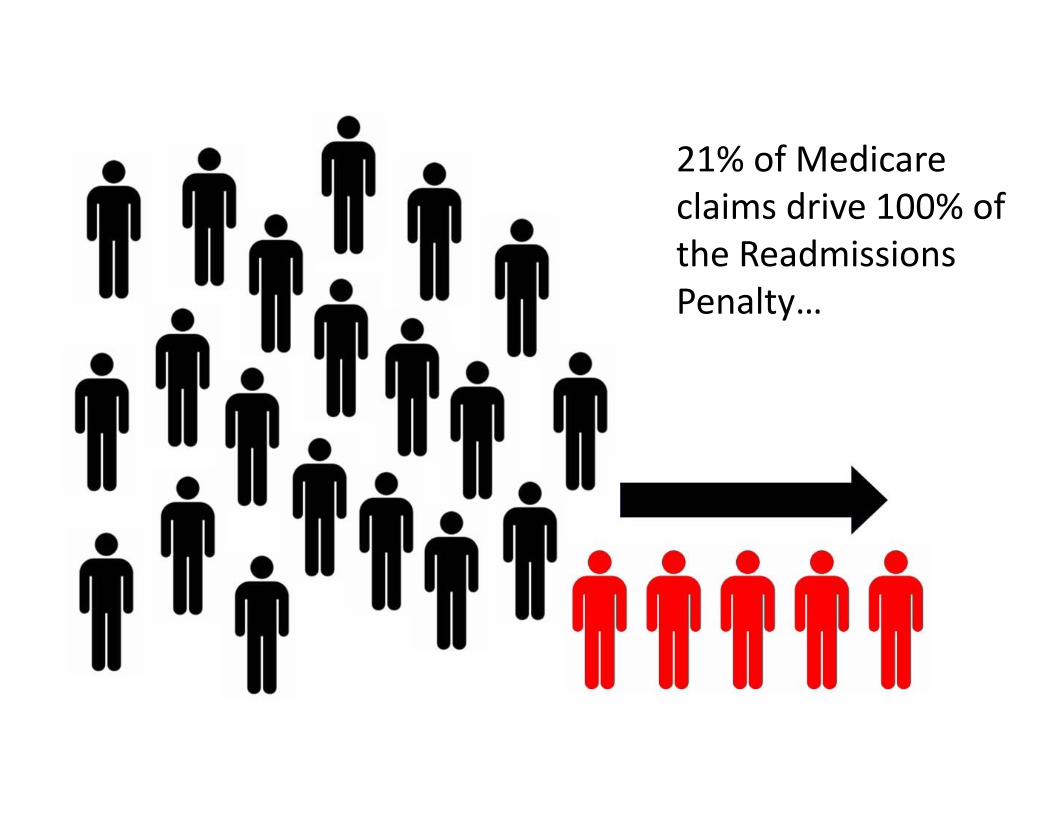
21% of Medicare claims drive 100% of the Readmissions Penalty…


Readmission Measures – Timing• Example: Coronary Artery Bypass Graft Surgery (CABG) • FY 2014 IPPS Final Rule: CMS indicated intent to explore a readmissions measure for CABG (August 2013)
• FY 2015 IPPS Proposed Rule: Proposed adding CABG as a new readmissions measure for FY 2017 (May 2014)
• FY 2015 IPPS Final Rule: Finalized adding CABG as a new readmissions measure for FY 2017 (August 2014)
• Measure Review Period will be July 1, 2012 – June 30, 2015
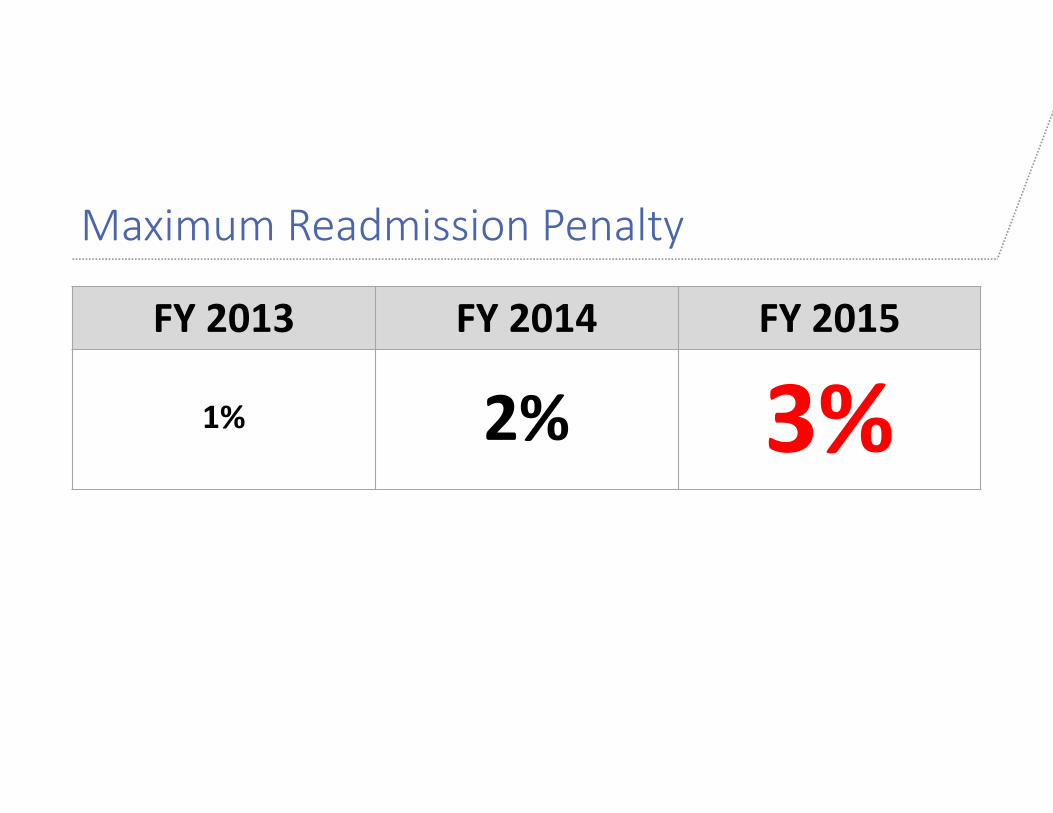
Maximum Readmission Penalty
FY 2013 FY 2014 FY 2015
1% 2% 3%
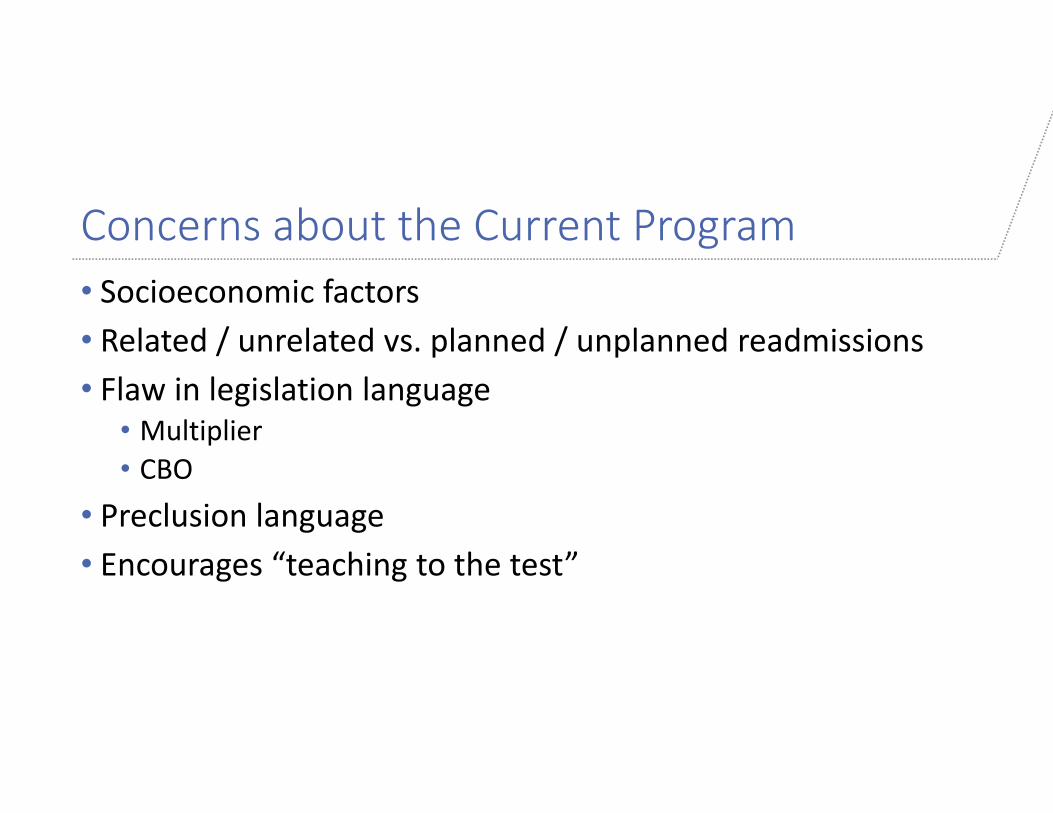
Concerns about the Current Program• Socioeconomic factors• Related / unrelated vs. planned / unplanned readmissions• Flaw in legislation language
• Multiplier• CBO
• Preclusion language• Encourages “teaching to the test”
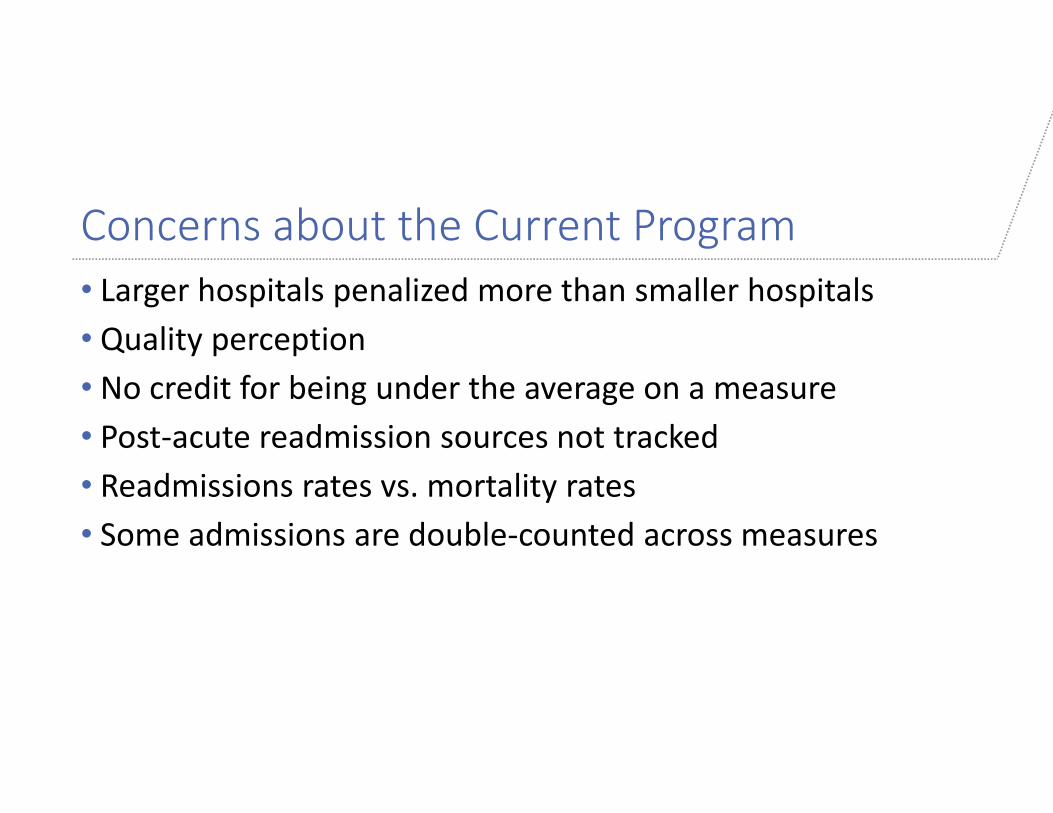
Concerns about the Current Program• Larger hospitals penalized more than smaller hospitals• Quality perception• No credit for being under the average on a measure• Post‐acute readmission sources not tracked• Readmissions rates vs. mortality rates• Some admissions are double‐counted across measures
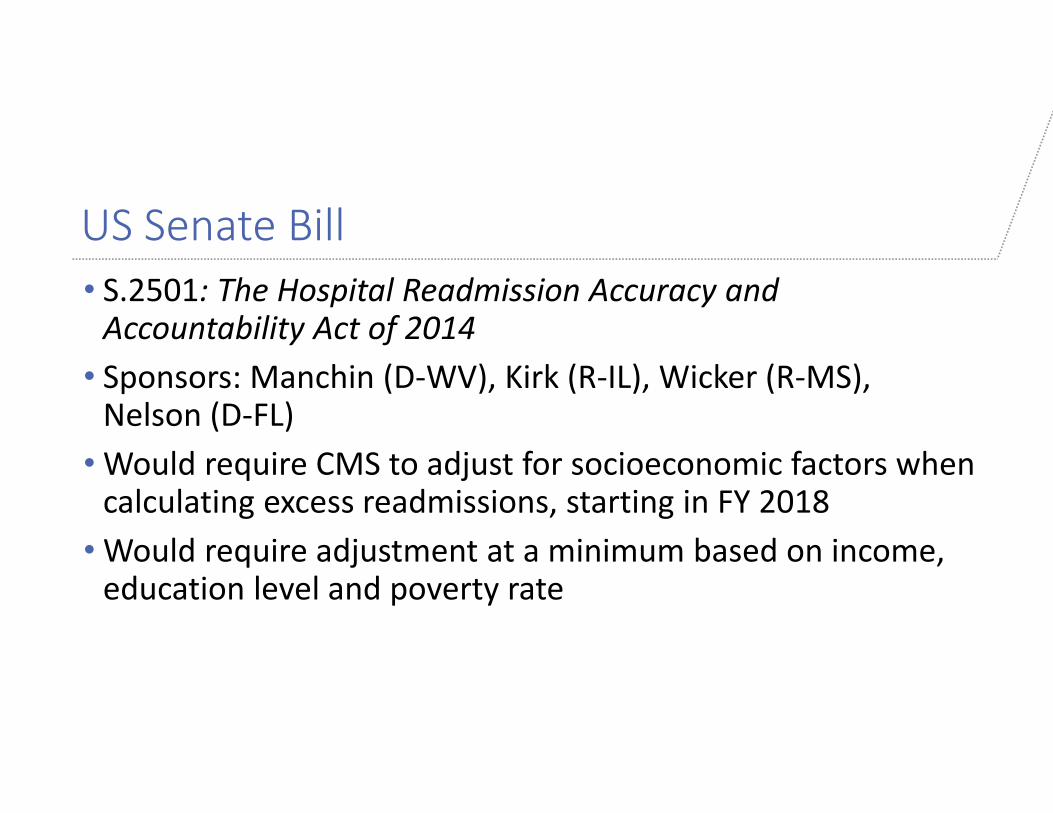
US Senate Bill• S.2501: The Hospital Readmission Accuracy and Accountability Act of 2014
• Sponsors: Manchin (D‐WV), Kirk (R‐IL), Wicker (R‐MS), Nelson (D‐FL)
• Would require CMS to adjust for socioeconomic factors when calculating excess readmissions, starting in FY 2018
• Would require adjustment at a minimum based on income, education level and poverty rate
Impact of the CMS Hospital Readmissions Reduction Program On US Hospitals
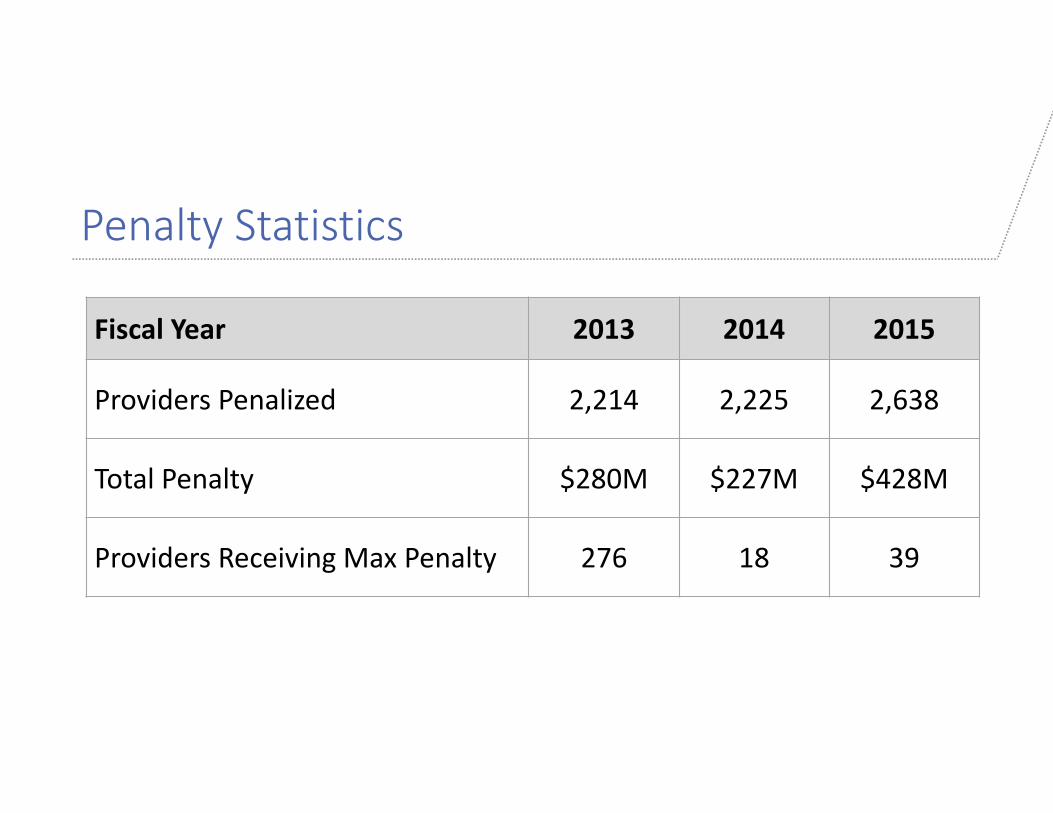
Penalty Statistics
Fiscal Year 2013 2014 2015
Providers Penalized 2,214 2,225 2,638
Total Penalty $280M $227M $428M
Providers Receiving Max Penalty 276 18 39
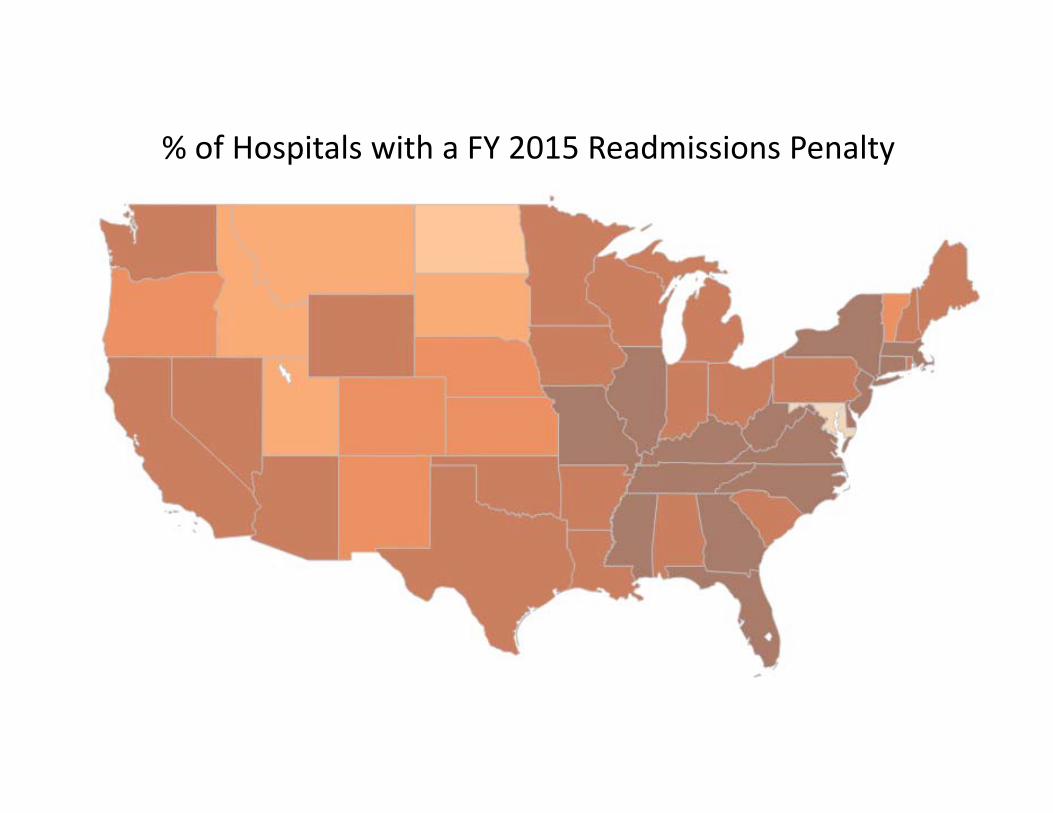
% of Hospitals with a FY 2015 Readmissions Penalty
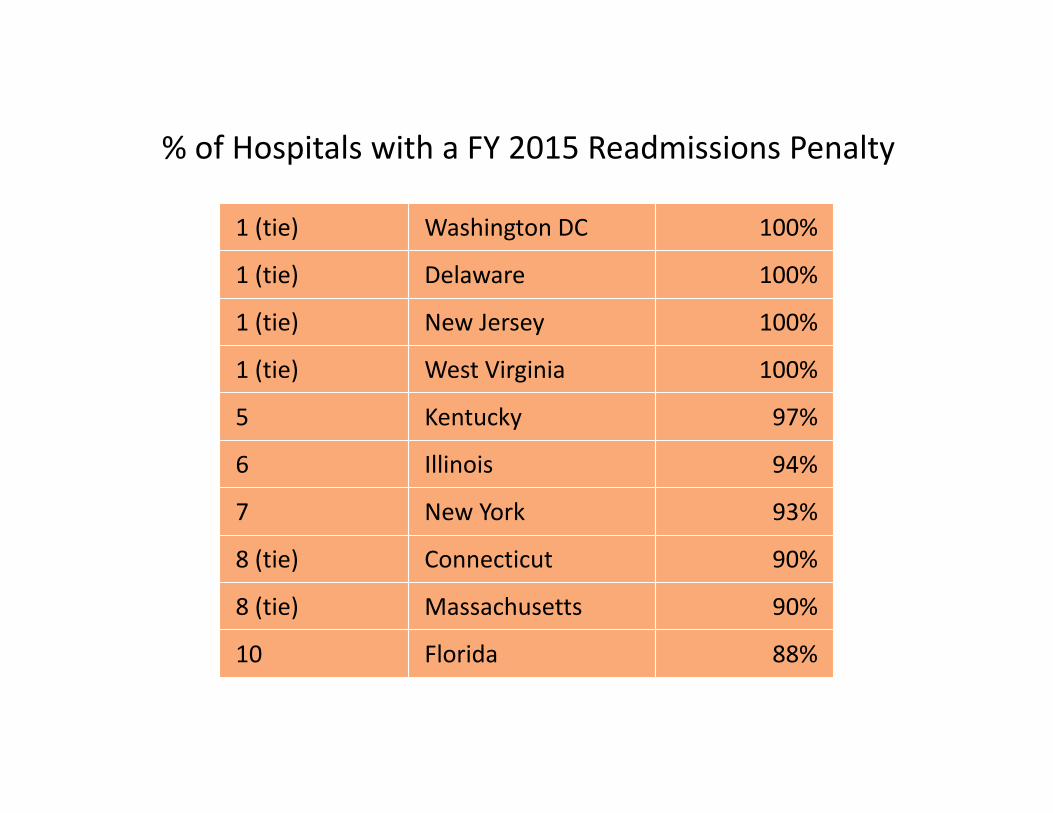
% of Hospitals with a FY 2015 Readmissions Penalty
1 (tie) Washington DC 100%
1 (tie) Delaware 100%
1 (tie) New Jersey 100%
1 (tie) West Virginia 100%
5 Kentucky 97%
6 Illinois 94%
7 New York 93%
8 (tie) Connecticut 90%
8 (tie) Massachusetts 90%
10 Florida 88%
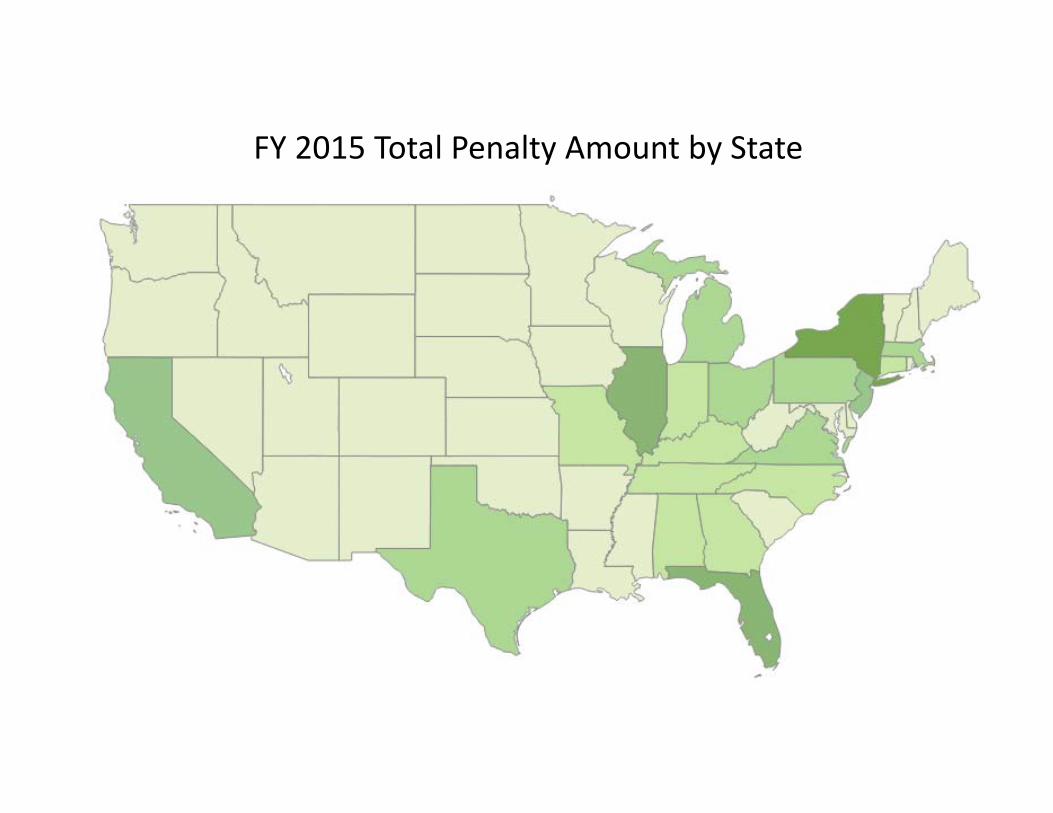
FY 2015 Total Penalty Amount by State
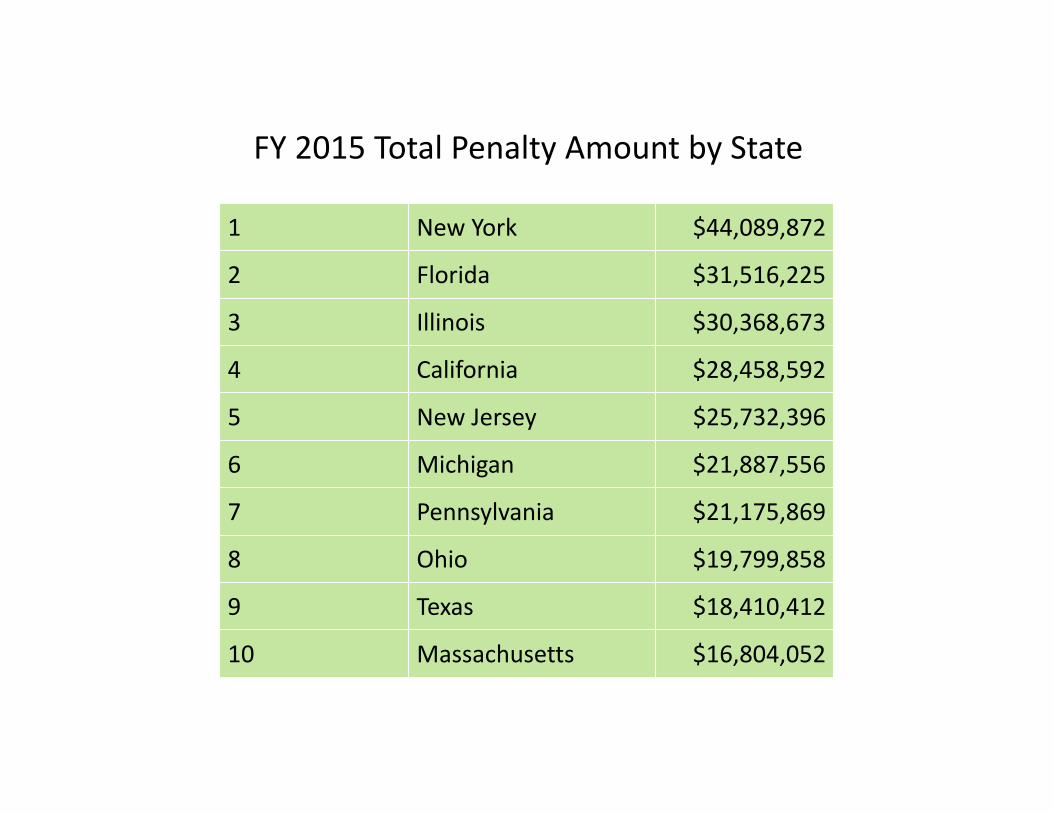
FY 2015 Total Penalty Amount by State
1 New York $44,089,872
2 Florida $31,516,225
3 Illinois $30,368,673
4 California $28,458,592
5 New Jersey $25,732,396
6 Michigan $21,887,556
7 Pennsylvania $21,175,869
8 Ohio $19,799,858
9 Texas $18,410,412
10 Massachusetts $16,804,052
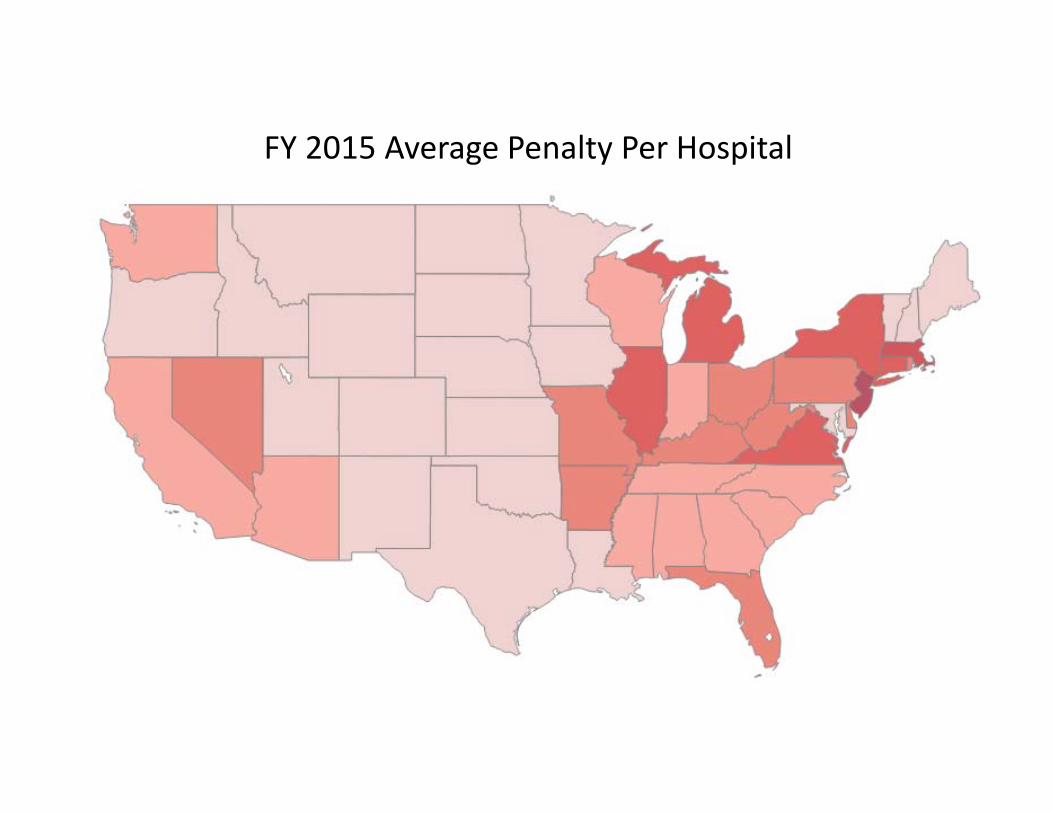
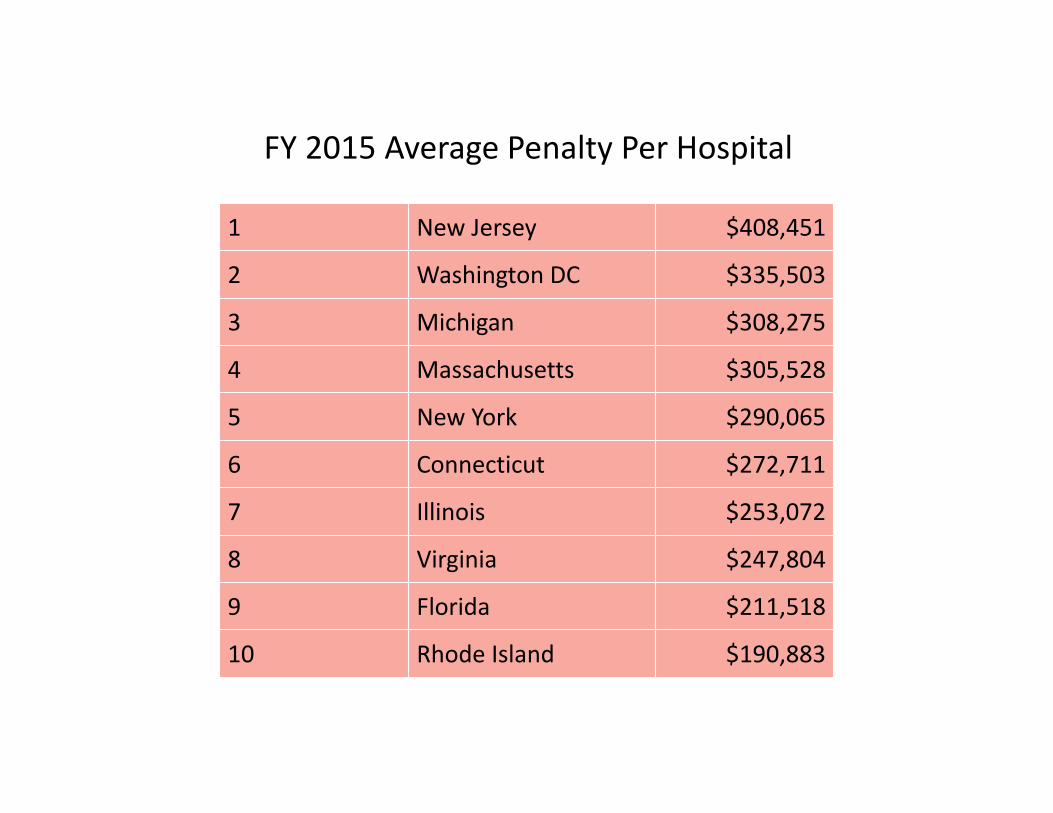
FY 2015 Average Penalty Per Hospital
FY 2015 Average Penalty Per Hospital
1 New Jersey $408,451
2 Washington DC $335,503
3 Michigan $308,275
4 Massachusetts $305,528
5 New York $290,065
6 Connecticut $272,711
7 Illinois $253,072
8 Virginia $247,804
9 Florida $211,518
10 Rhode Island $190,883
Impact of the CMS Hospital Readmissions Reduction Program On Tennessee Hospitals
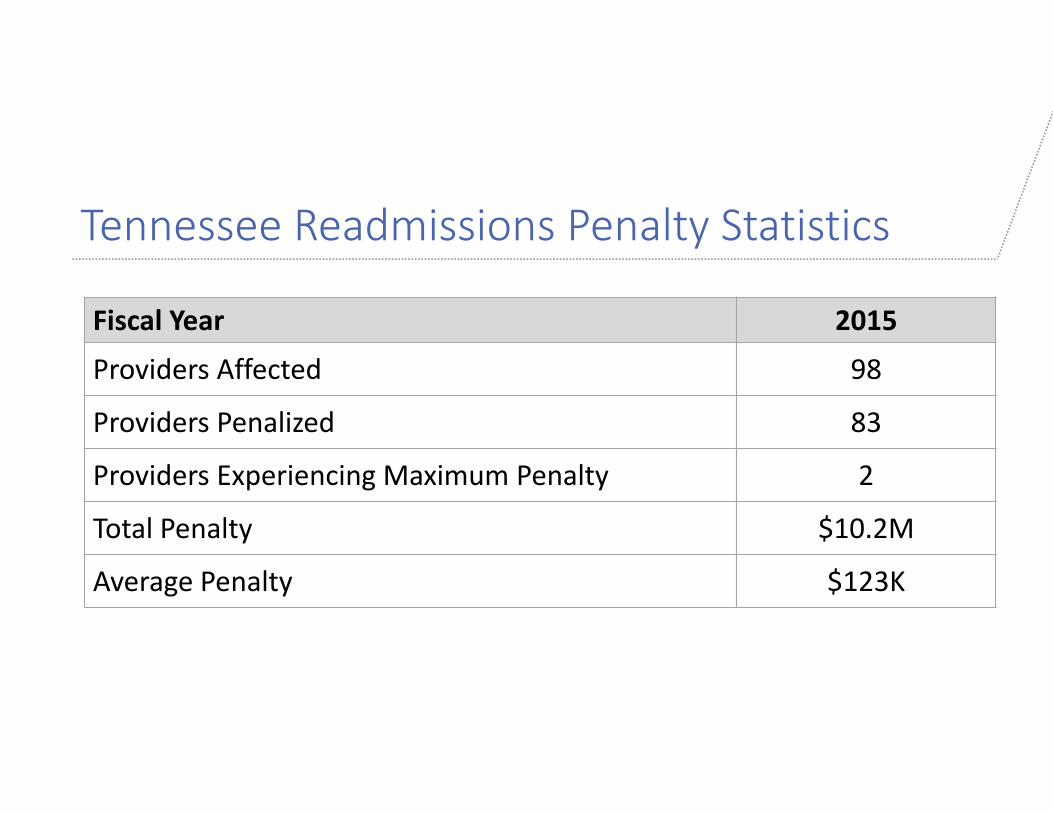
Tennessee Readmissions Penalty Statistics
Fiscal Year 2015
Providers Affected 98
Providers Penalized 83
Providers Experiencing Maximum Penalty 2
Total Penalty $10.2M
Average Penalty $123K
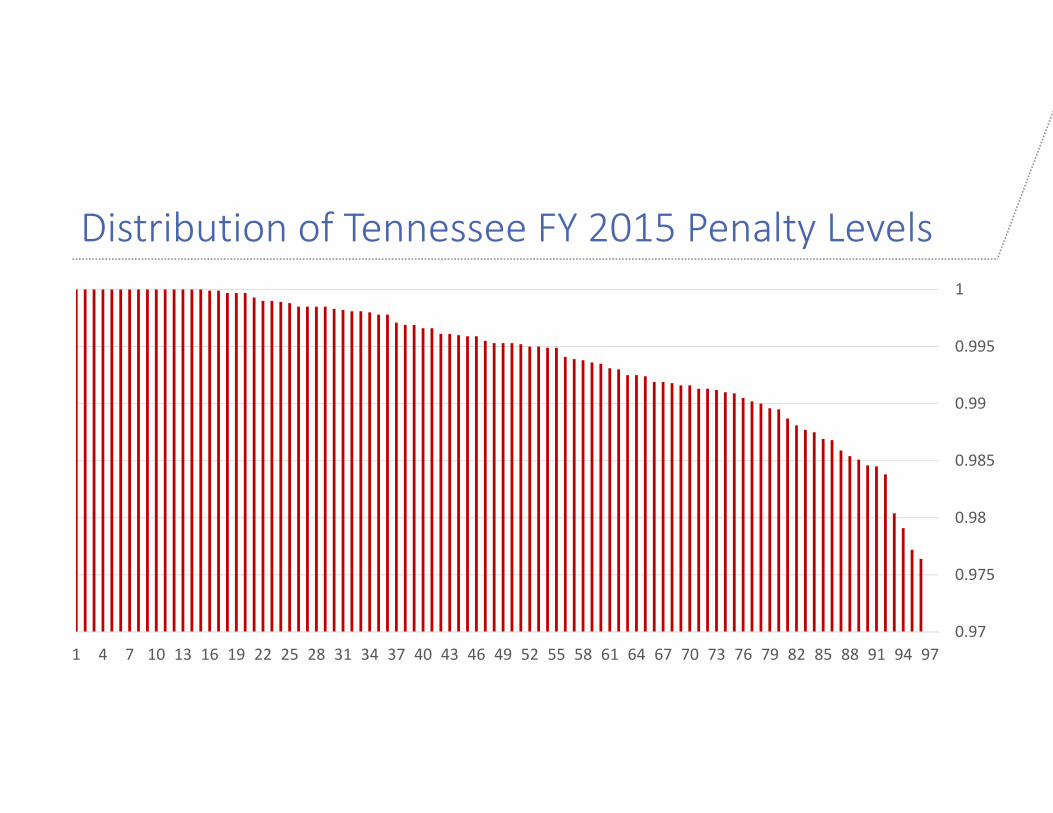
Distribution of Tennessee FY 2015 Penalty Levels
0.97
0.975
0.98
0.985
0.99
0.995
1
1 4 7 10 13 16 19 22 25 28 31 34 37 40 43 46 49 52 55 58 61 64 67 70 73 76 79 82 85 88 91 94 97

Calculating a Hospital’sReadmission Penalty
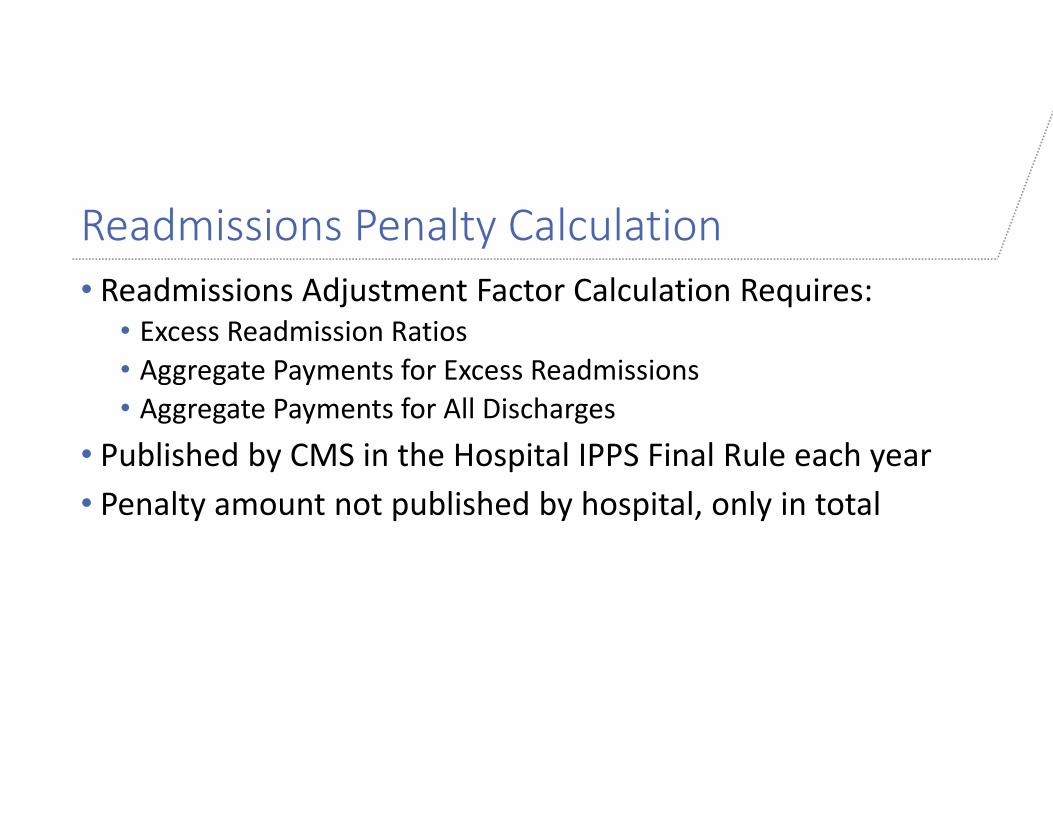
Readmissions Penalty Calculation• Readmissions Adjustment Factor Calculation Requires:
• Excess Readmission Ratios• Aggregate Payments for Excess Readmissions• Aggregate Payments for All Discharges
• Published by CMS in the Hospital IPPS Final Rule each year• Penalty amount not published by hospital, only in total
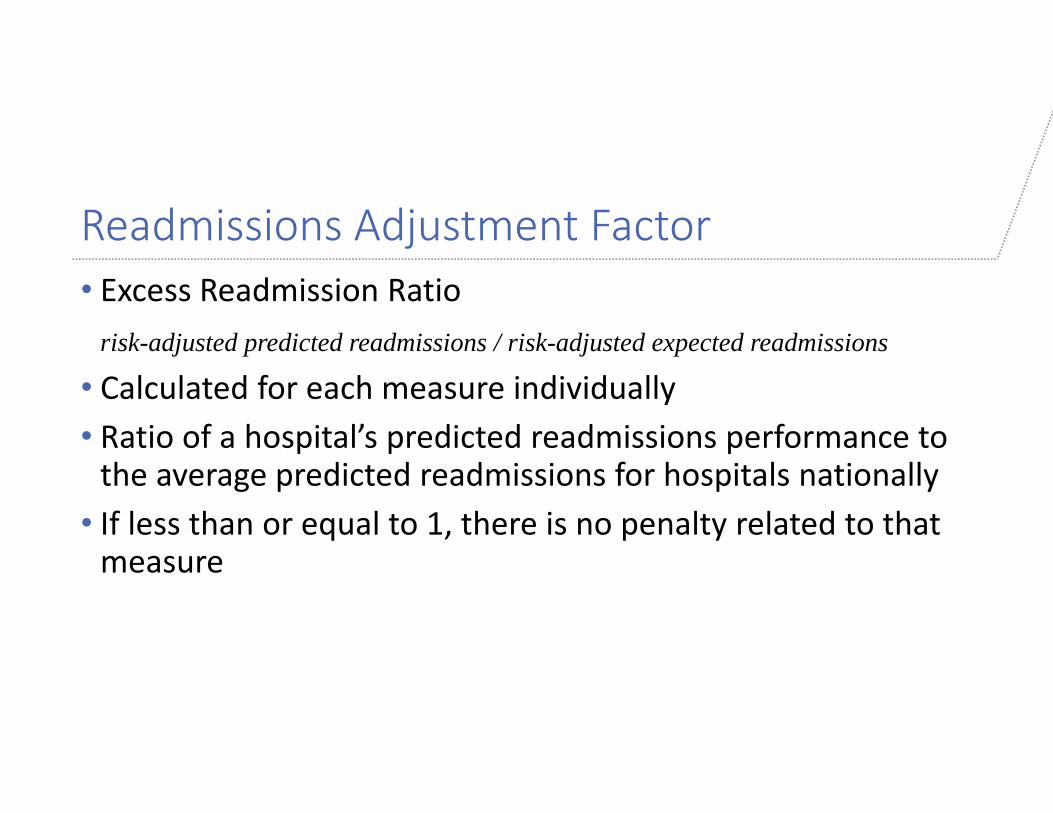
Readmissions Adjustment Factor• Excess Readmission Ratio
risk-adjusted predicted readmissions / risk-adjusted expected readmissions
• Calculated for each measure individually• Ratio of a hospital’s predicted readmissions performance to the average predicted readmissions for hospitals nationally
• If less than or equal to 1, there is no penalty related to that measure

“Hospitals cannot independently calculate their Excess Readmission Ratio (ERR) using only their own data, since such calculations require access to national Part A and Part B enrollment and claims data.”
‐ CMS
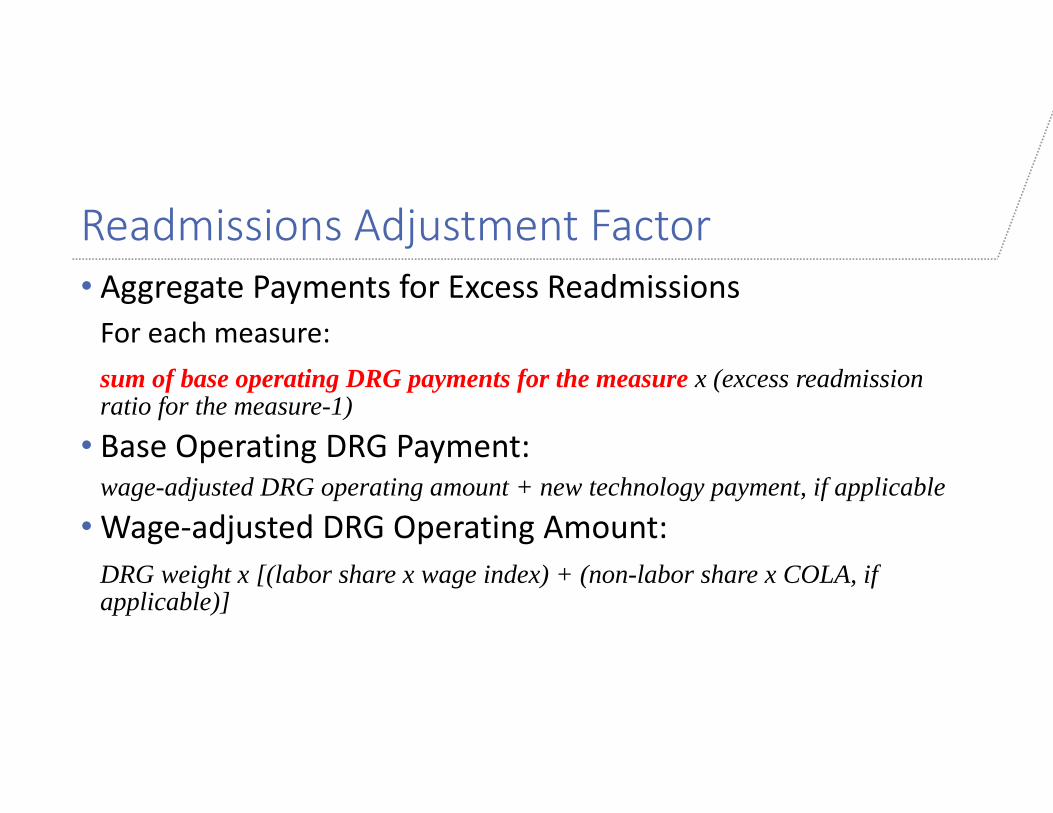
Readmissions Adjustment Factor• Aggregate Payments for Excess ReadmissionsFor each measure:sum of base operating DRG payments for the measure x (excess readmission ratio for the measure-1)
• Base Operating DRG Payment:wage-adjusted DRG operating amount + new technology payment, if applicable
• Wage‐adjusted DRG Operating Amount:DRG weight x [(labor share x wage index) + (non-labor share x COLA, if applicable)]
Readmissions Adjustment Factor• Aggregate Payments for All Discharges
sum of base operating DRG payments for all discharges
Readmissions Adjustment Factor• Readmissions Adjustment Ratio:
1 – (aggregate payments for excess readmissions / aggregate payments for all discharges)
• FY 2015 Readmissions Adjustment Factor:the higher of the Readmissions Adjustment Ratio or 0.97
Readmissions Penalty Amount• Readmissions Penalty (“Payment Adjustment Amount”):
[base operating DRG payment amount x readmissions adjustment factor] - base operating DRG payment amount.

Revenue Associated with Readmissions• Excess Readmissions Claim Revenue:
number of excess readmissions 1 x average payment per claim for each measure 2
1 Calculated using data from HospitalCompare.gov2 2015 Proposed Rule Medicare Provider Analysis and Review (MEDPAR) data. This data file includes Medicare inpatient claim data for FY 2013.

What About Cost?


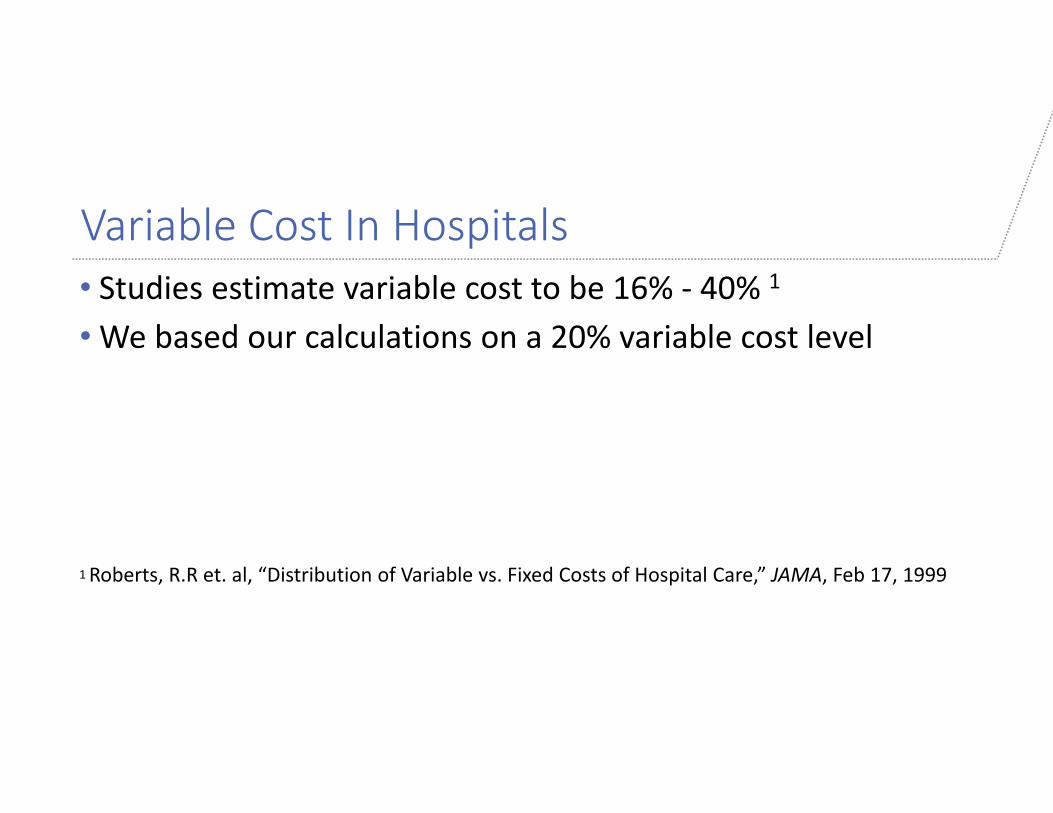
Variable Cost In Hospitals• Studies estimate variable cost to be 16% ‐ 40% 1
• We based our calculations on a 20% variable cost level
1 Roberts, R.R et. al, “Distribution of Variable vs. Fixed Costs of Hospital Care,” JAMA, Feb 17, 1999
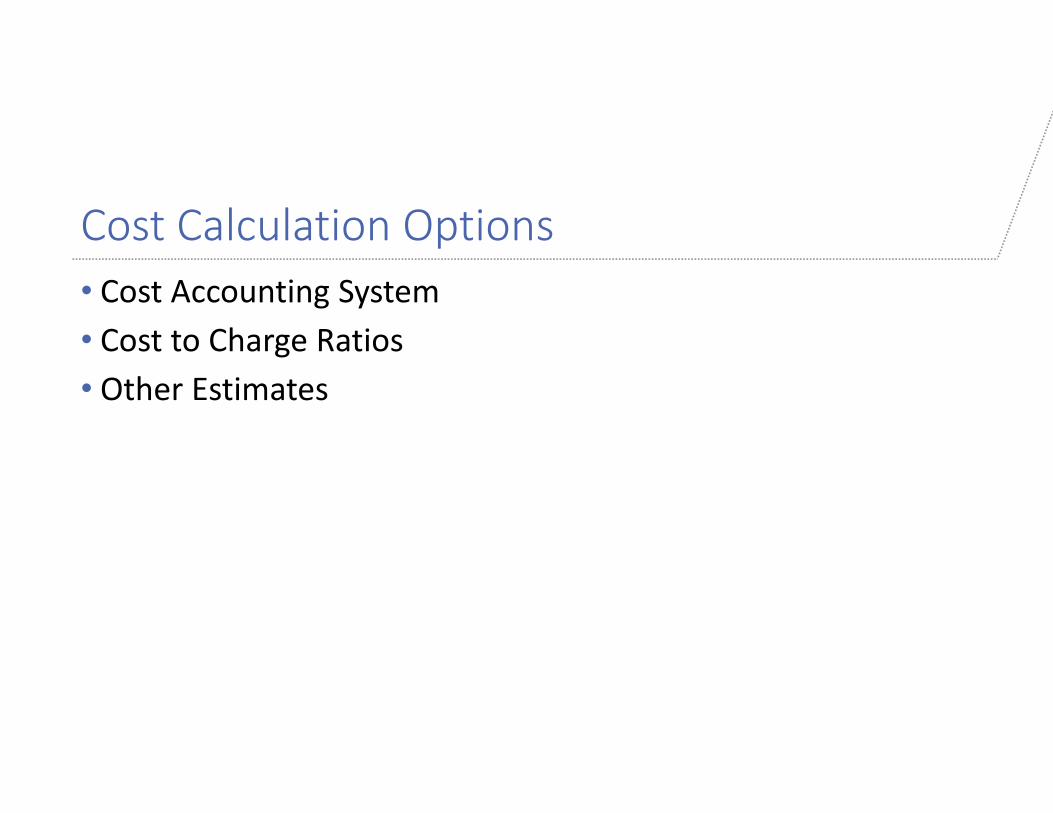
Cost Calculation Options• Cost Accounting System• Cost to Charge Ratios• Other Estimates
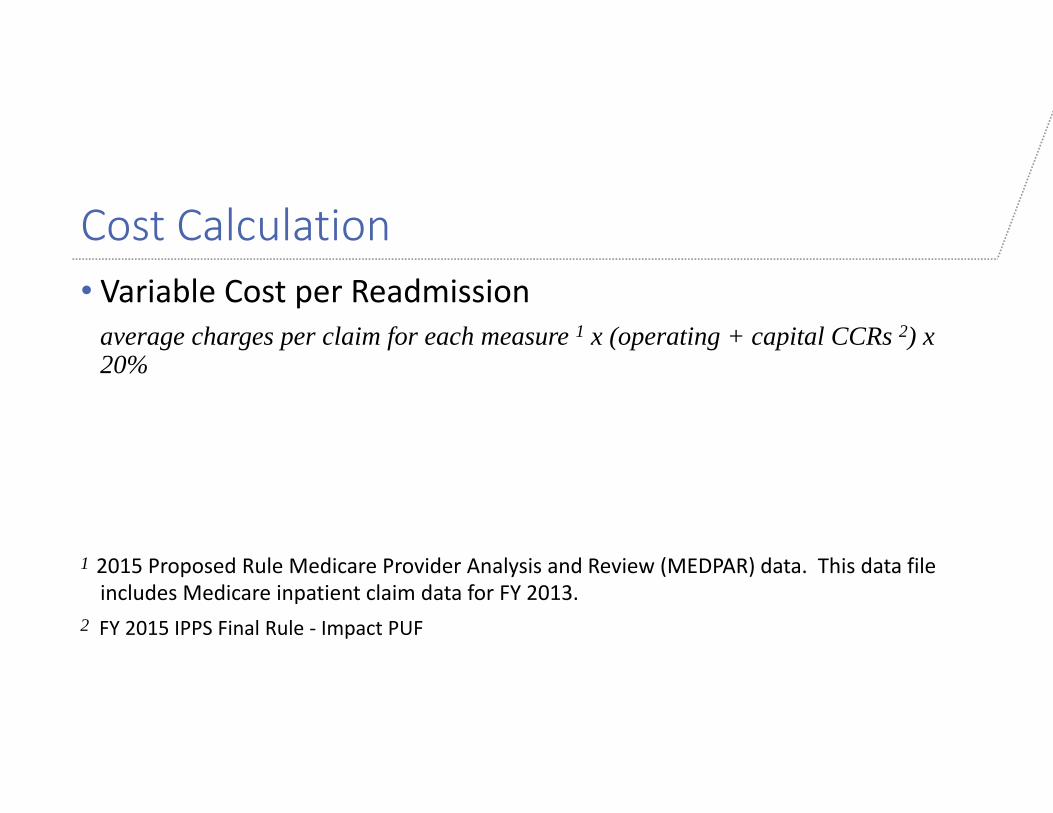
Cost Calculation• Variable Cost per Readmission
average charges per claim for each measure 1 x (operating + capital CCRs 2) x 20%
1 2015 Proposed Rule Medicare Provider Analysis and Review (MEDPAR) data. This data file includes Medicare inpatient claim data for FY 2013.
2 FY 2015 IPPS Final Rule ‐ Impact PUF
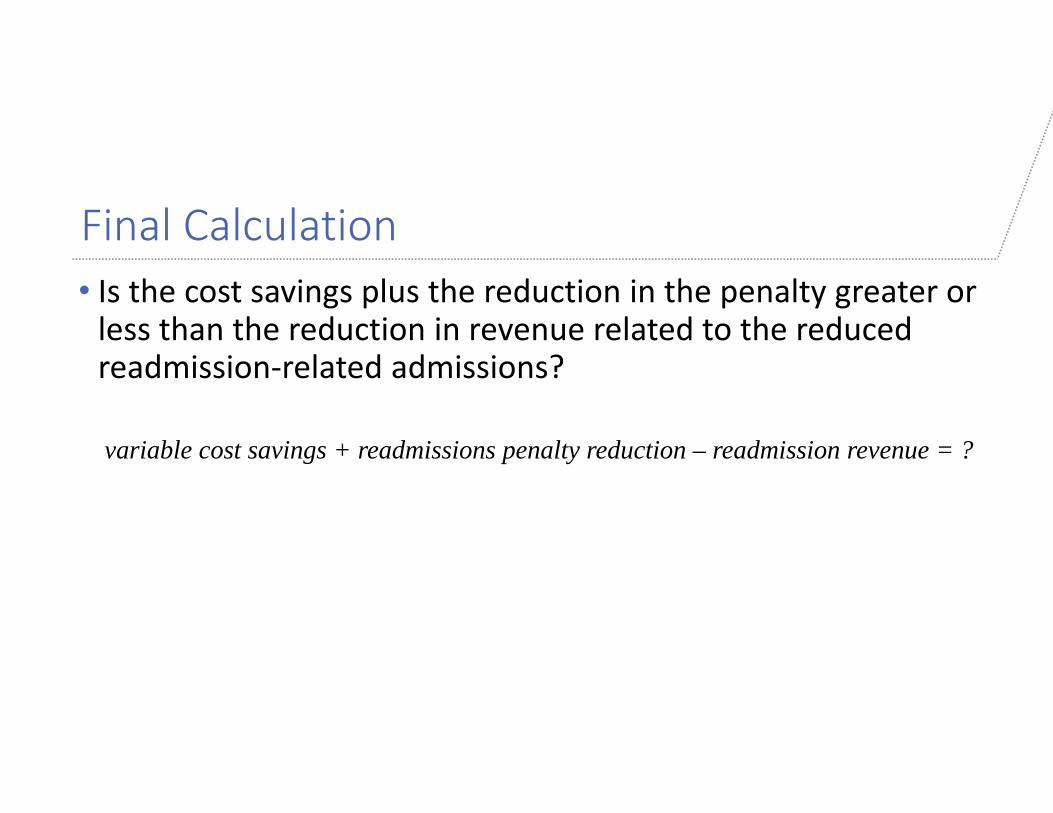
Final Calculation• Is the cost savings plus the reduction in the penalty greater or less than the reduction in revenue related to the reduced readmission‐related admissions?
variable cost savings + readmissions penalty reduction – readmission revenue = ?
Results• Every hospital being penalized under the HRRP would experience a positive financial impact if all excess readmissions were eliminated.
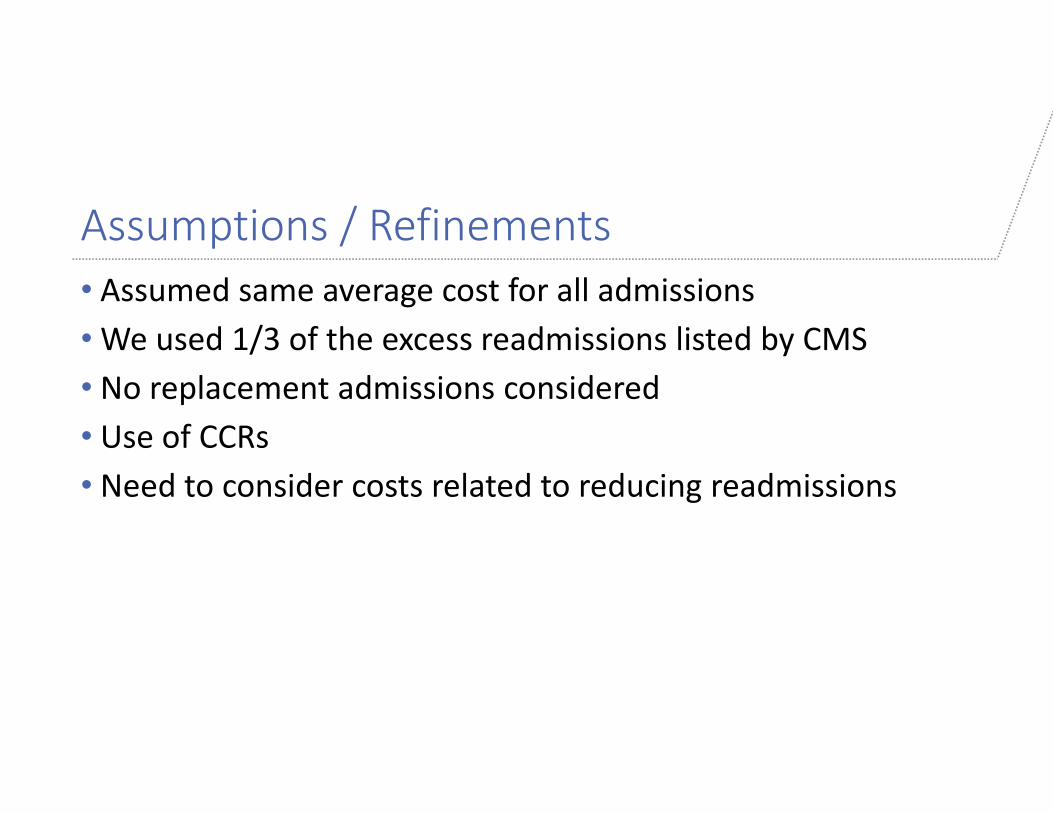
Assumptions / Refinements• Assumed same average cost for all admissions• We used 1/3 of the excess readmissions listed by CMS• No replacement admissions considered• Use of CCRs• Need to consider costs related to reducing readmissions

Readmissions Adjustment Factor• Aggregate Payments for Excess ReadmissionsFor each measure:sum of base operating DRG payments for the measure x (excess readmission ratio for the measure-1)
• Base Operating DRG Payment:wage-adjusted DRG operating amount + new technology payment, if applicable
• Wage‐adjusted DRG Operating Amount:DRG weight x [(labor share x wage index) + (non-labor share x COLA, if applicable)]
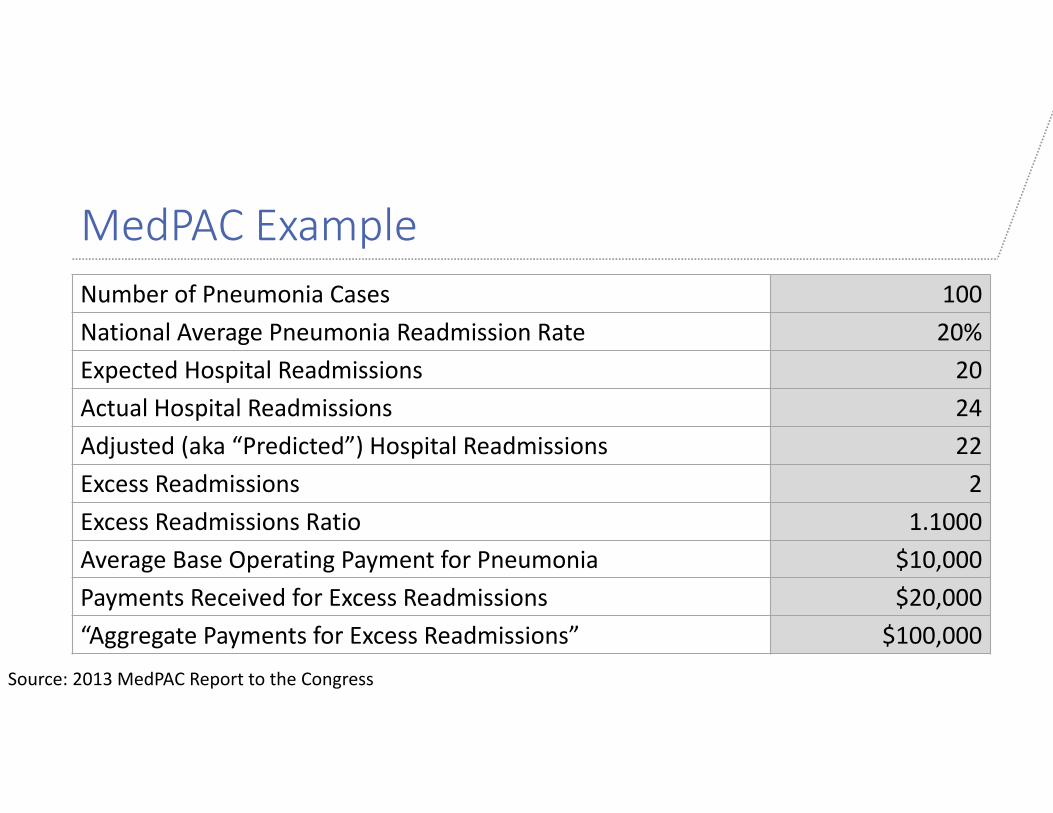
MedPAC ExampleNumber of Pneumonia Cases 100National Average Pneumonia Readmission Rate 20%Expected Hospital Readmissions 20Actual Hospital Readmissions 24Adjusted (aka “Predicted”) Hospital Readmissions 22Excess Readmissions 2Excess Readmissions Ratio 1.1000Average Base Operating Payment for Pneumonia $10,000Payments Received for Excess Readmissions $20,000“Aggregate Payments for Excess Readmissions” $100,000
Source: 2013 MedPAC Report to the Congress
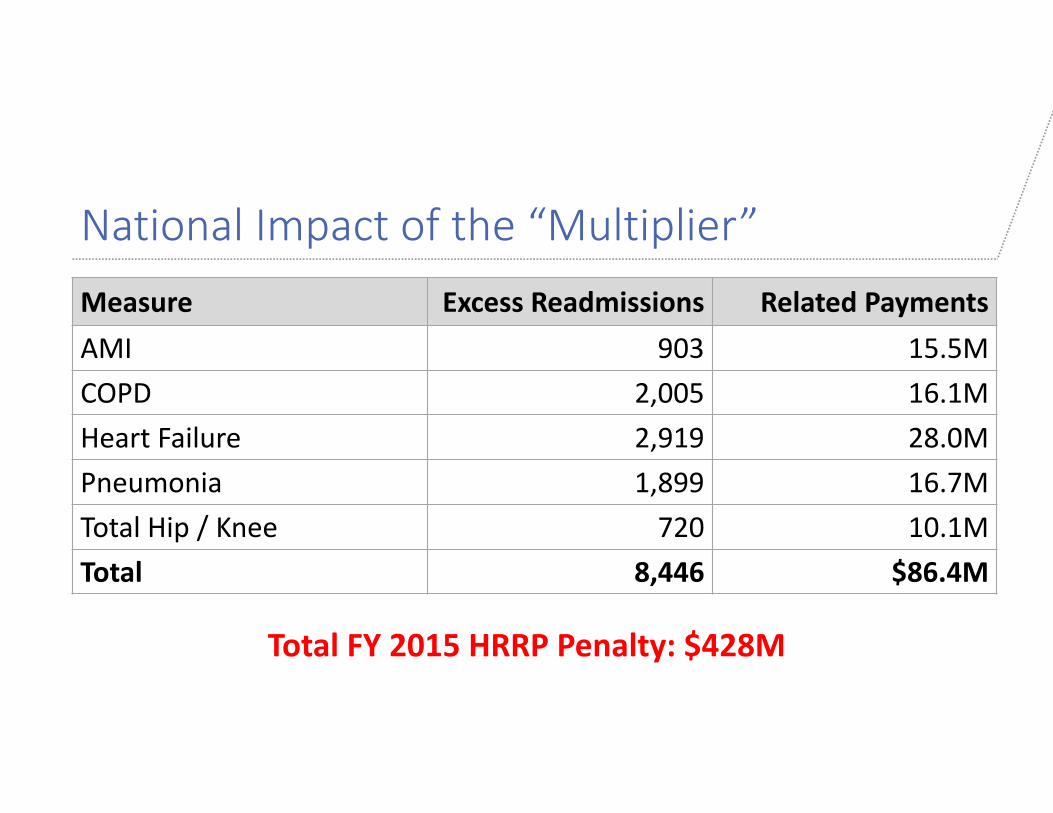
National Impact of the “Multiplier”Measure Excess Readmissions Related PaymentsAMI 903 15.5MCOPD 2,005 16.1MHeart Failure 2,919 28.0MPneumonia 1,899 16.7MTotal Hip / Knee 720 10.1MTotal 8,446 $86.4M
Total FY 2015 HRRP Penalty: $428M
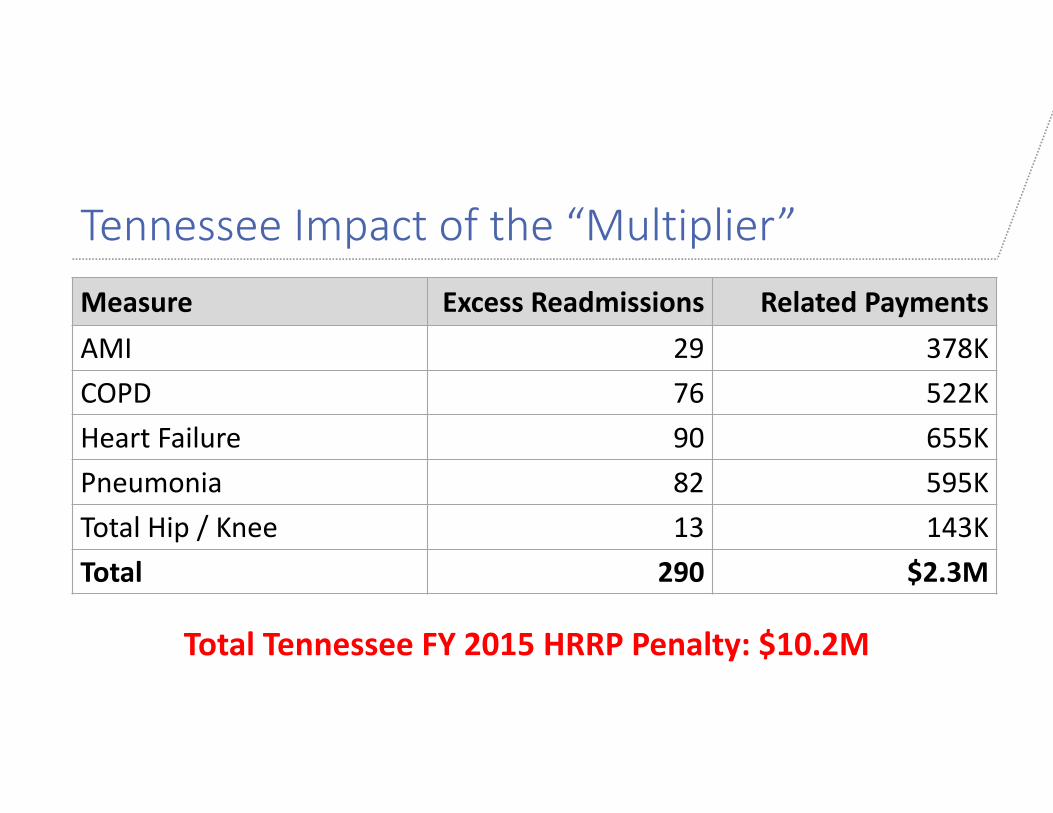
Tennessee Impact of the “Multiplier”Measure Excess Readmissions Related PaymentsAMI 29 378KCOPD 76 522KHeart Failure 90 655KPneumonia 82 595KTotal Hip / Knee 13 143KTotal 290 $2.3M
Total Tennessee FY 2015 HRRP Penalty: $10.2M
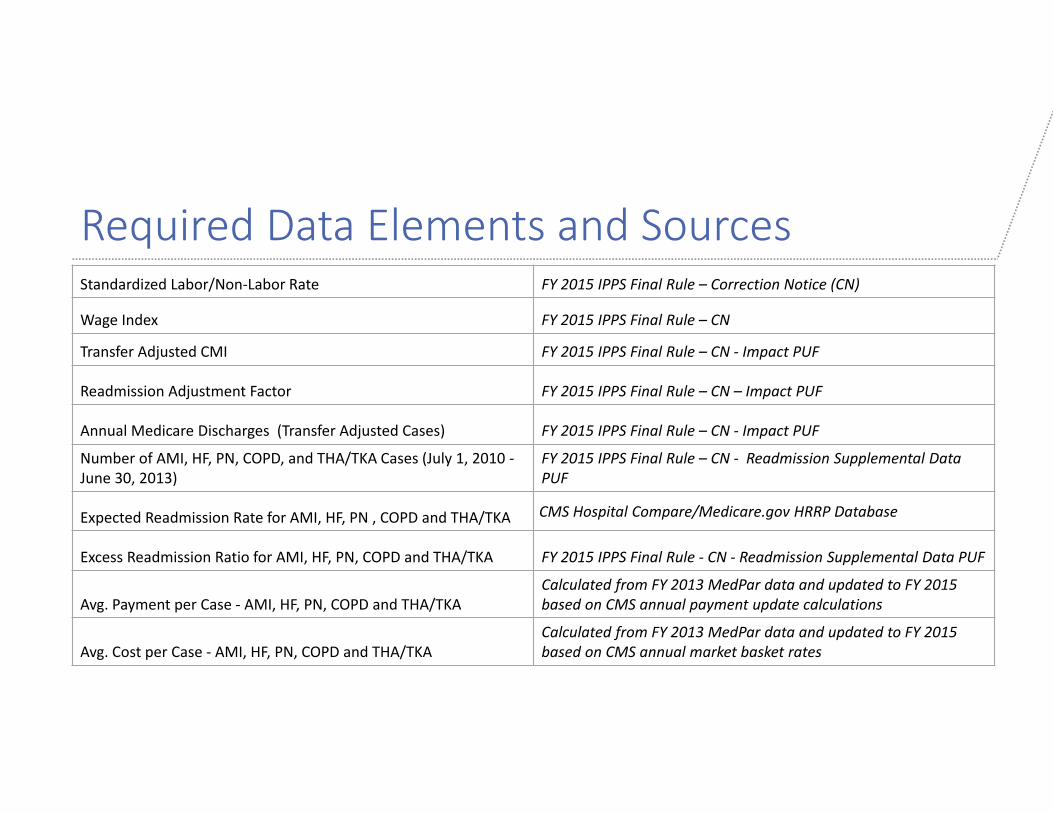
Required Data Elements and SourcesStandardized Labor/Non‐Labor Rate FY 2015 IPPS Final Rule – Correction Notice (CN)
Wage Index FY 2015 IPPS Final Rule – CN
Transfer Adjusted CMI FY 2015 IPPS Final Rule – CN ‐ Impact PUF
Readmission Adjustment Factor FY 2015 IPPS Final Rule – CN – Impact PUF
Annual Medicare Discharges (Transfer Adjusted Cases) FY 2015 IPPS Final Rule – CN ‐ Impact PUF
Number of AMI, HF, PN, COPD, and THA/TKA Cases (July 1, 2010 ‐June 30, 2013)
FY 2015 IPPS Final Rule – CN ‐ Readmission Supplemental Data PUF
Expected Readmission Rate for AMI, HF, PN , COPD and THA/TKA CMS Hospital Compare/Medicare.gov HRRP Database
Excess Readmission Ratio for AMI, HF, PN, COPD and THA/TKA FY 2015 IPPS Final Rule ‐ CN ‐ Readmission Supplemental Data PUF
Avg. Payment per Case ‐ AMI, HF, PN, COPD and THA/TKACalculated from FY 2013 MedPar data and updated to FY 2015 based on CMS annual payment update calculations
Avg. Cost per Case ‐ AMI, HF, PN, COPD and THA/TKACalculated from FY 2013 MedPar data and updated to FY 2015 based on CMS annual market basket rates
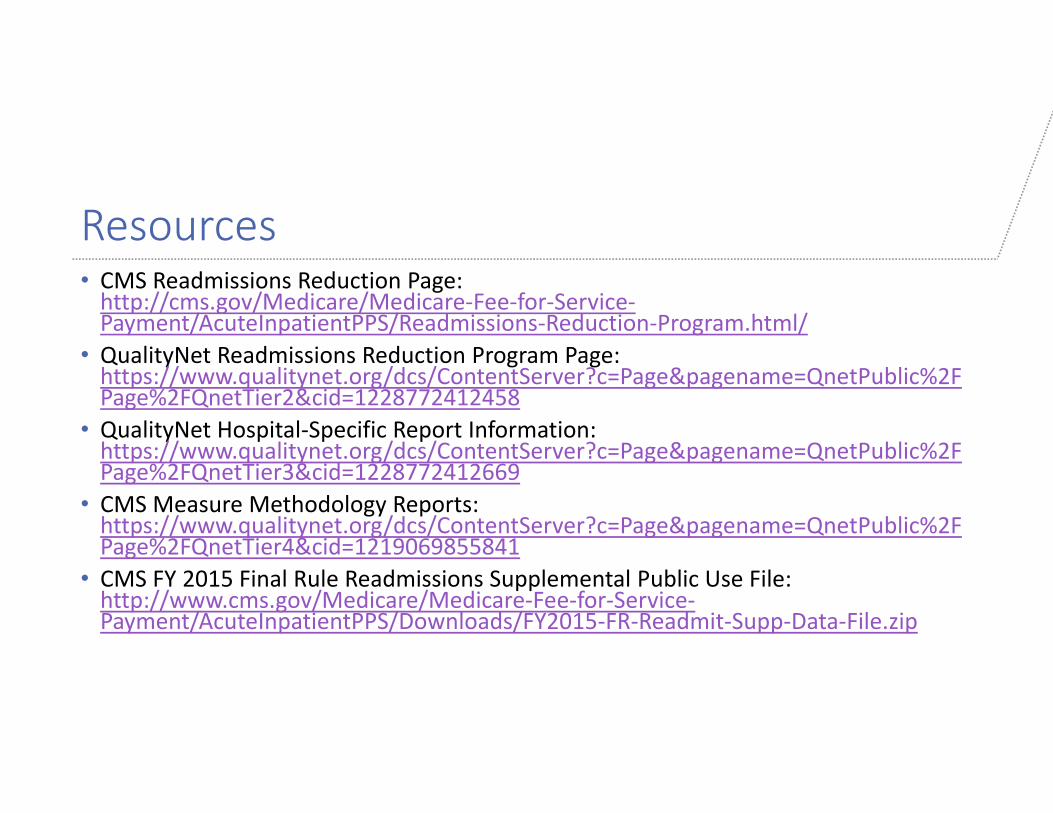
Resources• CMS Readmissions Reduction Page:http://cms.gov/Medicare/Medicare‐Fee‐for‐Service‐Payment/AcuteInpatientPPS/Readmissions‐Reduction‐Program.html/
• QualityNet Readmissions Reduction Program Page: https://www.qualitynet.org/dcs/ContentServer?c=Page&pagename=QnetPublic%2FPage%2FQnetTier2&cid=1228772412458
• QualityNet Hospital‐Specific Report Information:https://www.qualitynet.org/dcs/ContentServer?c=Page&pagename=QnetPublic%2FPage%2FQnetTier3&cid=1228772412669
• CMS Measure Methodology Reports:https://www.qualitynet.org/dcs/ContentServer?c=Page&pagename=QnetPublic%2FPage%2FQnetTier4&cid=1219069855841
• CMS FY 2015 Final Rule Readmissions Supplemental Public Use File:http://www.cms.gov/Medicare/Medicare‐Fee‐for‐Service‐Payment/AcuteInpatientPPS/Downloads/FY2015‐FR‐Readmit‐Supp‐Data‐File.zip
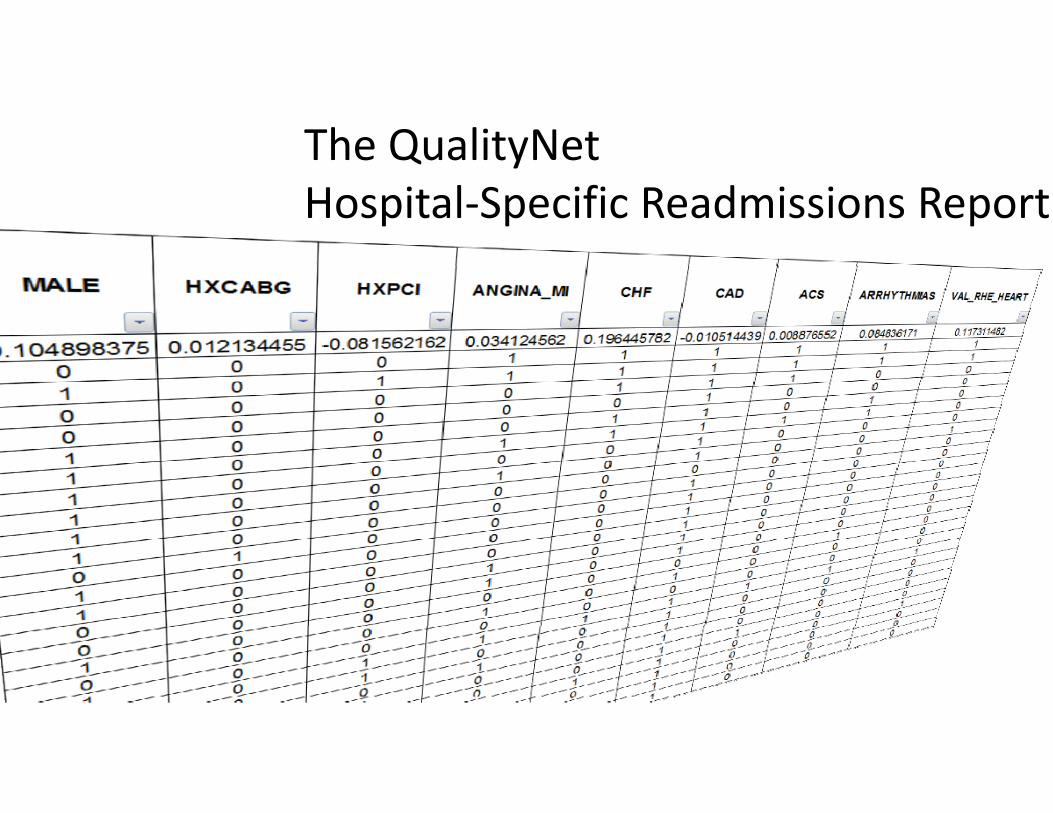
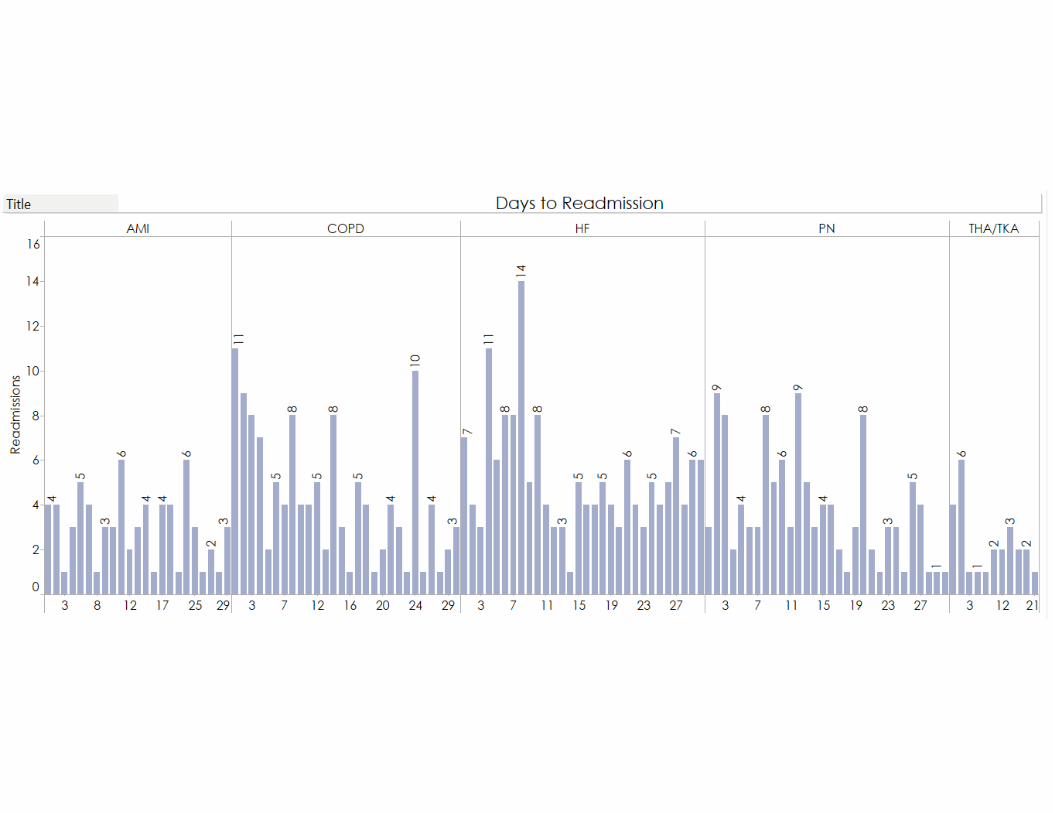
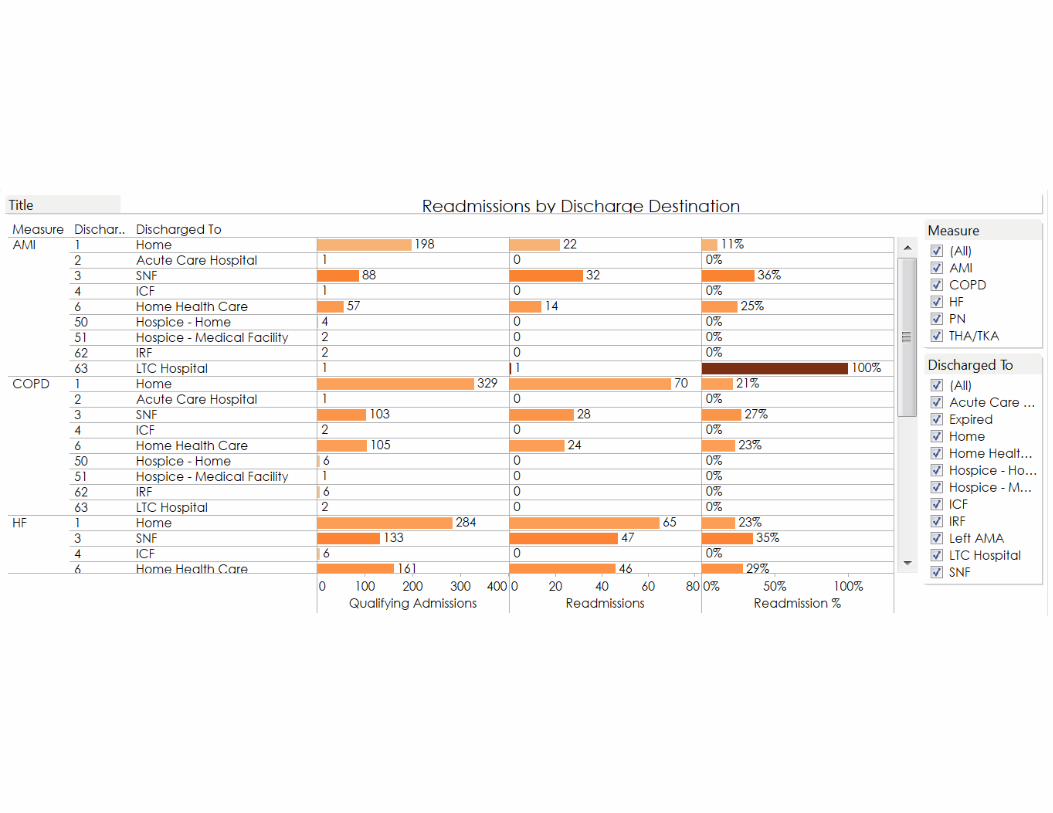
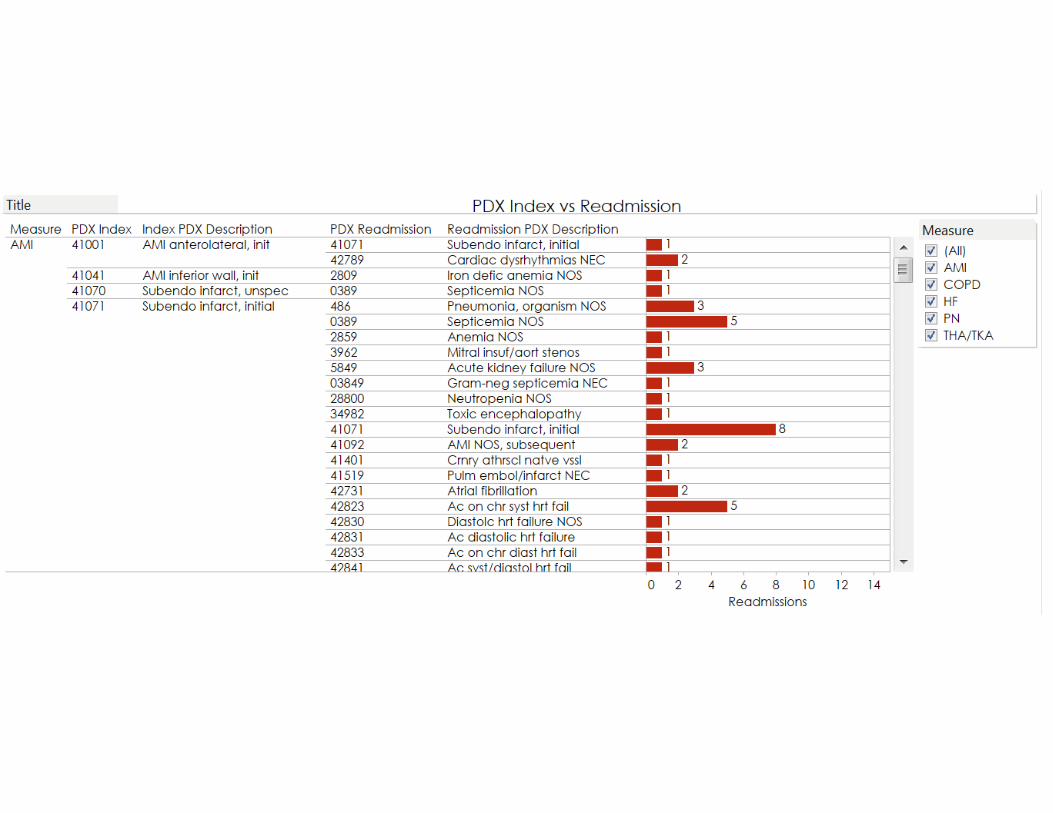
The QualityNetHospital‐Specific Readmissions Report

Hospital-Specific Report• QualityNet.org• Intended to allow a hospital to review the claims and calculations related to its readmissions penalty
• Overall readmissions statistics• Individual claims and clinical markers • 2015 penalties use a review period of 7/1/2010 ‐ 6/30/2013
HOSPITAL NAME
Measure [a]
*Number of
Eligible Discharges at
Your Hospital [b]
*Number of
Readmissions at Your Hospital [c]
*Predicted
Readmission Rate [d]
*Expected
Readmission Rate [e]
*Excess
Readmission Ratio [f]
National Crude Readmission
Rate [g]
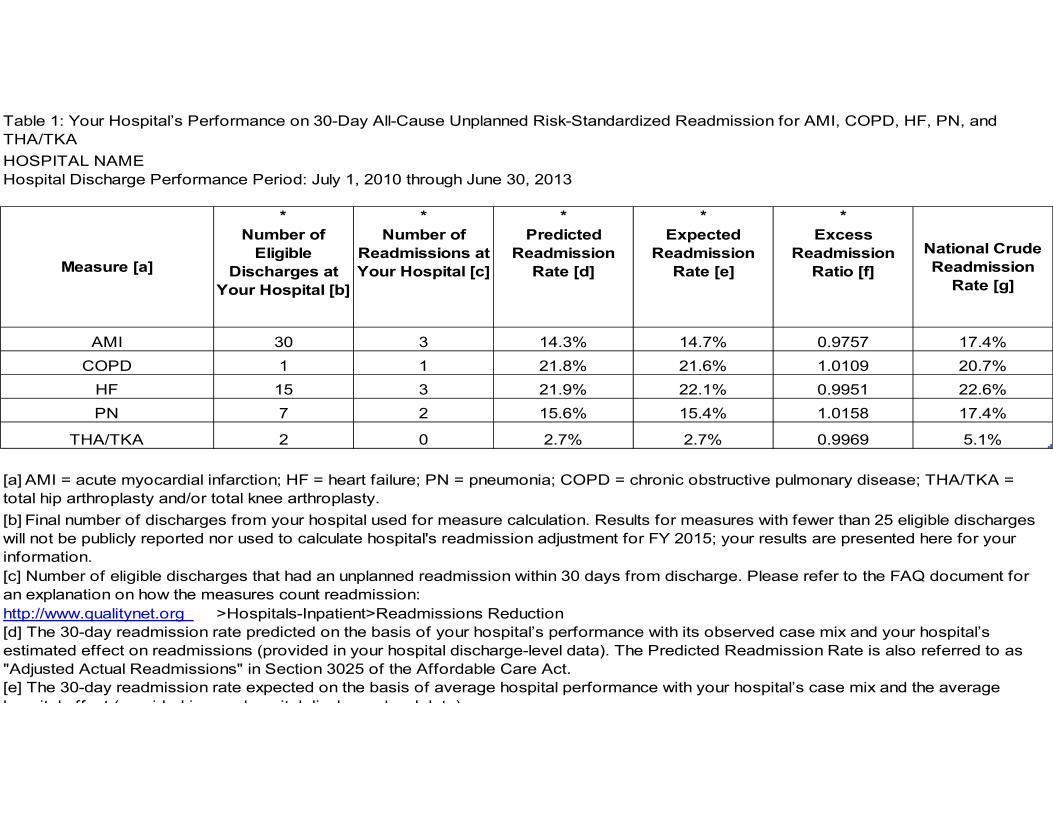
AMI 30 3 14.3% 14.7% 0.9757 17.4%COPD 1 1 21.8% 21.6% 1.0109 20.7%
HF 15 3 21.9% 22.1% 0.9951 22.6%PN 7 2 15.6% 15.4% 1.0158 17.4%
THA/TKA 2 0 2.7% 2.7% 0.9969 5.1%
http://www.qualitynet.org
Table 1: Your Hospital’s Performance on 30-Day All-Cause Unplanned Risk-Standardized Readmission for AMI, COPD, HF, PN, and THA/TKA
Hospital Discharge Performance Period: July 1, 2010 through June 30, 2013
[a] AMI = acute myocardial infarction; HF = heart failure; PN = pneumonia; COPD = chronic obstructive pulmonary disease; THA/TKA = total hip arthroplasty and/or total knee arthroplasty.[b] Final number of discharges from your hospital used for measure calculation. Results for measures with fewer than 25 eligible discharges will not be publicly reported nor used to calculate hospital's readmission adjustment for FY 2015; your results are presented here for your information.[c] Number of eligible discharges that had an unplanned readmission within 30 days from discharge. Please refer to the FAQ document for an explanation on how the measures count readmission:
>Hospitals-Inpatient>Readmissions Reduction[d] The 30-day readmission rate predicted on the basis of your hospital’s performance with its observed case mix and your hospital’s estimated effect on readmissions (provided in your hospital discharge-level data). The Predicted Readmission Rate is also referred to as "Adjusted Actual Readmissions" in Section 3025 of the Affordable Care Act.[e] The 30-day readmission rate expected on the basis of average hospital performance with your hospital’s case mix and the average hospital effect (provided in your hospital discharge level data)
HOSPITAL NAME
ID Number HICNO Medical Record
NumberBeneficiary
DOB
AdmissionDate of
Index Stay
DischargeDate of Index
Stay
Inclusion/ExclusionIndicator
Index StayPrincipal
DischargeDiagnosis ofIndex Stay
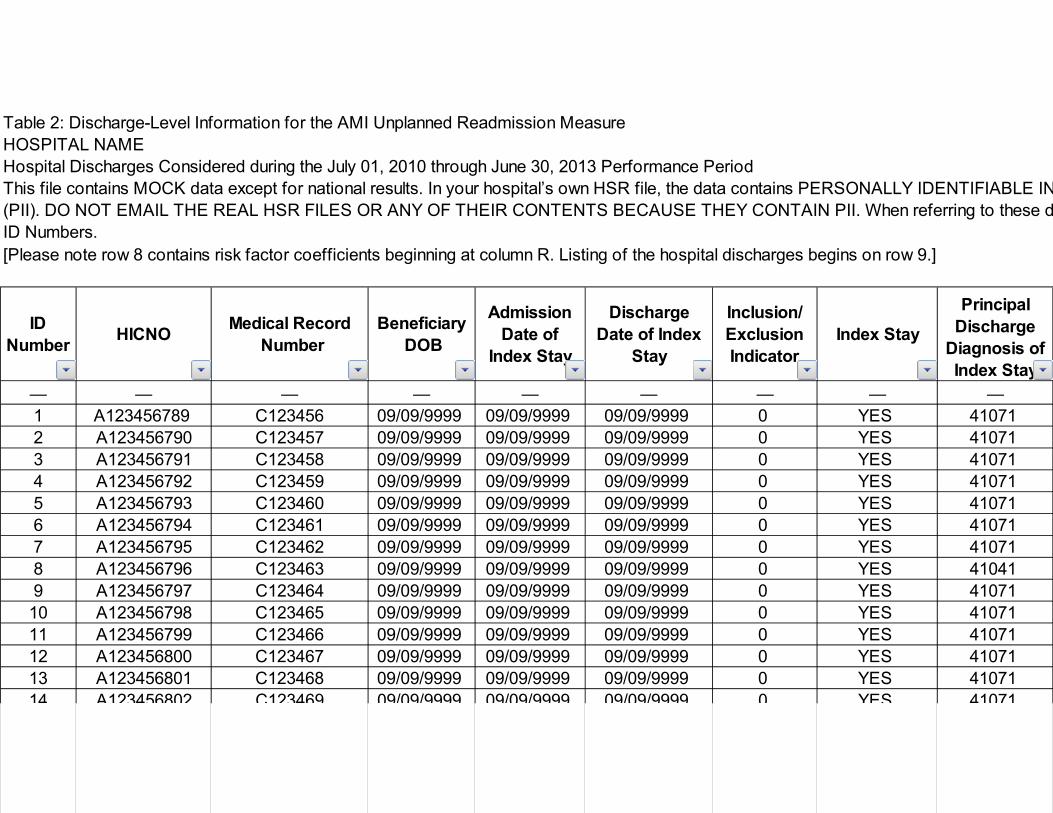
— — — — — — — — —1 A123456789 C123456 09/09/9999 09/09/9999 09/09/9999 0 YES 41071 2 A123456790 C123457 09/09/9999 09/09/9999 09/09/9999 0 YES 41071 3 A123456791 C123458 09/09/9999 09/09/9999 09/09/9999 0 YES 41071 4 A123456792 C123459 09/09/9999 09/09/9999 09/09/9999 0 YES 41071 5 A123456793 C123460 09/09/9999 09/09/9999 09/09/9999 0 YES 41071 6 A123456794 C123461 09/09/9999 09/09/9999 09/09/9999 0 YES 41071 7 A123456795 C123462 09/09/9999 09/09/9999 09/09/9999 0 YES 41071 8 A123456796 C123463 09/09/9999 09/09/9999 09/09/9999 0 YES 41041 9 A123456797 C123464 09/09/9999 09/09/9999 09/09/9999 0 YES 41071 10 A123456798 C123465 09/09/9999 09/09/9999 09/09/9999 0 YES 41071 11 A123456799 C123466 09/09/9999 09/09/9999 09/09/9999 0 YES 41071 12 A123456800 C123467 09/09/9999 09/09/9999 09/09/9999 0 YES 41071 13 A123456801 C123468 09/09/9999 09/09/9999 09/09/9999 0 YES 41071 14 A123456802 C123469 09/09/9999 09/09/9999 09/09/9999 0 YES 41071
Table 2: Discharge-Level Information for the AMI Unplanned Readmission Measure
Hospital Discharges Considered during the July 01, 2010 through June 30, 2013 Performance PeriodThis file contains MOCK data except for national results. In your hospital’s own HSR file, the data contains PERSONALLY IDENTIFIABLE IN(PII). DO NOT EMAIL THE REAL HSR FILES OR ANY OF THEIR CONTENTS BECAUSE THEY CONTAIN PII. When referring to these dID Numbers.[Please note row 8 contains risk factor coefficients beginning at column R. Listing of the hospital discharges begins on row 9.]
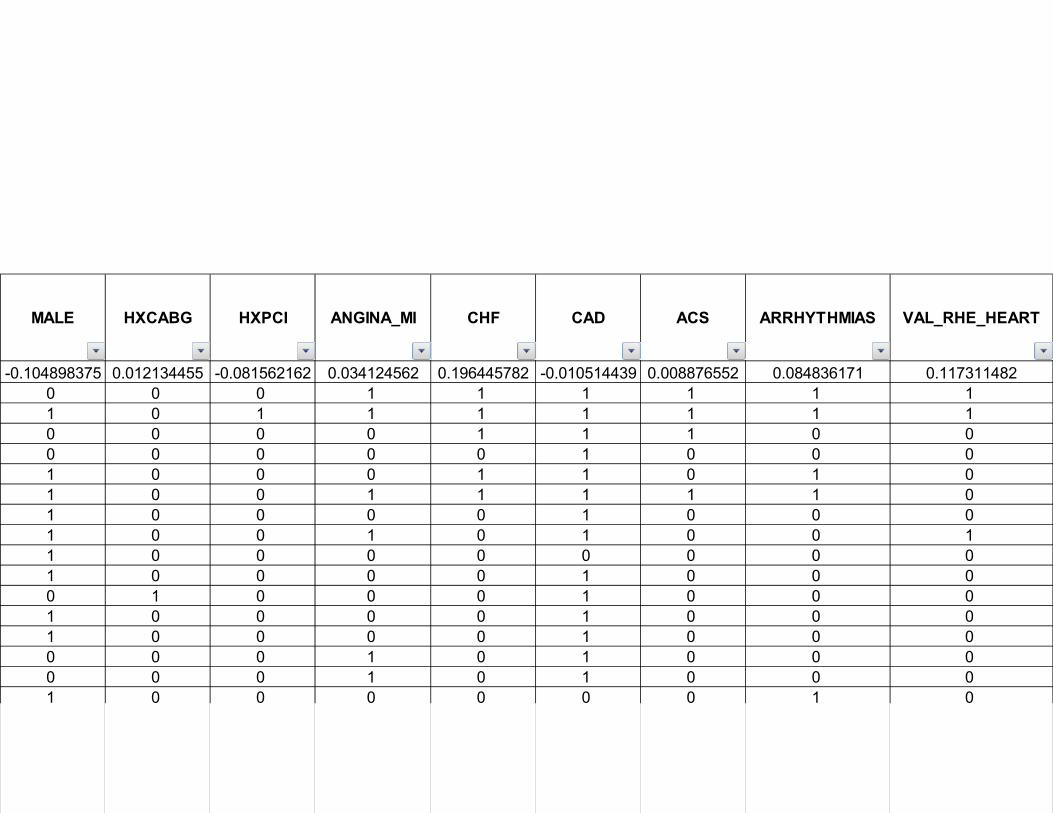
MALE HXCABG HXPCI ANGINA_MI CHF CAD ACS ARRHYTHMIAS VAL_RHE_HEART
-0.104898375 0.012134455 -0.081562162 0.034124562 0.196445782 -0.010514439 0.008876552 0.084836171 0.1173114820 0 0 1 1 1 1 1 1 1 0 1 1 1 1 1 1 1 0 0 0 0 1 1 1 0 0 0 0 0 0 0 1 0 0 0 1 0 0 0 1 1 0 1 0 1 0 0 1 1 1 1 1 0 1 0 0 0 0 1 0 0 0 1 0 0 1 0 1 0 0 1 1 0 0 0 0 0 0 0 0 1 0 0 0 0 1 0 0 0 0 1 0 0 0 1 0 0 0 1 0 0 0 0 1 0 0 0 1 0 0 0 0 1 0 0 0 0 0 0 1 0 1 0 0 0 0 0 0 1 0 1 0 0 0 1 0 0 0 0 0 0 1 0


How New Reimbursement Policies Will Impact Readmissions Reduction Efforts
Looking Ahead• Bundled Payments• CMS Performance‐Based Payment Goals• Performance Comparisons• Other Payers and Policies Around Readmissions
`
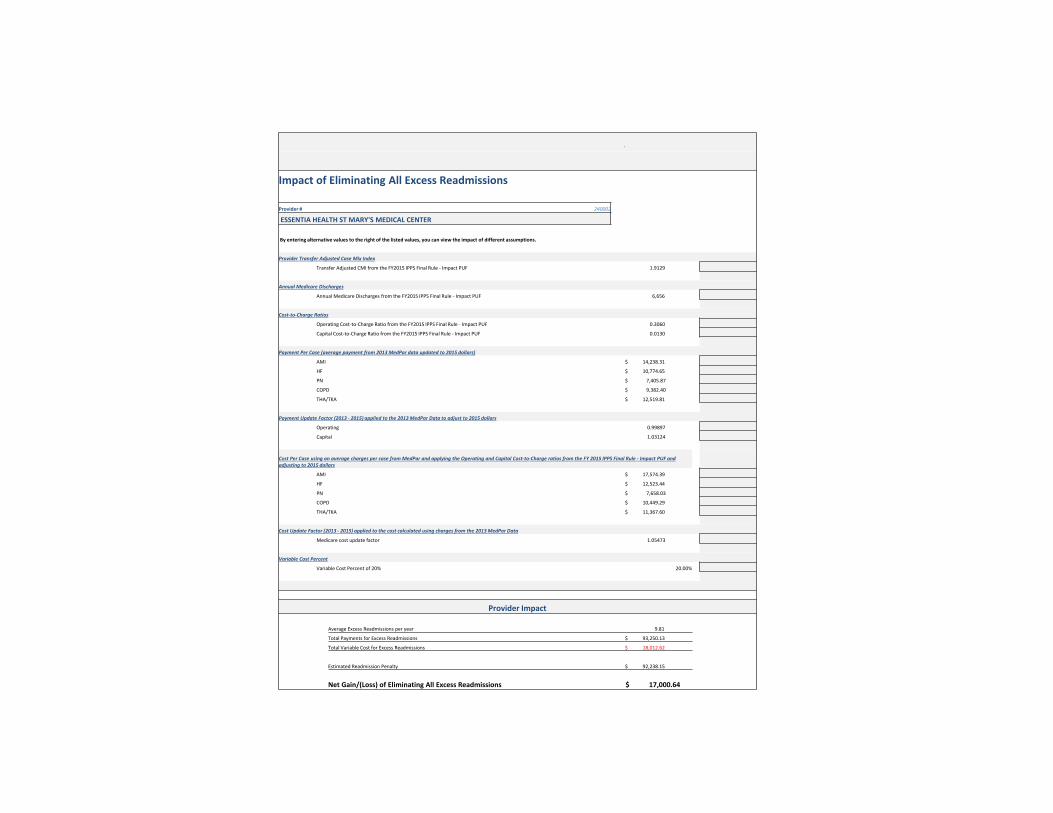
Impact of Eliminating All Excess Readmissions
Provider # 240002
ESSENTIA HEALTH ST MARY'S MEDICAL CENTER
By entering alternative values to the right of the listed values, you can view the impact of different assumptions.
Provider Transfer Adjusted Case Mix Index
Transfer Adjusted CMI from the FY2015 IPPS Final Rule ‐ Impact PUF 1.9129
Annual Medicare Discharges
Annual Medicare Discharges from the FY2015 IPPS Final Rule ‐ Impact PUF 6,656
Cost‐to‐Charge Ratios
Operating Cost‐to‐Charge Ratio from the FY2015 IPPS Final Rule ‐ Impact PUF 0.3060
Capital Cost‐to‐Charge Ratio from the FY2015 IPPS Final Rule ‐ Impact PUF 0.0130
Payment Per Case (average payment from 2013 MedPar data updated to 2015 dollars)
AMI $ 14,238.31
HF $ 10,774.65
PN $ 7,405.87
COPD $ 9,382.40
THA/TKA $ 12,519.81
Payment Update Factor (2013 ‐ 2015) applied to the 2013 MedPar Data to adjust to 2015 dollars
Operating 0.99897
Capital 1.03124
Cost Per Case using an average charges per case from MedPar and applying the Operating and Capital Cost‐to‐Charge ratios from the FY 2015 IPPS Final Rule ‐ Impact PUF and adjusting to 2015 dollars
AMI $ 17,574.39
HF $ 12,523.44
PN $ 7,658.03
COPD $ 10,449.29
THA/TKA $ 11,367.60
Cost Update Factor (2013 ‐ 2015) applied to the cost calculated using charges from the 2013 MedPar Data
Medicare cost update factor 1.05473
Variable Cost Percent
Variable Cost Percent of 20% 20.00%
Provider Impact
Average Excess Readmissions per year 9.81
Total Payments for Excess Readmissions $ 93,250.13
Total Variable Cost for Excess Readmissions $ 18,012.62
Estimated Readmission Penalty $ 92,238.15
Net Gain/(Loss) of Eliminating All Excess Readmissions $ 17,000.64
Top Related