


Languages
Pages
Legal

THE ANALYSIS OF WATER AVAILABILITY INDICATORS AND ACCESS TO AVAILABLE WATER IN THE DEVELOPING, SEMI-ARID, RURAL SETTING
BY
MARY J. RICHARDSON
THESIS
Submitted in partial fulfillment of the requirements for the degree of Master of Science in Natural Resources and Environmental Sciences
in the Graduate College of the University of Illinois at Urbana-Champaign, 2017
Urbana, Illinois Master’s Committee:
Professor Michelle M. Wander Associate Professor Trevor L. Birkenholz Piper Hodson, Director Online Master’s Program
ii
ABSTRACT
In 2015, 663 million people did not have access to improved drinking water; the majority lived in the rural, water scarce regions of lesser developed nations. Global discussions of water scarcity had begun in the mid-1970’s, and over the following 30 years, several water availability indicators evolved to try to understand this water availability quandary. This thesis provides an integrative literature review to identify and describe the current water availability indicators that are most commonly used to assess regional potable water resources around the world. It then assesses the adequacy of those indicators for use in the developing, semi-arid, rural regions of the globe with a focus on measuring community access to available water. One key finding is that existing indicators metrics focus solely on the physical availability of the water, but do not include metrics for quantity or quality or readily available access to it. This thesis also finds that while the base data collected for the indicators are at the spatial scale of country or region; these data are often arbitrarily applied to the local scale. This scalar variation is then found to create erroneous availability statistics. The resulting conclusion is that there is a need for an indicator, which more accurately represents access to water at the local level. Also discussed are the socio-economic issues of access that are missing from current indicators. For water access indicators to work at the local level, they must use data beyond water quantity and quality measured at the national or regional scale. Water access indicators need to be: easy to calculate, cost effective to implement, scalable to the micro-level, based on existing data, developed using a transparent process and, not least, must be easy to understand by all the stakeholders. Ideal indicators will use data and new technologies that include scalable tools that allow selection and use of appropriate water purification tactics.

iii
ACKNOWLEDGEMENTS
I would like to thank Professor Wander for her guidance in writing my thesis. I am very grateful for the opportunity to research a topic that was so much a part of my childhood environment: rural, developing, semi-arid/ water poor areas of the world.
The interdisciplinary nature of the research topic led me to seek out a geographer as a member of my committee. I would like to thank Professor Birkenholtz who was so enthusiastic when I approached him about being a member of my advising committee, and who has provided me with very insightful directions to refine the focus of my thesis.
The University of Illinois library staff needs a very special mention- always at the other side of the chat box, and very able to turn up references that were not immediately available in the stacks.
Taking the variety of classes offered in the NRES program set me up well for the broad diversity of topics I have read through to produce this thesis; the extension to my knowledge base has been tremendous. I thank Piper Hodson and Renee Garcon for the academic and moral support they offer each online student, and Karen Claus for her administrative magic.
I dedicate this thesis to my family, for their understanding in my want to be continuing my education.
iv
TABLE OF CONTENTS LIST OF TABLES………………………………………………………………………………………………………………………………………..v
LIST OF FIGURE……………………………………………………………………………………………………………………………………….vi
ACRONYMS…………………………………………………………………………………………………………………………………………….vii
CHAPTER 1: INTRODUCTION ........................................................................................................................ 1
CHAPTER 2: METHODS ................................................................................................................................. 5
CHAPTER 3: RESULTS AND DISCUSSION ....................................................................................................... 7
CHAPTER 4: SUMMARY .............................................................................................................................. 53
REFERENCES ................................................................................................................................................ 56
v
LIST OF TABLES Table 1 AQUASTATS TARWR measures and associated indicators……………….……..…..11 Table 2 List of key water availability indicators described in the literature…………………....13 Table 3 Summary of indices that have been specifically used to address water scarcity issues in semi-arid regions............................………………………………………………14 Table 4 Examples of unimproved and improved water supplies (summarized from UN, 2000; Opare, 2012; Dobrowsky et al., 2014)…….………………………….……21 Table 5 Summary of Millenium Development Goal 7.10 and Sustainable Development Goal 6.1…………………………….…………………………………………......24 Table 6 Policy consequences-possible village participation.................................... 43 Table 7 Summary of satellite data\ global water resources modeling ………………...49
vi
LIST OF FIGURES
Figure 1 AQUASTATS Average Annual data for the Republic of Kenya 2012-2014……..……………………………………………………………………………………….27 Figure 2a Proportional distribution of total population water statistics for Kenya 2015 (WHO-UNICEF knoema data, 2015)….…………………………………………...28 Figure 2b Proportional distribution of rural population water statistics for Kenya 2105 (WHO-UNICEF knoema data, 2015)….……….……………….………………….29

vii
ACRONYMS
BWR Basic Water Requirement
FOA Food and Agriculture Organization
JMP Joint Monitoring Programme
MDG Millennium Development Goals
SDG Sustainable Development Goal
TARWR Total Actual Renewable Water Resources
UN United Nations
UNDESA United Nations Department of Economic and Social Affairs
UNESCO United Nations Educational, Scientific and Cultural Organization
UNICEF United Nations International Children's Emergency Fund
WHO World Health Organization
WPI Water Poverty Index
WRVI Water Resources Vulnerability Index
WWAP World Water Assessment Programme
WWDR World Water Development Report

1
CHAPTER 1: INTRODUCTION
Freshwater comprises just 2.5% of the total global water; 68.7% of this freshwater is in
the form of ice and glaciers; 30.1% forms groundwater; and 1.2% forms surface water (Gleick,
1993). Global lakes account for some 20.9% of the surface water, with swamps and marshes
accounting for 2.6%, and rivers just 0.5%. The accumulation of precipitation across the specific
area will move as surface water into streams, rivers, lakes, and then percolate into the
groundwater, and may then become available for extraction and use as a fresh water resource.
Worldwide over 9,000 billion liters of fresh water are used daily (TheWorldCounts, 2017), an
average of over 1,200 liters per person per day. The determination of just how users value this
water as a resource is seen in its multidimensional, spatial and temporal characteristics, which
include wide-ranging quantity and quality characteristics. The apparent disparity in water
availability found within the same region has created a chasm in many developing and
undeveloped nations. In turn, this rift often leads to water resource conflicts (Postel, 1997;
Postel and Richter, 2003; Clanet and Ogilvie, 2009; Huho, 2012; Joshua et al., 2016).
Water is a central resource for the economy of every country, and also plays a vital role
in the climate regulation of that county (Pielou, 1998). It is the management and protection of
water resources, both freshwater, and saltwater, that is the basis of environmental protection
for the world as a whole. Clean, fresh water is essential to human existence.
Existing water availability indicators used internationally to statistically represent water
resources of a region or county fail to represent the actual quantities of readily available quality
water. The dilemma of balancing water quality and water quality by using the current

2
commonly used scientific water resource indicators could be overcome with the introduction of
an optional indicator. The case study of Kenya illuminates, which included parameters should
added in an optional indicator, one that supports both functional access and adequate supplies
of water to rural homeowners in the developing, semi-arid regions of the world.
1.1 AVAILABLE WATER: QUALITY AND QUANTITY
Available water resources that may be used by humans for their various domestic,
agricultural, industrial, environmental and recreational needs are in most cases fresh water.
Limited usage results as a function of the quality and the quantity of the available water. In
developed countries, a drinking or potable, domestic water supply has to conform to very
strictly imposed, regulatory quality standards. The ideal outcome would be for all nations to
have the same standards of water quality, or at least a commonality in standards for regions of
the world. Drinking water quality standards do exist in many developing nations. Most of these
nations have guidelines or targets rather than requirements. In many parts of the world very
few water standards have any legal basis or are subject to enforcement (Radcliff, 2003; UN,
2011). Health statistics show that it is the women and children of these communities that suffer
the most from insufficient access to quality water (Ntouda et al., 2013; Mattioli et al., 2014;
Pullan et al., 2014; Rodrigues et al., 2015; Pearson et al., 2016).
Assessing what constitutes good quality water versus contaminated drinking water is a
contentious topic as standards around the world vary widely (Leiter et al., 2013). According to
the definition set by the World Health Organization (WHO), safe drinking water implies that the
water meets accepted drinking water quality standards and poses no significant threat to
health. To be drinkable, the United Nations (UN) sets a level of 100% Escherichia coli (E. coli)

3
free for a water supply (Medema et al., 2003; WHO, 2011). This standard is often too difficult
for most developing and undeveloped rural areas to achieve (Leiter et al., 2013). The quantity
of water available to a nation’s population is dependent upon the regional hydrology and
hydrogeology; the prevailing environmental conditions; the infrastructure used to deliver the
water resource; the governance of that resource; and the overall socio-economic situations of
the region. The literature shows that water quantity is very often a fundamental driver of water
quality (UNESCO, 2003a; UNESCO, 2003b; Molder, 2007; UNESCO, 2014). However, this is not
always so. For example, excessive quantities occur in many regions of the world after heavy
rains that bring flood conditions; this floodwater is of poor, deteriorating quality (Hrdinka et al.,
2012).
There are numerous water availability indicators used around the world to assess water
resource availability and sustainability (Dὅll et al., 2003; Koshida et al., 2015), and many
countries define their own series of indicators. Indicator parameters include hydrology-based,
climate- based, and water demand and supply data, illustrating the interdisciplinary nature of
this topic.
1.2 ACCESS TO AVAILABLE WATER
Not all available water is accessible; water may be available from a well, or a river, but
without a means of extraction it is not accessible. What is exactly meant by ‘access’ continues
to be a hotly contested topic. It is a subject that impacts how the global water communities,
from the academic community down through the water managers and then on down to the
single domestic user, understand the problem of access. Consequently, this topic affects how
solutions may be shaped to address issues of access. Ribot and Peluso (2013) present ‘access’

4
as a heuristic concept, made up of many different factors: capital, maintenance, technology,
governance, as well as cultural aspects. Each factor needs to be considered independently as
well as with each other, as very often the factors conflict. Access should not be confused with
the right of use of the water supply, nor to the want of fresh water (Ribot et al., 2003).
The United Nations defines access as a percentage of the population within 1 kilometer
of an ‘improved’ water source. Access to safe drinking and sanitation water plays a critical role
in the spread of communicable diseases (Wahome et al., 2014; Kiulia et. al., 2014; Mattioli et
al., 2014 and 2015; Rodrigues et al., 2015). Research by Ntouda et al. (2013) showed that
children under five years of age who do not have access to drinking water are 1.3 times more
likely to have diarrhea than those living in a household with access to potable water.

5
CHAPTER 2: METHODS
2.1. INTEGRATIVE LITERATURE REVIEW
An integrative literature review was carried out to identify the water availability
indicators that have developed out of the global discussion of water resource issues (Torraco,
2005; Fink, 2009). The topic was further refined to isolate indicators that have an association to
access of water resources. The basic premise of the analysis was that it is the right of every
human to have access to clean drinking water. Using the Web of Science research database
with the keywords ‘water’, ‘availability’, ‘indicators’, ‘developing nations’ and ‘rural’, and then
‘Africa’, and restricting the published date to be between 2000 to 2017, over 115 references
were returned. Google Scholar was used to retrieve the full text when cross-referenced papers
were not available from the Web of Science and for the ‘gray’ literature from inter-government
agencies, such as the United Nations.
Analysis of the relevant literature for content was then undertaken, with a focus on
water availability indicators that could be applied to the semi-arid regions of the world. The
original purpose of each indicator, its data sources that derive the indicator parameter, the
assumptions made about the environment of use of the indicator, and the limitations for use in
the geographic region were all researched. Also considered was the ability of the identified
indicators to described access to safe drinking water. The focus at this stage was to find a series
of indicators that would represent access to available water.
An integrative literature review identified examples of local issues of access, and how
users deal with the disinfection of the water for domestic use. Kenya was used as the case
study location as it is a country with a long history of water resource development; therefore,

6
data was more readily available than most other countries with the same environment of
interest. The water resource environment of Kenya was then used to discuss each of the
shortlisted indicators.
Having described how these existing scientific indicators fall short of correctly describing
access to available water, local level metrics, which are relatively easily acquired, are then
presented. These are metrics that would help to define a better access to available, quality,
drinking water indicator.

7
CHAPTER 3: RESULTS AND DISCUSSION
3.1 HISTORY OF AVAILABLE WATER INDICATORS
The statistics we use to calculate global and regional available water resources have
evolved out of the discussion of environmental and developmental concepts of global water
problems. These discussions began in 1977 at the United Nation’s Mar del Plata conference in
Argentina (Worthington, 1977). Here it was declared that “..all peoples, whatever their stage of
development and their social and economic conditions, have the right to have access to
drinking water in quantities and of a quality equal to their basic needs.” In 1992, the Earth
Summit in Rio de Janeiro expanded this right to include ecological water needs and to
safeguard the ecosystems (UN, 1992; Gleick, 1996). During the thirty years after the conference
in Argentina, a select group of like-minded scientists and academics developed a series of
indices that enabled them to identify and better define both the lack and excess of water
resources of a study area. This set of water resource indices continues to be used to the present
and provides common water availability metrics that allow for global discussion and analysis
(UN, 2010).
At the United Nations (UN) Millennium Summit of 2000, held in New York City, the
declaration: "to halve by 2015 the proportion of people who are unable to reach, or to afford,
safe drinking water" and "to stop the unsustainable exploitation of water resources, by
developing water management strategies at the regional, national and local levels, which
promote both equitable access and adequate supplies" was made (UNESCO, 2013). The
Millenium Declaration of 2000 was signed by 189 countries and adapted into eight Millenium
8
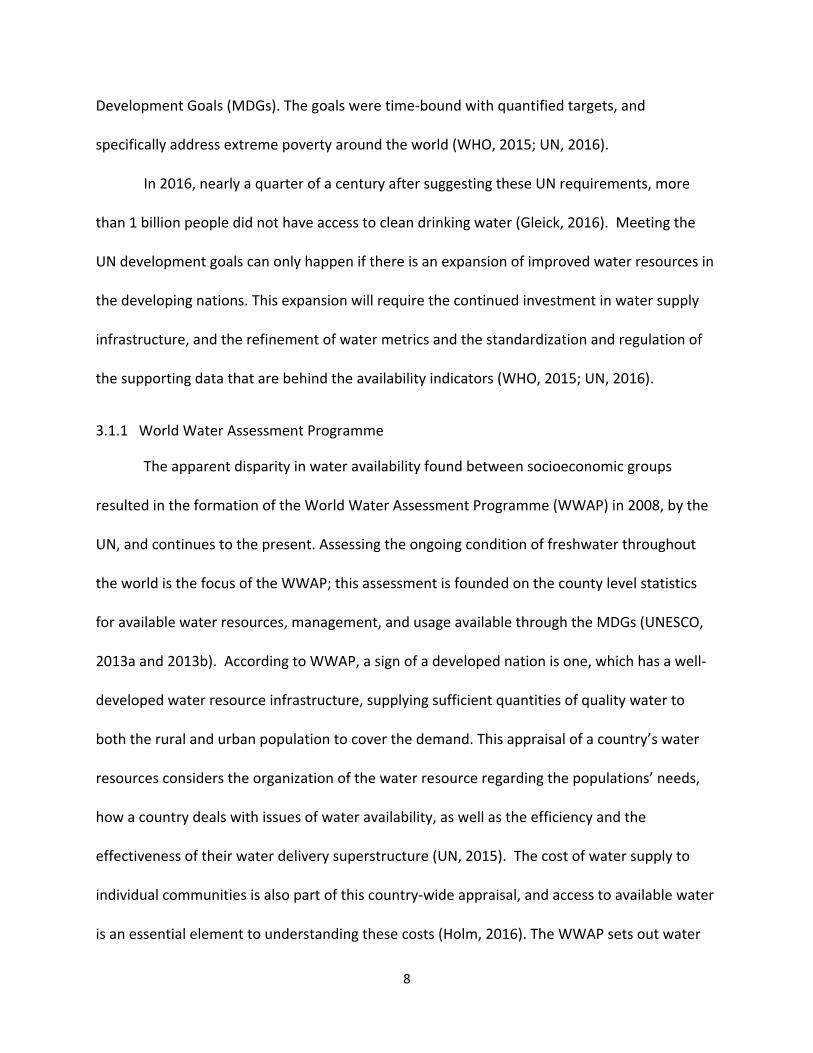
Development Goals (MDGs). The goals were time-bound with quantified targets, and
specifically address extreme poverty around the world (WHO, 2015; UN, 2016).
In 2016, nearly a quarter of a century after suggesting these UN requirements, more
than 1 billion people did not have access to clean drinking water (Gleick, 2016). Meeting the
UN development goals can only happen if there is an expansion of improved water resources in
the developing nations. This expansion will require the continued investment in water supply
infrastructure, and the refinement of water metrics and the standardization and regulation of
the supporting data that are behind the availability indicators (WHO, 2015; UN, 2016).
3.1.1 World Water Assessment Programme
The apparent disparity in water availability found between socioeconomic groups
resulted in the formation of the World Water Assessment Programme (WWAP) in 2008, by the
UN, and continues to the present. Assessing the ongoing condition of freshwater throughout
the world is the focus of the WWAP; this assessment is founded on the county level statistics
for available water resources, management, and usage available through the MDGs (UNESCO,
2013a and 2013b). According to WWAP, a sign of a developed nation is one, which has a well-
developed water resource infrastructure, supplying sufficient quantities of quality water to
both the rural and urban population to cover the demand. This appraisal of a country’s water
resources considers the organization of the water resource regarding the populations’ needs,
how a country deals with issues of water availability, as well as the efficiency and the
effectiveness of their water delivery superstructure (UN, 2015). The cost of water supply to
individual communities is also part of this country-wide appraisal, and access to available water
is an essential element to understanding these costs (Holm, 2016). The WWAP sets out water

9
statistics in an annual report (UN, 2006 and 2015), using the UN database AQUASTATS. The
Land and Water Division of the UN developed this database, and the Food and Agriculture
Organization (FOA ) maintains it. One of the metrics in the database is Total Actual Renewable
Water Resource (TARWR), which is used to define the quantity of potentially available water
resources and is the basis for these cost calculations.
3.1.2 Database AQUASTATS-TARWR metric
TARWR also includes a measurement of the water quality and wastewater aspect of the
resource. Calculated values for the seasonal, annual and long-term TARWR for each
participating country are made at the state spatial level. The statistics are stored in the
AQUASTATS database by country and include water uses, agricultural management, and many
other water resource topics. The data is gathered and compiled annually by the World Health
Organization (WHO) and the United Nations International Children's Emergency Fund (UNICEF)
from routine censuses and household surveys sent out every 3-4 years. In the questionnaire,
the householders are asked about their basic drinking water source type, whether it is
improved or not, and whether the source is on the premises (UN, 2016). Not accounted for in
the surveys are issues of continuity, broken hand pumps or public standpipes, as well as
seasonality of supply, as in the case of reservoirs and shallow ground water wells.
Worthy of note is that the majority of the consumers surveyed are illiterate, so the
surveys are primarily verbal questionnaires, with interpreted responses. The qualitative
responses to the surveys are then coded, and the results analyzed. This method of surveying
introduces several degrees of biases to the analyzed data as the users' judgment as to the
quality of the water available to them is subjective (Montello et al., 2013). When surveys are

10
not available, administrative records are used. However, data from these surveys have been
found to be far more reliable than administrative records as the basis of the data is actual use
of sources, and households provided information on the facilities utilized rather than the mere
presence of the sources (UN, 2016). The frequency of the surveys has been found to be
sufficient to determine actual changes in access to safe drinking water. The quality of water in
each census area is known from microbiological and chemical laboratory testing. However, the
number of samples taken is very restricted due to cost and practicality (UN, 2016). The
laboratory and survey results are combined, and the WHO/UNICEF Joint Monitoring
Programme for Water Supply and Sanitation (JMP) estimates basic access for each country by
fitting a regression line to the series of data points from the study region. For global comparison
of this data, adjusting these national estimates occurs (UN-Water, 2016).
TARWR is a measure of cubic meters per capita per year (m3/cap/yr) and has four focus
components: context, function, governance, and performance. Context refers to the water
storage quantities and is an estimate of the surface and groundwater reservoir capacities. Run-
off, infiltrating water and evapotranspiration rates are components of the reservoir capacity.
Function refers to the quantity of water used; and includes social, economic and environmental
components. Deriving an indication of a region’s water scarcity can be achieved by considering
both the context and function values of that shortage. A third element of the TARWR is
governance, which is the management of the resource. Governance will include the standards
and procedures for data gathering. Performance is the fourth component; this is a combined
measure of the quality and quantity of the resource and will be a function of the methods of
sampling, testing, and reporting. Table 1 outlines the parameters associated with each

11
component of TARWR. These listed TARWR metrics do not specifically address the critical
metric: access.
Table 1: AQUASTATS TARWR measures and associated indicators. TARWR focus component parameter measured, m3/capita/yr context water storage
function water use
governance management of resource
performance quantity and quality
Molden (2007) points out that issues arise when applying this statistic on the global
scale as there are known discrepancies in data for the same variable from different nations.
These discrepancies arise as the result of differences in definitions and methodology in
monitoring processes and data reporting. The comparison of the data is also an issue: the
country size, climate, and development level for the study regions are not considered. The scale
of the information is that of the country rather than a watershed, and there are often
difficulties in obtaining a full-time series of the data, giving rise to further discrepancies when
comparing data across political boundaries.
3.1.3 Interpretation of Water Resource Statistics
The global interpretation of the water resource statistics is, therefore, very generalized.
A nation that has high, or moderately good, water availability statistics is often seen as having a
population with good access to that water. Conversely, a nation with a low water resource
statistic is represented as having poor access to the water. However, inconsistencies arise when
applying these high-level statistics at the micro-level, in which case access and technologies
12
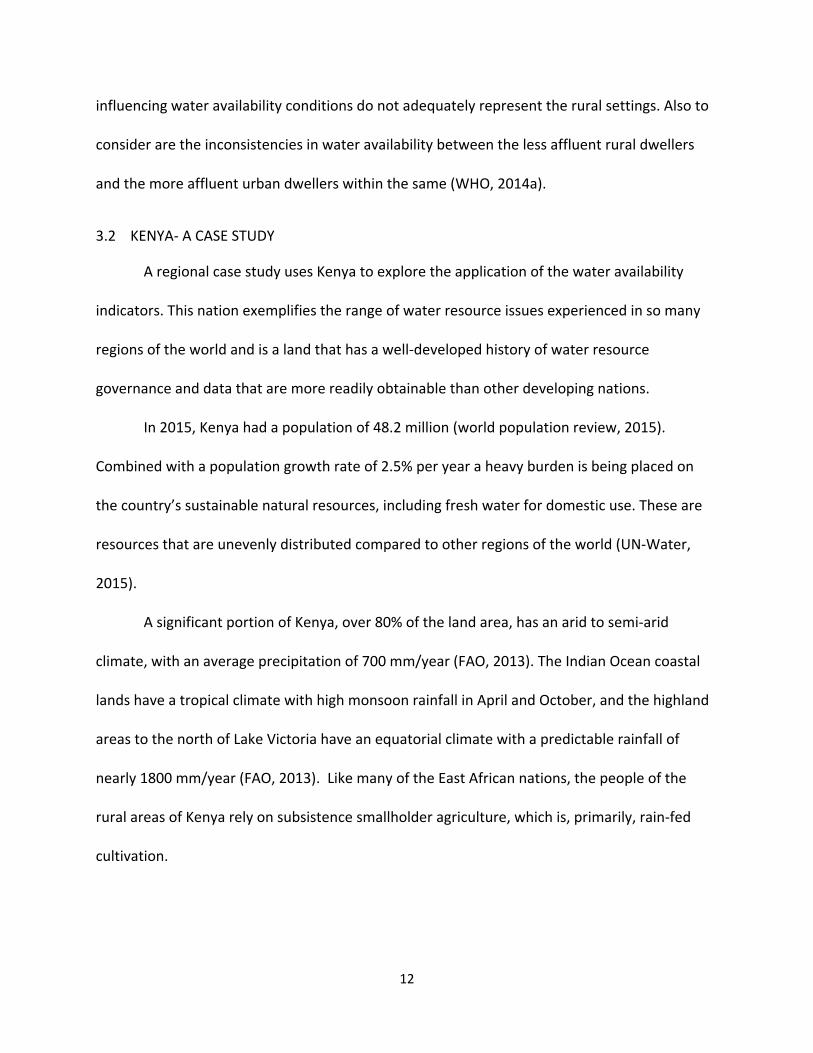
influencing water availability conditions do not adequately represent the rural settings. Also to
consider are the inconsistencies in water availability between the less affluent rural dwellers
and the more affluent urban dwellers within the same (WHO, 2014a).
3.2 KENYA- A CASE STUDY
A regional case study uses Kenya to explore the application of the water availability
indicators. This nation exemplifies the range of water resource issues experienced in so many
regions of the world and is a land that has a well-developed history of water resource
governance and data that are more readily obtainable than other developing nations.
In 2015, Kenya had a population of 48.2 million (world population review, 2015).
Combined with a population growth rate of 2.5% per year a heavy burden is being placed on
the country’s sustainable natural resources, including fresh water for domestic use. These are
resources that are unevenly distributed compared to other regions of the world (UN-Water,
2015).
A significant portion of Kenya, over 80% of the land area, has an arid to semi-arid
climate, with an average precipitation of 700 mm/year (FAO, 2013). The Indian Ocean coastal
lands have a tropical climate with high monsoon rainfall in April and October, and the highland
areas to the north of Lake Victoria have an equatorial climate with a predictable rainfall of
nearly 1800 mm/year (FAO, 2013). Like many of the East African nations, the people of the
rural areas of Kenya rely on subsistence smallholder agriculture, which is, primarily, rain-fed
cultivation.

13
3.3 INDICATORS
As the literature review progressed, it became evident that there was a very mixed
usage of ‘indicator’ and ‘index’ terminology. It is apparent that ‘ index’ was the favored
terminology before 2000, used to describe a derived measure of a parameter that serves to
specify a value or quantity that is weighted or scaled against a base value; ‘indicator’ being used
interchangeably with ‘index’ post-2000. Underlying all water resource indicators/indices is the
understanding of two basic categories of water availability: water quantity and water quality.
Of the 115 studies from the literature review that met the search criteria for access to
available potable water less than 10% addressed water access, and these were principally case
studies. The majority of the studies focused on water quantity and quality without addressing
access. The literature review identified a set of long-standing commonly used scientific indices
developed since 1989 to define the availability of a water resource. Table 2 lists the key water
availability indicators that are referred to most often in the literature.
Table 2: List of key water availability indicators described in the literature. Indicator Year presented Notes Falkenmark Index\Water Stress Index
1989 discussed below
Basic Water Requirements Index 1996 discussed below
Water Resources Vulnerability Index 1997 discussed below
Relative Water Scarcity Index 1999 discussed below; Moore et al. (2015) further adapted this index
Millennium Development Goal 7.8 2000 discussed below
Water Poverty Index 2002 discussed below
Water Availability Index 2015 developed for use in the US
Water Scarcity Index. 2015 developed for use in the US
Drinking Water Quality Index post 1999 variation on Water Scarcity Index
Acceptability Water Quality Index post 1999 variation on Water Scarcity Index
Climate Moisture Index post 1999 variation on Water Scarcity Index
Health Water Quality Index post 1999 variation on Water Scarcity Index

14
Of these twelve indices, only five were discernable as having been specifically utilized in
practice to describe water availability in developing, semi-arid regions of the world; places
where water withdrawal and water availability metrics are the most often presented data sets.
Table 3 summarizes the five indices that fit the region of focus criteria; and include, in
chronologic order by research year: the water stress index; the basic human needs index; the
water resources vulnerability index; the indicator of relative water scarcity; and the water
poverty index.
Table 3: Summary of indices that have been specifically used to address water scarcity issues in semi- arid regions.
Indicator/Index Spatial Scale
Reference Required Data
Falkenmark Index/ Water Stress Index
country Falkenmark, 1989
total annual renewable water resources ( m3/year) population (%)
Basic Water Requirements
country Gleick, 1996 domestic water use per capita (m3/cap/year)
Water Resources Vulnerability Index
country Raskin, 1997 annual water withdrawals (m3/year) total renewable water resources (km3/year) GDP per capita ($)
national reservoir storage volume km3) precipitation time-series (mm) % external water resources (%)
Relative Water Scarcity Index
country Seckler et al., 1999; Moore et al., 2015
water withdrawals in 1990 water (km3/year) withdrawals in 2025 (m3/year)
Water Poverty Index
country, region
Sullivan, 2002 • internal and external access to safe water, and sanitation (m3/cap/year)
• irrigated land, total arable land, total area, (m2)
• GDP per capita ($) • GDP per sector ($) • under 5-mortality rate
(%)
• UNDP education index
• Gini coefficient • domestic water use
per capita (m3/year)
• water quality variables
• use of pesticides • environmental
data
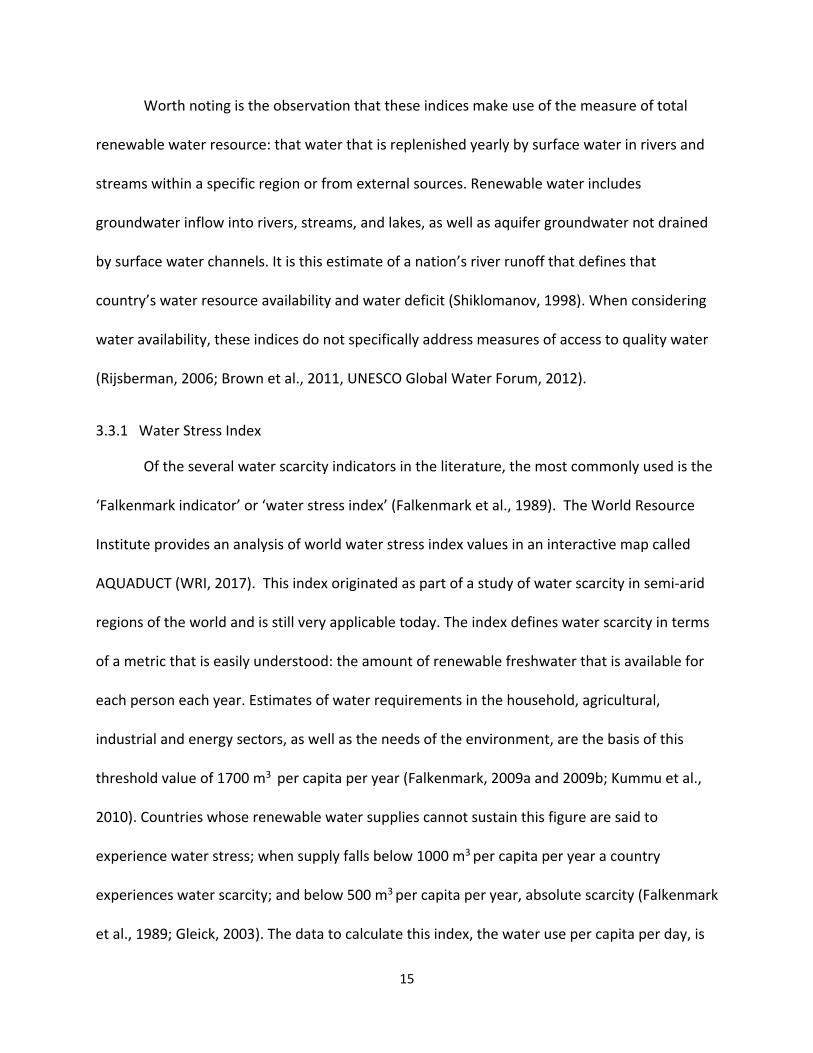
15
Worth noting is the observation that these indices make use of the measure of total
renewable water resource: that water that is replenished yearly by surface water in rivers and
streams within a specific region or from external sources. Renewable water includes
groundwater inflow into rivers, streams, and lakes, as well as aquifer groundwater not drained
by surface water channels. It is this estimate of a nation’s river runoff that defines that
country’s water resource availability and water deficit (Shiklomanov, 1998). When considering
water availability, these indices do not specifically address measures of access to quality water
(Rijsberman, 2006; Brown et al., 2011, UNESCO Global Water Forum, 2012).
3.3.1 Water Stress Index
Of the several water scarcity indicators in the literature, the most commonly used is the
‘Falkenmark indicator’ or ‘water stress index’ (Falkenmark et al., 1989). The World Resource
Institute provides an analysis of world water stress index values in an interactive map called
AQUADUCT (WRI, 2017). This index originated as part of a study of water scarcity in semi-arid
regions of the world and is still very applicable today. The index defines water scarcity in terms
of a metric that is easily understood: the amount of renewable freshwater that is available for
each person each year. Estimates of water requirements in the household, agricultural,
industrial and energy sectors, as well as the needs of the environment, are the basis of this
threshold value of 1700 m3 per capita per year (Falkenmark, 2009a and 2009b; Kummu et al.,
2010). Countries whose renewable water supplies cannot sustain this figure are said to
experience water stress; when supply falls below 1000 m3 per capita per year a country
experiences water scarcity; and below 500 m3 per capita per year, absolute scarcity (Falkenmark
et al., 1989; Gleick, 2003). The data to calculate this index, the water use per capita per day, is

16
readily available from country census data. However, it does not help to explain the true nature
of water scarcity, as the simple thresholds for each category of scarcity do not display the main
differences in demand among countries due to climate, land use, lifestyle, and similar
parameters (Falkenmark, 2007; Falkenmark et al., 2009). Additionally, the water stress index
does not consider the human-made increases in water supply, such as desalination as well as
recycled and reused water withdrawals.
3.3.2 Basic Water Requirements
A second widely used index is the basic water requirements (BWR) which was created
by Gleick in 1992. The BWR refers to the water consumption per capita per day. According to
Gleick, a personal entitlement should be 50 liters of water per person per day: 5 liters of
drinking water; 20 liters of sanitation water; 15 liters of bathing water; and 10 liters for food
preparation. This entitlement means each person needs access to 15 -30 liters of potable water
each day. Only 20% of the world's population uses 5 liters, or more, per person per day (Gleick,
2016). Some nations use considerably more than this: North America and Japan use 350 liters
per capita per day and Europe 200 liters per capita per day. On average, sub-Saharan Africa
countries use 10-20 liters per capita per day (WHO, 2014; Institute Water for Africa, 2016;). De
Villiers notes that the human ‘need’ for water varies widely around the world. The ‘needs’ of
North American rural populations is very different to those of sub-Saharan rural villages. De
Villiers and many others note that lack of water may not be solely a problem of supply, but is to
a degree an issue of correctly managing the allocation and distribution of the resource (de
Villiers, 2001). The quantity of available water must also take into consideration the water
needs for agricultural and industrial use associated with a human population’s everyday
17
existence. Consideration should also be given to the water consumption for the environment;
for example, the water of a floodplain wetland which is not part of the stream flow, so often
ignored (Rijsberman, 2006; UNESCO Global Water Forum, 2012).
The Basic Water Requirement index is used as a basic guide to water needs; the 5 liters
of fresh water use is the amount that an average person, living in a moderate climate, needs to
drink daily to survive. In many parts of the semi-arid and arid regions of the world, people can
exist on far less, using the 5 liters per day as their total use (Gleick, 2016). The United Nations
Educational, Scientific and Cultural Organization (UNESCO) adopted the BWR after modifying
the definition to be 20 liters of water per person per day from an improved source, within 1
kilometer of the user’s dwelling (JMP, 2008).
The index represents a need for a water resource and does not apply an access factor.
Nations experiencing water scarcity will have a high rate of gray water reuse; for example,
domestic water used for food preparation will be used to water a vegetable garden or fruit
trees (greywateraction, n.d.) There are no measurements of gray water utilized in this index.
Applying the same BWI across climatic, geographic and socioeconomic boundaries does not
seem very realistic.
3.3.3 Water Resources Vulnerability Index
The water resources vulnerability index (WRVI), is the third index of interest. In 1997
Raskin et al. replaced water demand with water withdrawal (use) values in Igor Shiklomanov’s
comparison of a nation’s annual water availability with the assessments of its national water
demand by the agricultural, industrial and domestic users. Water withdrawals are defined as
the amount of water taken out of rivers, streams or groundwater aquifers to satisfy human

18
needs for water. The WRVI is presented as a percent of available water resources and is refers
to a region’s water resource scarcity. A country termed ‘water scarce’ is one which has annual
withdrawals are between 20% and 40% of the annual supply, and ‘severely water scarce‘ if
annual withdrawals are greater than 40% (Rijsberman, 2006). When a person does not have
access to safe and affordable water for domestic use that person is termed ‘water insecure’
(Seckler, 1999; Rijsberman, 2006). When a group of households lives in an area that is water
insecure for the majority of the time, that area is ‘water scarce’. The measure of water
withdrawal indicates that there is access to a water resource. However, the WRVI is calculated
on the country or perhaps regional scale, for comparisons at that same scale, and will not
indicate specific access values per household.
3.3.4 Relative Water Scarcity Index
The fourth index of interest is the Relative Water Scarcity Index (Seckler et al. 1998;
1999). The index uses the same data and a similar approach to the WVRI but projects the
change in demand over time. Seckler et al. looked at both the existing and projected water
supply and demand values from 118 countries for the years 1990-2025. The then presented
global data in the format of a map showing the projected percentage change in demand (only),
by population, across the domestic, agricultural and industrial sectors for those countries across
this period. They estimated that one-quarter of the world’s population would be affected by
water scarcity, again withdrawing 20% and 40% of the annual supply, by 2025; and that one-
third of this population would occur in developing countries. This index provides only the best
estimate value of the percentage change in demand, with no reference to access to water. The
accuracy of this index becomes limited by the poor quality of the international data set (see

19
Chapter 3.5.2 for a full discussion on data quality). Moore et al. (2015) defined the Water
Scarcity Index as the ratio of water consumption to available runoff, working on water statistics
in California. As runoff is not a metric readily available in the focus region of this study further
discussion of Moore’s interpretation of water scarcity has not been included.
The literature review identified several other methods for quantifying and measuring
water scarcity that takes into account various economic and physical parameters relating to
water resource availability. These methods include measurements of lack of availability, the
absence of variable volume to meet demand, and high levels of water use relative to available
water supplies, but no measure of access to water. Gaupp et al. (2015) used a global water
balance model to derived water scarcity values by considering large global river basins across
country borders. They define water scarcity as occurring when the aggregated storage is less
than 20% of the capacity, and define water storage dependency as the difference between
months with no storage and months in which demand exceeds supply. Climate variation and
human socioeconomic development have altered the world’s hydrological cycle over the last
century and a half (Vörösmarty et al., 2010; Wada et al., 2013; Rockstrὅm et al. 2014). Several
studies have shown that river water depletion around the world is considerable. About half
the river water withdrawn for general use has evaporated, and approximately 25% of the water
has been changed due to overuse (Kummu at al., 2010; Jägerskog and Clausen, 2012; Kumar,
2013; Wada et al., 2013; Rockstrὅm et al., 2014). Hydrologic variability in a region is as
important to that region’s water scarcity as the average water availability (Gaupp et al., 2015).
Such variability occurs in many river basins of the world, regions where water withdrawals have

20
resulted in over abstraction of river water to the detriment of the river’s ecosystem as well as
at the expense of the country; the Nile in Egypt is a case in point.
3.3.5 Water Poverty Index
The fifth index of interest is the water poverty index (WPI). This index developed out of
the need for a universal tool to measure the water stress that disadvantaged populations
tolerate; those who suffer most from inadequate access to water (Sullivan et al., 2003;
Vörösmarty et al., 2005). The index is a weighted average of five standardized components:
resources, access, capacity, use, and the environment. The resources component includes the
physical availability of surface and ground water and takes into account the variability and
quality of the resource as well as the total amount of water. The access component considers
the extent of access to water for human use, for irrigation, industrial as well as domestic
consumption, and accounts for the distance to a safe source, as well as the time needed for
domestic water collection, and other significant factors. The capacity component accounts for
the achievement of the population to be financially able to purchase the water. This element
will include the aspects of population health and educational circumstance, both affecting
income level. The use component is an indicator as to the purposes of the water purchase. The
final element of the WPI, an environmental component, gives an estimate of the environmental
reliability related to water, and of ecosystem goods and services that the aquatic habitats
provide in the area of interest (CEH, n.d.; Sullivan, 2002). Collectively, the weighted average,
the community’s capacity for water management and other environmental aspects form a
single number. This value is used to help to determine the priority needs for water
management and distribution. Water consumption, resource reliability, and socioeconomic

21
coping capacity data for a community can be further grouped and may be used to indicate a
region's overall water vulnerability (Gleick, 2015; Rodrigues et al., 2015).
3.3.6 Millennium Development Goal 7.10.30
Even though these five indices remain in use after more than thirty years, and have been
further adapted and refined to particular fields of use, (Dὅll et al., 2003 and 2009), they have
not helped us to successfully meet the United Nations' Millennium Declaration’s 2000
commitment. The commitment "to halve by 2015 the proportion of people who are unable to
reach, or to afford, safe drinking water" and "to stop the unsustainable exploitation of water
resources, by developing water management strategies at the regional, national and local
levels, which promote both equitable access and adequate supplies".
In the context of development goals, the UN defines drinking water as water used for
consumption (drinking and food preparation) and basic hygiene purposes, and an improved
drinking water source; one protected from outside contamination by an engineered structure.
Table 4 shows examples of unimproved and improved water supplies.
Table 4: Examples of unimproved and improved water supplies (summarized from UN, 2000; Opare, 2012; Dobrowsky et al., 2014)
unimproved water supplies improved water supplies
unprotected well household connection; piped water
unprotected spring public standpipe
tank/truck provided water boreholes/ tube wells
bottled water (considered unimproved because of quantity; may be considered improved if there is no secondary source of water )
protected springs
rainwater collection from roofs rainwater harvesting in an enclosed cistern system

22
Improved water does not include surface water taken directly from rivers, ponds,
streams, lakes, dams, or irrigation channels, all of which are common sources of water in
developing rural communities of the world (Quin et al., 2011).
In 2015, more than 10% of the world’s population still did not have access to improved
drinking water. This percentage may seem small, but it is the location of these populations that
is striking. The majority lived in the rural, water scarce, developing nations of the world, where
rural households were still in desperate need of water resource planning (UNESCO, 2012).
The UN has monitored progress toward this commitment with the United Nations
Millenium Development Goal 7, Target 10, Indicator 30 (MDG7.10.30). This indicator was
developed to directly addresses the question of access to available water by measuring the
proportion of population within 1-kilometer sustainable access to an improved water resource,
calculated separately for urban and rural areas (WHO, 2006). In 2015 the Sustainable
Development Goals (SDG) were defined to pick up where the MDGs left off, and achieve the
target goals by 2030. SDG 6 addresses clean water and sanitation, with Target 6.1 stating ”By
2030, achieve universal and equitable access to safe and affordable drinking water for all”, and
Indicator 6.1.1 being “the proportion of the population using safe managed drinking water
services”.
The UN states that fully understanding a nation’s renewable water resources can only
be reached if serious steps are taken to improve the existing controls, policies, planning, and
administration of all water supplies within that nation. These steps require the development of
global tools for monitoring and protocols for managing and coordinating water availability and

23
usage. The UN further states that beneficial water resource conversation between nations only
occur once when these tools and protocols are made accessible to all nations (UN, 2014).
To be noted is the fact that many year-round engineered water sources are often
unavailable due to maintenance issues or inadequate quantity, which in turn affects the quality
of the water. Not incorporated into the AQUASTATS data, used as a basis for this indicator, is
the detail that 1 in 3 hand pumps in sub-Saharan Africa does not function year round due to
lack of maintenance (Ntouda et al., 2012; Shiferaw, 2014). Improved water does not include
surface water taken directly from rivers, ponds, streams, lakes, dams, or irrigation channels, all
of which are widespread sources of water in developing rural communities of the world.
The UN’s World Water Development Reports (WWDR) gathers statistic in the form of an
annual thematic report that focuses on different strategic water issues and aims to provide
decision-makers with the tools for sustainable use of water resources. At present, these
statistics require no fewer than 150 variables to be measured. The governance issues combined
with the subject of data gathering for these indicators puts heavy constraints on trying to
achieving the SDGs. The refined of this vast number of parameters into a smaller set of
significant variables is of great importance if the reporting of water resources is to be a success.
A set of targets comprises each of the 8 MDG’s and 17 SDG’s, with a series of indicators
assigned to each target to gauge how each target is being achieved. The are four target
indicators categories: those that focus on the context of the water resource, those on function,
those on governance, and those that emphasize the performance of the resource within each
region of interest. Table 5 shows the relationship between the MDG and SDG that is related to

24
clean water and sanitation and summarizes the specific indicators that address access to
drinking water.
Table 5: Summary of Millennium Development Goal 7.10 and Sustainable Development Goal 6.1. Goal Objective/Target Description/Required Data
MDG 7 (Pre- 2015)
ensure environmental sustainablity
Target 10 halve, by 2015, the proportion of people without sustainable access to safe drinking water and basic sanitation Indicator 30 % of population using an improved drinking
water source, urban and rural (WHO, 2015) SDG 6 (Post- 2015)
ensure access to water and sanitation for all
Target 1 by 2030, achieve universal and equitable access to safe and affordable drinking water for all. AQUASTATS Indicator 1 % of population using safely managed
drinking water services (WHO, 2015)
The AQUASTATS-TARWR parameter is the source data for both of these development
goal indicators, and as previously discussed (3.1.2) TARWR is a quantitative value created from
stakeholder participation via qualitative census questionnaires; there is no actual measure of
quantity used per person per day, or cost/affordability data. Hence, neither the MDG target
7.10 nor the current SDG target 6.1 is a measure of the quantity of accessible a household.
Neither does either target represent a cost per liter per day for each household in financial
terms, nor the cost in terms of the time taken to collect the water and transfer it to the home.
The annual WWAP and JMP monitoring and reporting continue, and the indicators are
regularly reviewed by the UN to ensure that the outcome of the analysis of the measurements
is still focused on water resource usage and management.
25
3.4 CHALLENGES TO QUALITY WATER
The literature shows that there is a direct correlation between quantity of water and the
quality of the water. In most scenarios as the quantity decrease so does the quality. Poor water
quality provides the habitat paths as well as a delivery medium for water-borne diseases,
further re-enforcing the importance of clean potable water for healthy populations.
In many rural, developing regions of the world, the sole source of drinking water is from
sanitized surface and near-surface water. Water for drinking is water taken from the rivers,
lakes and standing ponds, irrigation ditches, rainwater harvesting, or shallow wells rather than
more sanitary infrastructure delivery, such as wellhead pumps and taps (Leiter et al., 2012).
Very often the hardest acquired water is contaminated, and in some instance may be deadly to
the very young and poor. The standard set by the UN for a water resource to be considered
potable is often too high for a nation to achieve. There are several point-of-use disinfection
methods already in use around the world; all have been shown to be very effective in improving
water quality (Lule et al., 2005). However, the initial condition of the water will govern the
amount and type of effort that has to go into disinfecting the water. A flocculant, such as ferric
sulfate, must be used to treat water that has the slightest amount of turbidity. Once the
flocculant is stirred into the water the container must be left to sit for a half hour, or so. The
sediment will coagulate and fall to the bottom of the container and the treated water can then
be filtered out and disinfected. Low-cost disinfecting methods, ideal for use in undeveloped,
semi-arid, rural areas of the world, and already widely in use include solar treatment and
boiling. The reuse of undamaged plastic water bottles is a very effective way to solar heat a liter
of water at a time. Leaving water filled bottles in the full sun for at least 12 hours has been

26
found to be a very cheap and productive way to sanitize the water (Lule et al., 2005). Boiling is
another commonly used sanitization method. However, this approach requires a supply of fuel
and is therefore often an expense that many householders are not able to expend. Boiling
water containers are also a source of danger to householders with young children. The use of a
solution of a sodium hypochlorite is a very cheap (cents per day) and easily available
disinfectant for both drinking water and water for other domestic purposes (UNESCO, 2013).
The solution is added to a water container and stirred, and the water is ready for use almost
immediately. Water filtration is an alternative method of treatment, and like the sodium
hypochlorite has created markets in many developing nations. Filters are most often locally
manufactured clay filters placed at the top of a container, with the untreated water flowing
under gravity through the filter, collecting at the bottom of the container where a spigot enable
the homeowner to pour out the clean water. Large set-ups using sand and gravel filters often
act as an alternative to the clay filters, and result in larger quantities of clean water. The
cleanliness of the containers and utensils used and the quality of the filters will determine the
quality of the final product. Novel innovations abound; the straw- filter is a recent innovation.
Sucking the water through a fiber filter removes any suspended particles (causing turbidity)
from the water, as well as waterborne bacteria and protozoan cysts; LifeStraw® is an example.
These niche solutions for water cleansing offer individuals access to small, affordable quantities
of useable water.
3.4.1 Potable Water in Kenya
Figure 1 shows the Kenyan AQUASTATS data for the annual average surface, ground and
renewable water resources for the period 2012-2014 (estimated, best available data). The data

27
shows that 98% of the total internal renewable water comes from surface water, with 67%
being of internal water resources. Less than 10% of this water is groundwater. The total
renewable water resources in Kenya are 30.7x 10⁹ m3 /year (FOA, 2013), and external water
resources are estimated at 10 x 109 m3 /year, giving Kenya a dependency ratio of 33% (WHO,
2015).
Annual freshwater withdrawals in Kenya are 3.2x10⁹ m3 /year, 16% of the total of internal
freshwater resources (FOA, 2013), putting Kenya close to the water vulnerability index of
‘water-scarce’. This value is an average across the country; in the semi-arid and arid regions of
the country, which are located away for the lakes and rivers the water vulnerability index is
certainly at ‘severely water scarce’. It is quite evident that Kenya is a country that is almost
entirely dependent upon surface water for its available water resources.
Figure 1: AQUASTATS average annual data for the Republic of Kenya 2012-2014.
The annual renewable water resources per capita in Kenya for 2015 were 667
m3/capita/year (WHO, 2015), which falls within the water stress index category of ‘scarce’.
Future projections show that by 2025, water availability will drop to 235m3 /capital/year
0
10
20
30
40
Water quantity, x109
m3/year
Average Annual Internal renewable water resource and surface and ground water comparison-Kenya
Total renewable waterresources
Total internal renewablewater resources
Total renewable surfacewater
Surface water producedinternally
Grounwater producedinternally
Overlap between surfacewater and groundwater

28
(water.org, 2017), which places Kenya’s population into the ‘absolute scarcity’ range of the
water scarcity index. The most recent data for the basic water requirements for Kenya were at
46%; this places the country below the 50 liters per person per day threshold (WHO, 2015;
WHO, 2017). Data collected by the World Resource Institute (WRI) for Kenya demonstrates the
many water quantity resource issues : a low to medium drought risk; a medium to high risk for
interannual variability in water resources; a high risk for flood occurrence; and a low to medium
risk for drought severity (floodlist, 2016; WRI, 2017).
The research shows that the primary water source in developing, semi-arid, rural
regions of the world is most often surface water in the form of lakes, rivers, stream, irrigations
ditches, ponds and water holes, and occasionally engineered infrastructures. Figure 2a shows
the 2015 WHO-UNICEF water supply statistic for Kenya’s total population. It must be noted that
in 2015 79% of Kenya’s population were rural dwellers (UN, 2006; FOA, 2013), and recalled that
an improved water resource is one that is engineered (see Chapter 3.3.6).
The data shows that in 2015 21.4% of the total population of Kenya was served with
piped water and 41.5 % with other improved water supplies.
Figure 2a: Proportional distribution of total population water statistics for Kenya in 2015 (WHO-UNICEF knoema data, 2015).
21.69%
41.50% 21.92%
14.89%
36.81%
Total population- Kenya 2015
Total populationserved with PipedWaterTotal populationserved with OtherImproved WaterTotal population withSurface Water
Total population withOther Unimproved
Improved waterUnimproved water
29
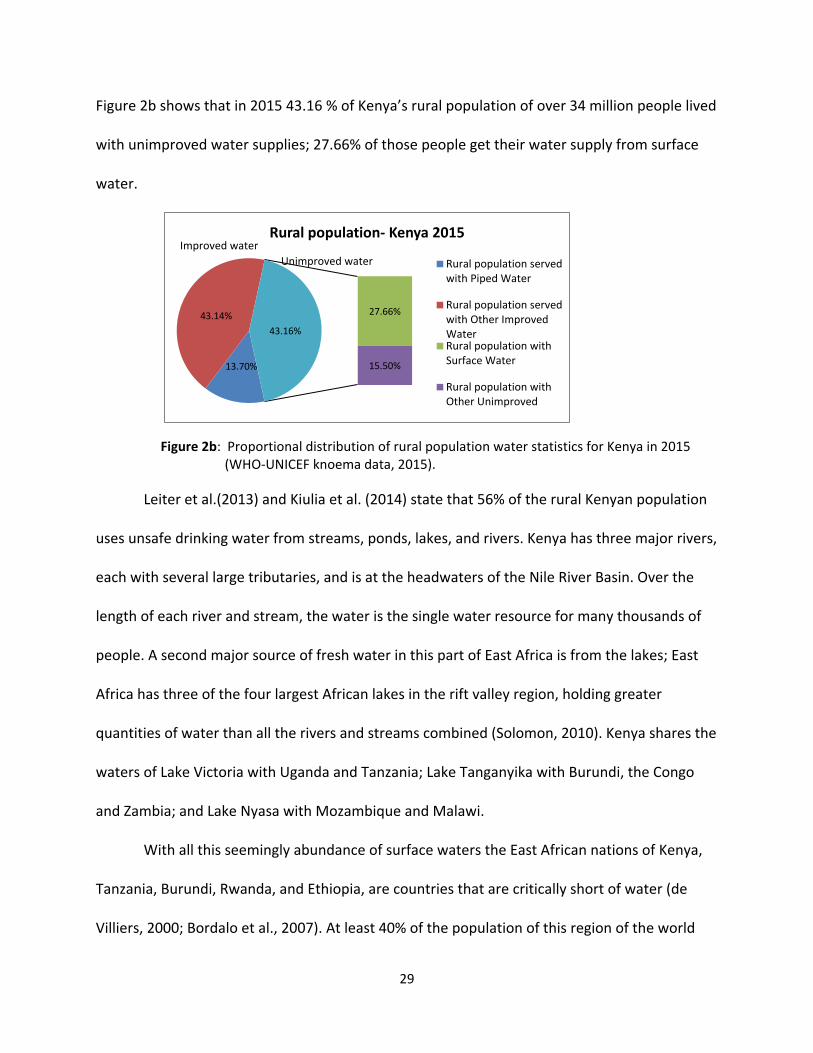
Figure 2b shows that in 2015 43.16 % of Kenya’s rural population of over 34 million people lived
with unimproved water supplies; 27.66% of those people get their water supply from surface
water.
Figure 2b: Proportional distribution of rural population water statistics for Kenya in 2015 (WHO-UNICEF knoema data, 2015).
Leiter et al.(2013) and Kiulia et al. (2014) state that 56% of the rural Kenyan population
uses unsafe drinking water from streams, ponds, lakes, and rivers. Kenya has three major rivers,
each with several large tributaries, and is at the headwaters of the Nile River Basin. Over the
length of each river and stream, the water is the single water resource for many thousands of
people. A second major source of fresh water in this part of East Africa is from the lakes; East
Africa has three of the four largest African lakes in the rift valley region, holding greater
quantities of water than all the rivers and streams combined (Solomon, 2010). Kenya shares the
waters of Lake Victoria with Uganda and Tanzania; Lake Tanganyika with Burundi, the Congo
and Zambia; and Lake Nyasa with Mozambique and Malawi.
With all this seemingly abundance of surface waters the East African nations of Kenya,
Tanzania, Burundi, Rwanda, and Ethiopia, are countries that are critically short of water (de
Villiers, 2000; Bordalo et al., 2007). At least 40% of the population of this region of the world
13.70%
43.14% 27.66%
15.50%
43.16%
Rural population- Kenya 2015
Rural population servedwith Piped Water
Rural population servedwith Other ImprovedWaterRural population withSurface Water
Rural population withOther Unimproved
Improved waterUnimproved water

30
will experience drought stress at least once in each generation (Falkenmark et al., 1989; Gleick,
2003; Falkenmark, 2009a and 2009b; Kummu et al., 2010; Vörösmarty, 2010). The existence of
chronic water stress is very often an indicator to flash point locations for future water scarcity
in a region (Vörösmarty et al., 2010). This lack of investment in water infrastructure by the
Kenyan government has resulted in Kenya ranking as having one of the lowest water supply
coverages in the world (WRI, 2017), creating the observable economic water scarcity.
The Millennium Development Goal 7C set for 2015: “to achieve universal access to basic
drinking water, sanitation and hygiene for households, schools and health facilities” was
partially reached in this part of the world. Over the period 1990-2015 Kenya had a 73% increase
in the rural population using improved water resources; however, by 2016 this percentage had
fallen to 57% (UN, 2016; justoneafrica, 2016).
Rapidly growing populations, increasing agricultural development, urbanization, and
industrialization over the last quarter of a century has led to poor land management
contributing to a change in the water resources (Carter and Parker, 2009; UN, 2015). The
literature alludes to the skew of the assessment of common resources by governments in these
nations to manipulate supplies to the urban areas (Reddy, 1993; Raditloaeng, 2012; UN, 2014).
Across much of semi-arid East Africa, there has been a recent move from nomadic
pastoralism as a livelihood to cattle farming on a larger scale to supply meat to a growing
market in the Arabian Peninsula. This overstocking is depleting traditional water resources, and
has resulted in deforestation, the degrading of the soils, and the silting and polluting of the
watersheds, lands that are already vulnerable and drought-prone (GWP, 2015). The lack of
domestic and industrial waste treatment has led to further deterioration in water quality of the

31
rivers and the groundwater, water needed by so many for domestic purposes (GWP, 2015;
UNESCO, 2015).
3.4.1a Associated Sanitation Issues
Tied to the scarcity of potable water is the lack of availability of water for sanitation
purposes. One-third of the global population defecates in the open air, with 86% of those
people living in rural areas (WHO, 2014b). In Kenya, nearly 10% of the rural population
defecates in the open. When there were western type toilets installed during the British
colonial era, poor maintenance and age have resulted in the collapse of the sewage pipes.
Some of these sanitary systems have been replaced by pits, with the use of the pit contents as
fertilizer in the fields. Historically, water development programs have focused on education as
the key to reducing open-air sanitation practices (O’Reilly et al. 2017; WHO, 2014b). However,
these are not educational issues. There are complexed gender cultural issues that prevent
females from accessing proper sanitation facilities and cause the female population to suffer
severe health and safety issues as a result of these cultural taboos.
3.4.1b Associated Health Issues
Water-related diseases are prevalent in this region of the world (Devi and Bostoen,
2009). Water-borne diseases in Kenya are attributed to cause 70-80% of local health issues
(Kenyan Aid Programme, 2009). Where precipitation and infiltrating runoff are the primary
water resources, the flow of water accommodates and transports the bacteria and viruses
(naturally occurring and pathogens) into the surface and groundwater system (Gerba and
Bitton, 1984). Communal latrines and bathing areas are usual in developing, and undeveloped
countries and the location of human wastewater and domestic animal waste is often close to

32
the primary water sources, leading to cross-contamination of sanitation systems with drinking
water. If shallow, hand-dug wells offer a potable resource for water, they often have no wall
isolation and unprotected wellheads (Lema et al., 2014; Okello et al., 2015). These wells draw
water from the surface layers of soil rather than bedrock, and it is the permeating, polluted
runoff that feeds these wells. These types of water resources fail the quality requirements set
for potable water and cannot be considered to be a source of safe drinking water in the analysis
of access to available water. Where these shallow ground water and surface water sources are
the only accessible, available water resources improving the health and well-being of these
communities with education in the disinfecting of the water is of prime importance.
Water-borne diseases most adversely affect low-income groups and children, especially
since malnutrition is already prevalent in this sector of the population (WHO, 2011). By
increasing access to clean water, and improving sanitation and hygiene, 94% of intestinal
illnesses that kill so many people in this region of the world are preventable (WHO, 2008).
Water storage has been shown to have a significant effect on the spread of water-borne
diseases. Jerry can storage is the most economical method of storage, but has been found to
correlate with high numbers of hospitalized water users (Rodrigues et. al, 2015). Some of the
more common diseases caused by drinking dirty water and poor sanitation in Kenya include
malaria, cholera, typhoid fever, hepatitis, and schistosomiasis (bilharzia) (Young et al., 2015).
Over 23,000 Kenyans die each year from diarrheal disease. Many water-related illnesses
have been shown to Increase during the wet season (Rodrigues et. al, 2015; Pearson et. at,
2016). Spatial survey data were collected using household surveys in rural communities in
Uganda and Tanzania by Pearson et al. (2016), and in the Lake Victoria area of Kenya by
33
Rodrigues et al. (2015) to study what the effect the seasonality of the water availability has on
the socioeconomic health of a community. The questionnaires asked householders if their
source of their water changed between the wet and dry seasons. Questions enquire if the
householders recognized a difference in the quality of the water between the seasons, with or
without a change in the source due to the seasonality of the water source. Another question
asked if there was a corresponding shift in the health of the community as a result of the water
source change. The results from both research projects showed that it is the ease of access to
water that defines which water source a user chooses. Households with access to sources with
lower risks of contamination sometimes decide to use more contaminated sources if they are
easier to access (Pullan et al., 2014; Rodrigues et al., 2015; Pearson et al., 2016). Where tap
water is available, this is the first choice of source, with borehole water taking second place,
again when available. When neither of these two sources is an option, lake/pond/stream water
is the primary source of water (Rodrigues et al., 2015; Pearson et al., 2016). The awareness of
waterborne diseases being the cause of intestinal related illnesses was very high, over 95%,
(Rodrigues et al. 2015) in all the communities surveyed, and people were very aware that water
treatment and hand washing prevents water borne diseases (Mohamed et al., 2016). Both
studies found that the quality and quantity of water sources might vary due to any number and
combinations of reasons, including seasonal differences in precipitation, variations in the
maintenance of the resource, and governance associated with the resource. These same
reasons will affect access to a water resource (Pearson et al., 2016).

34
3.4.1c Infrastructure
In many places in East Africa the existing water infrastructure cannot keep up with
demand from the spiraling increase in the population numbers; and like many developing
nations, this region lacks access to the financial resources needed to develop their water supply
infrastructure (Young et al., 2015). It is not until persistent and extensive droughts, such as
occurred in the 1970s and 1980s in East Africa that the water troubles come to the attention of
the rest of the world. Such world agencies as the United Nations are then able to then step in to
help find the core issues for this lack of water, usually the result of underlining environmental
and social pressures that have arisen as a consequence of the inadequate water delivery
infrastructure of quality renewable freshwater resources. Another pressure that helps to bring
international agencies into an area is the lack of access to available drinking water and the
associated public health issues that arise from the pollution of available water. All of these
issues are endemic to this focus region of interest and thwart the socio-economic development
(Fogden, 2009; Omole and Ndambuki, 2014; WHO, 2014b; UNESCO, 2012 and 2105; GWP,
2015; Rodrigues et al., 2015; UNDESA, 2016).
3.4.1d Governance
Poor governance can lead to catastrophic water scarcities in semi-arid parts of the
world. An example being in the Yemen, where, in 2015, after ousting President Hadi, poor
water management led to the over extractions of groundwater; well drilling becoming the norm
over other collection and storage methods. The poor rural areas have been left water scarce
while what water is available is piped to the wealthy city dwellers (Whitehead, 2015; Ayana,
2016).
35
Kenya is well ahead of other countries in the region in setting a legal and policy
framework for its integrated water resources management (GWP, 2015). Kenya first enacted a
Water Act in 1952 as Chapter 372 of the Laws of Kenya. This Act has been revised several times
and defines ownership, control, and management of all freshwater sources around the country
(World Bank, 2012). The Water Act emphasizes the importance of local stakeholder
participation in planning, implementing, and decision-making in addressing key issues of
governance and social equity. Achieving such involvement in Kenya can be attributed to
applying three water resources management levels: national, basin and sub-basin/catchment
levels. The stakeholder’s participation at the sub-basin/ catchment level, and possibly the local
level, enables equitable benefit sharing regarding water sharing, so minimizing the possible risk
of conflict during dry periods (Wolf, 2007; Marson and Savin, 2015). This involvement also
allows for a feeling of shared resource ownership and cooperative management amongst the
stakeholders, which in turn helps to ensure the security and quality of that the water resource
at the basin and national levels (GWP, 2015).
In Kenya, a government agency, the Rural Development Department, has a been
charged with developing strategies, policies, and plans that ensure water is available for
sustainable food production and rural development around Kenya. By forming water users
associations at the local level the water user fees are reviewed on a regular basis, ensuring that
the charge is manageable by the householders. Of note is that the focus that these government
agencies is not on fresh water for domestic use, but on agriculturally based uses. However, by
exploring some of the agricultural programs, it becomes apparent that water for human
consumption is made more readily available to the rural communities because of these policies.

36
Also, recall that the primary water sources in these rural areas are in the form of rivers,
streams, ponds and irrigation ditches (Leiter et al., 2013).
Kenya also has a National Soil and Water Conservation Programme, which encourages
farmers to help improve water availability through soil moisture conservation by using
conservation tillage, mulching, and soil conservation. The program also encourages farmers to
become more aware of the harmful effects that agriculture can have on water quality (Chen
and Hu, 2004; Lema et al., 2014). As with all countries in this region of the world putting policies
into practice, and enforcing and monitoring the rules all present a challenge. In Kenya
budgetary constraints, as well as the fact that water resources management is not given the
same political priority as water supply and sanitation, also challenge the development of a fully-
functioning water supply system (Gleick, 2014; GWP, 2015). In the developing, semi-arid rural
setting the responsibility for the public service management of the water supplies has very
often been offloaded at the federal level to the community level, the women in particular
(Chowns, 2015). The result has not been the improvement of the technical performance or the
financial sustainability of the water supplies, in fact, this offloading of responsibility has placed
greater burdens on those communities already in need assistance (Hope, 2015). The question
of access to available water at the local level is still not specifically addressed.
3.4.1e Data Inaccuracies
Data inaccuracies also arise in country data deriving from shared water boundaries. The
transboundary flows are not proportioned to neighboring countries but are often incorporated
into more than one nation’s data set Gaupp et al. (2015).
37
An example is the Mara River, which forms 250 miles of the border between Kenya and
with Tanzania, and Lake Rudolph, which forms a section of the frontier between Kenya,
Tanzania, and Uganda. As Gaupp et al. (2015) point out, transboundary flows depend very
much on border delineation, and trying to rescale national AQUASTAT data would not make
sense. STRATA is an example of a statistical modeling program (see Chapter 3.7. for more
details of the model) that has been run using best available data sets for East Africa. The model
results show a significant decrease in the water supply across East Africa over the 2005-2015
period (Devi and Bostoen, 2009). Ninety million people proved to be water deprived, and
thirteen million people may have had access to quality water but were less likely to have
sufficient quantities of water for maintaining personal and domestic hygiene. This data result
coincided with a decade that had been declared by the UN to be the Fresh Water Decade and
emphasized the need to more realistic water availability data to be made available.
3.4.1f Role of Women
The role of women as water providers and managers is well established in water
literature. Where there are no standpipes and the water resources are scarce, it is the women
and children who are most often affected by this water scarcity, as they do most of the
domestic water collection, storage, and household distribution. This essential, daily, household
chore requires that household members walk considerable distances, and spend many hours
searching for water (Laurie, 2011; http://water.org). Forty billion hours are spent walking for
water across the African continent every year (Adams et al. 2016). It is normal for people in
rural East Africa to walk anywhere between 2-6 kilometers to collect their water supply (UN
Habitat, 2010; Leiter et al., 2013); 74% of East African women must spend an average of 8 hours

38
per day obtaining water for their families (Snyder, 2012). The cost can be excessive regarding
time; young girls are often taken out of school to take up this household chore, so adding to the
socio-economic issue of undereducated women.
The storage and distribution role the women undertake in this life-giving resource is to
the benefit to their societal respect (Falkenmark, 2013; Masanyiwa et. al, 2015; UNESCO, 2012).
However, this role can also place a huge burden on the women when water becomes scarce. In
the dry season, competition for the water will arises between the female’s focus of the
household’s health and welfare, and the male’s concentrate on the need for water for livestock.
In some areas there is a culture of preventing recent widows from sourcing water from the
community access; these issues display the intense gender politics that are associated with
water scarcity in this region of the world (Rodrigues et al., 2015). In many instances, rural
schools lack toilet facilities, which creates hardship for the females teachers and causes many
girls to leave school once puberty is reached (WHO, 2015; WHO, 2017). This lack of an
education is a guaranteed entrance into the cycle of poverty for these girls.
The UN, through the World Health Organization (WHO) and United Nations
International Children's Emergency Fund (UNICEF) for women and children, has become
involved in finding a solution to the devastating cycle of poverty that exists in so many
undeveloped and developing regions of the world as a result of water scarcity. The aim of the
UN is to improve the lives of those in need, and to “secure sustainable water for all”. In a report
of the same title released in 2014, the UN described how human well-being and economic
prosperity, as well as the preservation of sustainable water, might be achieved.

39
3.4.1g Finding New Sources of Water
Finding new sources of water is critical to meeting the UN's Sustainable Development
Goals in Africa; more than 90% of Africans still dig for their water (de Villiers, 2000).
Groundwater is a significant source of drinking water in the region. In some areas, the wells are
so deep that a chain of people has to pass the water up to ground level (de Villiers, 2000). Very
often, the quality of the water in the aquifers is threatened by a combination of over-
abstraction (quantity) and microbiological and chemical contamination (quality). A study carried
out by Wahome et al. (2014) on limited potable water sources in unplanned residential
settlements of Kenya showed that the water from the sampled boreholes drilled into the
aquifer was not suitable for human consumption due to microbiological and chemical
contamination. They also found that there was an alarming increased incidence of antibiotic
resistance among the pathogens present in that water. The study surmises that the lack of
proper waste and wastewater management in these over populated settlements was
responsible for the contamination of the aquifers. Once again, the fact that there is access to
an available water resource in the environment of interest is not a guarantee that the water is
suitable for drinking.
3.4.2 Water Quality - Case Study
Leiter et al. (2013) studied the quality of drinking water in seven rural villages in
southeastern Kenya. The water is piped from unprotected dammed streams and springs and
flows to collection points along the pipelines. The water then flows into community taps,
kiosks, and tanks in the villages, where it goes into storage containers in the homes.
Communities, within the study area, experience both water quality and quantity problems. Five
40
of the communities regularly experience water shortages. During shortages, some of the
villagers also drew their drinking water from shallow, hand-dug holes, which contained visible
suspended sediment, and when tested was high in dissolved solids and had low in dissolved
oxygen (Leiter et al., 2013). This water could have originated as rainwater, surface runoff,
shallow seepage water or ground water flow. Rock catchment rain pools were also a source of
drinking water; again this water had visible suspended solids and when tested was high in
nitrates and phosphates, indicating that the water most likely originated as runoff from nearby
fields. There was also a deep borehole in the area. The water tested from the borehole was
high in concentrations of dissolved solids. Water samples were taken from all the village
supplies and tested for nutrients, trace metals, and pathogens. All of the water samples tested,
including that from the taps, were contaminated with total coliforms, and nearly all with
Escherichia coli, from fecal contamination (WHO, 2008 and 2011; Bain, 2014). The piped sample
results indicated that the water was entering the system already contaminated, a result of open
and unprotected reservoirs. The study showed that bacterial contamination of water stored in
the home would increase when stored for long periods in the house (Le Chevallier, 2003).
Potential sources of this increased pollution include the buckets and jugs used to transport the
water to the homes. The barrels used to store the water in the homes, the utensils used to
serve the water, and unclean hands will all increase the potential for the pollution of the water
(Pickering et al., 2011; Mattioli et al., 2014 and 2015).
The study also showed that the quality of drinking water in homes where treatment was
applied was no better than in homes with no water treatment. It is possible that insufficient
chlorine was being used to disinfect the water or that the water became contaminated long

41
after cleansing. Not all of the people who felt their water was unclean treated their water,
possibly due to the high cost associated with the fuel required for boiling water or additives
such as chlorine, a flocculent, and disinfectant. For those communities without access to a
neighborhood water resource, a large part of the day is spent in the collection of this life-giving
element (Leiter et al., 2013).
3.5 CHALLENGES TO AN ACCESS METRIC
By defining the actual value of the measurement of available water to the developing,
semi-arid, rural communities as being the ability of the users to access the water resources,
sometimes an access constraint is found at the household level. This limitation can be due to
several issues, not least the socioeconomic circumstances that this demographic of the world
population face; semi-arid, rural communities are some of the poorest communities in the
world. Data further enhance the challenges; the consistency and reliability of data from
different nations are often not appropriate to use in global analyses.
3.5.1 Access: Socioeconomic and Demographic Considerations
A World Bank study carried out over a period of three years, from 1987-1990, in
selected developing regions of Brazil, Nigeria, Zimbabwe, Pakistan, and India found that there
are three explanations as to why or why not a householder is willing to use, or to pay for, an
improved and type of water supply.
The first reason is the socioeconomic and demographic characteristics of the household.
For these characteristics to be defined the education level of the family members, their
occupation(s), the size and composition of the household as well as the amount of income,
expenditures, and belongings of that family unit must all be understood. Better-educated,

42
employed, large sized family households were more willing to use, or to pay for, an improved
water supply. The second explanation for why or why not a householder will be prepared to
use, or to pay for, an improved water supply is the whether the improvement is an upgrade
when compared to the existing or traditional sources of water. Included in this explanation
must be the aspect of the financial cost and the cost regarding the time that is required to
collect water, and the quality and the reliability of the supply. The study results showed that a
household would be more willing to pay for an improved source when the quality and reliability
of the existing water source is limited. In almost all cases, people were prepared to pay far
more for the independence of a private connection than for access to a public tap. The third
explanation is the households' overall attitudes toward government policy in the water supply
sector. In many parts of the world, people feel that it is the government’s responsibility to
provide free or subsidized water; there is a sense of entitlement to government services. At the
end of the study, four broad categories of village types were discernible in which the associated
water plans ranged from the delivery of house connections at full cost to no improvement in
traditional supplies. Table 6 summarizes these village environments and the associated utilized
plans that might result in village participation from the World Bank study.
In summary, every community requires a different set of policies; policies that reflect
the needs of the community as a whole, as well those of the individual householder’s, and
consideration as to their ability to pay for the water resource.

43
Table 6: Policy consequences- possible village participation (summarized from World Bank, 1993). Village Type
Householder’s willingness to pay for access to water
Plans that would work best
Type I high willingness to pay for private connections; low willingness to pay for public taps
water service should be delivered through private metered connections or yard taps
Type II a few will pay the full costs of private connections; the majority will pay the full costs of public taps
use of public taps, with the option of private metered connection, if householders are willing to pay for the full cost of the service; Kiosk are also an option, giving the households more flexibility and control over their expenditures
Type III households are willing to pay for improved service, but cost is above their means
the service level for most households would be public taps, again with the option of a metered connection if a household can pay for it.
Type IV low willingness to pay for improved water service; should be a government responsibility
the rural water supply policy response is simply to do nothing.
3.5.2 Data: Major Challenges to Developing a Global Indicator
There are three major challenges to developing a global indicator. The chief challenge is
the data limitations, the quantity, the quality, and the scalability of the data (Gleick, 2015). Of
note is that to date the quality of the collected data sets across nations has been found to be so
variable that the analysis of trends in the data is difficult to achieve (UNEP, 2016). There is a
global lack of continuous data sets that include basic hydrologic data such as groundwater
availability, runoff, evapotranspiration and metrological data such as precipitation at the
fundamental level, and climate variation at the upper level; all so essential to the core
assessment of any water availability parameters (Ndzabandzada, 2015). The data set scale is
watersheds and countries. This scaling makes accurate local analysis impossible.
The second series of challenges to be considered are the changes in definitions and
methods of data collection over time, and inconsistent collection and definition of water-use
44
data; these inconsistencies can be at the regional, watershed, or economic sectors level, not to
mention at the global scale.
Governmental restrictions on accessing water statistics in some regions is a third
challenge to the development of global indicators. Of similar challenge are the institutional
variables such as governance, regulatory effectiveness, and management capability that may
affect the regional data collection (Alexander, 2015; Gleick, 2015; Ndzabandzada, 2015;
Padowski et al., 2015; Akamani, 2016). Some governments show an inability to quantify some
kinds of water metrics, such as the ecological water needs and recreational usage, also need to
be overcome (Gleick, 2015). Uncertainties about how, and whether, climatic change around the
world is affecting the already altering water supply in terms of demand and quality, and what
the future changes might include are also variable across nations.
Another issue that varies across nations is in the comparison of available data. Often no
consideration is given to the aerial extent, climate, and development level of the country in
question (Molden, 2007).
3.6 DATA CHALLENGES AND DATA SHARING
The indicators identified in this research as being most useful in assessing water
availability and access to that available water rely on several metrics. The measures of the
quantity of renewable water available per capita per year (Water Stress Index), the water use
per capita per day (Basic Water Requirements), the quantity of water used (Water Resource
Vulnerability Index), and the percentage change in demand (Relative Water Scarcity Index).
None of these parameters have any measure of actual access to the available water resource.
However, the Water Poverty Index requires a series of parameters for its derivation, and the
45
combination of so many aspects of a community or region’s data make this index the most
comprehensive of all those shortlisted. This index specifically address access as a series of
parameters, which include the percentage of households having a piped water supply; reports
of conflicts over water use; percentage of water carried by women; time spent in water
collection, including waiting; as well as access to sanitation as a percentage of population and
access to irrigation coverage adjusted by climate characteristics (CEH, n.d.; Perez et al., 2015).
From these last two variables an indication of the quantities of available water, which, with
additional treatment, might be usable for domestic use.
The data that measure the progress toward the UN’s development goals in developing
regions of the world are gathered by intergovernmental agencies as well as individual
government organizations and then reported at the county or regional scale (Grenken, 2010;
UNESCO, 2012; UN, 2015; FOA, 2014). The UN states that all indicators and goals are applicable
at any scale, and in any location around the world (UN, 2015). To measure progress towards
the MDG, the UN classified the world’s countries into three regions: developed regions,
developing regions and undeveloped regions (UN, 2015). Since 1990 the UN has collected
global water resource statistics from more than 100 national governments around the globe.
The UN used the 1990 dataset as the base data to calculate the MDG water and sanitation
targets (UN, 2001). The Joint Monitoring Programme (JMP) monitors and reports on the
progress made towards the water and sanitation develop goals on an annual basis (UN, 2000;
UN-Water, 2008).
Vörösmarty et al.(2010) point out that a worldwide consistency in the description,
measurement, and reporting of water supply metrics, and meaningful policies and

46
management procedures need to need investigating before making valid global comparisons of
any resource. Ideally, an access indicator should be a gauge of the ease with which an available
water resource, of sufficient quality and quantity for domestic use, is made attainable to the
user. An indicator that can be easily measured and understood by various level of water
professionals and any user, and at any scale, from the local level to the regional level.
3.7 PROPOSING THE FUNDAMENTS OF A MODIFIED ACCESS INDICATOR
It became evident from the literature that any progress that is to achieve within the
water sector about access to available water in developing nations requires a multidisciplinary
approach, especially when reviewing the quantitative and the qualitative assessments made to
the monitoring of water resources. The views and values of all the stakeholders must be
incorporated. For an access indicator to be truly representative at the local level, the series of
parameters comprising that indicator should represent the socioeconomic issues of access that
people at the local level encounter.
Before drawing up any new water indicators and policies, it is imperative for planners to
be willing to spend the time to research and fully understand the local water demands and
supplies of the region under study. The Kenyan example demonstrates that for an access
indicator to be a metric of practical use the parameters should include: locational access, a
measure of distance to the available water resource; the time that is taken to fetch water,
including waiting time at the source and waiting times; and the financial access, the actual
monetary cost per measure of the water.
Some communities do have quantities of quality water made available to them, but the
distances to those resources are often great, and thus there is a cost associated with its

47
collection (Hutton and Haller, 2004). The health and sanitary literature, imply that while access
is the most realistic indicator of water availability, it does not necessarily mean that an
accessible water source is safe to use. Other parameters that must, therefore, be included in
an updated access indicator would be microbiological and chemical quality, which includes
whether a source is improved or unimproved. Availability and reliability are particularly
significant when measuring access to surface water sources in the developing, rural, semi-arid
regions of the world (Pearson et al., 2016), and are additional parameters to include in the
updated access indicator.
Educating each householder into the identification of the underlying quality of the water
at point-of-use is essential. Combining this identification of safe water with the knowledge of
basic treatment and storage methods for that water, this will ensure that the water they access
remains in a condition suitable for drinking (Mwabi et al., 2011; Arvai and Post, 2012; Leiter,
2013). A series of basic water descriptors, such as speed of flow, temperature, clarity, odor, and
color, would go a long way to help define poor water quality. A low flow, warm, turbid, brown
water source that is shared by various animal species is one that is unsafe for domestic use.
3.8 NEW TECHNOLOGY THAT WOULD IMPROVE SPATIAL AND TEMPORAL DATA COLLECTION
Understanding the data challenges and resulting data inaccuracies require the use of
more advanced technology- the wave of future data acquisition is via the cell phone and
satellite data.

48
3.8.1 Technical Data: Remote Sensing Data
Remote sensing is a relatively new technology that can provide spatially and temporally
distributed information on surface and ground water components that are revolutionizing the
understanding of many aspects of world disasters, including diseases, flooding, and drought.
(Yang et al., 2005; Lettenmaier et al., 2015; Birtwistle, 2016; Hermance et al. 2016; McNally et
al., 2016; Tekeli and Fouli, 2016). Satellite imagery data can provide information about many
diverse physical features of the land mass contained in that imagery, for example, the
geomorphology, the soil types, the drainage patterns, and the geologic structures. The images
are used to evaluate such water resource indicators as vegetation, rainfall, evapotranspiration,
and water recharge zones (Mutiti et al., 2010; Guo et al., 2012; Stanley, 2012; Ndzabandzaba,
2015; Ruvaga, 2015). A single remotely sensed image covers a large spatial area and provides a
noninvasive and relatively economical way of carrying out the reconnaissance stage of ground
water exploration (Mutiti et al., 2010). Regional scaled maps are produced of the landscape,
and by combining remote sensing with on-ground data, the land surface features that help to
define the hydrogeology and hydrology of the area can be shown (Mutiti et al., 2010).
There are several satellites from various nations that gather remote sensing data
relating to soil moisture. Soil moisture is an essential variable in the hydrologic study of a
watershed as it has a direct impact on the flood area mapping, the water resources
management, the agricultural productivity, the ecosystem health monitoring, and drought
prediction of the watershed. The measurement of soil moisture requires a high degree of both
spatial and temporal accuracy and resolution. Each measurement technology, however, can
only partially provide the necessary high spatial and temporal resolution, full spatial coverage,

49
optimal sensing depth, and desired accuracy required to retrieve soil moisture over moderate
vegetation condition. For the region under discussion, the semi-arid regions of East Africa, the
data accuracy would be very questionable (NASA, n.a.; Piles et al., 2016). The application of
satellite imagery to soil moisture is a science that continues to advance, and within the next
decade is likely to become a more readily available measurement. Table 7 describes a few of
the more efficient technologies that are presently in use. Satellite data combined with global
resources modeling is certainly the direction forward for defining many of the intricacies of
world water availability (Zaitchik et al., 2008; Davies, 2011; Huho, 2012; Swenson, 2013; Molero
et al., 2016; Roth and Lemann, 2016).
Table 7: Summary of satellite data\ Global water resources modeling.
Technology Abbreviation Owner Spatial resolution
Accuracy Notes
Soil Climate Analysis Network
SCAN USDA 40 km (poor) good
Climate Reference Network
CRN NOAA 40 km (poor) good
Earths Observing System 3
EOS U.S. Navy > 50km
(coarse)
poor Combines Advanced Multichannel Scanning Radiometer (AMSR-E) + WinSAT
Agency’s Soil Moisture and Ocean Salinity
SMOS The European Space Agency
40 km 5cm
Airborne Microwave Observatory of Sub-canopy and Subsurface
Air MOSS NASA NASA’s Uninhabited Aerial Vehicle Synthetic Aperture Radar (UAVSAR) is being flown on a Gulfstream-III aircraft.
100meters at sub-weekly, seasonal, and annual timescales
good Capable of penetrating vegetation canopies and soil to depths down to approximately 1.2 meters

50
Table 7 (cont.)
Technology Abbreviation Owner Spatial resolution
Accuracy Notes
Soil Moisture Active Passive 7
SMAP NASA 9km fair incorporates an L-band radar (active for spatial resolution only) and L-band radiometer (passive for soil moisture resolution) observations
Gravity Recovery and Climate Experiment
GRACE NASA Very coarse poor detailed measurements of Earth's gravity field used with terrestrial observations in numerical models
In the last decade, remote sensing has also emerged as an economical tool that
complements surface geophysical techniques in groundwater exploration (Mutiti et al., 2010).
Discovering and developing new groundwater sources are often held up by the high costs of
exploration and drilling. Geophysical techniques such as surface resistivity can reduce the cost
of finding groundwater resources (Devi et al. 2001). There is a limited understanding of
groundwater resources in Kenya, which at present provides less than 10% of the national
supply (Grenken, 2010; FOA, 2016). This region of Africa could obviously benefit from the
development of some of its yet untapped groundwater resources, especially in the rural areas
(Mutiti et al., 2010). In 2013, the first large-scale survey of groundwater resources in Kenya was
conducted by UNESCO with funding from Japan. This survey took place in central Turkana
County, the impoverished, arid and semi-arid land (ASAL) in the north of Kenya. Here there are
hundreds of thousands of pastoralist communities as well as three refugee camps for South
Sudanese people. The satellite imagery defined two aquifers, the Lotikpi Basin and the Turkana
Basin (UNESCO, 2013; Ruvaga, 2015), and the hope was that water from these two aquifers

51
would provide a much need supplement to the already very scarce and well guarded existing
water supply. Test boreholes into the two aquifers found that there were significant quantities
of water. However, the saline content was seven times higher than the WHO threshold of
20mg/liter for sodium carbonate (WHO, 1996), making it unsuitable for drinking. For the
present, the cost of drilling the wells, installing and maintaining the pumping equipment to
draw the water to the surface, as well as to desalinize and the distribution of the water is not
considered to be economically feasible, and the Kenyan government has shelved plans for the
water resource development of these aquifers.
3.8.2 Models
Modeling is a useful tool to analyses available data. Modeling will become a more
precise representation of the water resources environment as data sets become more
extensive and the data becomes more reliable. Statistical modeling programs, such as STRATA,
have been run using best available data sets for East Africa by Devi and Bostoen (2009). The
models show a significant decrease in the water supply across East Africa over the 2005-2015
period, a decade declared by the UN to be the Fresh Water Decade. For the modeling, ‘access
to water’ was defined as an improved water source is less than 30 minutes collection time away
from a household. The modeled results are dependent upon the accuracy of the country data
sets, but the overall results are consistent with the actual JMP reports data for the period 2005-
2008. The models show a very apparent change in access to an improved source of water in
rural areas; where there was a 10% average reduction in the availability of quantity, the model
showed that more than 62% of the rural population had no access to a public water source.
52
More than 10% of the same population spent more than 30 minutes collecting water from
improved water sources, i.e. water source was not accessible (Devi and Bostoen, 2009).

53
CHAPTER 4: SUMMARY
Clean drinking water is essential to human survival. By defining the ability of the users to
access water, the value of an available water resource becomes apparent. To understand a
nation’s true water resource availability, the dynamics behind a community’s access to that
resource must be tied to realistic metrics; one that assesses water access at that same scale.
In the developing, semi-arid, rural regions of the world water is often a scarce
commodity, and the socioeconomics of these communities often put further pressures on any
available water, making access all the more important (Bouwer, 2000; Shiferaw et al., 2014). A
prime driver in the quantity of a nation’s water demand is the result of population growth and
increased standards of living due to rapid economic development, bringing about challenges to
significant agricultural water use. A close coordination of the agricultural demands with the
overall water management needs to be of priory in undeveloped and developing countries.
Undeveloped and developing countries have especially modest per capita incomes,
high economic vulnerability, and low levels of education. A large proportion of these
nations are in sub-Saharan Africa (UN, 2011); nations that specifically suffer from perennial
water and food shortages leading to health problems. Recall that when water is scarce the
quality of the water becomes secondary to the quantity. Human’s need for water to survive will
always outweigh the most basic of water quality standards.
The literature shows that the relationship between water quality and water quantity is a
function of many factors including: the hydrology of the area of interest; the environmental
condition of the region; the infrastructure used for conveyance of water resources; the
governance of such resources; and the overall socio-economic situation of the area being

54
studied (Davies, 2011; Rodrigues, 2015; Lui, et al., 2016). The general water literature shows
that water shortages in the area of focus are due in large part to that the lack of capital to
invest in the individual nation’s infrastructure (i.e. water treatment and distribution systems)
(UN, 2014a; Moss, 2017). The literature review showed that most of the more recent water and
health research has focused on water quality. All the while, neglecting the importance of water
adequacy with regard to access, particularly in the focus region: the developing, rural, semi-arid
parts of the world (Barbier and Hochard, 2014; UN, 2011). With the pressing issues of climate
variation scarcity of water around the world is no longer a rare phenomenon, and as
meaningful discussions of the policies and management of available water resources need to
continue to take place a genuinely representative indicator that addresses the issues of access
is required.
A series of water availability indicators have been derived from global discussions in the
water resource field and are being used to identify the needs of the general population. Key
findings demonstrate that five of these current indicators focus on the physical availability of
the water, but do not give metrics for quantity or quality, and more importantly, they do not
account for access to it. The findings also show that these indicators are based on data
collected at the country or regional macro-scales, but are often applied to the fundamental
local level, giving erroneous availability statistics. To this end, the UN created the Millennium
Development Goals (MDGs) and post-2015 the Sustainable Development Goals (SDGs), which
address the cycle of poverty. The MDG/SDG indicator is the only indicator reviewed (out of the
six commonly used indicators) that uses a representative metric for access at the scale of the
user (Sorenson et al., 2015).

55
To achieve the 100% SDG for universal and equitable access, everyone needs to do their
part: the government, the private sector, civil society and the individual. The parameters used
to derive the indicators need to: be more representative of water access conditions
experienced at the local level, use data beyond water quantity and quality, and to have metrics
that specifically describe access to water regarding cost and accessibility by the targeted
communities.
There may not be a suitable singular indicator. However, any indicator needs to be: easy
to calculate, cost effective to implement, scalable to the micro-level, based on existing data,
developed using a transparent process and, not least, must be easy to understand by all the
stakeholders. The veracity of the collected data for all indicators will be enhanced as satellite
derived data become the norm rather than the exception around the globe. The ideal system will
put information and new technologies into the hands of the people who manage and use water at the
local scale.

56
REFERENCES Akamani, Kofi. (2016). Adaptive Water Governance: Integrating the Human Dimensions into Water Resource Governance. Universities Council on Water Resources Journal of Contemporary Water Research & Education (158), 2-18
Alexander, Kelly T., Yihenew Tesfaye, Robert Dreibelbis, Bekele Abaire, Matthew C. Freeman. (2015). Governance and functionality of community water schemes in rural Ethiopia. Int. J Public Health 60:977–986 DOI 10.1007/s00038-015-0
Arvai, Joseph, and Kristianna Post. (2012). Risk Management in a Developing Country Context: Improving Decisions about Point-of-Use Water Treatment among the Rural Poor in Africa. Risk Analysis 32(1) DOI: 10.1111/j.1539-69
Ayana, Essayas K., Pietro Ceccato, Jonathan R.B. Fisher, and Ruth DeFries. (2016). Examining the relationship between environmental factors and conflict in pastoralist areas of East Africa. Science of the Total Environment 60:557–558
Bain, Robert, Ryan Cronk, Rifat Hossain, Sophie Bonjour, Kyle Onda1, Jim Wright, Hong Yang, Tom Slaymaker, Paul Hunter, Annette Prȕss-Ustȕn and Jamie Bartram. (2014). Global assessment of exposure to faecal contamination through drinking water based on a systematic review. Tropical Medicine and International Health.19 (8), 917–927 doi:10.1111/tmi.12334
Barbier, Edward B., and Jacob P. Hochard. (2014). Poverty and the Spatial Distribution of Rural Population. World Bank. Development Research Group Environment and Energy Team. Policy Research Working Paper 7101 Available from http://documents.worldbank.org/curated/en/849881468158378488/pdf/WPS7101.pdf
Birtwistle, Amy N., Melinda Laituri, Brian Bledsoe, and Jonathan M. Friedman. (2016). Using NDVI to measure precipitation in semi-arid landscapes. Journal of Arid Environments 131, 15-24.
Bordalo, Adriano A., and Joana Savva-Bordalo. (2007). The quest for safe drinking water: An example from Guinea-Bissau (West Africa). Water Research 41, 2978-2986
Bouwer, Herman. (2000). Integrated water management: emerging issues and challenges. Agricultural Water Management 45, 217-228
Brown, Amber, and Marty D. Matlock. (2011) A review of water scarcity indices and methodologies. White paper 106:19. Sustainability Consortium. Scottsdale, AZ. Available on-line: http://oamk.fi/~mohameda/materiaali16/Water%20and%20environmental%20management%

57
202015/2011_Brown_Matlock_Water-Availability-Assessment-Indices-and-Methodologies-Lit-Review.pdf
Carter, Richard C, and Alison Parker. (2009). Climate change, population trends and groundwater in Africa. Hydrological Sciences Journal 54(4) 676-689, DOI: 10.1623/ hysj.54.4.676 Available from: http://www.tandfonline.com/doi/abs/10.1623/hysj.54.4.676
Center for Ecology & Hydrology (CEH). (n.d.). Water Poverty & Management. Using the Water Poverty Index to Monitor Progress in the Water Sector. Wallingford, UK. Available from: http://portals.wi.wur.nl/files/docs/ppme/Water_poverty_index.pdf
Chen, Xi, and Qi Hu. (2004). Groundwater influences on soil moisture and surface evaporation. Journal Of Hydrology 297(1–4), 285–300
Chowns, Elllie. (2015). Is Community Management an Efficient and Effective Model of Public service Delivery? Lessons from the Rural Water Supply Sector in Malawi. Public Admin. Dev. 35, 263-276
Clanet, Jean-Charles and Andrew Ogilvie. (2009). Farmer-herder conflicts and water governance in a semi-arid region of Africa. Water International, 34(1), 30-46. DOI: 10.1080/02508060802677853
Davies, Evan G. R., and Slobodan P. Simonov. (2011). Global water resources modeling with an integrated model of the social-economic environmental system. Advance in Water Resources 34(6), 684-700
de Villiers, Marq.(2000). Water: The Fate of Our Most Precious Resource. New York, NY: Mariner Books
Dobrowsky, P. H., D. Mannel, M. De Kwaadsteniet, H. Prozesk, W. Khan and T.E. Cloete. (2014). Quality assessment and primary uses of harvested rainwater in Kleinmond, South Africa. Water SA, 40(3). On-line version ISSN 1816-7950 Print version ISSN 0378-4738 http://dx.doi.org/10.4314/wsa.v40i3.2
Dὅll, Petra, Frank Kaspar, and Bernhard Lehne. (2003). A global hydrological model for deriving water availability indicators: model tuning and validation. Journal of Hydrology 270,105–134
Dὅll, Petra. (2009). Vulnerability to the impact of climate change on renewable groundwater resources: a global-scale assessment. Environ. Res. Lett. 4 DOI:10.1088/1748-9326/4/3/035006
Earth System Science Data. (http://www.earth-system-science-data.net).

58
Falkenmark, M., J. Lundquist, and C. Widstrand. (1989). Macro-scale water scarcity requires micro-scale approaches: aspects of vulnerability in semi-arid development. Natural Resources Forum 13, 258–267
Falkenmark, M., A. Berntell, A. Jägerskog, J. Lundqvist, M. Matz, and H. Tropp H. (2007) On the verge of a new water scarcity: a call for good governance and human ingenuity. Stockholm: Stockholm International Water Institute (SIWI).SIWI Policy Brief.
Falkenmark, M., J. Rockström, and L. Karlberg. (2009a). Present and future water requirements for feeding humanity. Food Sec.1:59–69 DOI 10.1007/s12571-008-0003-x
Falkenmark, Malin, Charlotte de Fraiture, and Margaret J. Vick. (2009b). Global change in four semi-arid transnational river basins: Analysis of institutional water sharing preparedness. Natural Resources Forum 33, 310–319
Falkenmark, Malin. (2013). Adapting to climate change: towards societal water security in dry-climate countries. International Journal of Water Resources Development, 29(2), 123-136, DOI: 10.1080/07900627.2012.721714
Fink, Arlene. (2009). Conducting Research Literature Reviews- From the Internet to Paper. 3rd Edition. Los Angeles, CA: Sage
Fogden, Josephine. (2009). Access to Safe Drinking Water and Its Impact on Global Economic Growth. HaloSource, Inc. Bothell, WA. Available from: https://faculty.washington.edu/categ/healthanddevgbf/wordpress/wp-content/uploads/2010/03/Access-to-Safe-Drinking-Water.pdf
Food and Agriculture Organization (FOA) of the United Nations. (2013). AQUASTATS. http://www.fao.org/nr/water/aquastat/main/index.stm
Grenken, Karen. (2010). AQUASTATS FAO’s global information system on water and agriculture Products, Indicators, Challenges. Water Country Briefs Project- Diagnostic Workshop, Geneva 9-10 December 2010. http://slideplayer.com/slide/4730307/
Gaupp, Franziska, Jim Hall, and Simon Dadson. (2015). The role of storage capacity in coping with intra- and inter-annual water variability in large river basins. Environ.Res.Lett.10 doi:10.1088/1748-9326/10/12/125001
Gerba, C.P., and Bitton, Gabriel (Eds). (1984). Microbial pollutants—their survival and transport pattern to groundwater. Groundwater pollution microbiology: New York, NY: John Wiley and Sons
Gleick, Peter H. (Ed.). (1993). Water in Crisis A Guide to the World’s Fresh Water Resources. Oxford University Press, New York.

59
Gleick, Peter H. (1996). Basic Water Requirements for Human Activities: Meeting Basic Needs. Water International 21, 83-92.
Gleick, Peter H. (2003). Global Freshwater Resources: Soft-Path Solutions for the 21st Century. Science 302 (5650):1524-8
Gleick, Peter H. Ed. (2014). The World Water Report Vol 8. Chapter 1. Global Water Governance in the Twenty-First Century. Island Press. CA.
Gleick, Peter H. (2015). On methods for assessing water-resource risks and vulnerabilities. Environ.Res.Lett.10 DOI:10.1088/1748-9326/10/11/111003
Gleick, Peter H. (2016). “Last Call at the Oasis: Peter Gleick Talks about Access to Water” https://www.youtube.com/watch?v=C5kvAgTscNk
Gleick, Peter H. (2016). EWR opinion: On Methods for Assessing Water–Resources Risks and Vulnerabilities. Pacific Institute: Insights. Available from: http://iopscience.iop.org/article/10.1088/1748-9326/10/11/111003
Global Water Partnership Technical Focus Paper (GWP). (2015). Intergrated water Resources management in Eastern Africa: Coping with ‘complex’ hydrology. Elanders: Sweden. Available from: https://www.researchgate.net/publication/287901832_Integrated_Water_Resource_Management_in_Eastern_Africa_Coping_with_'complex'_hydrology
Greywater Action For a Sustainable Water Culture. “About Greywater Reuse”. https://greywateraction.org/contentabout-greywater-reuse/
Guo, Huadong, Jianbo Liu, An Li, and Jianguo Zhang. (2012). Earth observation satellite data receiving, processing system and data sharing. International Journal of Digital Earth, 5(3), 241-250
Hermance, John F., Hussein M. Sulieman and Abdel G. Mustafa. (2016). Predicting intra-seasonal fluctuations of NDVI phenology from daily rainfall in the East Sahel: a simple linear reservoir model, International Journal of Remote Sensing. 37:14, 3293-3321, DOI: 10.1080/01431161.2016.1196841
Hrdinka, Tomáš, Oldřich Novický , Eduard Hanslík and Mark Rieder. (2012). Possible impacts of floods and droughts on water quality. Journal of Hydro-environment Research, 6 (2) 145-150. https://doi.org/10.1016/j.jher.2012.01.008
Holm, Rochelle, Wales Singini, and Simeon Gwayi. (2016). Comparative evaluation of the cost of water in northern Malawi: from rural water wells to science education. Applied Economics, 48:47, 4573-4583, DOI: 10.1080/00036846.2016.1161719
60
Houborg, R., M. Rodell, B. Li, Reichle, and B. Zaitchik. (2012). Drought indicators based on model assimilated GRACE terrestrial water storage observations, Wat. Resour. Res.48 doi:10.1029/2011WR011291
Huho, J. M. (2012). Conflict resolution among pastoral communities in West Pokot County, Kenya: a missing link. Academic Research International, 3 (3), 458-468
Hutton G., and Haller L. (2004). Evaluation of the Costs and Benefits of Water and Sanitation Improvements at the Global Level. Geneva, Switzerland: Water, Sanitation and Health Protection of the Human Environment, World Health Organization (WHO)
Institute Water for Africa. (2016). Water Consumption in Africa. https://www.water-for-africa.org/en/water-consumption.html
Jägerskog, A. and T. Jønch Clausen, eds., (2012). Feeding a Thirsty World: Challenges and Opportunities for a Water and Food Secure World. Stockholm International Water Institute SIWS Report 31. Stockholm, Sweden. http://www.droughtmanagement.info/literature/SIWI_feeding_a_thirsty_world_2012.pdf
Joshua, Miriam K., Cosmo Ngongondo, Fellistus Chipungu, Maurice Monjerezi, Emma Liwenga, Amos Majule, Tanya Stathers and Richard Lamboll. (2016). Climate change in semi-arid Malawi: Perceptions, adaptation strategies and water governance. Jàmbá: Journal of Disaster Risk Studies; Vol 8, No 3 (2016). doi: 10.4102/jamba.v8i3.255
Kenya Population. (2016, August 06). Retrieved May 1st, 2017, from http://worldpopulationreview.com/countries/kenya-population/
Kenyan Government (1972). Kenya Law Chapter 372 Water Act. Kenya Government Printer, Nairobi http://kenyalaw.org/kl/fileadmin/pdfdownloads/RepealedStatutes/WaterActCap372.PDF
Kiulia, N. M., J. Mans, J. M. Mwenda and M. B. Taylor. (2014). Norovirus GII.17 Predominates in Selected Surface Water Sources in Kenya. Food Environ Virol 6:221–231 DOI 10.1007/s12560-014-9160-6
Koshida, Grace, Stewart Cohen, Linda Mortch. (2105) Climate and water availability indicators in Canada: Challenges and a way forward. Part I- Indicators. Canadian Water Resources Journal, 40(2) 135-145
Kumar, Supriya. (2013) The Looming Threat of Water Scarcity. Vital Signs Global Trends that Shape Our Future. WorldWatch Institute. http://vitalsigns.worldwatch.org/vs-trend/looming-threat-water-scarcity
Kummu, Matti, Philip J Ward, Hans de Moel and Olli Varis. (2010). Is physical water scarcity a new phenomenon? Global assessment of water shortage over the last two millennia. Environ. Res. Lett. 5 (2010)034006 doi:10.1088/1748-9326/5/3/034006

61
Le Chevallier, M.W. (2003). Conditions favouring coliform and HPC bacterial growth in drinking water and on water contact surfaces. Chapter 10. World Health Organization (WHO). Heterotrophic Plate Counts and Drinking-water Safety. Edited by J. Bartram, J. Cotruvo, M. Exner, C. Fricker, A. Glasmacher. London, UK: IWA Publishing. ISBN: 1 84339 025 6.
Leiter, Maria, Jonathan Levy, Samuel Mutiti, Mark Boardman, Alicia Wojnar, and Harley Deka. (2013). Drinking water quality in the Mount Kasigau region of Kenya: a source to point-of-use assessment. Environ Earth Sci. 68:1–12 DOI 10.1007/s12665-012-1698-8
Lema, Emmy, Revocatus Machunda, and Karoli Nicholas Njau. (2014). Agrochemicals use in horticulture industry in Tanzania and their potential impact to water resources. Int. J. Biol. Chem. Sci. 8(2): 831-842. ISSN 1997-342X (Online), ISSN 1991-8631 (Print) Available online at http://ajol.info/index.php/ijbcs
Lettenmaier, D.P., D. Alsdorf, J. Dozier, G.J. Huffman, M. Pan, and E.F. Wood. (2015). In roads of remote sensing into hydrologic science during the WRR era, Water Resour. Res. 51, 7309–7342, DOI: 10.1002/2015WR017616.
LifeStraw. https://lifestraw.eartheasy.com/?gclid=CJe_8LfDjNUCFUW2wAod-PMPHg
Liu, Junguo, Qingying Liu, and Hong Yang. (2016). Assessing water scarcity by simultaneously considering environmental flow requirements, water quantity, and water quality. Ecological Indicators 60 434–441
Lule, J. R., J. Mermin, J.P. Ekwaru, S. Malamba, R. Downing, R. Ransom, R. Quick.(2005). Effect of home-based water chlorination and safe storage on diarrhea among persons with human immunodeficiency virus in Uganda. American Journal of Tropical Medicine and Hygiene, 73(5), 926-933.
Marson, Marta, and Ivan Savin. (2015). Ensuring Sustainable Access to Drinking Water in Sub Saharan Africa: Conflict between Financial and Social Objectives. World Development 76, 26–39 http://www.sciencedirect.com/science/article/pii/S0305750X15001448
Mattioli M.C., A.B. Boehm, J. Davis, A.R. Harris, M. Mrisho. (2014). Enteric Pathogens in Stored Drinking Water and on Caregiver’s Hands in Tanzanian Households with and without Reported Cases of Child Diarrhea. PLoS ONE 9(1): e84939. doi:10.1371/journal.pone.0084939
Masanyiwa, Zacharia S., Anke Niehof and Catrien J.A.M. Termeer. (2015). Users’ perspectives on decentralized rural water services in Tanzania. Gender, Place and Culture. Vol 22 (7) 920-936 http://dx.doi.org/10.1080/0966369X.2014.917283
Mattioli, Mia Catharine M., Jennifer Davis, Mwifadhi Mrisho, and Alexandria B. Boeh. (2015). Quantification of Human Norovirus GII on Hands of Mothers with Children under the Age of

62
Five Years in Bagamoyo, Tanzania. Am. J. Trop. Med. Hyg., 93(3), 478–484 doi:10.4269/ajtmh.14-0778
McNally, Amy, Kristi Arsenault, Sujay Kumar, Shraddhanand Shukla, Pete Peterson, Shugong Wang, Chris Funk, Christa D. Peters-Lidard, and James P. Verdin. (2017). A land data assimilation system for sub-Saharan Africa food and water security applications. Scientific data 4, 170012 doi:10.1038/sdata.2017.12
Medema, G.J., P. Payment, A. Dufour, W. Robertson,. M. Waite, P. Hunter, R. Kirby and Y. Anderson. (2003). For World Health Organization (WHO) & Organization for Economic Co-operation & Development OECD). Guidelines for Drinking Water Quality. Chapter 1, 3rd Edition. Safe drinking Water: An Ongoing Challenge. IWA Publishing. London, UK. 2003. Available from: http://www.who.int/water_sanitation_health/dwq/9241546301_chap1.pdf
Mohamed, Hussein, Thomas Clasen, Robert Mussa Njee, Hamisi M. Maleb, Stephen Mbuligwe, and Joe Brown. (2016). Microbiological effectiveness of household water treatment technologies under field use conditions in rural Tanzania. Tropical Medicine and International Health. 21(1), 33–40
Molden, David. (Ed.). (2007). Report: Water for Food, Water for Life: A Comprehensive Assessment of Water Management in Agriculture. UK: Earthscan.
Molero, B., O. Merlin, Y. Malbéteau, A. Al Bitar, F. Cabot, V. Stefan, Y. Kerr, S. Bacon, M.H. Cosh, R. Bindlish, and T.J. Jackson. (2016). SMOS disaggregated soil moisture product at 1km resolution: Processor overview and first validation results. Remote Sensing of Environment 180, 361–376
Montello, Daniel R., Paul C. Sutton. (2013). An Introduction to Scientific Research Methods in Geography & Environmental Studies. 2nd Edition London, UK: Sage Publications.
Moore, B. C., A. M. Coleman, M.S. Wigmosta, R.L. Skaggs and E.R. Venteris. (2015). A high spatiotemporal assessment of consumptive water use and water scarcity in the conterminous United States. Water Resour. Manage 29(14); 5185-5200. doi:10.1007/s11269-015-1112-x
Moss, Jack. (2017).Water and the economic crisis. Back to basics. OECD Observer. The Organisation for Economic Co-operation and Development. Available from: http://oecdobserver.org/news/fullstory.php/aid/2845/Water_and_the_economic_crisis.html
Mutiti, Samuel, Jonathane Levy, Christine Mutiti, and Ndung'u Gaturu. (2010). Assessing Ground Water Development Potential Using Landsat Imagery. Ground Water 48(2), 295–305
Mwabi, J. K., F.E. Adeyemo, T.O. Mahlangu, B.B. Mamba, B.M. Brouckaert, C.D. Swartz, and L. Mpenyana Monyatsi. (2011). Household water treatment systems: A solution to the production of safe drinking water by the low-income communities of Southern Africa. Physics and Chemistry of the Earth, 36(14-15), 1120-1128.

63
NASA Jet Propulsion Laboratory- California Institute of Technology (CalTech) Soil Moisture Active Passive (SMAP) https://smap.jpl.nasa.gov/.
Ndzabandzaba, Coli. (2105). Data sharing for sustainable development in less developed and developing countries. Brief for GSDR 2015 Institute for Water Research, Rhodes University, South Africa. Available from: Sustainable Development.un.org
Ntouda, Julien, Fondo Sikodf, Mohamadou Ibrahim, and Ibrahim Abbas. (2012). Access to drinking water and health of populations in Sub-Saharan Africa. C.R. Biologies 336, 305–309.
Omole, David O., and Julius M. Ndambuki. (2014). Sustainable Living in Africa: Case of Water, Sanitation, Air Pollution and Energy. Sustainability 6, 5187-5202; doi: 10.3390/su6085187
Opare, Service. (2012). Rainwater harvesting: an option for sustainable rural water supply in Ghana. GeoJournal 77:695–705 DOI 10.1007/s10708-011-9418-6
O’Reilly, Kathleen, Richa Dhanju, Abhineety Goel. (2017). Exploring ‘‘The Remote” and ‘‘The Rural”: Open Defecation and Latrine Use in Uttarakhand, India. World Development Vol. 93, pp. 193–205. Available from: https://doi-org.proxy2.library.illinois.edu/10.1016/j.worlddev.2016.12.022
Padowski, Julie C., Steven M. Gorelick, Barton H. Thompson, Scott Rozelle, and Scott Fendorf. (2015). Assessment of human–natural system characteristics influencing global fresh water supply vulnerability. Environ.Res.Lett.10 104014 doi:10.1088/1748-9326/10/10/104014
Pearson, Amber L., Adam Zwickle, Judith Namanya, Amanda Rzotkiewicz, and Emiliana Mwita. (2016.)Seasonal Shifts in Primary Water Source Type: A Comparison of Largely Pastoral Communities in Uganda and Tanzania. Int. J. Environ. Res. Public Health 13, 169; doi: 10.3390/ijerph13020169. Available from: www.mdpi.com/journal/ijerph
Perez, C., E.M. Jones, P. Kristjanson, L. Cramer, P.K. Thornton, W. Forch, C. Barahon. (2015). How resilient are farming households and communities to a changing climate in Africa? A gender-based perspective. Global Environmental Change 34, 95–107
Pickering, Amy J., Timothy R. Juliean, Simon Mamuya, Alexandria B. Boehm, and Jennifer Davis. (2011). Bacterial hand contamination among Tanzanian mothers varies temporally and following household activities. Tropical Medicine and International Health 16(2), 233–239
Pielou, E.C. (1998). Fresh Water. University of Chicago Press: USA
Piles, Maria, George P. Petropoulos, Nilda Sánchez, Ángel González-Zamora, and Gareth Ireland. (2016). Towards improved spatio-temporal resolution soil moisture retrievals from the synergy of SMOS and MSG SEVIRI space borne observations. Remote Sensing of Environment 180, 403–417

64
Postel, Sandra. (1997). Last Oasis Facing Water Scarcity. London, UK and New York. NY: W.W. Norton & Company
Postel, Sandra, and Brian Richter. (2003). Rivers for Life Managing Water for People and Nature. Washington: Island Press.
Pullan, R.L., M.C. Freeman, P.W. Gething, S.J. Brooker. (2014). Geographical Inequalitites in Use of Improved Drinking Water Supply and Sanitization Across Sub-Saharan Africa: Mapping and Spatial Analysis of Cross-sectional Survey Data. PLoS Med 11(4): e1001626. Doi:10.1371/journal.pmed.1001626
Radcliff, Richard. (2003). Assessing what constitutes quality water versus contaminated drinking water: International Drinking Water Regulations. The Developed World Sets the Standard. National Drinking Water Clearinghouse, West Virginia, Morgantown, WV. Available from: http://www.nesc.wvu.edu/ndwc/articles/ot/sp03/inter_dwregs.htm l
Raditloaeng. W.N., (2012).Socio-economic factors in rural water scarcity: a case study of Molepolole village in Botswana. American Journal of Human Ecology. 1(3) 95-101.
Reddy, V. Ratna, and M. S. Rathore (1993). Bias in Social Consumption: Case of Residential Water in Rajastha. Economic and Political Weekly 28(32/33); 1645-1648 Available from: http://www.jstor.org/stable/4400020
Quin, Andrew, Berit Balfors, and Marianne Kjellén. (2011). How to “walk the talk”: The perspectives of sector staff on implementation of the rural water supply programme in Uganda. Natural Resources Forum 35 269-282
Rijsberman, Frank R. (2006). Water scarcity: Fact or Fiction? Agricultural Water Management 80, 5-22.
Rockström, J., M. Falkenmark, T. Allan, C. Folke, L. Gordon, A. Jägerskog, M. Kummu, M. Lannerstad, M. Meybeck, D. Molden, S. Postel, H.H.G. Savenije, U. Svedin, A. Turton, and O. Varis. (2014). The unfolding water drama in the Anthropocene: towards a resilience-based perspective on water for global sustainability. Ecohydrol. 7, 1249–1261 Published online in Wiley Online Library (wileyonlinelibrary.com) DOI: 10.1002/eco.1562
Rodrigues, Anthony Joachim, Wandiga Shem Oyoo, Francis O. Odundo, and Enos W. Wambu. (2015). Socio-economic factors influencing the spread of drinking water diseases in rural Africa: case study of Bondo sub-county, Kenya. Journal of Water and Health 13(2), 500-509
Roth, Vincent, and Tatenda Lemann. (2016). Comparing CFSR and conventional weather data for discharge and soil loss modelling with SWAT in small catchments in the Ethiopian Highlands. Hydrol. Earth Syst. Sci., 20, 921–934, www.hydrol-earth-syst-sci.net/20/921/2016/ doi:10.5194/hess-20-921-2016

65
Ruvaga, Lenny. (2015). “Tests Show Kenya’s Turkana Water Unfit for Consumption” VOA News March 10, 2015. http://www.voanews.com/a/kenya-turkana-water-unfit-for-human-consumption/2674350.html
Snyder, Shannyn. (2012) Water in Crisis-Kenya. Available from: https://thewaterproject.org/water-crisis/water-in-crisis-kenya.
Sheppard-Worlock Library. (2012) Doing a literature search: a step by step guide. Liverpool, UK. Liverpool University. Available from www.hope.ac.uk/media/liverpoolhope/contentassets/documents/library/help/media,1256,en.pdf
Shiferaw, Bekele, Kindie Tesfaye, Menale Kassie, Tsedeke Abate, B.M. Prasanna and Abebe Menkir (2014). Managing vulnerability to drought and enhancing livelihood resilience in sub-Saharan Africa: Technological, institutional and policy options. Weather and Climate Extremes 3 67–79
Shiklomanov, Igor A. (1998). World Water Resources. A New Appraisal and Assessment for the 21ST Century. UNESCO: Paris. Available from: http://www.ce.utexas.edu/prof/mckinney/ce385d/Papers/Shiklomanov.pdf
Solomon, Steven. (2010). Water: The Epic Struggle for Wealth, Power, and Civilization. New York, NY: Harper Perennial
Sorenson, Susan B., Christiaan Morssink, and Paola Abril Campos. (2011). Safe Access to safe water in low income countries: Water fetching in current times. Short Report. Social Science & Medicine 72 1522-1526
Stanley, William R. (2012). A common universe—questionable responses to tropical rainfall and aridity in Africa and Asia. Environmentalist 32:339–345 DOI 10.1007/s10669-012-9397-2.
Sullivan, C.A. J.R. Meigh, and A.M. Giacomello. (2003). The water poverty index: development and application at the community scale. Nat. Resour. Forum 27, 189–199
Sullivan, C.A. (2002). Calculating a Water Poverty Index. World Development 30(7) 1195-1210
Swenson, Sean, and the National Center for Atmospheric Research Staff (Eds.). “The Climate Data Guide: GRACE: Gravity Recovery and Climate Experiment: Surface mass, total water storage, and derived variables”. (2013). Available from https://climatedataguide.ucar.edu/climate-data/grace-gravity-recovery-and-climate-experiment-surface-mass-total-water-storage-and.
Tekeli, Ahmet Emre, and Hesham Fouli. (2016). Evaluation ot TRMM satellite-based precipitation indexes for flood forecasting over Riyadh City, Saudia Arabia. Journal of Hydrology 541 Pt A, 471-479

66
Torraco, Richard J. (2005). Writing Integrative Literature Reviews: Guidelines and Examples. Human Resources Development Review 4(356). Available on-line
TheWorldCounts. (2017) “Water, water everywhere…but not a drop to drink”. Available from: http://www.theworldcounts.com/stories/average-daily-water-usage
United Nations (UN). (1992). UN conference on environment and development (the Earth Summit), Rio de Janeiro. Available from: http://www.un.org/geninfo/bp/enviro.html
United Nations. (2015). World Water Assessment Programme (WWAP). The United Nations World Water Development Report 2015: Water for a Sustainable World. Paris, UNESCO. Switzerland.
United Nations Educational Scientific and Cultural Organization (UNESCO). (2012). Managing Water under Uncertainty and Risk: The United Nations Water Development Report 4 (WWDR4). Vol 1. Paris: UNESCO available from: http://www.unesco.org/new/en/natural-sciences/environment/water/wwap/wwdr/wwdr4-2012/
United Nations Education, Scientific and Cultural Organization (UNESCO). (2015). United Nations-World Water Report 2015 (WWRD 2105). Water for a sustainable World. UNESCO, Paris. Available from: http://unesdoc.unesco.org/images/0023/002318/231823E.pdf
United Nations-Water. (2008). Joint Monitoring Programme, MDG Assessment Report 2008. Available from: http://www.unwater.org/publication_categories/whounicef-joint-monitoring-programme-for-water-supply-and-sanitation-jmp/.
United Nations-Water. (2016). The United Nations World Water Development Report: Water for a Sustainable World. United Nations Educational Scientific and Cultural Organization (UNESCO), Paris, France.
United Nations World Water Assessment Programme (WWAP). (2006). Case Study: Kenya. Kenya National Water Development Report. Water A Shared Responsibility. Available from: unesdoc.unesco.org/images/0014/001488/148866e.pdf
United Nations. (2010). UN-Water Task Force on Indicators, Monitoring and Reporting. Available from: www.unesco.org/new/fileadmin/MULTIMEDIA/HQ/SC/pdf/wwap_UNTF-IMR_Final_report_for_reporting_to_UNWater.pdf
United Nations Department of Economic and Social Affairs (UNDESA). (2015). “World Population projected to reach 9.7 billion by 2050”.
United Nations Department of Economic and Social Affairs (UNDESA). (2014). International Decade for Action ‘Water for Life’ 2005-2015. Available from http://www.un.org/waterforlifedecade/quality.shtml.
67
United Nations Department of Economic and Social Affairs (UN-DESA). (2012). World Population Prospects The 2012 Revision._Volume-I_Comprehensive-Tables.pdf. Available from: https://esa.un.org/unpd/wpp/publications/Files/WPP2012_Volume-I_Comprehensive-Tables.pdf.
United Nations Educational Scientific and Cultural Organization (UNESCO) (2000). Global Water Supply and Sanitation Assessment 2000 Report. New York: World Health Organization and United Nations Children's Fund. Available from: http://www.who.int/water_sanitation_health/monitoring/jmp2000.pdf
United Nations Educational Scientific and Cultural Organization (UNESCO). World Water Assessment Program (WWAP). (2003). Water for people, water for life: A joint report by the twenty three UN agencies concerned with freshwater. New York: UNESCO Pub. Available from: http://unesdoc.unesco.org/images/0012/001297/129726e.pdf
United Nations Educational Scientific and Cultural Organization (UNESCO). (2006). Kenya National Water Development Report 2005. 2nd UN World Water Development Report. ‘Water: A shared responsibility.’ UN-WATER/WWAP/2006/12. Available from: http://unesdoc.unesco.org/images/0014/001488/148866E.pdf
United Nations Educational Scientific and Cultural Organization. (UNESCO). World Water Assessment Program (WWAP). (2013a). UN-Water Task Force on Indicators, Monitoring and Reporting- Final Report Monitoring progress in the water sector: A selected set of indicators. New York: UNESCO Pub. Available from: http://www.unesco.org/new/en/natural-sciences/environment/water/wwap/indicators-as-boxes-under-wwdr/un-water-tf-on-imr/key-indicators-set/
United Nations Educational Scientific and Cultural Organization. (UNESCO).World Water Assessment Program (WWAP). (2013b).Set of key indicators. Available from: http://www.unesco.org/new/en/natural-sciences/environment/water/wwap/indicators-as-boxes-under-wwdr/un-water-tf-on-imr/
United Nations Educational Scientific and Cultural Organization (UNESCO). (2015). Kenya Groundwater Mapping Programme Available from: www.unesco.org/fileadmin/MULTIMEDIA/FIELD/Nairobi/pdf/UNESCOBrochureNov2015.pdf.
United Nations Habitat. (2010). The Right To Water Fact Sheet No. 35 United Nations: Geneva. Available from: http://www.ohchr.org/Documents/Publications/FactSheet35en.pdf
United Nations Population Division. (2011). World Population Prospects: The 2010 Revision Volume 1: Comprehensive Tables. Available from: www.un.org/en/development/desa/population/publications/pdf/trends/WPP2010/United

68
United Nation. (2014) Water and Cities- International Decade for Action ‘Water for Life’ 2005-2015. Available from: http://www.un.org/waterforlifedecade/water_cities.shtml
United Nations. (2016). MDG Metadata for Goal 6. Available from: https://unstats.un.org/sdgs/files/metadata-compilation/Metadata-Goal-6.pdf.
United Nations Sustainable Development Goals. Available from: https://sustainabledevelopment.un.org/?menu=1300.
United Nations Environment Programme- GEMS Water. https://www.unep.org/gemswater/
United Nations Water. (2014). A Post-2015 Global Goal for Water: Synthesis of Key Findings and Recommendations from UN-Water. Securing Sustainable Water for All. Available from: http://www.un.org/waterforlifedecade/pdf/27_01_2014_un-water_paper_on_a_post2015_global_goal_for_water.pdf
United Nations. (2001). Indicators for sustainable development, framework and methodologies background paper no 3. New York: Department of Economic and Social Affairs. Available from: http://www.un.org/esa/sustdev/csd/csd9_indi_bp3.pdf
Vörösmarty, Charles J., Ellen M. Douglas, Pamela A. Green, and Carmen Revenga. (2005). Geospatial Indicators of Emerging Water Stress: An Application to Africa. Royal Swedish Academy of Sciences. Ambio 34(3), 230- 236
Vörösmarty, C.J., P.B. McIntyre, M.O. Gessner, D. Dudgeon, A. Prusevich, P. Green, S. Glidden, S.E. Bunn, C.A. Sullivan, C.R. Liermann, and P.M. Davies. (2010). Global threats to human water security and river biodiversity. Nature 467
Wada, Yoshihide, Ludovicus P. H. van Beek, Niko Wanders, and Marc F.P. Bierkens. (2013). Human water consumption intensifies hydrological drought worldwide. Environ. Res. Lett. 8 http://iopscience.iop.org/article/10.1088/1748-9326/8/3/034036/pdf
Wahome, Caroline Nyawira, Paul Owuor Okemo, and Anthony Kebira Nyamache. (2014). Microbial quality and antibiotic resistant bacterial pathogens isolated from groundwater used by residents of Ongata Rongai, Kajiado North County, Kenya. Int. J. Biol. Chem. Sci. 8(1): 134-143 ISSN 1997-342X (Online), ISSN 1991-8631 (Print). DOI: http://dx.doi.org/10.4314/ijbcs.v8i1.13
Whitehead, Frederika. (2 April, 2015). Water scarcity in Yemen: the country's forgotten conflict, the Guardian. theguardian.com/global-development-professionals-network/2015/apr/02/water-scarcity-yemen-conflict
Wolf, Aaron T. (2007). Shared Waters: Conflict and Cooperation. Annu. Rev. Environ. Resour.32 241–69
69
World Bank. (1993).The Demand for Water in Rural Areas: Determinants and Policy Implications. The World Bank Water Demand Research Team. The World Bank Research Observer, 8(1) 47-70
World Bank. (2006). Regional Fact Sheet from the World Development Indicator 2006-Sub-Sahran Africa. Washington: World Bank.
World Bank. (2012). Laws of Kenya. Water Act Chapter 372. Available from: https://ppp.worldbank.org/public-private-partnership/library/kenya-water-act-2002
World Health Organization (WHO). (1996). Guidelines for Drinking-Water Quality-Second Edition-Volume 2-Health Criteria and Other Supporting Information. International Programme on Chemical Safety. Geneva. Available from: http://www.who.int/water_sanitation_health/dwq/2edvol2p1.pdf
World Health Organization. (2008). Poor sanitation threatens public health. http://www.who.int/mediacentre/news/releases/2008/pr08/en/
World Health Organization (2011). Guidelines for Drinking-water Quality 4th Ed. World Health Organization, Geneva.
World Health Organization (WHO). (2014a). WHO/UNICEF highlight need to further reduce gaps in access to improved drinking water and sanitation. Inequalities in access to improved drinking water and sanitation facilities still persist around the world. Note for media. Geneva. http://www.who.int/mediacentre/news/notes/2014/jmp-report/en/
World Health Organization (WHO). (2014b). Progress on drinking water and sanitation. Joint Monitoring Programme Update 2014. WHO and UNICEF. New York/Geneva. ISBN: 978 92 4 150724 0. Available from: http://www.who.int/water_sanitation_health/publications/2014/jmp-report/en/
World Health Organization (WHO). (2015). Millennium Development Goals (MDGs) Fact Sheet No. 290. Available from: http://www.who.int/mediacentre/factsheets/fs290/en/
World Health Organization (WHO) Sustainable Development Knowledge Platform. (2016). Sustainable Development Goal 6. Available from: https://sustainabledevelopment.un.org/sdg6
World Health Organization (WHO). (2017). Drinking-water. Fact sheet. Available from: http://www.who.int/mediacentre/factsheets/fs391/en/.
World Health Organization-UNICEF (2015) Kenya Water Supply Statistics- knoema. Available from: https://knoema.com/WHOWSS2014/who-unicef-water-supply-statistics-2015?location=1001930-kenya
70
World Resource Institute (WRI). (2017). AQUADUCT. Washington D.C. Available from: http://www.wri.org/our-work/project/aqueduct Worthington, E. Barton. (1977). United Nations Water Conference, held at Mar del Plata, Argentina, 14-25 March 1977. Environmental Conservation Volume 4 (2) 152-154. DOI: https://doi.org/10.1017/S0376892900025522 Yang, G.J., Vounatsou, P., Zhou, X.N., Jürg Utzinger, and Marcel Tanner. (2005). A review of geographic information system and remote sensing with applications to the epidemiology and control of schistosomiasis in China. ACTA TROPICA 96 (2-3) 117-129
Young, Kyana, Joan B. Rose, John Fawell, Rosina Girones Llop, Hung Nguyen, and Maureen Taylor. (2015). Risk Assessment as a Tool to Improve Water Quality and The Role of Institutions of Higher Education. Report. 2015 UN-Water Annual International Conference, Zaragoza, Spain
Zaitchik, B.F., M. Rodell, and R.H. Reichle. (2008). Assimilation of GRACE terrestrial water storage data into a land surface model: results for the Mississippi River Basin, J. Hydrometeor.9 (3) 535-548. Available from: https://doi.org/10.1175/2007JHM951.1
Top Related