


Languages
Pages
Legal


Sustainable harvest Sustainable harvest ofof
Finnish moose Finnish moose population?population?
Esa Ranta, Anne Luoma, Veijo KaitalaEsa Ranta, Anne Luoma, Veijo Kaitala
& &
FGFRIFGFRI

Contents
• Basic information on Finnish moose population and harvest

Contents
• Basic information on Finnish moose population and harvest
• Stochastic IBM model
Contents
• Basic information on Finnish moose population and harvest
• Stochastic IBM model
• Four questions

Contents
• Basic information on Finnish moose population and harvest
• Stochastic IBM model
• Four questions
• Four answers

Moose (Alces alces)
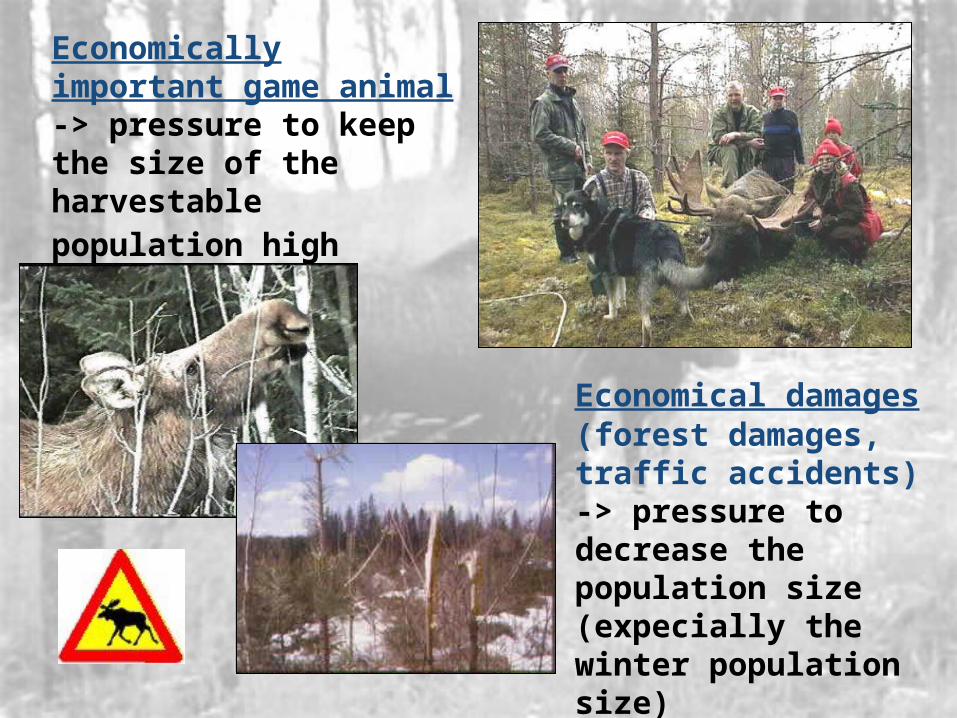
Economical damages (forest damages,traffic accidents)-> pressure to decrease the population size (expecially the winter population size)
Economically important game animal-> pressure to keep the size of the harvestable population high

Population size estimates:• Hunter observations (during the hunting season)• +their estimate of post-harvest pop.size• Wildlife triangle (snow track census)• Aerial surveys
• 20-50% of population is killed annually.• Age structure of population is controlled.
• Reproduction rate is high(mostly due to high harvest rate of young
animals)
Moose population in Finland
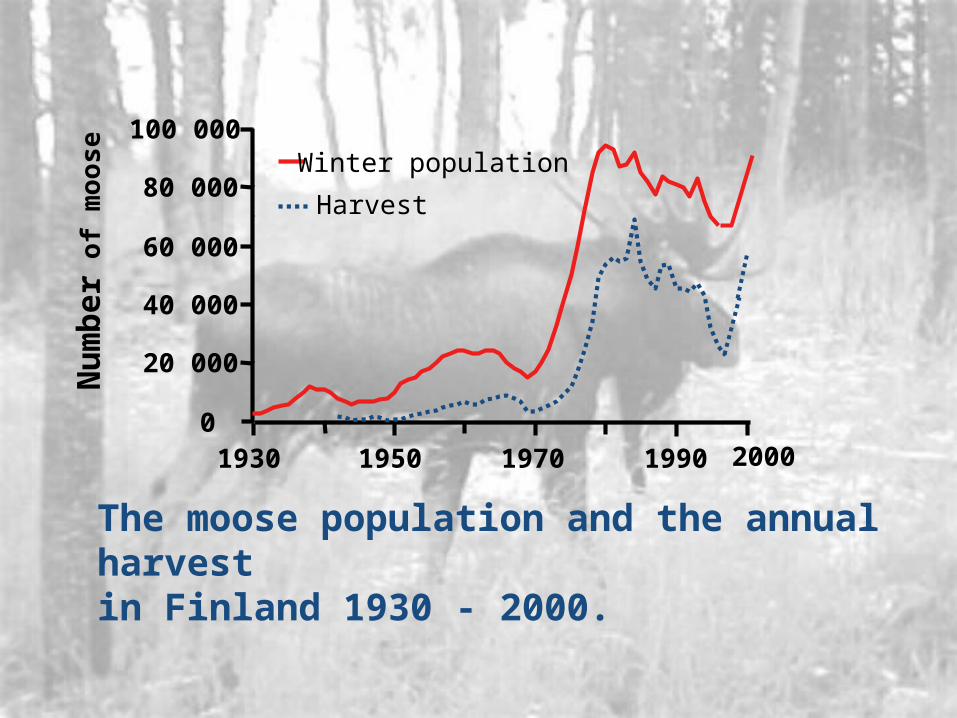
The moose population and the annual harvest in Finland 1930 - 2000.
0
20 000
40 000
60 000
80 000
100 000Winter population
Harvest
1930 1950 1970 1990
Nu
mb
er
of
moose
2000
QuickTime™ jaGraphics pakkauksen purkuohjelmatarvitaan elokuvan katselemiseen.
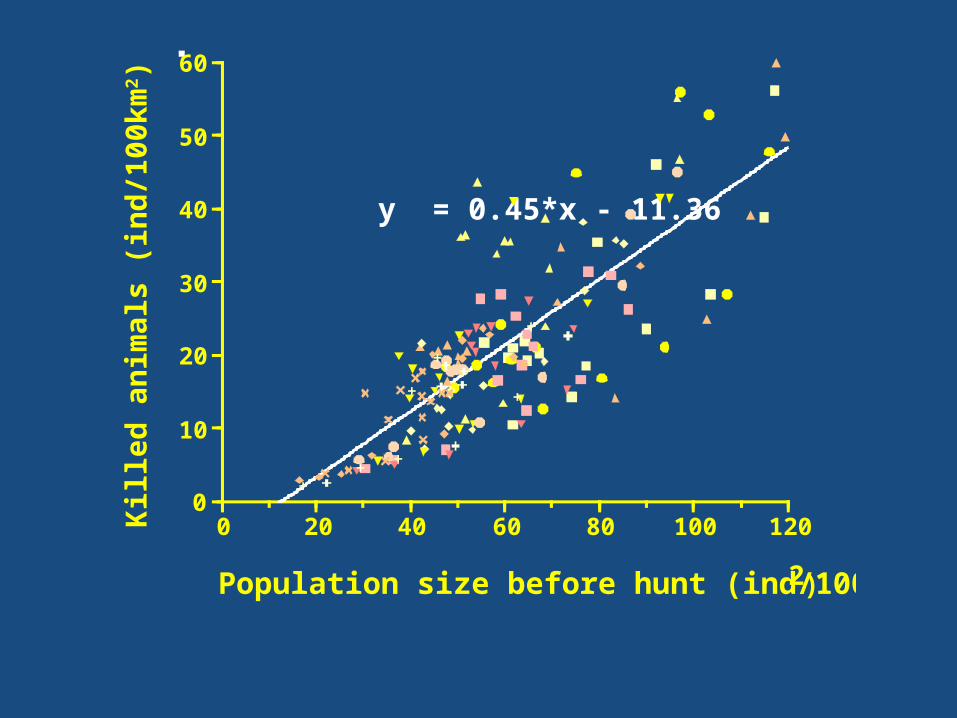
y = 0.45*x - 11.36
Population size before hunt (ind/100 km2)
0
10
20
30
40
50
60
0 20 40 60 80 100 120
Kill
ed a
nim
als
(in
d/1
00km
2 )

• with individual based,• stochastic model
Modelling moose population dynamics
Annual reproduction rate = 0.9 calves/ a female
Non-hunting mortality = 5% of winter population
Hunting mortality (hunting rate)15 - 25% of the harvestable
population
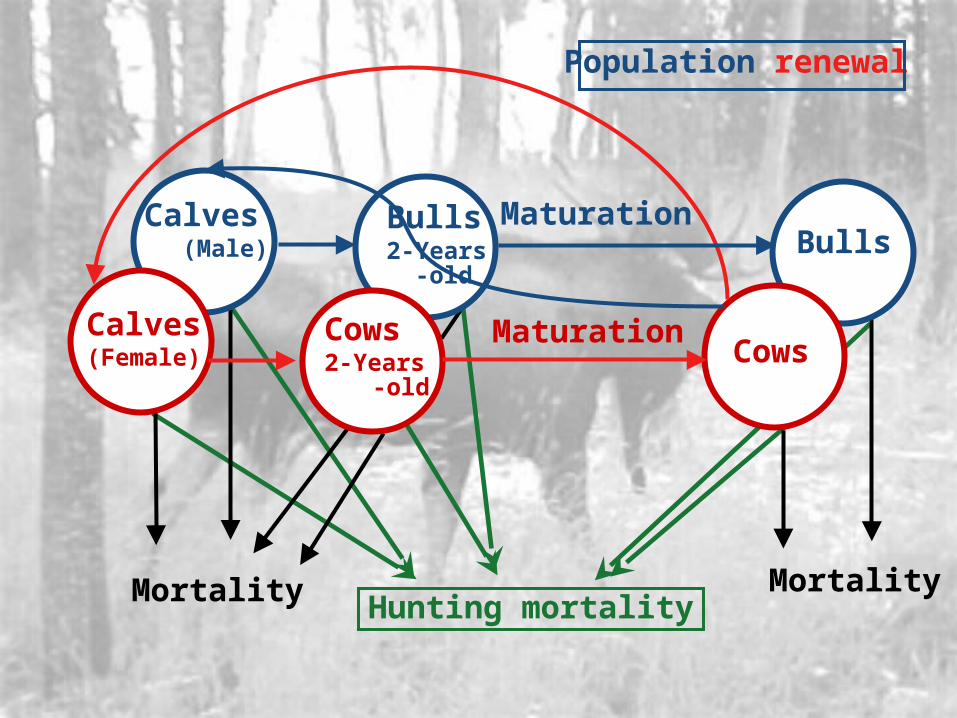
Hunting mortalityMortality Mortality
Cows
Bulls Bulls 2-Years -old
Cows 2-Years -old
Calves (Male)
Calves(Female)
Population renewal
Maturation
Maturation
Question #1
• Given the current population status
• What is the risk of moose population decline?(10 year time-window)

Pro
bab
ilit
y o
f p
op
ula
tio
n d
ecli
ne
Hunting rate of females
QuickTime™ jaGraphics pakkauksen purkuohjelmatarvitaan elokuvan katselemiseen.
0
0.2
0.4
0.6
0.8
1
0
0.2
0.4
0.6
0.8
1
0.1 0.15 0.2 0.25 0.3 0.35 0.1 0.15 0.2 0.25 0.3 0.35
Mortality = 0.01
Mortality = 0.01
Mortality = 0.05
Mortality = 0.05
(A) (B)
(C) (D)
0.7 calves1 calves
Birth rate:

Answer #1• The risk of moose population
decline increases substantially when annual harvest fraction inceseses from 15% of the harvestable population size(10 year time-window)

Hunting mortalityMortality Mortality
Cows
Bulls Bulls 2-Years -old
Cows 2-Years -old
Calves (Male)
Calves(Female)
Population renewal
Maturation
Maturation

Question #2• Given the current population
status, with errors in population estimates
• The wish is to reduce current population to a much lower lewel
• What will happen?(10 year time-window)

There are reasons to limit the population size.But if we want to get the pop. size really low, It is important to know:
What if..- the population size is overestimated or underestimated?- estimations tend to be biased?
How crucial effects do inaccurate estimateshave on moose population?

Real Estimated•Population size in winter:
10 000 8 000 - 12 000•Targeted population size 5 000•Population size in autumn:
According to model 1.5 * winter pop.(realistic and productive populations);
10 000 - winter = 12 000 - 18 000
mortality + birthHunting (h): h = Estimated pop. size - 5 000 animalsLeft:pop. in autumn - h = ? estim.pop. - h = 5 000

Different types of estimation errors:
8500 11500 10000 No peakPeak:
Real population size = 10 000
Real Real Real
8000 12000 8000 12000

”Realistic” population structure
Population sizes after hunting
0 2000 4000 60000
100
200
0 2000 4000 6000
0
100
200
8000 8000
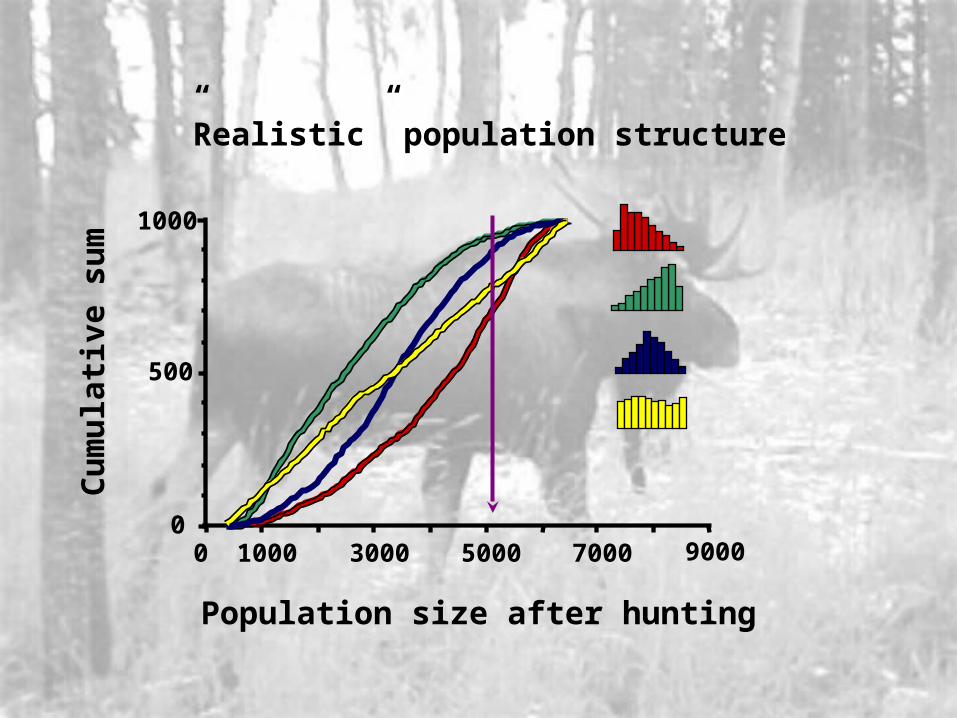
”Realistic” population structure
0
500
1000
0 1000 3000 5000 7000 9000
Population size after hunting
Cu
mu
lati
ve s
um

Answer #2
• With uncertain population estimates reduction of curent population size to a lower targeted size will yield to population sizes that are much lower than the target (10
year time-window)

Hunting mortalityMortality Mortality
Cows
Bulls Bulls 2-Years -old
Cows 2-Years -old
Calves (Male)
Calves(Female)
Population renewal
Maturation
Maturation

”Mooses come walking over the hillMooses come walking, they rarely
stand stillWhen mooses come walking they go
where they willWhen mooses come walking over the
hill”
- Arlo Guthrie

Question #3
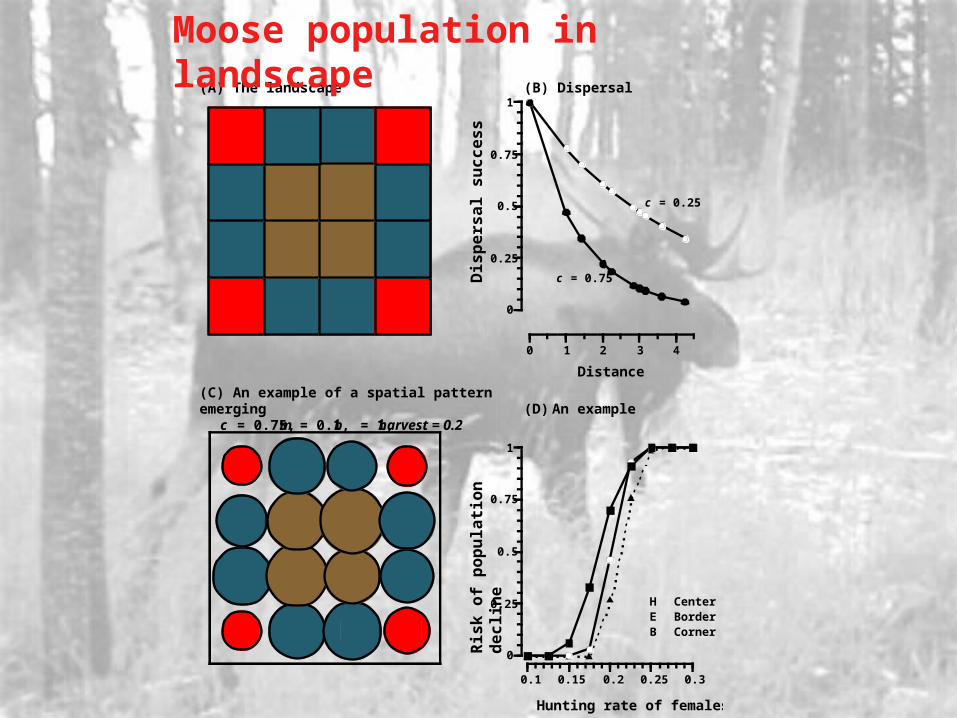
• How does landscape structure influence risk of moose population decline due to harvesting?

Moose populatin in landscapeQuickTime™ and aGraphics decompressorare needed to see this picture.
QuickTime™ and aGraphics decompressorare needed to see this picture.
0
0.25
0.5
0.75
1
0.1 0.15 0.2 0.25 0.3
Hunting rate of females
(D) An example
0
0.25
0.5
0.75
1
0 1 2 3 4
c = 0.25
c = 0.75
(A) The landscape (B) Dispersal
Distance
(C) An example of a spatial patternemerging
c = 0.75, m = 0.1, b = 1, harvest = 0.2
H CenterE BorderB Corner
Moose population in landscape
Ris
k o
f p
op
ula
tio
n d
ec
lin
e
Dis
pe
rsa
l s
uc
ce
ss

Answer #3
• Under many different dispersal scenarios risk of population decline is the highest in the corner units, then come the border units
• The risk is the lowest in the central units

Hunting mortalityMortality Mortality
Cows
Bulls Bulls 2-Years -old
Cows 2-Years -old
Calves (Male)
Calves(Female)
Population renewal
Maturation
Maturation

Question #4• What is the hunting
strategy yielding the highest harvest with a given targeted population size?

Moose harvest in Finland
QuickTime™ and aGraphics decompressorare needed to see this picture.
0
1
2Varsinais-Suomi
Uusimaa
Kymi
Etelä-Häme
Satakunta
Pohjois-Häme
Etelä-Savo
Österbotten
Pohjanmaa
Keski-Suomi
Pohjois-Savo
Pohjois-Karjala
J CowsB BullsE Calves
0
1
2
0
1
2
1 2 3 1 2 3 1 2 3 1 2 3
Winter herd, ind. 10 km-2
Har
vest
, in
d. 1
0 km
-2
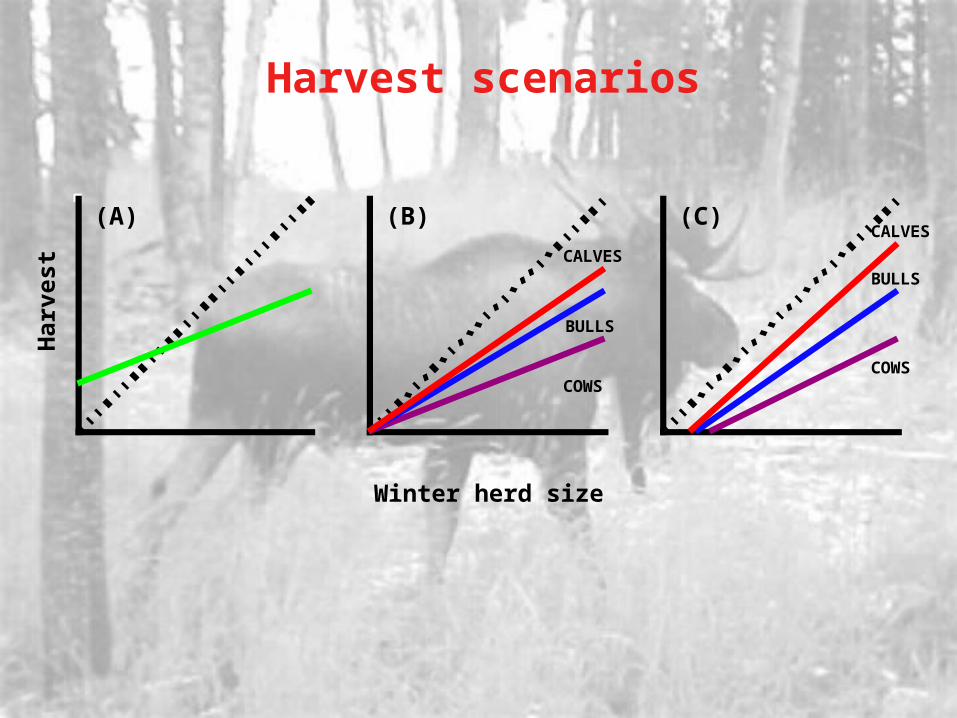
Harvest scenariosQuickTime™ and aGraphics decompressorare needed to see this picture.
(A) (B)
COWS
BULLS
CALVES
(C)
COWS
BULLS
CALVES
Har
vest
Winter herd size

Maximum harvest, target = 4 ind. km-2
QuickTime™ and aGraphics decompressorare needed to see this picture.
(A) Cows, aL
(C) Bulls, aS
(E) Calves, aV
(B) Cows, bL
(D) Bulls, bS
(F) Calves, bV
-0.8
-0.6
-0.4
-0.2
0
0.6 0.8 1 1.2
0
0.5
1
1.5
2
0.6 0.8 1 1.2
-0.8
-0.6
-0.4
-0.2
0
0
0.5
1
1.5
2
-0.8
-0.6
-0.4
-0.2
0
0
0.5
1
1.5
2
Total harvest, ind. km-2
Inte
rcep
t
Slo
pe

Answer #4QuickTime™ and aGraphics decompressorare needed to see this picture.
COWS
BULLS
CALVES
Winter herd size
Har
vest

Conclusions
• The simple IBM model on moose population renewal has served us well in answering a few basic questions on the future of moose and moose harvesting in Finland

Conclusions
• The model does not rely upon very complex assumptions (births, deaths, sex, harvesting), yet we believe it captures the essence of moose life

Conclusions
• The model prompts where more information is needed
– dispersal, population estimates, harvest management
• Some of the answers would not necessarily have called for an IBM model
Top Related