


Languages
Pages
Legal

U.S. employment situation: September 2013
Release date: October 22, 2013
2016’s volatility continues, but overall
picture remains healthy
U.S. employment situation: August 2016 September 2, 2016

August 2016 employment summary
• After a rebound in June and July, volatility returns
- 151,000 net new jobs were created in August, falling below the 250,000+ monthly additions over the previous two months. Although still at
average levels of growth, August demonstrated the continued volatility of the labor market in 2016, which has at times both sharply
exceeded and underperformed compared to estimates and consensus figures.
- Unemployment once again remained stable at 4.9 percent as growth in the workforce has aligned with employment gains. Due to the
stability of the official rate as well as total and white-collar unemployment in recent months, we believe that the market’s cyclical low in
terms of unemployment has likely been reached.
• Tech is now correcting, but still far outpacing the overall economy
- Throughout 2012 through to early 2016, tech was the star performer of the national economy, posting annual gains in excess of 5.5 or even
6.0 percent consistently. Talent shortages and the inability to sustain such rapid levels of growth have begun to show up in data, with year-
over-year change now at 4.5 percent. Despite this slowdown, tech is still growing 2.6x faster than the overall economy and will remain a
critical component of the labor market.
• Due to mixed figures, Federal Reserve likely to push back rate hike
- The Federal Reserve has been keenly watching jobs figures as a key metric to determine the timing of the next rate hike. While the overall
fundamentals of the labor market remain strong, with the overall economy is approaching its cyclical peak, unemployment consistently
below 5.0 percent, next to no upward movement in initial claims and employment gains relatively diversified, the Federal Reserve is likely to
hold off on the next rate hike due to inconsistent monthly additions and weaker-than-expected wage growth.
Source: JLL Research, Bureau of Labor Statistics
2

August 2016 U.S. labor market at a glance
+151,000(71 consecutive months
of growth)1-month net change
+2,447,000(+1.7% y-o-y)
12-month change
+781,00010-year average annual growth
Source: JLL Research, Bureau of Labor Statistics
4.9%Unemployment rate
-20bp12-month change in unemployment
62.8%Labor force participation rate
5,624,000(+8.8% y-o-y)
Job openings
5,131,000(-0.3% y-o-y)
Hires
2,723(+5.7% y-o-y)
Quits
3

After two very strong months of rebound, August growth was
more muted at 151,000 new jobs; revisions had little impact
360,
000
226,
000
243,
000
96,0
0011
0,00
088
,000 10
6,00
012
2,00
022
1,00
018
3,00
016
4,00
0 196,
000
360,
000
226,
000
243,
000
96,0
0011
0,00
088
,000
160,
000
150,
000
161,
000
225,
000
203,
000
214,
000
197,
000
280,
000
141,
000
203,
000
199,
000
201,
000
149,
000
202,
000
164,
000
237,
000 27
4,00
084
,000
166,
000
188,
000 22
5,00
033
0,00
023
6,00
028
6,00
024
9,00
021
3,00
0 250,
000
221,
000
423,
000
329,
000
221,
000 26
5,00
084
,000
251,
000
273,
000
228,
000
277,
000
150,
000
149,
000
295,
000
280,
000
262,
000
168,
000
233,
000
186,
000
277,
000
24,0
0027
1,00
027
5,00
015
1,00
0
0
50,000
100,000
150,000
200,000
250,000
300,000
350,000
400,000
450,000
2011
2012
2013
2014
2015
2016
1-m
onth
net
cha
nge
4
Source: JLL Research, Bureau of Labor Statistics

Unemployment is in its third consecutive month of 4.9 percent
as job and workforce growth are in alignment
0.0%
2.0%
4.0%
6.0%
8.0%
10.0%
12.0%
-1,000.0
-800.0
-600.0
-400.0
-200.0
0.0
200.0
400.0
600.0
Une
mpl
oym
ent r
ate
(%)
1-m
onth
net
cha
nge
(tho
usan
ds)
Monthly employment change Unemployment rate
Source: JLL Research, Bureau of Labor Statistics
5

Job openings are likely at an inflection point, remaining
relatively consistent throughout late 2015 and so far in 2016
Source: JLL Research, Bureau of Labor Statistics
6
0
1,000
2,000
3,000
4,000
5,000
6,000
7,000
Job
open
ings
(th
ousa
nds)

1.9%
3.0%
3.0%
3.0%
3.0%
3.3%
3.6%
4.7%
4.7%
5.0%
0.0% 1.0% 2.0% 3.0% 4.0% 5.0% 6.0%
Mining and logging
Other services
Trade, transportation and utilities
Construction
Manufacturing
Information
Financial activities
Education and health
Leisure and hospitality
Professional and business services
12-month % change in job openings
Facing a talent shortage and sustained demand for services,
PBS job openings continue to outpace other industries
Source: JLL Research, Bureau of Labor Statistics
7

0
1,000
2,000
3,000
4,000
5,000
6,000
2007 2008 2009 2010 2011 2012 2013 2014 2015 2016
Hire
s an
d qu
its (
thou
sand
s)
Hires Quits
Like job openings, hires and quits are beginning to plateau but
still trending up
Source: JLL Research, Bureau of Labor Statistics

Wage growth dropped by 20bp to 2.4 percent, although a similar
decline in inflation kept real earnings growth positive
Source: JLL Research, Bureau of Labor Statistics – CPI data as of March 2016
9
-3.0%
-2.0%
-1.0%
0.0%
1.0%
2.0%
3.0%
4.0%
5.0%
6.0%
2008 2009 2010 2011 2012 2013 2014 2015 2016
12-m
onth
% c
hang
e
Hourly wage growth CPI growth
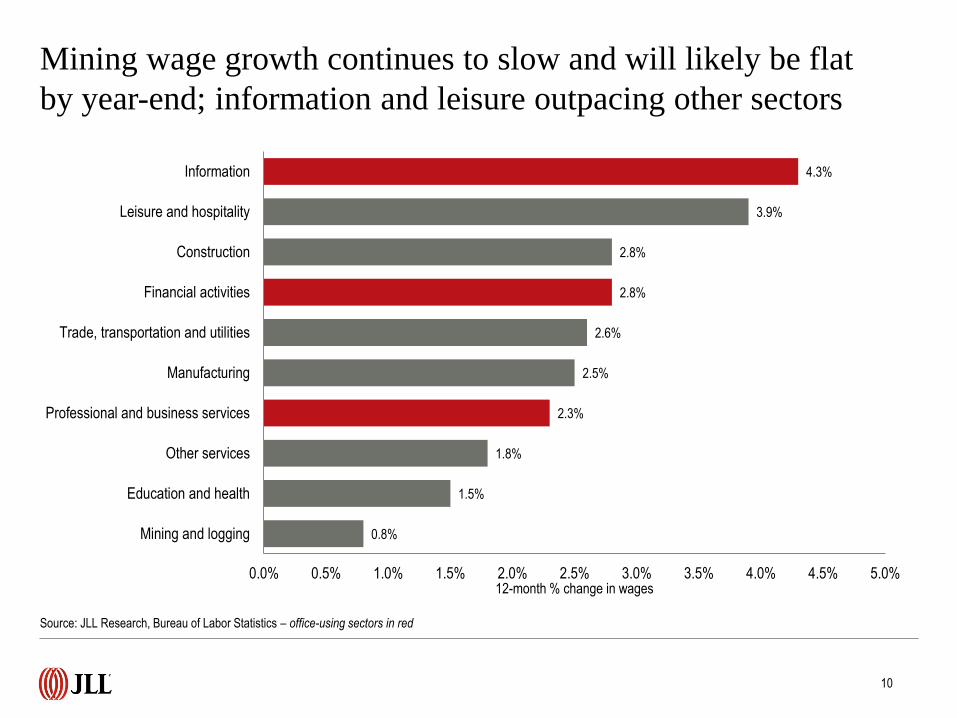
0.8%
1.5%
1.8%
2.3%
2.5%
2.6%
2.8%
2.8%
3.9%
4.3%
0.0% 0.5% 1.0% 1.5% 2.0% 2.5% 3.0% 3.5% 4.0% 4.5% 5.0%
Mining and logging
Education and health
Other services
Professional and business services
Manufacturing
Trade, transportation and utilities
Financial activities
Construction
Leisure and hospitality
Information
12-month % change in wages
Mining wage growth continues to slow and will likely be flat
by year-end; information and leisure outpacing other sectors
Source: JLL Research, Bureau of Labor Statistics – office-using sectors in red
10

-16.0
-14.0
-6.0
-5.6
-4.0
-3.1
-0.8
2.0
3.9
4.0
7.0
14.9
15.0
15.1
22.0
25.0
29.0
36.1
39.0
-20 -10 0 10 20 30 40 50
Durable goods
Manufacturing
Construction
Motor vehicles and parts
Mining and logging
Temporary help services
Utilities
Nondurable goods
Wholesale trade
Information
Other services
Transportation and warehousing
Financial activities
Retail trade
Professional and business services
Government
Leisure and hospitality
Health care and social assistance
Education and health services
1-month net change (thousands)
Monthly figures pulled downward by slight contraction in
construction and below-average PBS and health gains
11
Source: JLL Research, Bureau of Labor Statistics

-125.0
-87.0
-37.0
3.4
8.8
29.0
33.3
47.0
50.0
51.2
76.0
164.0
167.0
199.0
293.4
418.0
542.0
556.0
618.0
-200 0 200 400 600 800
Mining and logging
Durable goods
Manufacturing
Utilities
Motor vehicles and parts
Information
Temporary help services
Wholesale trade
Nondurable goods
Transportation and warehousing
Other services
Government
Financial activities
Construction
Retail trade
Leisure and hospitality
Professional and business services
Health care and social assistance
Education and health services
12-month net change (thousands)
618.0
556.0
418.0
293.4
167.0
394.6
Education and health PBS
Leisure and hospitality Retail trade
Financial activities Manufacturing
All other jobs
Over the course of 2016, annual levels of growth have yet to
budge and composition remains consistent
Source: JLL Research, Bureau of Labor Statistics
12
Core subsectors added 83.9 percent
of all jobs over the past 12 months.

0.0%
1.0%
2.0%
3.0%
4.0%
5.0%
6.0%
Une
mpl
oym
ent r
ate
for
bach
elor
’s d
egre
e ho
lder
s (%
)Unemployment for bachelor’s degree holders rose slightly to
2.7 percent, but remains near its cyclical low
Source: JLL Research, Bureau of Labor Statistics
13

As with the general labor market, office-using industries saw
much slower growth in August, particularly PBS
-300
-250
-200
-150
-100
-50
0
50
100
150
200
2009 2010 2011 2012 2013 2014 2015 2016
Information Professional and business services Financial activities
Source: JLL Research, Bureau of Labor Statistics
14

Tech continues to stabilize and now stands at 4.5-percent
growth, while energy has surpassed its cyclical trough
-11.0
-9.0
-7.0
-5.0
-3.0
-1.0
1.0
3.0
5.0
7.0
9.0
2008 2009 2010 2011 2012 2013 2014 2015 2016
High-tech Energy, Mining, and Utilities Office-using industries Total non-farm
Source: JLL Research, Moody’s. Note: Due to data lags, high-tech employment only available through January 2015.
15
12-m
onth
% c
hang
e (jo
bs)

Initial claims have yet to budge over the course of 2016,
demonstrating economic momentum in spite of volatility
Source: JLL Research, U.S. Department of Labor
16
200,000
250,000
300,000
350,000
400,000
450,000
500,000
550,000
600,000
650,000
700,000
Cla
ims
Initial claims 4-week moving average

0
20
40
60
80
100
120
140
Con
sum
er c
onfid
ence
Inde
xConsumer confidence broke the 100-point mark for the first
time this year, but has yet to reach 2015 levels
Source: JLL Research, Conference Board
17

Ongoing tech correction has resulted in the Bay Area no longer
being among the fastest-growing labor markets
Source: JLL Research, Bureau of Labor Statistics
18
Austin
3.9%
Seattle-
Bellevue
3.9%
Fort
Lauderdale
4.6%
Orlando
4.1%
Jacksonville
3.6%
Denver
3.7%

As with the official unemployment rate, total unemployment is
beginning to reach its trough at 9.7 percent
6.0%
8.0%
10.0%
12.0%
14.0%
16.0%
18.0%
Tot
al u
nem
ploy
men
t (%
)
Total unemployment U-6 10-year average
Source: JLL Research, Bureau of Labor Statistics
19

Balanced increases in the workforce (+176,000) and
employment (+151,000) kept participation flat at 62.8 percent
Source: JLL Research, Bureau of Labor Statistics
20
60.0%
61.0%
62.0%
63.0%
64.0%
65.0%
66.0%
67.0%
2008 2009 2010 2011 2012 2013 2014 2015 2016
Labo
r fo
rce
part
icip
atio
n ra
te (
%)

©2016 Jones Lang LaSalle Research IP, Inc. All rights reserved. All information contained herein is from sources deemed reliable; however, no representation or warranty is made to the accuracy thereof.
For more information, please contact:
Ben Breslau
Managing Director - Americas Research
Phil Ryan
Senior Research Analyst – Office and Economy Research
Top Related