


Languages
Pages
Legal


May 2018

Safe Harbour
This presentation and the accompanying slides (the “Presentation”), which have been prepared by PNB Housing Finance Ltd (the “Company”), have been
prepared solely for information purposes and do not constitute any offer, recommendation or invitation to purchase or subscribe for any securities, and shall not
form the basis or be relied on in connection with any contract or binding commitment what so ever. No offering of securities of the Company will be made except
by means of a statutory offering document containing detailed information about the Company.
This Presentation has been prepared by the Company based on information and data which the Company considers reliable, but the Company makes no
representation or warranty, express or implied, whatsoever, and no reliance shall be placed on, the truth, accuracy, completeness, fairness and reasonableness
of the contents of this Presentation. This Presentation may not be all inclusive and may not contain all of the information that you may consider material. Any
liability in respect of the contents of, or any omission from, this Presentation is expressly excluded.
Certain matters discussed in this Presentation may contain statements regarding the Company’s market opportunity and business prospects that are individually
and collectively forward-looking statements. Such forward-looking statements are not guarantees of future performance and are subject to known and unknown
risks, uncertainties and assumptions that are difficult to predict. These risks and uncertainties include, but are not limited to, the performance of the Indian
economy and of the economies of various international markets, the performance of the industry in India and world-wide, competition, the company’s ability to
successfully implement its strategy, the Company’s future levels of growth and expansion, technological implementation, changes and advancements, changes
in revenue, income or cash flows, the Company’s market preferences and its exposure to market risks, as well as other risks. The Company’s actual results,
levels of activity, performance or achievements could differ materially and adversely from results expressed in or implied by this Presentation. The Company
assumes no obligation to update any forward-looking information contained in this Presentation. Any forward-looking statements and projections made by third
parties included in this Presentation are not adopted by the Company and the Company is not responsible for such third party statements and projections.
2

Key Milestones
1988• Obtained NHB license for loans and deposits
• Company commenced operations
1994 • Crossed INR 100 Crore loan portfolio
2003 • Notified under SARFAESI Act
2006 • Crossed INR 1,000 Crore loan portfolio
2009• Entered into a strategic financial partnership with Destimoney
Enterprises Private Limited (DEPL) DEPL acquired 26% stake in
the Company
2010 • Launched business process re-engineering project-”Kshitij”
*Source: Great Place to Work Institute (GPTW)
2011
• New Brand positioning with completely refurbished, elegant,
convenient and secured offices
• Robust and scalable target operating model (TOM) implementation
commenced
2012• DEPL raises stake from 26% to 49% through conversion of
compulsory convertible debentures (CCD)
2014 • PAT crossed INR 100 Crore and AUM crossed INR 10,000 Crore
2015• Implementation of Enterprise System Solution
• Quality Investments Holdings, owned by the Carlyle group, a global
investment firm bought DEPL
2016• Listed on Indian stock exchanges through IPO; raised 3,000 Crore
• TOM implemented
• AUM crossed INR 25,000 Crore
2017
• AUM crossed INR 50,000 Crore mark
• Deposits: Over INR 10,000 Crore
• Certified as a “Great Place to Work” by building a ‘High Trust,
High Performance Culture’*
• Incorporated a subsidiary ’’PHFL Home Loans & Services Ltd’’
2018• MTN set-up for $1bn to raise offshore funds
• Certified as a “Great Place to Work” by building a ‘High Trust,
High Performance Culture’*
3

Kshitij InterventionsLed to Company’s Transformation
4

5
Strong Brand Recognition Driven by Customer-centric Approach
Robust lead
management
system with
real time
enquiry
management
Pro-active
retention
measures
Customer
service portal
and mobile
app
Easy
accessibility
Trustworthy
and well-
recognized
promoter
Transparency in
communication
with customers
Proactive
communication
Consistent
experience
Employees
with in-depth
understanding
of market
Close and
direct
integration
with
customers
Efficient
delivery
Faster TAT
Creation of
new logo
Brand
visibility
through
sustained
advertising
Creation of
new tagline to
convey our
commitment
of pleasant
customer
experience
Customer-centric Approach Initiatives to Reposition Brand…together with…
Resulting in Strong Brand Recognition

6
DISBURSEMENTEXPERIENCE
WEB
BRANCH
MOBILEDOOR STEP DELIVERY
VOICE & EMAIL SERVICING
Omni-Channel Customer Touchpoints
(ISO 9001:2008 certified) CONTACT CENTER
Company Customer

7
DSA DST
File received at
hub
Fountain head
for decision
making
Fraud Control
Unit
Legal Team
Collection
Team
Technical
Service Group
Underwriter reviews
the reports, does the
financial assessment
and finally decides
on the loan
application
Digital
Platform
Field
Investigation
Lead
Aggregators
Customer acquisition /
servicing
Underwriting Post Disbursement Operations
Central
Processing
Centre
Central
Operations
√ Scalable and efficient operating
model with centralized processing
√ Effective risk management with
separation of responsibilities
√ Integrated IT platform
Spokes (Branch) Regional Hub CPC/COPs
DSA: Direct Sales Agent; DST: Direct Sales Team
Scalable Hub & Spoke Model

Secured Digital Enterprise
Enabled Target Operating Model
High Business Growth
Operational Efficiency
Security & Compliance
Enhanced Customer Satisfaction
Smart & Integrated Business
Ecosystem
Enterprise System Solution
Point solutions as Business Enabler
2011-12
2013-14
2016-17
2017-18
IT Foundation
Technology enabled Growth
8
2014-16

9
Single Technology Platform
IT as backbone of Business Processing
Digitization to bring efficiencies and enhance customer service
‘Document Digitization Centre’ – true amalgamation of People, Process and Technology
Scanned security and title documents are stored on dedicated private cloud for the Company
Mitigates operational and transit risk, reduction in retrieval cost and improvement in data security
10
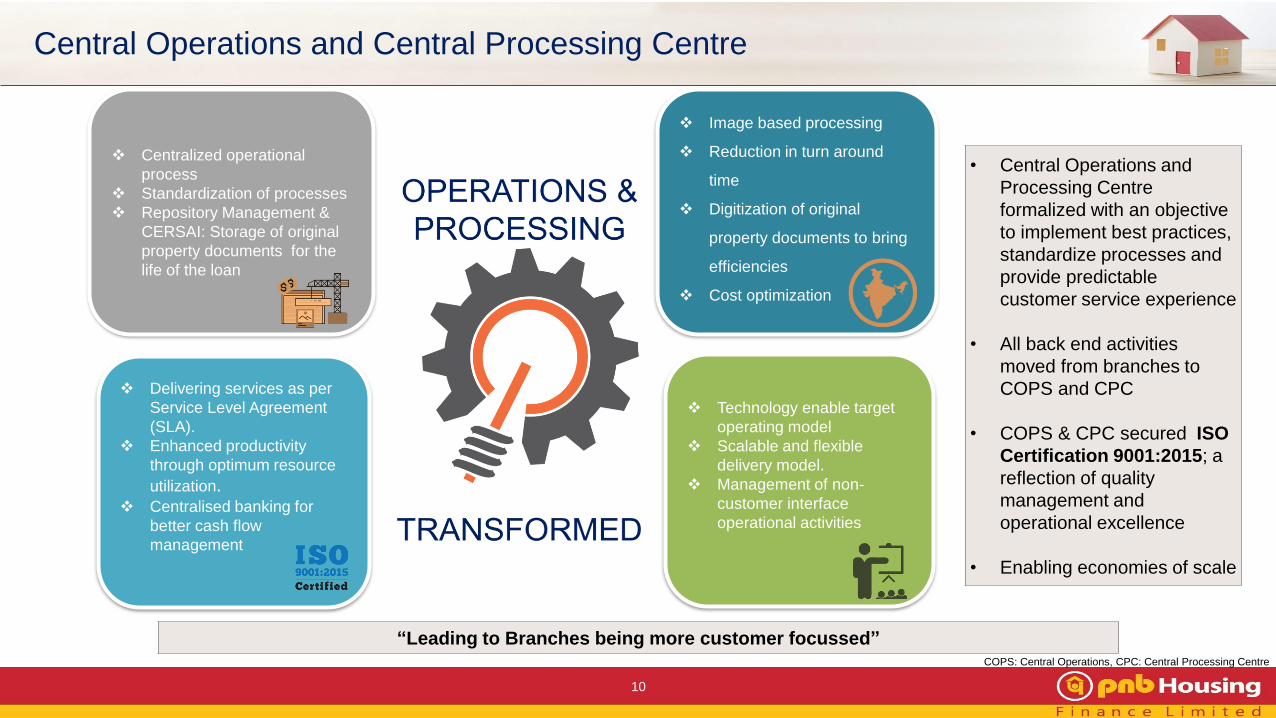
Centralized operational
process
Standardization of processes
Repository Management &
CERSAI: Storage of original
property documents for the
life of the loan
Technology enable target
operating model
Scalable and flexible
delivery model.
Management of non-
customer interface
operational activities
Delivering services as per
Service Level Agreement
(SLA).
Enhanced productivity
through optimum resource
utilization. Centralised banking for
better cash flow
management
Image based processing
Reduction in turn around
time
Digitization of original
property documents to bring
efficiencies
Cost optimization
• Central Operations and
Processing Centre
formalized with an objective
to implement best practices,
standardize processes and
provide predictable
customer service experience
• All back end activities
moved from branches to
COPS and CPC
• COPS & CPC secured ISO
Certification 9001:2015; a
reflection of quality
management and
operational excellence
• Enabling economies of scale
Central Operations and Central Processing Centre
“Leading to Branches being more customer focussed”COPS: Central Operations, CPC: Central Processing Centre

Cultural Transformation
Cultural Transformation
Visioning and Values
Competency
Framework
Role AlignmentPerformance
Management
Reward &
Recognition
Training &
Development
Integration of
Resources
People Initiatives
11
Institutionalize HR Processes and Policies

Year on Year Trends
The Growth Journey

Values in INR Crore
One Crore = 10 Million
• Fastest growing amongst
top five HFCs in India*
• Consistent growth trend
• Pan India presence with
well balanced geographical
distribution
13
Accelerated growth in Disbursement
*Source: ICRA Industry Update for 9MFY2018; Based on growth rate of Loan assets as on Mar-17 over Dec-17
5,500
20,639
FY15 FY16 FY17FY13
3,682
FY12 FY18
+84%
14,456
9,440
FY14
1,508
33,195
WestNorth South
+52%

95%
5%
70%
30%
47%
53%
53%
47%
FY12:
INR 1,508 Cr.
FY13:
INR 3,682 Cr.
FY14:
INR 5,500 Cr.
FY15:
INR 9,440 Cr.
FY16:
INR 14,456 Cr.
FY17:
INR 20,639 Cr.
45%
55%
Third PartyDirect
Disbursement
14
De-risked third party Dependency along with Cost Optimization
One Crore = 10 Million
35%
65%
41%
59%
FY18:
INR 33,195 Cr.

*Source: ICRA 9MFY18 report
15
High growth in Assets
Values in INR Crore
One Crore = 10 Million
3,970 6,621 10,591
16,819
27,177
38,531
57,014
62,252
+63%
31-Mar-1831-Mar-15
10,591
31-Mar-13
6,6213,970
31-Mar-1431-Mar-12
41,492
31-Mar-16
17,297
31-Mar-17
27,555
AUM Loan Assets
• AUM of INR 10,000 Crore
achieved in 26 years, AUM
of next INR 50,000 Crore
achieved in last 4 years
• AUM has grown over 15
times in the last 7 years
• PNB Housing share in the
HFC increased from 2.5%
in FY14 to 6% in Dec 2017*
• Highest assets growth
amongst top 5 HFCs in the
Country*
+53%

As on
31st Mar’12
INR 3,970 Cr.
As on
31st Mar’13
INR 6,621 Cr.
As on
31st Mar’14
INR 10,591 Cr.
As on
31st Mar’15
INR 17,297 Cr.
As on
31st Mar’16
INR 27,555 Cr.
As on
31st Mar’17
INR 41,492 Cr.
Individual Housing Non Housing Construction Finance
16
Well Balanced AUM mix - Strong Competitive Edge
One Crore = 10 Million
72%
25%3%
75%
23%
2%
62%
28%
10%
65%
29%
6%
63%
28%
9%
60%29%
11%
59%
29%
12%
As on
31st Mar’18
INR 62,252 Cr.

17
71%
9%
20%
As on
31st Mar’12
INR 3,970 Cr.
59%
18%
23%
52%23%
25%
As on
31st Mar’13
INR 6,621 Cr.
As on
31st Mar’14
INR 10,591 Cr.
North WestSouth
41%
29%
30%
46%
27%
27%
36%
30%
34%
32%
29%
39%
As on
31st Mar’15
INR 17,297 Cr.
As on
31st Mar’17
INR 41,492 Cr.
As on
31st Mar’18
INR 62,252 Cr.
As on
31st Mar’16
INR 27,555 Cr.
De-risked Geographical Concentration
On AUM basis

No. of Branches
Map not to scale. All data, information and maps are provided “as is” without warranty or any representation of accuracy, timeliness or completeness.
Branches – Point of Sales & Services
Processing Hubs – Fountain head for Decision Making
Zonal Hubs - Guides, Supervises & Monitors the HUB
*Unique cities are part of Branches^Branches made operational from FY16 onwards
18
Expanding Footprints with improved Productivity
• In-depth analysis of demographics and growth
prospects
• Establish branches as per business potential
• Market deepening strategy
• Hubs aid and support branch expansion
• Track operational break-even for each establishment
27
7
8
84
TotalFY18
21
32
16
5
FY16 FY17
9
FY15
6
FY14
Unique Cities*No. of Branches
47
Geography Hub Branches
North 7 28
South 7 27
West 7 29New Branches^ contributes 30% of
Retail Disbursement
As on 31-Mar-18
Disbursement / Branch(INR Crore)
51119
172248
308 328395
FY12 FY13 FY14 FY15 FY16 FY17 FY18
+42%

1.04%
0.56%
0.32%
0.20% 0.22% 0.22%
0.33%
0.67%
0.35%
0.16%0.07%
0.14%0.15%
0.25%
31-Mar-12 31-Mar-13 31-Mar-14 31-Mar-15 31-Mar-16 31-Mar-17 31-Mar-18
Gross NPA Net NPA
One of the
lowest Gross
and Net NPA in
the Industry
“Rigorous credit underwriting and better understanding of Customer segments resulted in lower NPA”
19
Consistently maintaining NPA below the Industry average
*Source: CRISIL
2 years Lagged NPA*
1.2
0.9
0.50.6
0.5
0.67
1.1
1.1
1.0 1.0
1.2
31-Mar-13 31-Mar-14 31-Mar-15 31-Mar-16 31-Mar-17 31-Mar-18
PNBHFL Other HFCs
Awaited
NPA as a % of Loan Assets

2013CARE AA+
CRISIL AA+ (NCDs)
FAAA (Deposits)
A1+ (CPs)
ICRA AA+ (NCDs)
2014CARE AAA
CRISIL AA+ (NCDs)
FAAA (Deposits)
A1+ (CPs)
ICRA AA+ (NCDs)
2015CARE AAA
A1+ (CPs)
CRISIL AA+ (NCDs)
FAAA (Deposits)
A1+ (CPs)
ICRA AAA (NCDs)
INDIA Ratings AAA
(NCDs)
2016CARE AAA
A1+ (CPs)
CRISIL AA+ (NCDs)
FAAA (Deposits)
A1+ (CPs)
ICRA AA+* (NCDs)
INDIA Ratings AAA
(NCDs)
2017CARE AAA
A1+ (CPs)
CRISIL AA+ (NCDs)
FAAA (Deposits)
A1+ (CPs)
ICRA AA+ (NCDs)
INDIA Ratings AAA
(NCDs)
Upto 2014 CARE long term rating was for NCDs; 2015 onwards it is for NCDs, Deposits & Bank Term Loan
*Rating influenced by the rating of the parent company- PNB
20
Robust Credit Rating
2012CARE AA+
CRISIL AA (NCDs)
FAA+ (Deposits)
A1+ (CPs)

Well Diversified Borrowing Composition
10.8% 14.0% 9.7% 10.6% 7.9% 7.7% 7.2%
40.8% 40.0%39.9%
20.3%
7.4% 6.9% 8.5%
3.6%
2.3% 4.2% 2.7%
9.2%15.0%
16.7%
29.2%
27.2% 28.0%21.4%
9.6%
19.2% 12.3%19.2%
39.2%31.0% 33.7%
26.7%35.9% 41.0% 41.1%
FY12 FY13 FY14 FY15 FY16 FY17 FY18
NCDs Commercial Paper Deposit ECBs Bank Term Loans NHB Refinance
3,962Total
Borrowings
(INR Crore)16,7516,787 26,159 35,65710,241
Well diversified borrowing mix resulting in one of the lowest Cost of Borrowing
21
• MTN set-up for $1bn
to raise offshore funds
o IFC committed to
underwrite
$150mn
• Raised ECB of US$
100mn from IFC &
US$ 150mn from ADB
• First HFC to raise
funds through Green
Bonds
• Well diversified
Investor base
One Crore = 10 Million
54,268

• 2nd largest deposit mobilizer
as on 31st March’18*
• Deposit grew over 30 times
from FY12 to FY18 on back
of high credit rating and
service quality
• Strong and predictable
distribution channel - base
grew from over 300 brokers
in FY12 to more than 6,000
brokers end FY18
22
Growth in Deposit Outstanding
Values in INR Crore
One Crore = 10 Million
363
1,051
1,712
4,897
7,121
9,987
11,586
31-Mar-12 31-Mar-1831-Mar-16 31-Mar-1731-Mar-1531-Mar-13 31-Mar-14
+138%
*Source: Company Reports
+33%

Financial Performance

Total Revenue
24
Strong Revenue & Profit growth
Net Profit After Tax
Values in INR Crore
One Crore = 10 Million
463 661
1,116
1,777
2,699
3,908
5,517
FY18FY12 FY14 FY17FY13
+57%
FY15 FY16
75 92 127
196
326
524
829
+38%
FY16 FY17FY14FY13 FY18FY15FY12
+46%+62%

Cost to Income Ratio (%)
“Economies Of Scale Delivering Improved Efficiency and Operating Leverage”
25
Operating Leverage Playing Out
23.01%
28.93%30.81% 30.87%
25.15%
22.43%
19.54%
FY12 FY13 FY14 FY15 FY16 FY17 FY18
Opex to Average Total Assets Ratio (%)
0.79%
0.91%0.95%
0.98%
0.83%
0.73%0.68%
FY12 FY13 FY14 FY15 FY16 FY17 FY18
Ratios are calculated on Monthly Average
Opex To ATA :Operating Expenditure(Employee Cost + Other Expenses + Depreciation - Acquisition Cost - CSR cost)/Average Total Assets as per Balance sheet
Cost to Income Ratio: Operating Expenditure(Employee Cost + Other Expenses + Depreciation - Acquisition Cost - CSR cost) / (Net Revenue-Acquisition Cost)

20.31%
17.86%16.39% 16.08%
17.12%14.92%
14.00%
FY12 FY13 FY14 FY15 FY16 FY17* FY18
ROE (%)
26
Better Return Profile & Comfortable Gearing
ROA (%)
1.83%
1.48%
1.31% 1.28%1.37%
1.46%1.54%
FY12 FY13 FY14 FY15 FY16 FY17 FY18
Return on Asset is on Average Total Assets as per Balance Sheet
Average Gearing (x)
9.61 10.38 10.83 10.73 10.77
8.72 7.60
FY12 FY13 FY14 FY15 FY16 FY17 FY18
*Capital of INR 3,000 Crore raised through IPO of 3,87,19,309 fresh equity shares

27
Loans Outstanding / Employee
Profitability / Employee
Disbursement / Employee
Total Revenue / Employee
Employee Efficiency
Calculated on Average no. of employee for the Year
28.99
24.25
21.23
17.16
13.5112.65
6.70
FY12 FY14 FY18FY15 FY17FY16
+28%
FY13
49.7945.28
39.91
30.5826.02
22.7517.64
31-Mar-12 31-Mar-14 31-Mar-1831-Mar-15 31-Mar-1731-Mar-16
+19%
31-Mar-13
4.824.59
3.96
3.232.74
2.272.06
FY12 FY14 FY18FY15 FY17FY16
+15%
FY13
0.72
0.62
0.48
0.360.310.310.33
FY12 FY14 FY18FY15 FY17FY16
+14%
FY13
INR Crore / Employee

Valuation & Shareholding
27
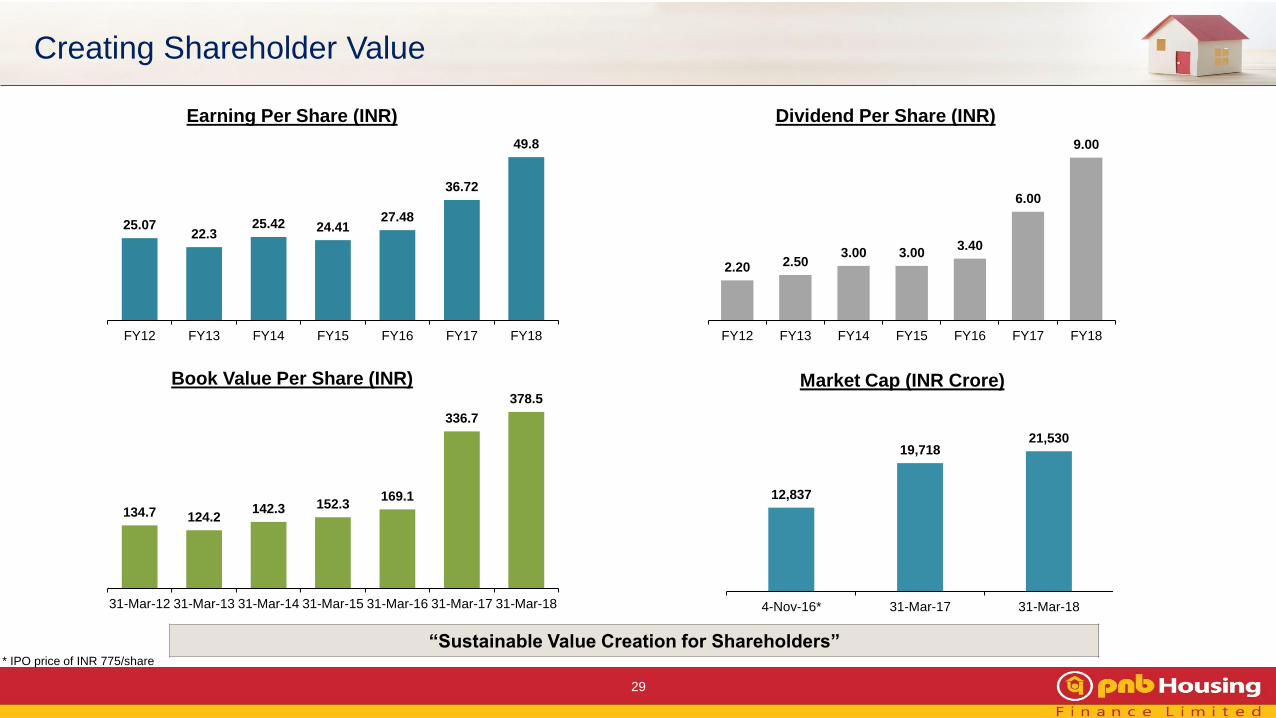
25.0722.3
25.42 24.4127.48
36.72
49.8
FY12 FY13 FY14 FY15 FY16 FY17 FY18
29
Creating Shareholder Value
Earning Per Share (INR)
2.20 2.503.00 3.00
3.40
6.00
9.00
FY12 FY13 FY14 FY15 FY16 FY17 FY18
134.7 124.2142.3 152.3
169.1
336.7
378.5
31-Mar-12 31-Mar-13 31-Mar-14 31-Mar-15 31-Mar-16 31-Mar-17 31-Mar-18
“Sustainable Value Creation for Shareholders”
Book Value Per Share (INR)
Dividend Per Share (INR)
Market Cap (INR Crore)
12,837
19,71821,530
4-Nov-16* 31-Mar-17 31-Mar-18
* IPO price of INR 775/share

30
Shareholding Pattern as on 31st March’18
33.0%
37.3%
16.3%
6.5%4.0% 1.9%
1.0%
Promoters Quality Investment Holdings Foreign Inst. Investors Mutual Funds Public & Others Bodies Corporates Financial Institutions / Banks

Bids Received
>60,000 Crores
Listing date
7th Nov’16
Issue Size
INR 3,000 Crore
Fresh Issue
(No. of Shares)
38,719,309
Face Value
INR 10 per Share
Issue Price
INR 775 per Share
IPO proceeds to fuel
GROWTH
Key Anchor Book
General Atlantic
Singapore Fund,
Wasatch, Government of
Singapore, Motilal Oswal
MF, Birla Sunlife MF, SBI
Life Insurance, BNP
Paribas Mutual Fund,
HDFC Standard Life
Insurance Company,
ICICI Prudential Mutual
Fund
31
Successful Listing- “More than 20 times Oversubscribed ”

Detailed Financials

Profit & Loss Statement
33
Particulars (INR Crore) FY18* FY17 FY16 FY15 FY14 FY13 FY12
Revenue from Operations 5,516 3,908 2,698 1,777 1,116 642 454
Other Income 0 0 1 - - 19 9
Total Revenue 5,517 3,908 2,699 1,777 1,116 661 463
Expenditure:
Finance Cost 3,531 2,644 1,860 1,265 801 462 315
Employee Benefit Expenses 137 101 75 67 40 26 16
Other Expenses 347 237 162 106 63 34 23
Depreciation Expense 24 19 15 5 5 2 0
Provisions and Write-Offs 199 103 83 38 30 12 6
Total Expenditure 4,238 3,104 2,196 1,481 940 535 361
Profit Before Tax 1,279 804 503 296 176 126 103
Tax Expenses 449 280 177 100 48 35 27
Net Profit After Tax 829 524 326 196 127 92 75
EPS (Basic) 49.8 36.7 27.5 24.4 25.4 22.3 25.1
One Crore = 10 Million
* FY18 numbers are on consolidated basis

Balance Sheet Statement- Equity & Liabilities
34
Particulars Mar-18* Mar-17 Mar-16 Mar-15 Mar-14 Mar-13 Mar-12
Equity and Liabilities
Shareholder's Funds 6,306 5,577 2,146 1,581 935 621 404
Share Capital 167 166 127 104 66 50 30
Reserves and Surplus 6139 5,412 2,019 1,477 869 571 374
Non-Current Liabilities 36,988 24,477 16,938 11,453 8,130 5,579 2,818
Long-Term Borrowings 36,389 24,084 16,646 11,105 7,947 5,536 2,802
Deferred Tax Liabilities (Net) 58 47 30 8 - - -
Other Long-Term Liabilities 142 104 101 259 134 15 -
Long-Term Provisions 400 242 161 82 49 28 16
Current Liabilities 20,505 12,905 10,587 5,999 2,465 1,666 1,310
Short-Term Borrowings 14,242 7,947 7,448 3,447 452 - -
Short-Term Provisions 44 28 71 53 36 176 138
Trade Payables 121 94 75 57 22 6 3
Other Current Liabilities 6,098 4,836 2,992 2,442 1,956 1,484 1,170
Total 63,799 42,960 29,671 19,033 11,530 7,866 4,533
One Crore = 10 million
*31-Mar-18 numbers are on consolidated basis

Balance Sheet Statement- Assets
35
Particulars (INR Crore) Mar-18* Mar-17 Mar-16 Mar-15 Mar-14 Mar-13 Mar-12
Assets
Non-Current Assets 55,834 37,744 26,656 14,782 8,868 6,449 3,845
Fixed Assets 86 60 62 58 26 16 4
-Tangible Assets 59 48 48 38 23 13 4
-Intangible Assets 17 11 10 1
-Capital Work-in-Progress 10 2 4 18 3 4 1
Non-Current Investments 1,161 961 782 219 119 74 54
Deferred Tax Assets (Net) 15 12 12
Loans and Advances 54,122 36,444 25,624 14,382 8,641 6,318 3,774
Other Non-Current Assets 465 278 188 123 68 29 1
Current Assets 7,965 5,216 3,015 4,251 2,662 1,417 688
Current Investments 1,219 2,318 840 1,367 527 719 325
Cash and Bank Balances 2,817 151 249 293 138 188 11
Short-Term Loans and Advances 81 40 18 20 9 459 315
Other Current Assets 3,848 2,706 1,908 2,571 1,988 50 37
Total 63,799 42,960 29,671 19,033 11,530 7,866 4,533
One Crore = 10 million
*31-Mar-18 numbers are on consolidated basis

Saksham – Contributing to the Society

37
Glimpses of Social Interventions
Enhancing Human Potential
• Partnered with The Confederation of Real Estate Developers Association of India
(CREDAI) to conduct Onsite & Offsite skill enhancement training programmes for
construction workers
Reaching Out, Reaching Far
• Collaborated with various NGOs and real estate developers to establish 32 day care
centres on various construction sites for children of construction workers to provide them
with education, hygiene and nutrition
Investing in Education
• Partnered with VIDYA, a NGO working for the underprivileged children
• Adopted two schools with VIDYA to provide quality education to the underprivileged
children
Improving Access to Health Care
• Supported two government hospitals with an aim to improve infrastructure
• Supported operational cost to run cancer patient helpline and outreach clinic for the
patients
• Launched a reproductive health and hygiene programme for young adolescent girls in four
villages in UP
Touched over 25,000 livesNumber on cumulative basis

38
Conferred as the ‘Best
Housing Finance Company of
the Year’ by ET Now Rise with
India – BFSI Awards
Honored in the field of “IT
Security” at CSO 100 Awards
organized by CSO 100 Award
and IDG Security
Recognized as ‘Symbol of
Excellence in the BFSI Sector’
at The Economic Times Best
BFSI Brands 2018
Won bronze award at
Outdoor Advertising Awards
2017, in the financial services
category for its innovative
outdoor campaign executed
during the IPO
Silver award from ABCI (Association
of business communication of India)
for FY16-17 Annual Report
Awarded “IPO of the Year” by
Finance Monthly Magazine (M&A
Award)- a leading international
business publication
Awarded ‘Best Project Finance
Company of the Year’ at Construction
Times Builders Award
Awards and Recognitions
PNB Housing Penguin TV
Commercial has bagged the.
Gold Award at FICCI’s Best
Animated Frames (BAF)
Awards 2018
“Leading Housing Finance
Company 2017” at National
Awards for Best Housing
Finance Companies organized
by CMO Asia
Mr. Nitant Desai (Chief
Centralized Operation &
Technology Officer) has been
awarded amongst Top 100
CIOs of India
Awarded ‘Excellence in
Customer Relation’ at GIHED
CREDAI Property Show 2017
Certified as a “Great Place to Work”
second year in a row. This is a
testament to our work culture which is
based on our core values and on the
tenants of Trust, Pride and
Camaraderie.

Awarded for Brand
Excellence in NBFC
Category
Adjudged Winners for
Brand excellence in
Banking, Finance and
Insurance sector
Felicitated for Valuable
Contribution to CREDAI
Skilling Programme at
CREDAI Conclave 2017
Felicitated at the RICS Cities
Conference 2016 Awarded ‘Certificate of Merit’
as ‘Housing Finance
Company of the Year’
Recognized for Contribution
in Promoting Green
Buildings’ Initiative
Awarded ‘Housing
Finance Company
of the Year’
Awarded for
‘Excellence in
Financial Services’
‘Best Adversity
Management Stories of
Asia Study 2016’ ’
Certified as a “Great Place
to Work” by building a ‘High
Trust, High Performance
Culture
Awarded for contribution
towards CSR at the India
Pride Awards
Awards and Recognitions
39
Listing of PNB Housing on
National Stock Exchange’
PNB Housing Change
intervention story got featured
in Bloomsbury India’s
publication called SWITCH

Corporate Governance
Audit Committee (ACB)
Under section 177 of the Companies Act, 2013. It has 3 members, all are independent directors
Nomination and Remuneration Committee (NRC)
Corporate Social Responsibility Committee (CSR)
Credit Committee of the Board (CCB)
Under section 178 of the Companies Act, 2013. It has 3 members, 2 are independent directors and 1 is a non-executive director
Under section 135 of the Companies Act, 2013. It has 3 members, 1 is independent director, 1 is non-executive director and Managing Director
Under section 179 of the Companies Act, 2013. It has 3 members, 2 are independent directors and Managing Director
Risk Management Committee (RMC)
Committee to oversee various types of risks. It has 5 members, 3 are independent directors, 1 non-executive director and Managing Director
Stakeholders Relationship Committee (SRC)
Under section 178 of the Companies Act, 2013. It has 3 members, 2 are independent directors and Managing Director
40
Board of Directors
Under the provisions of the Companies Act, 2013. It has 10 members, 2 are non-executive directors, 7 are independent directors and Managing Director

Strong Management Team
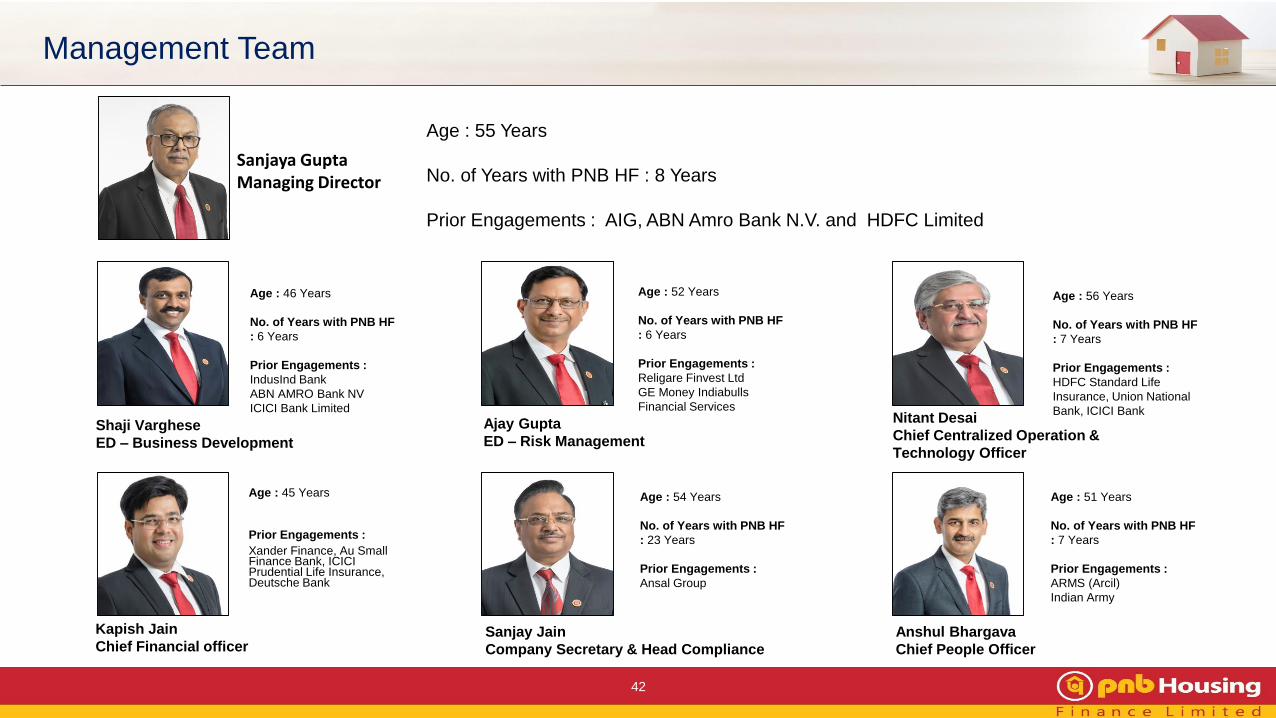
Management Team
Age : 56 Years
No. of Years with PNB HF
: 7 Years
Prior Engagements :
HDFC Standard Life
Insurance, Union National
Bank, ICICI Bank
Age : 46 Years
No. of Years with PNB HF
: 6 Years
Prior Engagements :
IndusInd Bank
ABN AMRO Bank NV
ICICI Bank Limited
Age : 45 Years
Prior Engagements :
Xander Finance, Au Small Finance Bank, ICICI Prudential Life Insurance, Deutsche Bank
Age : 52 Years
No. of Years with PNB HF
: 6 Years
Prior Engagements :
Religare Finvest Ltd
GE Money Indiabulls
Financial Services
Shaji Varghese
ED – Business Development
Kapish Jain
Chief Financial officer
Ajay Gupta
ED – Risk Management
Age : 54 Years
No. of Years with PNB HF
: 23 Years
Prior Engagements :
Ansal Group
Age : 51 Years
No. of Years with PNB HF
: 7 Years
Prior Engagements :
ARMS (Arcil)
Indian Army
Nitant Desai
Chief Centralized Operation &
Technology Officer
Sanjay Jain
Company Secretary & Head Compliance
Anshul Bhargava
Chief People Officer
Sanjaya Gupta Managing Director
Age : 55 Years
No. of Years with PNB HF : 8 Years
Prior Engagements : AIG, ABN Amro Bank N.V. and HDFC Limited
42

43
Mr. Sunil Mehta
Chairman – Non Executive
Age:
58 Years
Current Position:
MD & CEO of PNB
Sunil Kaul
Non Executive Director
Age:
58 Years
Current Position:
MD, Carlyle
Head, SE Asia, FIG,
Carlyle
Shital Kumar Jain
Independent Director
Age:
78 Years
Current Position: Ex
Banker & Credit
Head India, Citigroup
Nilesh S. Vikamsey
Independent Director
Age:
53 Years
Current Position:
Sr. Partner, Khimji
Kunverji and Co
President-ICAI
Sanjaya Gupta
Managing Director
Age:
55 Years
Current Position:
MD, PNB Housing
Finance
Ashwani Kumar Gupta
Independent Director
Age:
63 Years
Current Position:
Financial Consultant
Gourav Vallabh
Independent Director
Age:
40 Years
Current Position:
Professor of Finance,
XLRI
Shubhalakshmi Panse
Independent Director
Age:
64 Years
Current
Position:
Ex-Banker, CMD,
Allahabad Bank
R Chandrasekaran
Independent Director
Age:
60 Years
Current Position:
Founder and Executive
Vice Chairman,
Cognizant
Jayant Dang
Independent Director
Age:
68 Years
Current Position:
Financial Consultant
Highly Experienced Board

44
Economies of
Scale
Diversified
Liability Profile
Robust
Technology
Differentiating
Strategy
Brand
Recognition &
Delivery Model
Indian Housing Finance Sector Poised for Strong Growth
Strong Brand Recognition Coupled with Robust Delivery Model
Differentiated Strategy for Business Expansion
Steady Underwriting Processes,Best-in-Class Asset Quality and benign Credit Costs
Robust Technology Platform in place as Growth Enabler
Well Diversified Borrowing Profile with access to Multiple Sources of Funding
Economies of Scale Delivering Improved Efficiency and Profitability
With 84 branches, ample Opportunity for Expansion
Strong Head
room for
Expansion
44
Best-in-Class
Quality
Strong Industry
Growth
Summary

45
Glossary
ATA Average Total Assets
ATS Average Ticket Size
AUM Asset Under Management
BVPS Book-value per Share
C/I Cost to Income
CAR Capital Adequacy Ratio
CP Commercial Paper
CTLs Corporate Term Loans
DPS Dividend per Share
DSA Direct Selling Agents
ECBs External Commercial Borrowings
EPS Earning per Share
GNPA Gross Non-Performing Assets
HFCs Housing Finance Companies
LAP Loan against Property
LRD Lease Rental Discounting
NCDs Non-Convertible Debentures
NII Net Interest Income
NIM Net Interest Margin
NNPA Net Non-Performing Assets
NPA Non-Performing Assets
NRPLs Non-Residential Premises Loans
PAT Profit After Tax
PCR Provision Coverage Ratio
ROA Return on Assets
ROE Return on Equity

Contact
PNB Housing Finance Limited
CIN: L65922DL1988PLC033856
Ms. Deepika Gupta Padhi - Head-Investor Relations
Phone: +91 11 23445214
www.pnbhousing.com
Thank You
46
Top Related