FY2017: Performance review - Personal Banking, Online ... · Strong performance of non-banking...
78
FY2017: Performance review May 3, 2017
Transcript of FY2017: Performance review - Personal Banking, Online ... · Strong performance of non-banking...

FY2017: Performance
review
May 3, 2017
2
Certain statements in these slides are forward-looking statements.
These statements are based on management's current expectations and
are subject to uncertainty and changes in circumstances. Actual results
may differ materially from those included in these statements due to a
variety of factors. More information about these factors is contained in
ICICI Bank's filings with the US Securities and Exchange Commission.
All financial and other information in these slides, other than financial
and other information for specific subsidiaries where specifically
mentioned, is on an unconsolidated basis for ICICI Bank Limited only
unless specifically stated to be on a consolidated basis for ICICI Bank
Limited and its subsidiaries. Please also refer to the statement of
unconsolidated, consolidated and segmental results required by Indian
regulations that has, along with these slides, been filed with the stock
exchanges in India where ICICI Bank’s equity shares are listed and with
the New York Stock Exchange and the US Securities and Exchange
Commission, and is available on our website www.icicibank.com

3
Savings
Investments
Capital
flows
Protection
Credit

4
₹ 9.9 trillion
Consolidated
assets
18,732
Largest branch +
ATM network
among private
sector banks
₹ 2.4 trillion
Granular retail
portfolio
Period-end CASA
ratio
50.4% ` 265 billion
Operating profit in
FY2017
Tier-1 capital
adequacy
14.35%
Scale & strength

5
Over ₹ 2.6 trillion
Over 110,000
Debit &
credit cards
~79% Over 47 million
Saving a/c
transactions through
digital channels in
H2-2017
Large scale initiatives spanning customer activities and
internal processes
Merchants
added in
four months
Value of mobile
transactions in
FY2017
Virtual
Payment
Addresses
Over 3 million
Over a million
automated
transactions daily
Leadership in technology
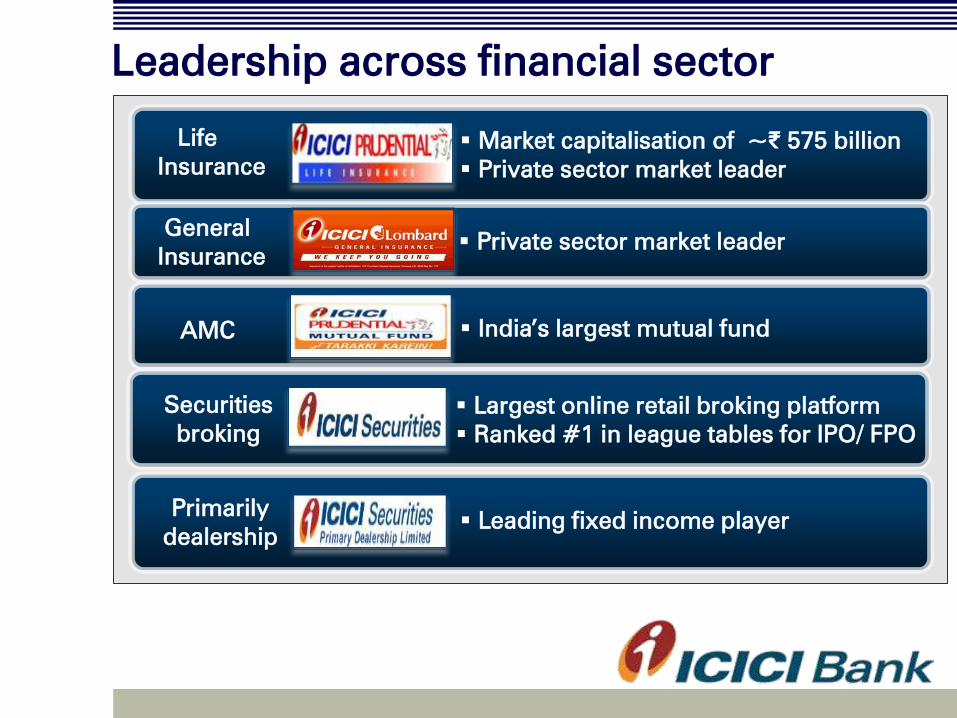
Business Key highlights Market capitalisation of ~₹ 575 billion
Private sector market leader
Life
Insurance
Private sector market leader
General
Insurance
India’s largest mutual fund
AMC
Largest online retail broking platform
Ranked #1 in league tables for IPO/ FPO
Securities
broking
Leading fixed income player Primarily
dealership
Leadership across financial sector

7
FY2017 review
8
P&L indicators
FY2017 review
Credit quality
Subsidiaries
Capital
Growth
Highlights

9
P&L indicators
FY2017 review
Credit quality
Subsidiaries
Capital
Growth
Highlights

10
Key highlights for FY2017
Robust growth in CASA deposits
Healthy loan growth driven by retail
Continued technology leadership with strong growth in usage
of digital channels
Improvement in fee income growth to double digits in H2-2017
Strong performance of non-banking subsidiaries
Net interest margins better than the outlook of
a 20 bps reduction from Q4-2016 level
Continued focus on resolution of stressed borrowers
11
P&L indicators
FY2017 review
Credit quality
Subsidiaries
Capital
Growth
Highlights

12
1.Overseas portfolio decreased by 18.3% y-o-y in US$ terms
Total domestic
Y-o-Y
growth (%)
14.0%
Loan portfolio
Retail
18.5%
SME
17.5%
Corporate
5.8%
Overseas1
(20.1)%
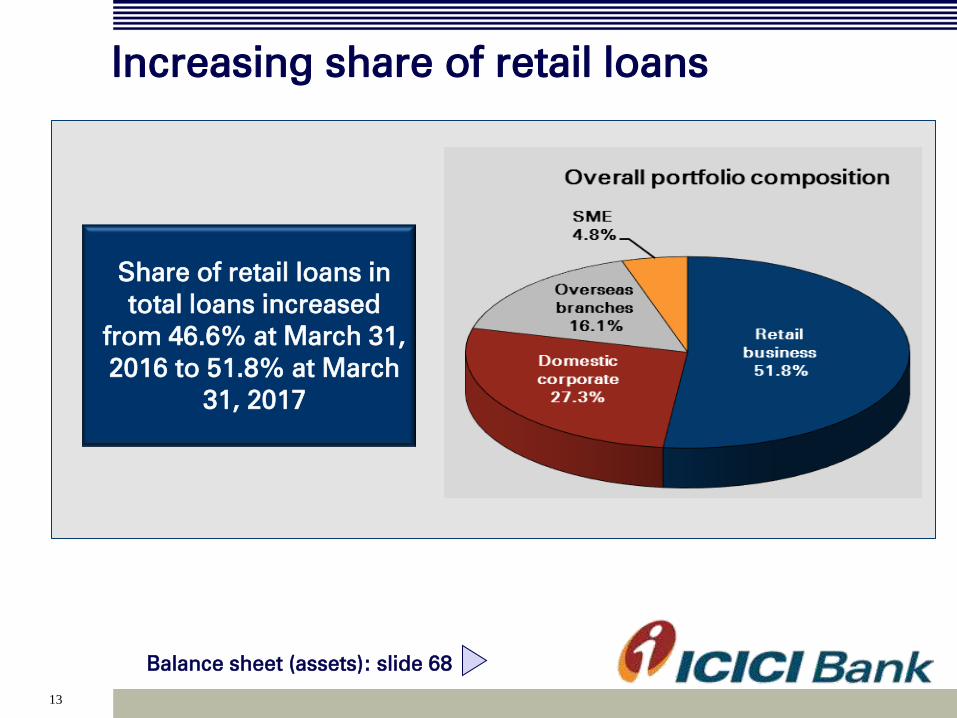
Increasing share of retail loans
Loan growth led by retail
Domestic loan growth at
end-Mar 2017 about 820 bps
higher than system
Total loans of ₹ 4,642.32
billion (6.7% y-o-y growth)
13
Share of retail loans in
total loans increased
from 46.6% at March 31,
2016 to 51.8% at March
31, 2017
Increasing share of retail loans
Balance sheet (assets): slide 68

14
Retail loan growth at 18.5% y-o-
y; sequential increase of 7.2%
1. Dealer funding loans were reclassified from ‘Business banking’ to ‘Others’ in June 2016
2. Vehicle loans include auto loans: 10.6%, commercial business: 6.3% and two-wheeler
loans: 0.1%
3. Others include dealer funding: 1.2% and loan against
securities: 0.7%
Total retail loans at ` 2,403
billion at Mar 31, 2017
Growth across retail products
1
2
3

15
Growth in domestic corporate portfolio at 5.8% y-o-y; growth
in corporate loans, other than non-performing loans,
restructured loans and loans to companies included in
drilldown exposures, was significantly higher
Continued focus on lending to higher rated corporates
Corporate business: focus on selective
lending

16
Robust funding profile
Total deposit growth healthy at 16.3% y-o-y
• Accretion of ₹ 376.08 billion to SA deposits and ₹ 161.14
billion to CA deposits in FY2017
• Accretion of ₹ 64.27 billion to SA deposits and ₹ 84.33
billion to CA deposits in Q4-2017
• 27.8% y-o-y growth in period end CASA deposits at
March 2017
• Proportion of retail deposits at about 76.1%

17
High CASA ratios
Branch network: slide 72
Balance sheet (liabilities): slide 70
Average CASA ratio improved from 40.7% in FY2016
to 43.7% in FY2017

18
Robust growth in mobile banking
transactions
FY-o-FY 100% FY-o-FY 168%
19
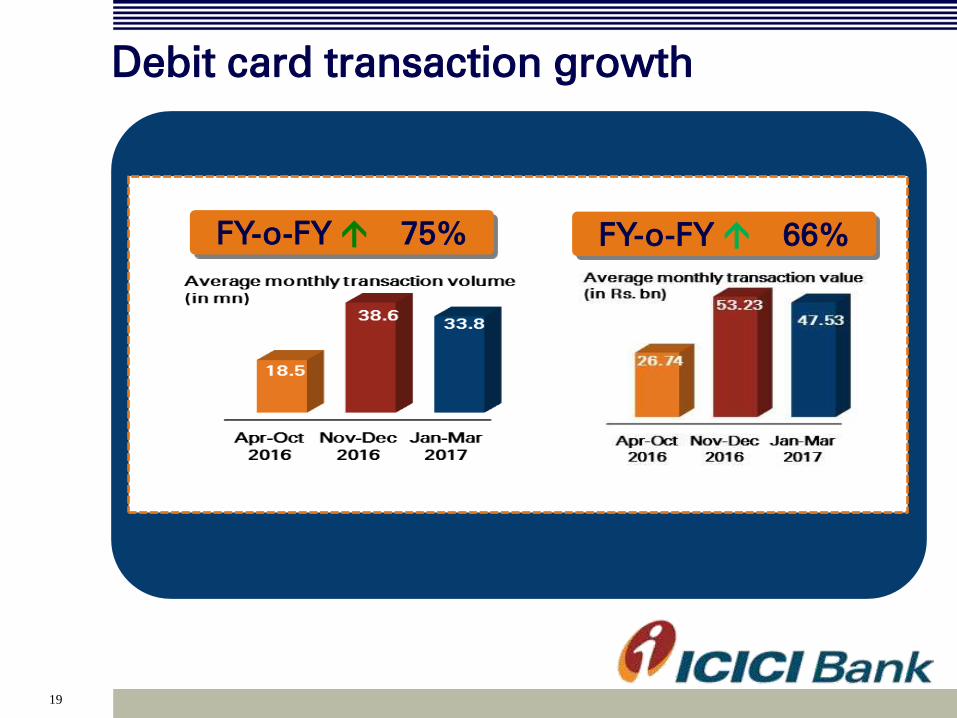
Debit card transaction growth
FY-o-FY 75% FY-o-FY 66%

20
Credit card transaction growth
FY-o-FY 39% FY-o-FY 37%
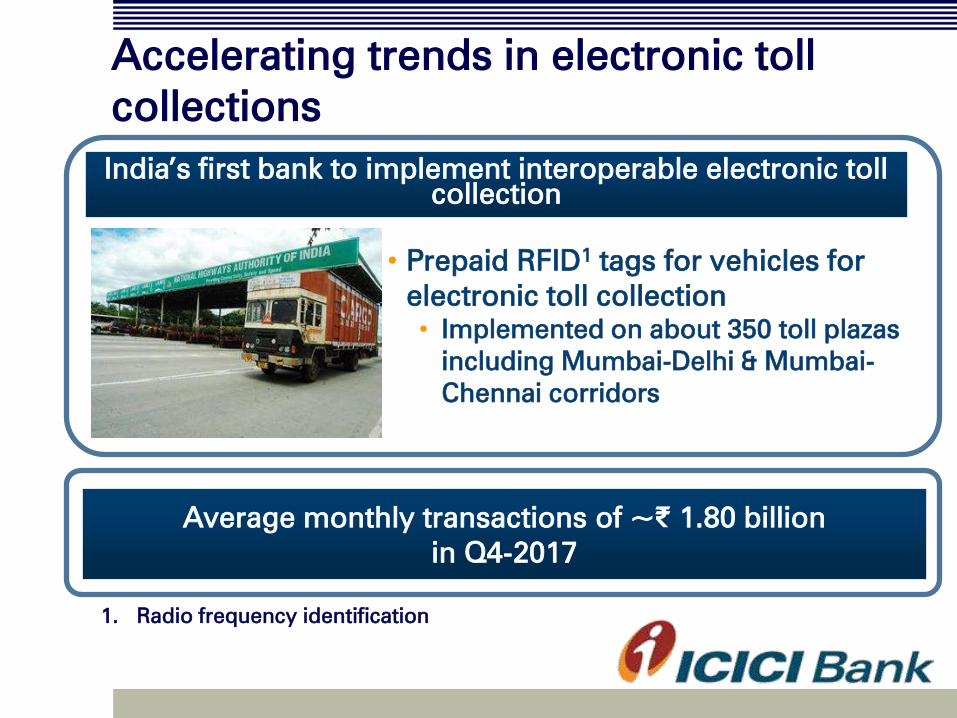
Accelerating trends in electronic toll
collections
India’s first bank to implement interoperable electronic toll
collection
• Prepaid RFID1 tags for vehicles for
electronic toll collection
• Implemented on about 350 toll plazas
including Mumbai-Delhi & Mumbai-
Chennai corridors
Average monthly transactions of ~₹ 1.80 billion
in Q4-2017
1. Radio frequency identification

22
Adoption of digital offerings
1. Includes touch banking, phone banking & debit cards POS transactions
2. Financial and non-financial transactions of savings account customers
1
Channel mix of transactions2 for FY2017
Digital channels1 accounted for about 79% of the
savings account transactions in H2-2017 compared to
71% in H1-2017

23
Key initiatives in Q4-2017
Executed first digitised invoice discounting transaction
on the “Receivables Exchange of India Limited” (RXIL),
Launched ‘Mera iMobile’: India’s first mobile banking
application for rural customers
During FY2017, the Bank undertook an initiative to
transform 100 villages into ‘ICICI Digital Villages’; plan to
scale up to create another 500 ‘ICICI Digital Villages’ in
FY2018
24
P&L indicators
FY2017 review
Credit quality
Subsidiaries
Capital
Growth
Highlights
25
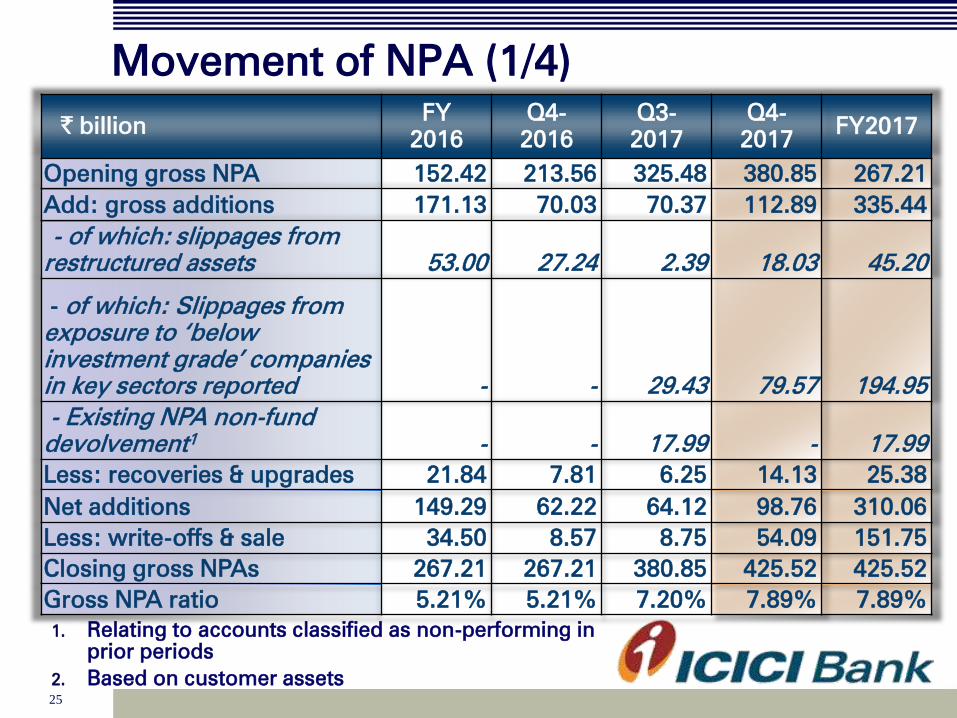
1. Relating to accounts classified as non-performing in
prior periods
2. Based on customer assets
` billion FY
2016
Q4-
2016
Q3-
2017
Q4-
2017 FY2017
Opening gross NPA
152.42 213.56 325.48 380.85 267.21
Add: gross additions
171.13 70.03 70.37 112.89 335.44
- of which:
slippages from
restructured assets 53.00 27.24 2.39 18.03 45.20
- of which: Slippages from
exposure to ‘below
investment grade’ companies
in key sectors reported - - 29.43 79.57 194.95
- Existing NPA non-fund
devolvement1
- - 17.99 - 17.99
Less: recoveries & upgrades 21.84 7.81 6.25 14.13 25.38
Net additions 149.29 62.22 64.12 98.76 310.06
Less: write-offs & sale
34.50 8.57 8.75 54.09 151.75
Closing gross NPAs 267.21 267.21 380.85 425.52 425.52
Gross NPA ratio
5.21% 5.21% 7.20% 7.89% 7.89%
Movement of NPA (1/4)

26
In FY2017, about 80% (~90% in Q4-2017 and ~75% in
Q3-2017) of the gross additions to NPAs for the wholesale
& SME businesses and about 77% (~86% in Q4-2017 and
~71% in Q3-2017) of the total gross additions were on
account of slippages relating to companies internally rated
below investment grade in key sectors, restructured
portfolio and devolvement of non-fund facilities of
accounts classified as non-performing in prior periods
Movement of NPA (2/4)

27
• The additions to NPAs had been gradually declining from ` 82.49
bn in Q1-2017 to ` 80.29 bn in Q2-2017 and ` 70.37 bn in Q3-
2017
• In Q4-2017, the additions to NPAs have been elevated; of the
additions to NPAs, ` 53.78 bn was due to one account in the
cement sector
• This account was included in the drill down exposures to key sectors
disclosed by the Bank and an M&A transaction has been announced
in respect of this company
• While the transaction has received most of the requisite approvals,
including the approval of the National Company Law Tribunal, it is
awaiting certain last-mile approvals due to which the transaction
could not be concluded by March 31, 2017
• As a result, the Bank has classified the account as non-performing as
per the Bank’s application of the relevant RBI guidelines
Movement of NPA (3/4)
28
• Additions to NPAs in Q4-2017 excluding this cement account
were ` 59.11 billion compared to ` 70.37 billion in Q3-2017
• The Bank expects part of the loan to be upgraded on conclusion
of the transaction
Movement of NPA (4/4)

29
Asset quality and provisioning (1/2)
` billion March 31,
2016
December
31, 2016
March 31,
2017
Gross NPAs
267.21 380.85 425.52
Less: cumulative provisions
134.24 179.301
171.011
Net NPAs 132.97 201.55 254.51
Net NPA ratio
2.67% 3.96% 4.89%
Retail NPAs (` billion) March 31,
2016
December
31, 2016
March 31,
2017
Gross retail NPAs
38.25 39.69 36.67
- as a % of gross retail advances
1.86% 1.75% 1.51%
Net retail NPAs 12.44 13.59 12.47
- as a % of net retail advances
0.61% 0.61% 0.52%
Loans aggregating to ` 2.23 billion were eligible for dispensation
as per RBI in Q4-2017 (Q3-2017: ` 1.11 billion)
1. Include floating provisions of ₹ 15.15 billion at December 31, 2016 and nil at
March 31, 2017; floating provisions of ₹ 15.15
billion utilised in Q4-2017

30
Asset quality and provisioning (2/2)
1. Excludes additional provisions against standard assets
• Net investment in security receipts of ARCs was `
32.86 billion at Mar 31, 2017 (Dec 31, 2016: ₹ 28.11
billion); gross NPAs of ` 0.23 billion and SMA-2 loans
of ₹ 5.83 billion sold in Q4-2017
• Non-fund outstanding to restructured assets: ` 16.87
billion at Mar 31, 2017 (Dec 31, 2017: ` 21.29 billion)
• Outstanding general provision on standard assets: `
23.13 billion at March 31, 20171
• Provisioning coverage ratio at 53.6% including
cumulative technical/ prudential write-offs

31
NPA and restructuring trends
` billion March 31,
2016
December
31, 2016
March 31,
2017
Net NPAs (A)
132.97 201.55 254.51
Net restructured loans (B)
85.73 64.07 42.65
Total (A+B) 218.70 265.62 297.16
Total as a % of net
customer assets
4.40% 5.21% 5.70%
RBI, through its circular dated 18th April, 2017, has required banks to
disclose the divergences in the asset classification and provisioning,
arising from RBI’s annual supervisory process, in their notes to
accounts to the financial statements. The Bank has accordingly
included this disclosure in its Notes to the audited financial statements
for the year ended March 31, 2017. Further, as per the normal process
followed by the Bank, all the concerned accounts have been classified
as non-performing and requisite provisions have been made in FY2017

32
Strategic debt restructuring
1. SDR invoked but pending implementation
2. Excludes NPAs
Interest of ₹ 6.06 billion on above accounts not accrued
during FY2017
March 2017
SDR implemented SDR invoked1
` billion % ` billion %
Gross outstanding
amount2
52.40 100.0% 12.08 100.0%
- of which:
restructured loans 16.58 31.6% 6.60 54.6%
- of which: loans to
‘below investment
grade’ companies in
key sectors reported 26.36 50.3% - -
In addition, the Bank is implementing change in
management outside SDR for loans of ` 51.05 billion
(included in the drilldown list)

33
Flexible restructuring under the 5/25
scheme
March 2017 ` billion %
Amount for which 5/25
refinancing implemented
26.751
100.0%
- of which: loans to ‘below
investment grade’ companies
in key sectors reported 17.26 64.5%
1. Excludes NPAs

34
Scheme for sustainable structuring of
stressed assets (S4A)
S4A implemented (` billion) Mar 2017
Gross amount outstanding 2.93
• The above relates to standard accounts in the construction
sector
Interest of ₹ 0.23 billion not accrued during FY2017 on accounts
where S4A was invoked and pending implementation

35
Portfolio trends and approach
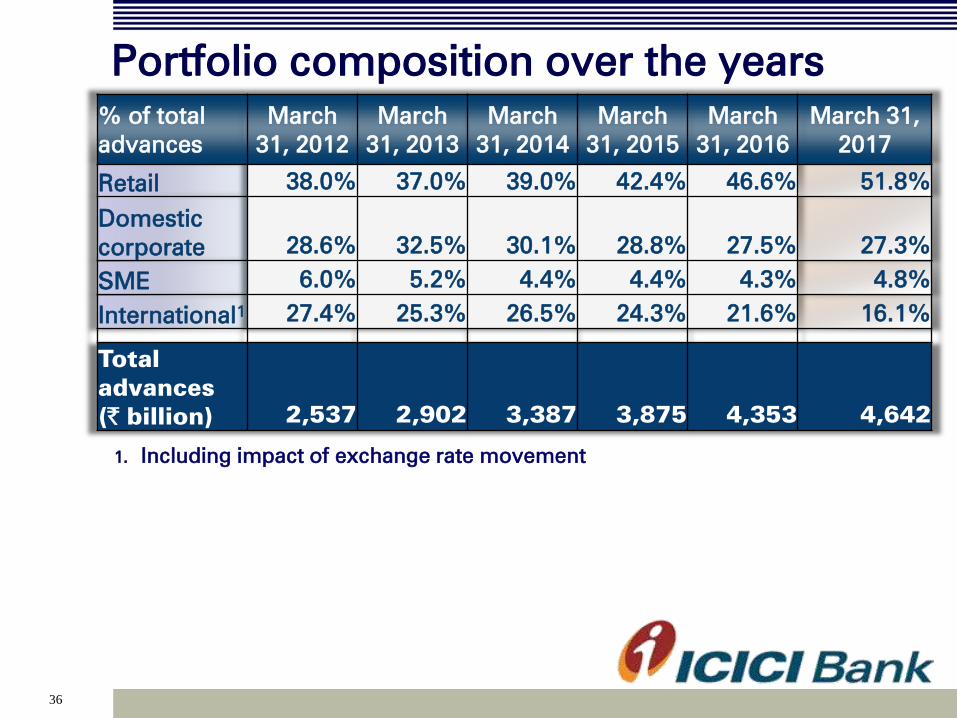
Portfolio composition over the years
36
1. Including impact of exchange rate movement
% of total
advances
March
31, 2012
March
31, 2013
March
31, 2014
March
31, 2015
March
31, 2016
March 31,
2017
Retail 38.0% 37.0% 39.0% 42.4% 46.6% 51.8%
Domestic
corporate 28.6% 32.5% 30.1% 28.8% 27.5% 27.3%
SME 6.0% 5.2% 4.4% 4.4% 4.3% 4.8%
International1 27.4% 25.3% 26.5% 24.3% 21.6% 16.1%
Total
advances
(` billion) 2,537 2,902 3,387 3,875 4,353 4,642

Sector-wise exposures
37
1. Top 10 based on position at March 31, 2017
2. Figures may not be fully comparable with subsequent
periods due to certain reclassifications effective 2013
Top 10 sectors1: % of total
exposure of the Bank
March 31,
20122
March 31,
20132
March
31, 2014
March
31, 2015
March
31, 2016
March
31, 2017
Retail finance 16.2%
18.9%
22.4% 24.7% 27.1% 31.9%
Electronics & engineering 8.1% 8.3% 8.2% 7.6% 7.3% 6.9%
Services – finance 6.6% 6.0% 4.9% 4.2% 4.9% 6.2%
Banks 10.1% 8.8% 8.6% 7.8% 8.0% 6.0%
Crude petroleum/refining &
petrochemicals 5.5% 6.6% 6.2% 7.0% 5.7% 5.5%
Road, port, telecom, urban
development & other infra 5.8% 6.0% 6.0% 5.9% 5.8% 5.3%
Power 7.3% 6.4% 5.9% 5.5% 5.4% 5.1%
Services - non finance 5.5% 5.1% 5.2% 5.0% 4.9% 4.0%
Iron/steel & products 5.2% 5.1% 5.0% 4.8% 4.5% 3.6%
Construction 4.3% 4.2% 4.4% 4.0% 3.4% 3.1%
Total exposure of the
Bank (` billion) 7,133 7,585 7,828 8,535 9,428 9,372

38
In April 2016, the Bank had identified power, iron &
steel, mining, cement and rigs sectors as the key
sectors impacted by the uncertainties and challenges
in the operating environment

Aggregate exposure to key sectors
39
% of total
exposure of
the Bank
March 31,
2012
March 31,
2013
March 31,
2014
March 31,
2015
March 31,
2016
March 31,
2017
Power 7.3% 6.4% 5.9% 5.5% 5.4% 5.1%
Iron/steel
5.2% 5.1% 5.0% 4.8% 4.5% 3.6%
Mining 2.0% 1.7% 1.7% 1.5% 1.6% 1.8%
Cement 1.2% 1.4% 1.4% 1.5% 1.2% 1.1%
Rigs 0.5% 0.5% 0.8% 0.5% 0.6% 0.4%
Total
exposure of
the Bank to
key sectors 16.2% 15.1% 14.8% 13.8% 13.3% 12.0%

Further drilldown: approach
40
All internally ‘below investment grade’ rated companies
in key sectors across domestic corporate, SME and
international branches portfolios
Promoter entities internally ‘below investment grade’
where the underlying is partly linked to the key sectors
SDR relating to key sectors included; ~70% of the 5/25
refinancing relating to key sectors included
Fund-based limits and non-fund based outstanding to
above categories considered
1
2
3
4
Loans already classified as restructured and non-
performing excluded 5

Further drilldown: sector-wise details
41
At December 31, 2016 At March 31, 2017
` billion Exposure1,3,5
% of total
exposure Exposure
1,2,3,5 % of total
exposure
Power 83.48 0.9%
62.31 0.7%
Mining 55.51 0.6%
52.33 0.6%
Iron/steel 44.91 0.5%
39.73 0.4%
Cement 56.80 0.6% 2.94 0.0%
Rigs 0.45 0.0%
0.43 0.0%
Promoter entities4
34.21 0.4%
32.66 0.3%
1. Aggregate fund based limits and non-fund based outstanding
2. Excludes net exposure of ₹ 4.49 bn to central public sector owned undertaking
3. Includes investment exposure
4. Includes promoter entities where underlying is partly linked to the key sectors
5. Includes non-fund based outstanding in respect of accounts included in the
drilldown exposure where the fund based outstanding has been classified as non-
performing during FY2017
6. In addition to above, the non-fund based outstanding to borrowers classified as
non-performing was ₹ 19.32 bn at Mar 31, 2017

42
Further drilldown: movement
₹ billion
Aggregate exposure1,2,3,4,6
FY2017
Opening balance 440.65
Net reduction in exposure (47.58)
Upgrades to ‘investment grade’ (8.71)
Downgrades to ‘below investment grade’ 6.36
Classified as non-performing5 (200.33)
Closing balance 190.39
1. Aggregate fund based limits and non-fund based outstanding
2. Excludes net exposure of ₹ 4.49 bn to central public sector owned undertaking
3. Includes investment exposure
4. Includes promoter entities where underlying is partly linked to the key sectors
5. Includes investment exposure relating to accounts classified as non-performing
6. Includes non-fund based outstanding in respect of accounts included in the
drilldown exposure where the fund based outstanding has been classified as non-
performing during FY2017
7. In addition to above, the non-fund based outstanding to borrowers classified as
non-performing was ₹ 19.32 bn at Mar 31, 2017

43
P&L indicators
FY2017 review
Credit quality
Subsidiaries
Capital
Growth
Highlights

44
Profit & loss statement
` billion FY
2016
Q4-
2016
Q3-
2017
Q4-
2017
FY
2017
Q4-o-Q4
growth
NII
212.24 54.05 53.63 59.62 217.37 10.3%
Non-interest income
(excl. gains on stake
sale in subsidiaries)
119.48 29.78 39.39 30.17 138.23 1.3%
- Fee income 88.20 22.12 24.95 24.46 94.52 10.5%
- Other income1
24.42 7.07 5.51 0.68 14.76 (90.4)%
- Treasury income
6.86 0.59 8.93 5.03 28.95 752.5%
Total income
331.72 83.83 93.02 89.79 355.60 7.1%
Operating expenses
126.83 34.06 37.78 38.67 147.55 13.5%
Operating profit 204.89 49.77 55.24 51.12 208.05 2.7%
1. As per RBI guidelines dated April 18, 2017, banks are not permitted to recognise
proportionate exchange gains or losses held in the FCTR in the P&L account. The
Bank has therefore reversed foreign exchange gain amounting to ` 2.88 bn in Q4-
2017, which was recognised as other income in 9M-2017. Accordingly, other
income includes net foreign exchange gain relating to overseas operations
amounting to ` 9.41 bn in FY2016, ` 2.61 bn in
Q4-2016, ` 0.82 bn in Q3-2017 (reversed in Q4-2017)
and nil in FY2017

45
Profit & loss statement
` billion FY
2016
Q4-
2016
Q3-
2017
Q4-
2017
FY
2017
Q4-o-Q4
growth
Operating profit 204.89 49.77 55.24 51.12 208.05 2.7%
Gains on stake sale in
subsidiaries
33.74 21.31 - - 56.82 -
Operating profit (incl.
gains on stake sale in
subsidiaries) 238.63 71.08 55.24 51.12 264.87 (28.1)%
Provisions1,2
80.67 33.26 27.13 28.98 152.08 (12.9)%
Collective contingency &
related reserve 36.00 36.00 - - - -
Profit before tax 121.96 1.82 28.11 22.14 112.79 -
Tax 24.70 (5.20) 3.69 1.89 14.78 -
Profit after tax 97.26 7.02 24.42 20.25 98.01 188.5%
1. Drawdown from the collective contingency & related reserve of ₹ 5.27 bn in Q3-
2017, ` 15.28 bn in Q4-2017 and ₹ 36.00 bn in FY2017
2. Floating provisions of ₹ 15.15 billion utilised in Q4-2017
46
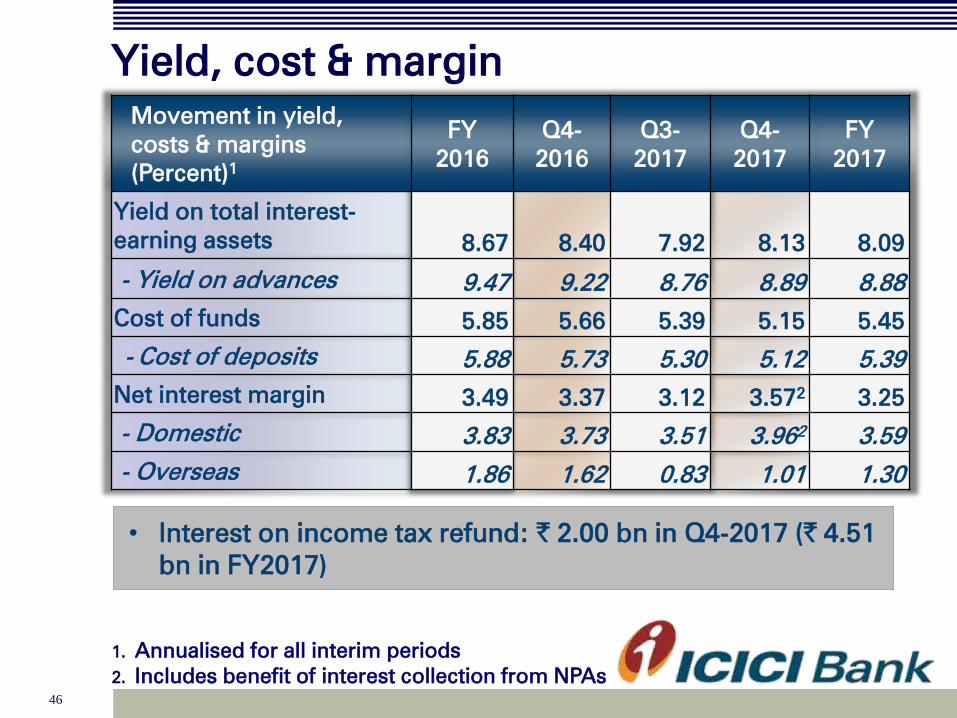
Yield, cost & margin
Movement in yield,
costs & margins
(Percent)1
FY
2016
Q4-
2016
Q3-
2017
Q4-
2017
FY
2017
Yield on total interest-
earning assets
8.67 8.40 7.92 8.13 8.09
- Yield on advances
9.47 9.22 8.76 8.89 8.88
Cost of funds
5.85 5.66 5.39 5.15 5.45
- Cost of deposits
5.88 5.73 5.30 5.12 5.39
Net interest margin
3.49 3.37 3.12 3.572
3.25
- Domestic 3.83 3.73 3.51 3.962
3.59
- Overseas 1.86 1.62 0.83 1.01 1.30
1. Annualised for all interim periods
2. Includes benefit of interest collection from NPAs
• Interest on income tax refund: ` 2.00 bn in Q4-2017 (` 4.51
bn in FY2017)

47
Other key ratios
Percent
FY
2016
Q4-
2016
Q3-
2017
Q4-
2017
FY
2017
Return on average networth1
11.3
3.2 10.1 8.3 10.32
Return on average assets1
1.49 0.41 1.30 1.10 1.35
Weighted average EPS1
16.8 4.9 16.7 14.1 16.8
Book value (`)
154
154 168 172 1722
Fee to income 24.1 21.0 26.8 27.2 22.9
Cost to income 34.72
32.42
40.6
43.1 35.83
Average CASA ratio 40.7 40.5 44.8 46.5 43.7
1. Annualised for all interim periods
2. According to the revised AS 4 – ‘Contingencies and events occurring after the
balance sheet date’ as notified by the Ministry of Corporate Affairs through
amendments to Companies (Accounting Standards) Amendment Rules, 2016, the
Bank has not accounted for proposed dividend (including dividend distribution tax)
as a liability for FY2017. However, the Bank has reduced proposed dividend for
determining capital funds for computing capital adequacy ratio at March 31, 2017
3. Includes gain on sale of stake in insurance
subsidiaries

48
P&L indicators
FY2017 review
Credit quality
Subsidiaries
Capital
Growth
Highlights

49
Domestic subsidiaries

50
ICICI Life (1/2)
1. FY2016 PAT as per audited financials
2. All expenses (including commission) / (Total
premium – 90% of single premium)
3. Source: Life Insurance Council; Retail weighted
received premium basis
The company continues to retain its market leadership
among the private players with an overall market share of
12.0%3 and private market share of 22.3%
3 in FY2017
` billion FY2016 Q4-2016 Q4-2017 FY2017
New business premium
67.66 20.03 25.60 78.63
Renewal premium
123.99 43.83 50.20 144.91
Total premium 191.64 63.86 75.79 223.54
Profit after tax1
16.50 4.03 4.08 16.82
Assets under management 1,039.39 1,039.39 1,229.19 1,229.19
Annualized premium
equivalent (APE) 51.70 16.76 21.67 66.25
Expense ratio2 14.5% 11.7% 13.5% 15.1%

51
ICICI Life (2/2)
• Proportion of protection business increased from 2.7%
in FY2016 to 3.9% in FY2017
• Value of New Business (VNB) Margins1 increased from
5.7% in FY2015 and 8.0% in FY2016 to 10.1% in
FY2017
• Indian Embedded Value increased from ₹ 139.39 billion
at Mar 31, 2016 to ₹ 161.84 billion at Mar 31, 2017
1. Indian Embedded Value basis on actual cost
2. At April 26, 2017
Market capitalisation of ICICI Life was ~₹ 575 bn2 valuing the
Bank’s 54.9% shareholding in ICICI Life at ₹ 315 bn

52
ICICI General
` billion FY2016 Q4-2016 Q4-2017 FY2017
Gross written premium 82.96 21.14 27.10 109.60
Profit before tax 7.08 1.67 2.49 9.10
Profit after tax 5.07 1.19 1.80 7.02
1. Source: General Insurance Council
Sustained leadership in private sector with an overall
market share of 8.4%1 and private sector market share of -
18.0%1 in FY2017

53
Other subsidiaries
Slide 73
Profit after tax (` billion)
FY2016 Q4-2016 Q4-2017 FY2017
ICICI Prudential
Asset Management 3.26 0.80 1.21 4.80
ICICI Securities
Primary Dealership 1.95 0.12 (0.17) 4.12
ICICI Securities
(Consolidated) 2.39 0.63 0.83 3.39
ICICI Venture (0.21) (0.06) 0.08 0.09
ICICI Home Finance 1.80 0.44 0.58 1.83

54
Overseas subsidiaries

55
ICICI Bank UK
Asset and liability composition: slide 74
USD million FY2016 Q4-2016 Q4-2017 FY2017
Net interest income 71.5 19.3 15.9 65.6
Profit after tax 0.5 (1.1) (20.5) (16.1)
Loans and advances 3,144.1 3,144.1 2,362.4 2,362.4
Deposits 2,466.9 2,466.9 1,648.6 1,648.6
- Retail term deposits 738.5 738.5 407.7 407.7
Capital adequacy ratio 16.7% 16.7% 18.4% 18.4%
- Tier I 13.1% 13.1% 15.5% 15.5%
Loss in FY2017 was on account of higher provisions on
impaired loans

56
ICICI Bank Canada
Asset and liability composition: slide 75
CAD million FY2016 Q4-2016 Q4-2017 FY2017
Net interest income
82.8 22.0 18.1 77.2
Profit/(loss) after tax
22.4 2.6 6.2 (33.0)
Loans and advances 5,767.4 5,767.4 5,593.6 5,593.6
- Insured mortgages 3,236.8 3,236.8 3,454.3 3,454.3
Deposits 2,732.1 2,732.1 2,556.1 2,556.1
Capital adequacy ratio 23.6% 23.6% 21.8% 21.8%
- Tier I
23.6% 23.6% 21.8% 21.8%
• The loss in FY2017 was primarily on account of higher
provisions on existing impaired loans
• In Q4-2017, ICICI Bank Canada repatriated 65.0 mn CAD of
equity capital and redeemed 55.6 mn CAD of preference
share capital

57
Consolidated financials
58
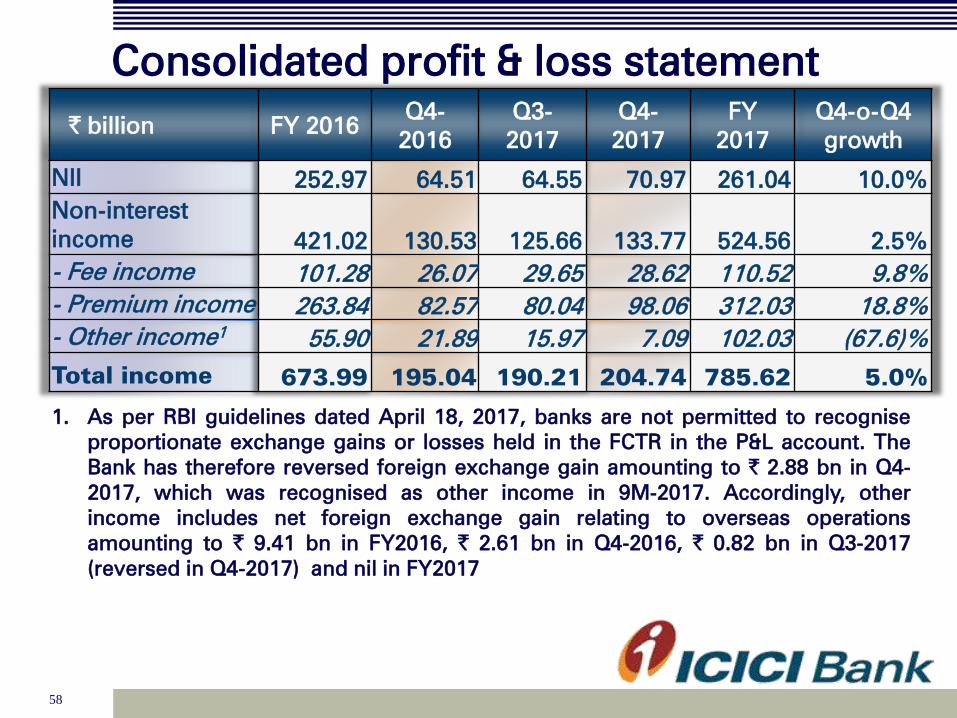
Consolidated profit & loss statement
` billion FY 2016 Q4-
2016
Q3-
2017
Q4-
2017
FY
2017
Q4-o-Q4
growth
NII
252.97 64.51 64.55 70.97 261.04 10.0%
Non-interest
income 421.02 130.53 125.66 133.77 524.56 2.5%
- Fee income 101.28 26.07 29.65 28.62 110.52 9.8%
- Premium income
263.84 82.57 80.04 98.06 312.03 18.8%
- Other income1
55.90 21.89 15.97 7.09 102.03 (67.6)%
Total income 673.99 195.04 190.21 204.74 785.62 5.0%
1. As per RBI guidelines dated April 18, 2017, banks are not permitted to recognise
proportionate exchange gains or losses held in the FCTR in the P&L account. The
Bank has therefore reversed foreign exchange gain amounting to ` 2.88 bn in Q4-
2017, which was recognised as other income in 9M-2017. Accordingly, other
income includes net foreign exchange gain relating to overseas operations
amounting to ` 9.41 bn in FY2016, ` 2.61 bn in Q4-2016, ` 0.82 bn in Q3-2017
(reversed in Q4-2017) and nil in FY2017
59
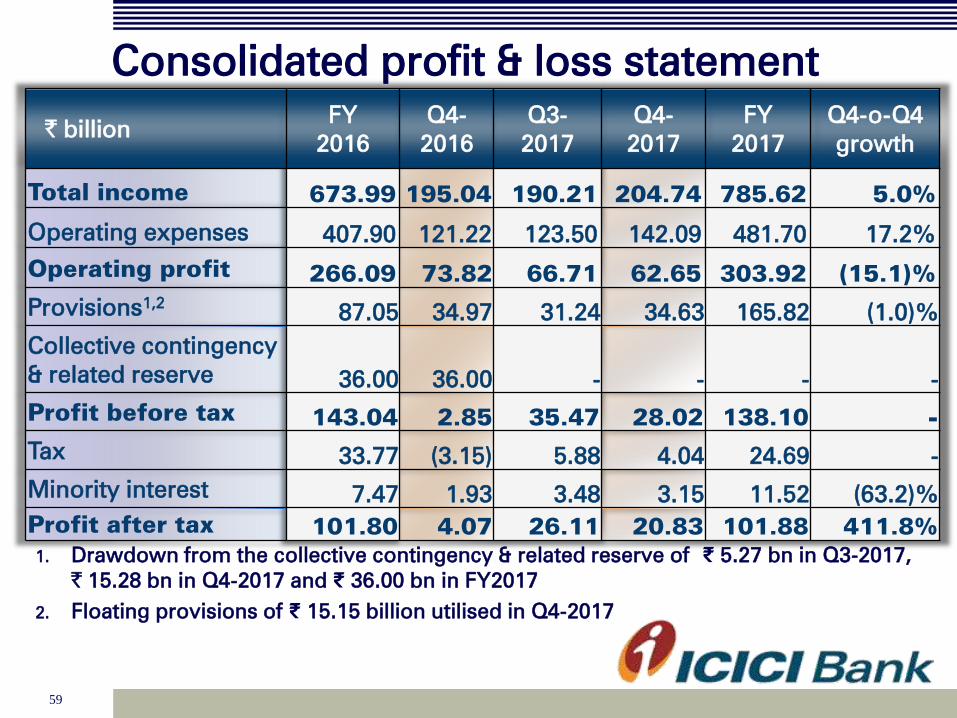
Consolidated profit & loss statement
` billion FY
2016
Q4-
2016
Q3-
2017
Q4-
2017
FY
2017
Q4-o-Q4
growth
Total income 673.99 195.04 190.21 204.74 785.62 5.0%
Operating expenses
407.90 121.22 123.50 142.09 481.70 17.2%
Operating profit 266.09 73.82 66.71 62.65 303.92 (15.1)%
Provisions1,2
87.05 34.97 31.24 34.63 165.82 (1.0)%
Collective contingency
& related reserve 36.00 36.00 - - - -
Profit before tax 143.04 2.85 35.47 28.02 138.10 -
Tax 33.77 (3.15) 5.88 4.04 24.69 -
Minority interest 7.47 1.93 3.48 3.15 11.52 (63.2)%
Profit after tax 101.80 4.07 26.11 20.83 101.88 411.8%
1. Drawdown from the collective contingency & related reserve of ₹ 5.27 bn in Q3-2017,
` 15.28 bn in Q4-2017 and ₹ 36.00 bn in FY2017
2. Floating provisions of ₹ 15.15 billion utilised in Q4-2017

60
Key ratios (consolidated)
Percent
FY 2016 Q4-
2016
Q3-
2017
Q4-
2017 FY2017
Return on average
networth1,2,3
11.3
1.7 10.4 9.0 10.3
Weighted average
EPS (`)1
17.5 2.8 17.8 16.2 17.5
Book value (`)3
162
162 175 179 179
1. Based on quarterly average networth
2. Annualised for all interim periods
3. According to the revised AS 4 – ‘Contingencies and events occurring after the
balance sheet date’ as notified by the Ministry of Corporate Affairs through
amendments to Companies (Accounting Standards) Amendment Rules, 2016,
the Bank has not accounted for proposed dividend (including dividend
distribution tax) as a liability for FY2017. However, the Bank has reduced
proposed dividend for determining capital funds for computing capital
adequacy ratio at March 31, 2017
Consolidated balance sheet: slide 65

61
P&L indicators
FY2017 review
Credit quality
Subsidiaries
Capital
Growth
Highlights

62
Capital adequacy
Excess Tier-1 ratio of 6.06% over the minimum requirement of
8.30% as per current RBI guidelines
• Capital ratios significantly higher
than regulatory requirements
• Tier-1 capital is composed almost
entirely of core equity capital
• Substantial scope to raise Additional
Tier-1 and Tier-2 capital
Mar 31, 2017
Tie
r I
CA
R
17.39%1
14.36%1
Standalone
Capital adequacy ratios: slide 77
2.9% y-o-y growth in risk weighted assets compared to 7.1%
y-o-y growth in total assets
During the quarter, the Bank raised ` 34.25 billion by way of
issuance of Additional Tier-I bonds
1. Without considering the impact of dividend

Recommendation of dividend and issue of
bonus shares
• The Bank’s standalone earnings per share for
FY2017 was ` 16.84
• The Board has recommended a dividend of ` 2.50
per share, and an issue of bonus shares in the ratio
of one equity share (including ADS underlying
equity shares) for every 10 equity shares
• The declaration and payment of dividend and issue
of bonus shares are subject to requisite approvals
• The record/book closure dates will be announced in
due course

64
Sharp focus on strategic priorities: 4x4
agenda
Robust funding profile Digital leadership & strong
customer franchise
Continued cost efficiency Focus on capital efficiency
including value unlocking
Monitoring focus Improvement in portfolio
mix
Concentration risk
reduction Resolution of stress cases
En
han
cin
g
fran
ch
ise
Po
rtfo
lio
qu
ality

In summary (1/2)
65
Continued technology leadership with strong growth in
usage of digital channels 3
Healthy portfolio growth driven by retail business 1
Robust growth in CASA deposits 2
Continued cost efficiency and capital efficiency 4
In summary (2/2)
66
Demonstration of significant value in insurance
subsidiaries 6
Reduction in exposure to ‘below investment grade’
rated companies in key sectors and promoter entities 5
Strong performance and value unlocking in non-banking
subsidiaries 7

67
Thank you

68
Balance sheet: assets
` billion March 31,
2016
December
31, 2016
March 31,
2017
Y-o-Y
growth
Cash & bank balances 598.69 611.67 757.13 26.5%
Investments 1,604.12 1,689.87 1,615.07 0.7%
- SLR investments 1,104.06 1,227.35 1,085.40 (1.7)%
- Equity investment in
subsidiaries 107.63 105.82 103.23 (4.1)%
Advances
4,352.64 4,574.69 4,642.32 6.7%
Fixed & other assets 651.50 701.74 703.39 8.0%
- RIDF 1and related 280.66 260.58 241.13 (14.1)%
Total assets 7,206.95 7,577.97 7,717.91 7.1%
Net investment in security receipts of asset reconstruction
companies was ` 32.86 billion at March 31, 2017 (December 31,
2016: ₹ 28.11 billion)
1. Rural Infrastructure Development Fund

69
Equity investment in subsidiaries
` billion March 31,
2016
December
31, 2016
March 31,
2017
ICICI Prudential Life Insurance 35.07 33.26 33.26
ICICI Bank Canada 25.31 25.31 22.73
ICICI Bank UK 18.05 18.05 18.05
ICICI Lombard General Insurance 13.81 13.81 13.81
ICICI Home Finance 11.12 11.12 11.12
ICICI Securities Limited 1.87 1.87 1.87
ICICI Securities Primary
Dealership 1.58 1.58 1.58
ICICI AMC 0.61 0.61 0.61
ICICI Venture Funds Mgmt 0.05 0.05 0.05
Others 0.14 0.14 0.14
Total 107.63 105.82 103.23
Increasing share of retail loans: slide 13

70
Balance sheet: liabilities
` billion March 31,
2016
December
31, 2016
March 31,
2017
Y-o-Y
growth
Net worth1
897.36 975.14 999.51 11.4%
- Equity capital 11.63 11.64 11.65 0.2%
- Reserves
885.73 963.50 987.86 11.5%
Deposits 4,214.26 4,652.84 4,900.39 16.3%
- Savings 1,342.30 1,654.11 1,718.38 28.0%
- Current 588.70 665.50 749.83 27.4%
Borrowings2,3
1,748.07 1,590.98 1,475.56 (15.6%)
Other liabilities
347.26 359.01 342.45 (1.4%)
Total liabilities 7,206.95 7,577.97 7,717.91 7.1%
Credit/deposit ratio of 80.5% on the domestic balance sheet at
March 31, 2017
1. Dividend not being deducted from net worth at March
31, 2017 in line with applicable norms
2. Borrowings include preference shares amounting to ₹
3.50 billion
3. Including impact of exchange rate movement

71
Composition of borrowings
` billion March 31,
2016
December
31, 2016
March 31,
2017
Domestic 788.29 713.52 672.08
- Capital instruments1 361.90 315.83 345.90
- Other borrowings 426.39 397.69 326.17
- Long term infrastructure
bonds 68.50 172.25 172.55
Overseas2 959.78 877.46 803.48
- Capital instruments 22.52 - -
- Other borrowings 937.26 877.46 803.48
Total borrowings2 1,748.07 1,590.98 1,475.56
Raised ₹ 34.25 billion Additional Tier-I bonds in Q4-2017
1. Includes preference share capital ` 3.50 billion
2. Including impact of exchange rate movement
High CASA ratios: slide 17
72
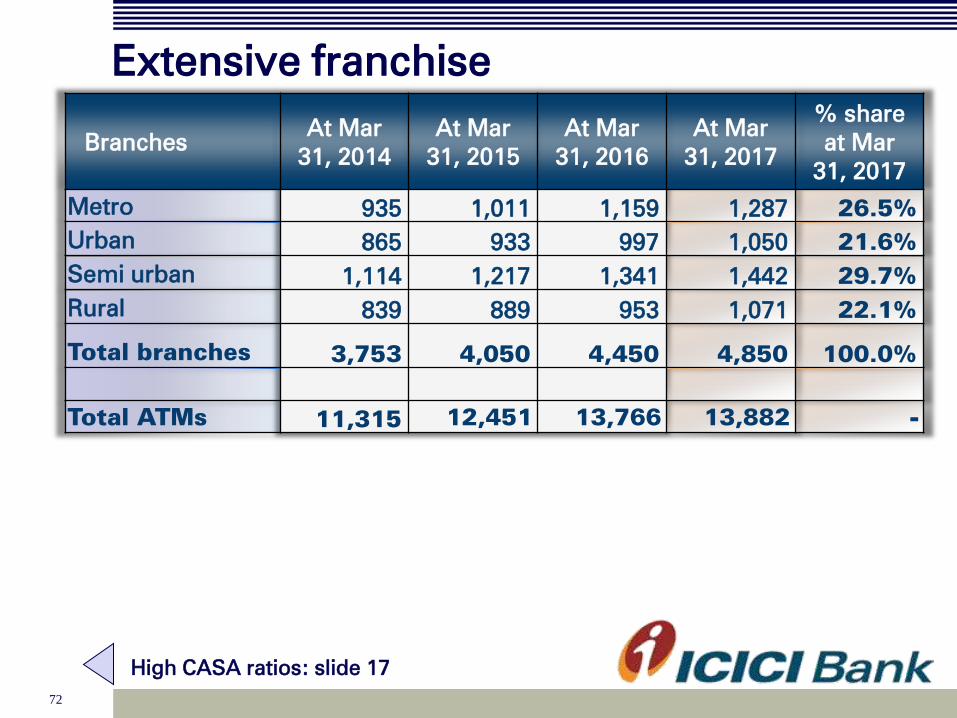
Extensive franchise
Branches At Mar
31, 2014
At Mar
31, 2015
At Mar
31, 2016
At Mar
31, 2017
% share
at Mar
31, 2017
Metro 935 1,011 1,159 1,287 26.5%
Urban 865 933 997 1,050 21.6%
Semi urban 1,114 1,217 1,341 1,442 29.7%
Rural 839 889 953 1,071 22.1%
Total branches 3,753 4,050 4,450 4,850 100.0%
Total ATMs 11,315 12,451 13,766 13,882 -
High CASA ratios: slide 17

73
ICICI Home Finance
` billion FY2016 FY2017
Loans and advances 87.22 89.73
Capital adequacy
ratio 26.1% 26.9%
Net NPA ratio 0.60% 0.75%
Other subsidiaries: slide 53

74
ICICI Bank UK1
ICICI Bank UK key performance highlights: slide 55
Asset profile Liability profile
Total liabilities: USD 3.5 bn Total assets: USD 3.5 bn
1. At March 31, 2017
2. Includes cash & advances to banks, T Bills
3. Includes securities re-classified to loans & advances
2
3

75
ICICI Bank Canada1
1. At March 31, 2017
2. Includes cash & placements with banks and government securities
3. Based on IFRS, securitised portfolio of CAD 3,144 mn considered as part of insured
mortgage portfolio at March 31, 2017
4. As per IFRS, proceeds of CAD 3,106 mn from sale of securitised portfolio considered as
part of borrowings at March 31, 2017
Total liabilities: CAD 6.3 bn Total assets: CAD 6.3 bn
Liability profile Asset profile
ICICI Bank Canada key performance highlights: slide 56
2
3 4

76
Consolidated balance sheet
` billion March 31,
2016
December
31, 2016
March 31,
2017
Y-o-Y
growth
Cash & bank balances
650.36 663.53 804.91 23.8%
Investments
2,860.44 3,048.30 3,045.02 6.5%
Advances 4,937.29 5,107.04 5,153.17 4.4%
Fixed & other assets 739.47 825.30 857.33 15.9%
Total assets
9,187.56 9,644.17 9,860.43 7.3%
Net worth1
941.11 1,020.32 1,046.32 11.2%
Minority interest
33.55 45.36 48.65 45.0%
Deposits 4,510.77 4,895.21 5,125.87 13.6%
Borrowings 2,203.78 2,000.27 1,882.87 (14.6)%
Liabilities on policies in force 970.53 1,070.90 1,154.97 19.0%
Other liabilities 527.82 612.11 601.75 14.0%
Total liabilities
9,187.56 9,644.17 9,860.43 7.3%
Key ratios (consolidated): slide 50
1. Dividend not being deducted from net worth at March 31, 2017 in line with
applicable norms

77
Capital adequacy (1/2)
Standalone Basel III March 31, 2016
March 31, 2017
₹ billion % ₹ billion %
Total capital
1,009.95 16.64% 1,086.66 17.39%
- Tier I
794.82 13.09% 897.25 14.36%
- Tier II 215.13 3.55% 189.41 3.03%
Risk weighted assets
6,071.13 6,248.02
- On balance sheet 5,021.17 5,344.11
- Off balance sheet 1,049.95 903.91
1. After reckoning the impact of proposed dividend

78
Capital adequacy (2/2)
Consolidated Basel III March 31, 2016
March 31, 2017
% %
Total capital
16.60% 17.26%
- Tier I
13.13% 14.39%
- Tier II 3.47% 2.87%
Capital adequacy: slide 62
1. After reckoning the impact of proposed dividend