


Languages
Pages
Legal

1
POWER SECTOR TRANSFORMATION
2
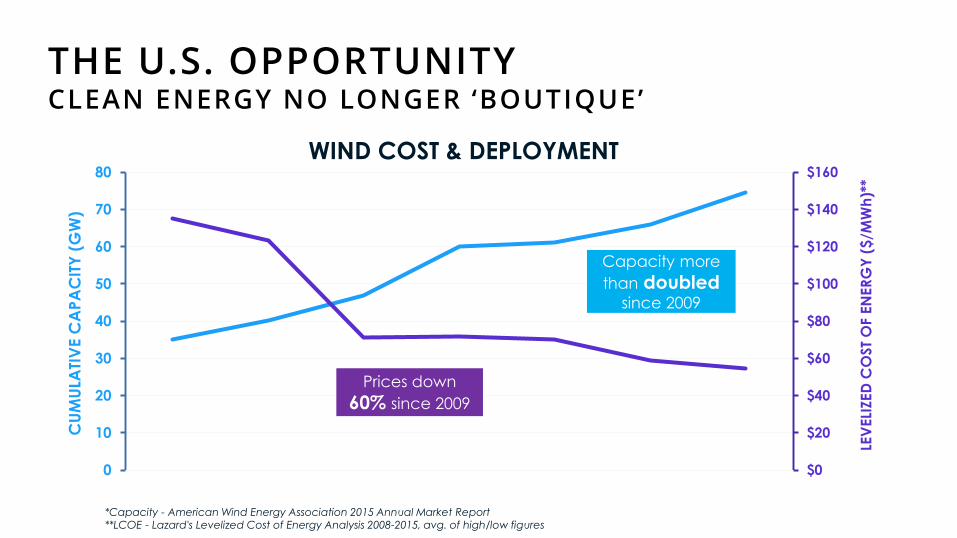
THE U.S. OPPORTUNITY CLEAN ENERGY NO LONGER ‘BOUTIQUE’
$0
$20
$40
$60
$80
$100
$120
$140
$160
0
10
20
30
40
50
60
70
80
2009 2010 2011 2012 2013 2014 2015
LEV
ELI
ZED
CO
ST
OF E
NER
GY
($
/MW
h)*
*
CU
MU
LATI
VE C
AP
AC
ITY
(G
W)
WIND COST & DEPLOYMENT
*Capacity - American Wind Energy Association 2015 Annual Market Report **LCOE - Lazard's Levelized Cost of Energy Analysis 2008-2015, avg. of high/low figures
Prices down
60% since 2009
Capacity more
than doubled
since 2009
3
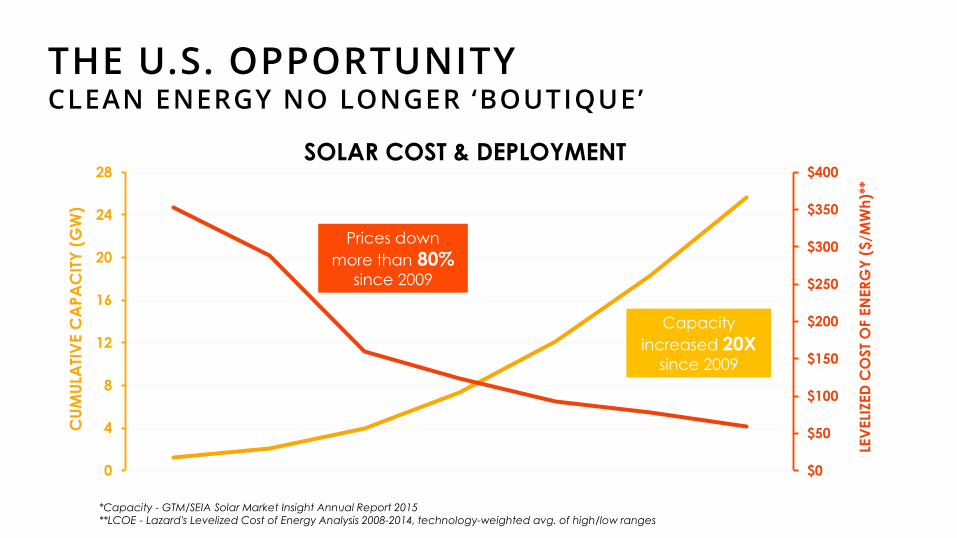
THE U.S. OPPORTUNITY CLEAN ENERGY NO LONGER ‘BOUTIQUE’
$0
$50
$100
$150
$200
$250
$300
$350
$400
0
4
8
12
16
20
24
28
2009 2010 2011 2012 2013 2014 2015
LEV
ELI
ZED
CO
ST
OF E
NER
GY
($
/MW
h)*
*
CU
MU
LATI
VE C
AP
AC
ITY
(G
W)
SOLAR COST & DEPLOYMENT
*Capacity - GTM/SEIA Solar Market Insight Annual Report 2015 **LCOE - Lazard's Levelized Cost of Energy Analysis 2008-2014, technology-weighted avg. of high/low ranges
Prices down
more than 80% since 2009
Capacity
increased 20X
since 2009
4
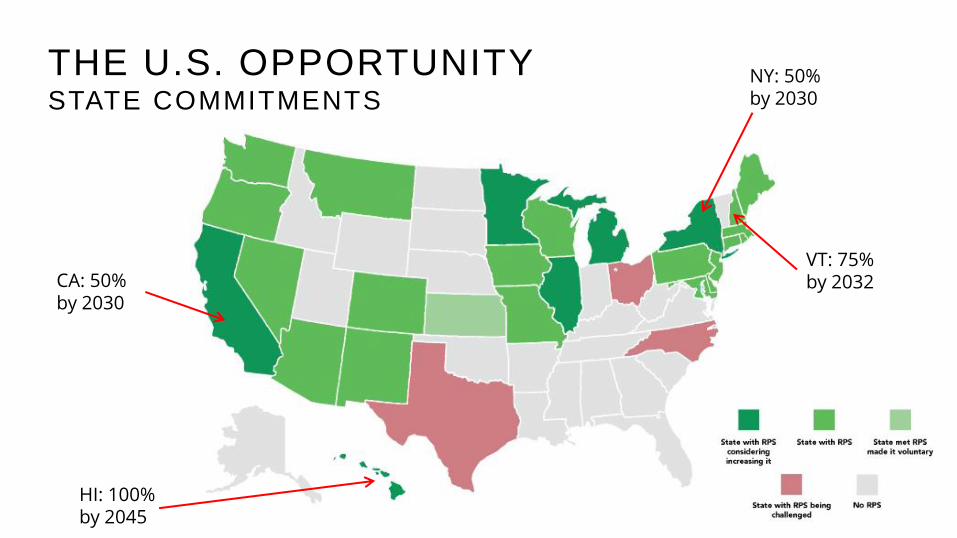
THE U.S. OPPORTUNITY STATE COMMITMENTS
CA: 50% by 2030
HI: 100% by 2045
VT: 75% by 2032
NY: 50% by 2030
5
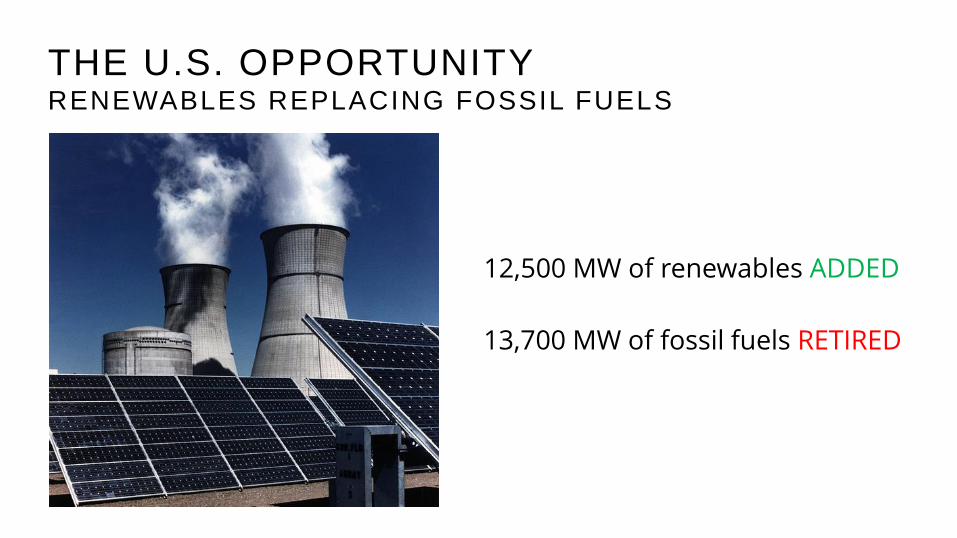
THE U.S. OPPORTUNITY RENEWABLES REPLACING FOSSIL FUELS
12,500 MW of renewables ADDED
13,700 MW of fossil fuels RETIRED
6
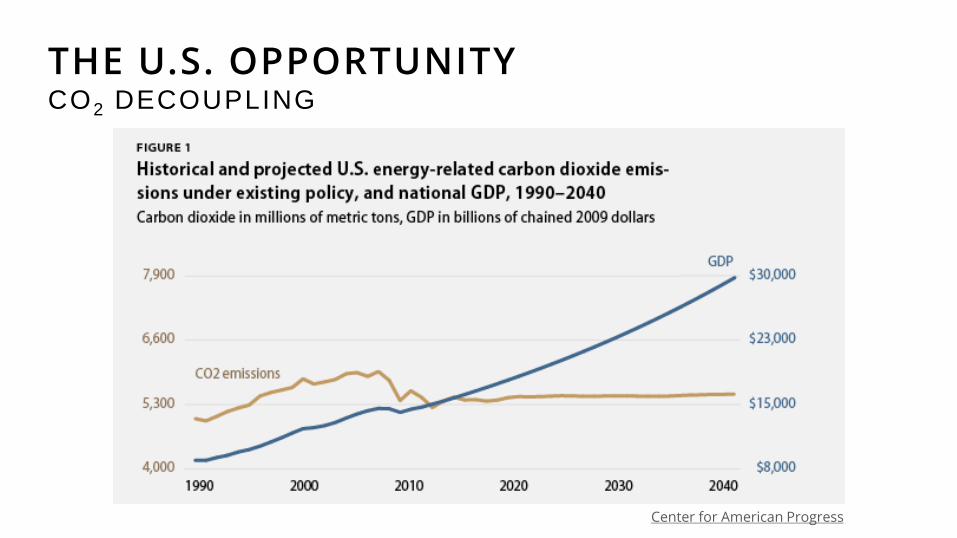
THE U.S. OPPORTUNITY CO2 DECOUPLING
Source: Center for American Progress
7
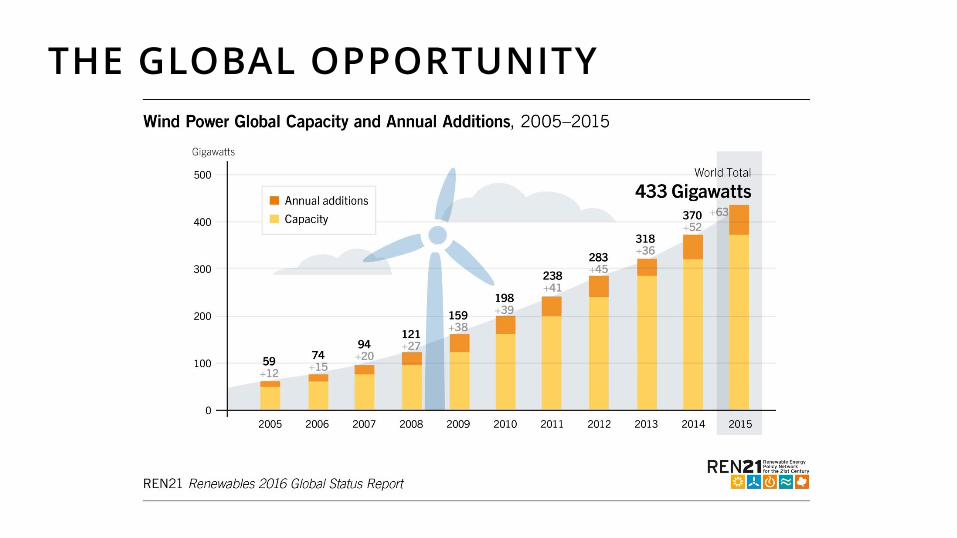
THE GLOBAL OPPORTUNITY
8
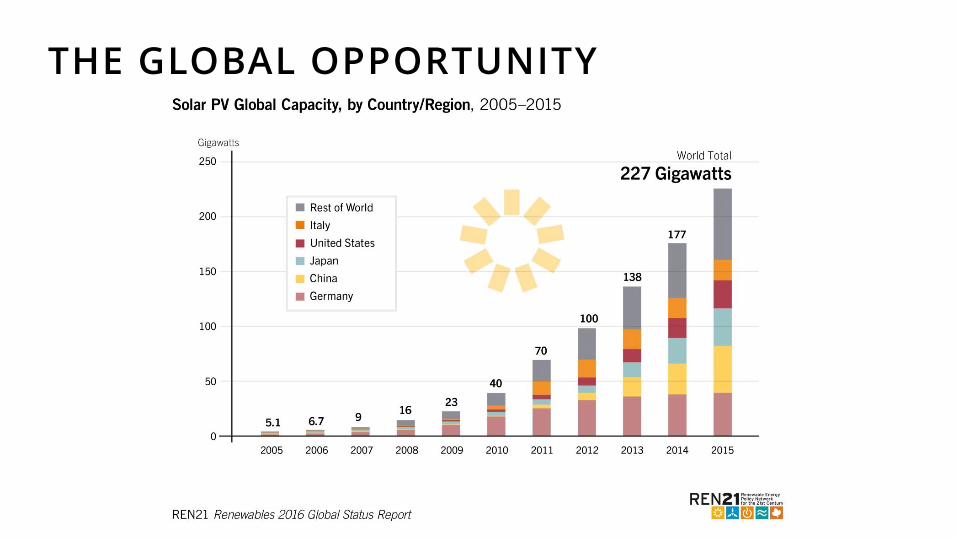
THE GLOBAL OPPORTUNITY
9
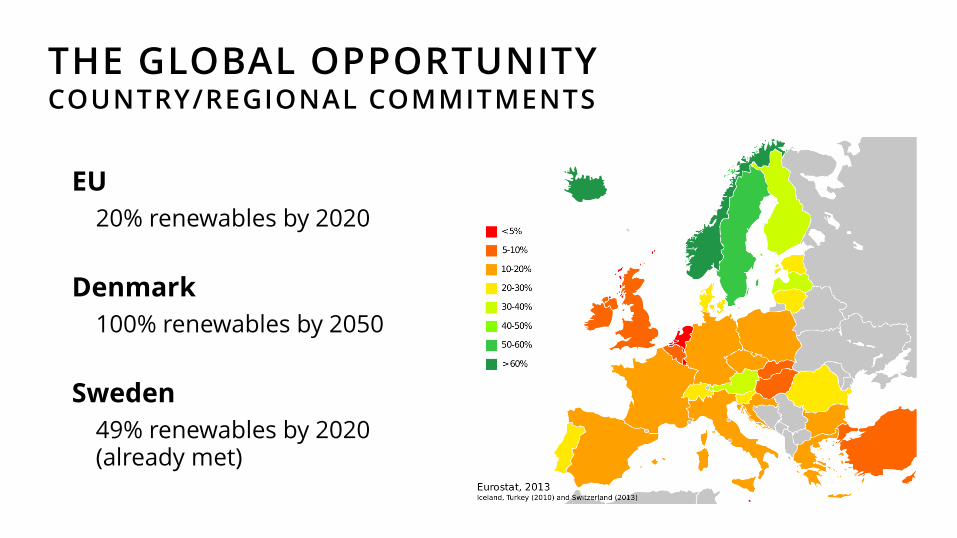
THE GLOBAL OPPORTUNITY COUNTRY/REGIONAL COMMITMENTS
EU
20% renewables by 2020
Denmark
100% renewables by 2050
Sweden
49% renewables by 2020 (already met)

10
OPPORTUNITY NEW TECHNOLOGIES UNDERWAY
11
BUT… A CLEAN ENERGY FUTURE REQUIRES A FLEXIBLE GRID
12
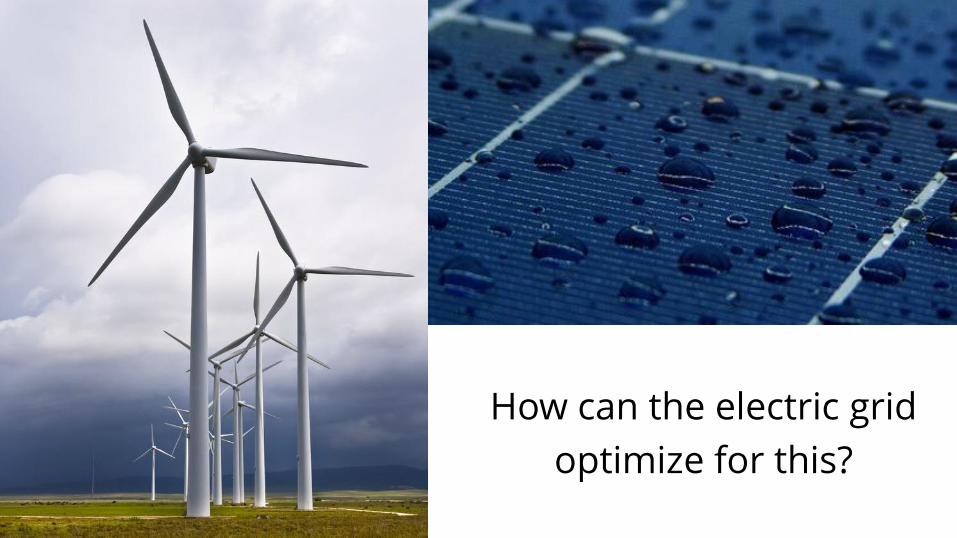
How can the electric grid
optimize for this?
13
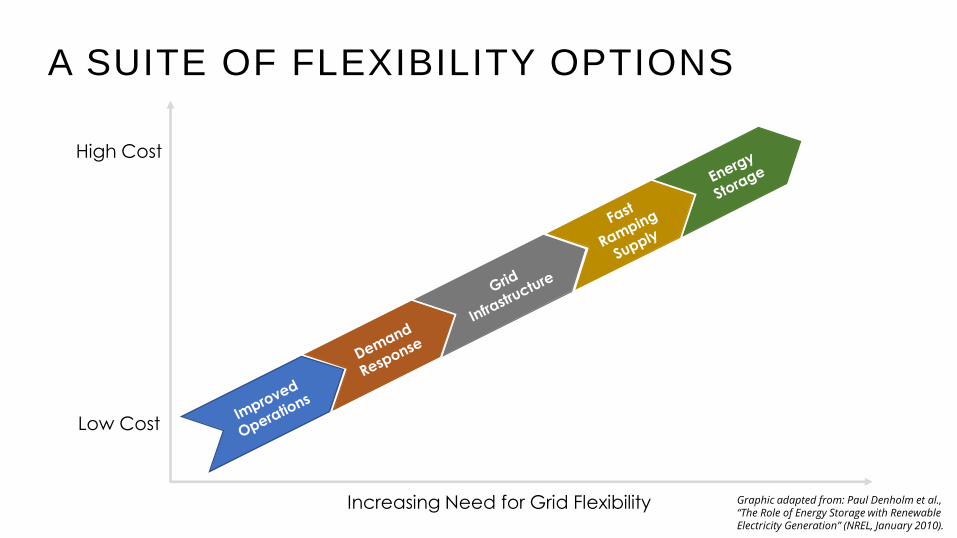
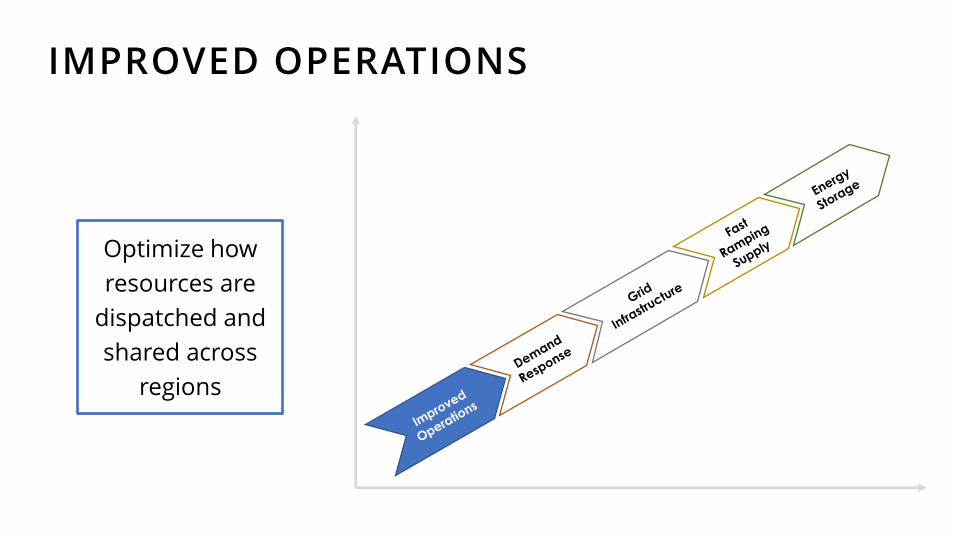
A SUITE OF FLEXIBILITY OPTIONS
Increasing Need for Grid Flexibility
High Cost
Low Cost
Flexibility Resource Supply Curve
Graphic adapted from: Paul Denholm et al., “The Role of Energy Storage with Renewable Electricity Generation” (NREL, January 2010).
High Cost
Low Cost
14
IMPROVED OPERATIONS
Optimize how
resources are
dispatched and
shared across
regions
15
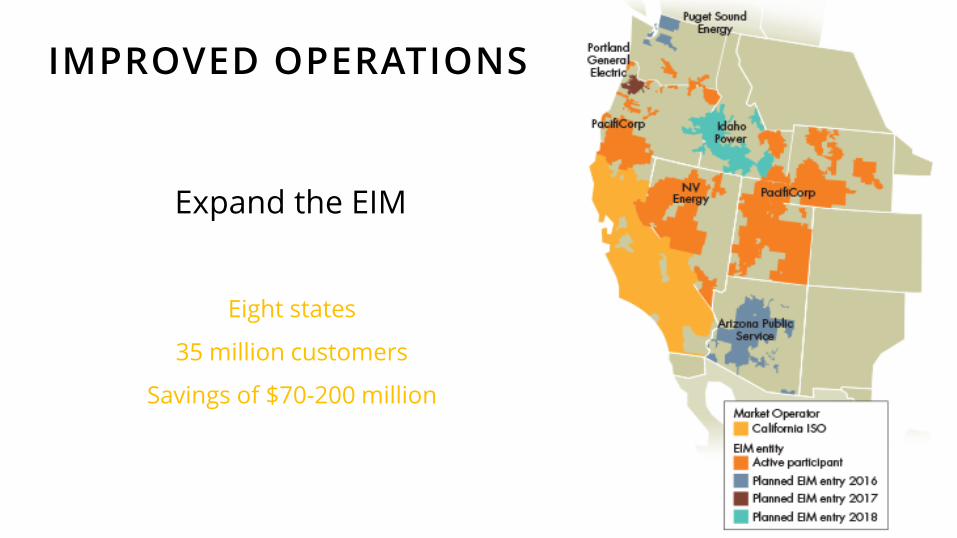
IMPROVED OPERATIONS
Expand the EIM
Eight states
35 million customers
Savings of $70-200 million
16
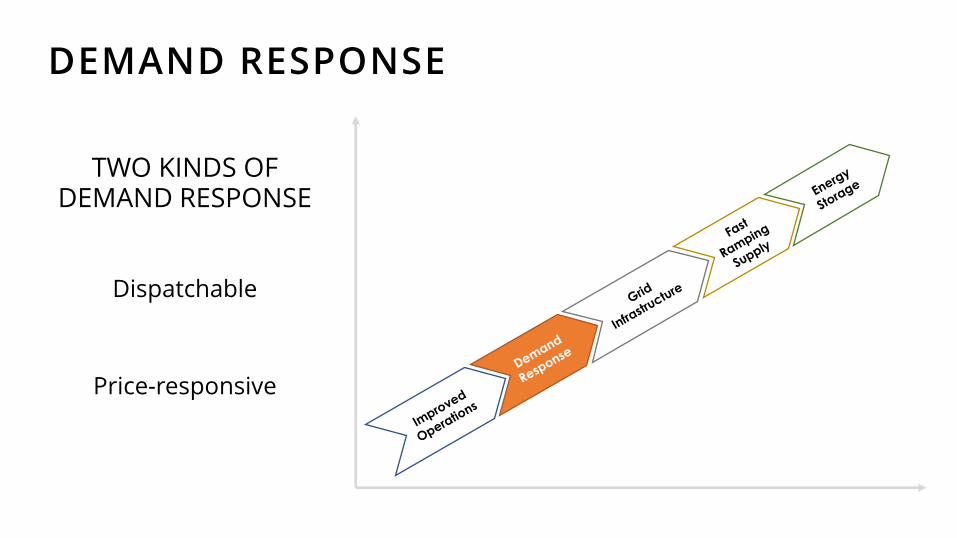
DEMAND RESPONSE
TWO KINDS OF DEMAND RESPONSE
Dispatchable
Price-responsive
17
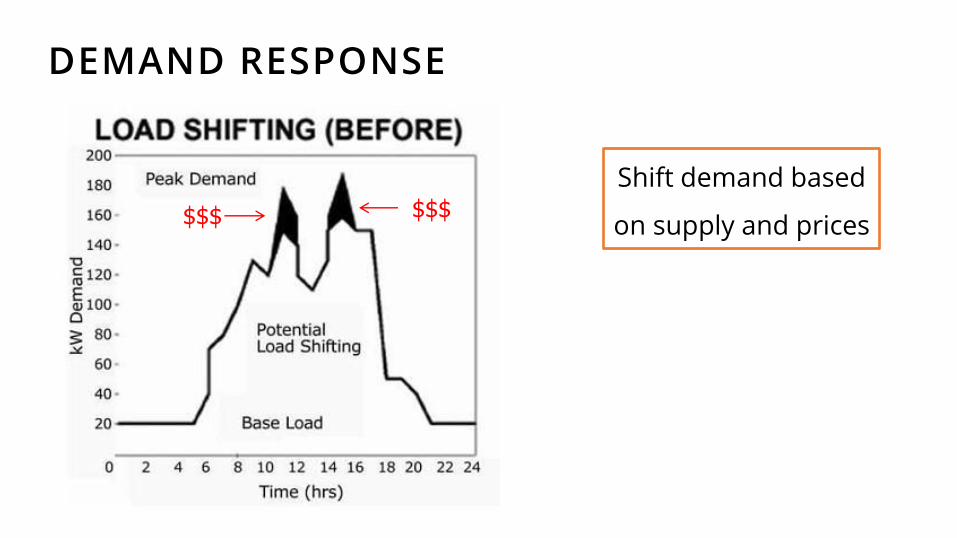
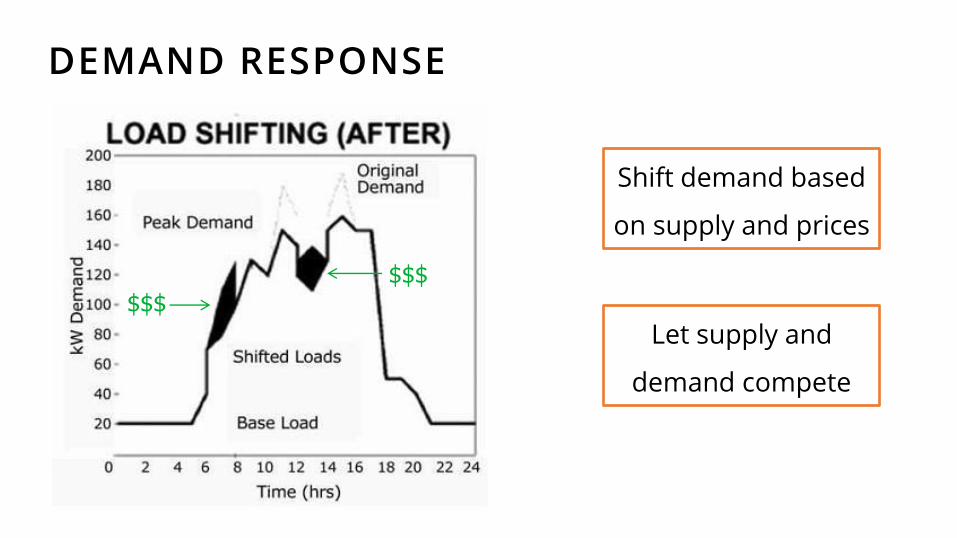
DEMAND RESPONSE
Shift demand based
on supply and prices $$$ $$$
18
DEMAND RESPONSE
Let supply and
demand compete
Shift demand based
on supply and prices
$$$ $$$
19
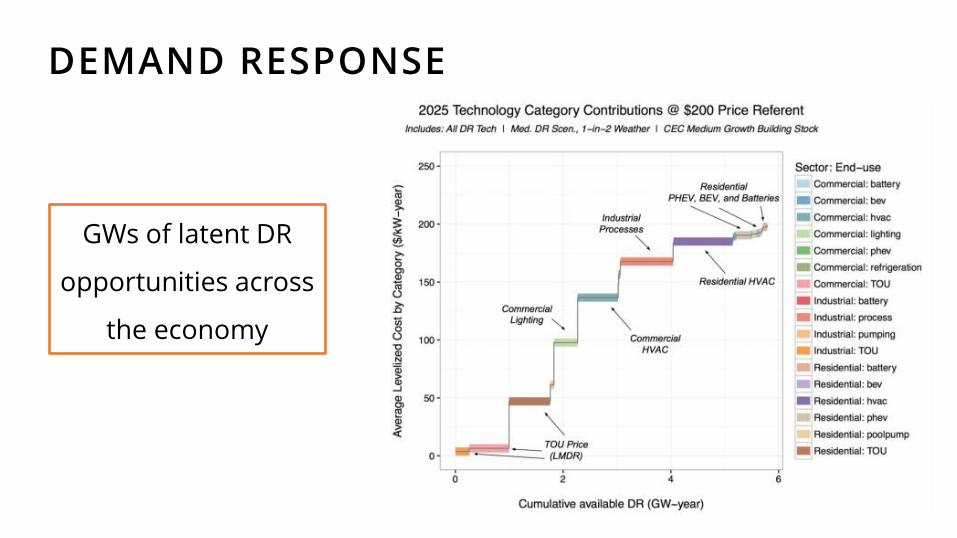
DEMAND RESPONSE
GWs of latent DR
opportunities across
the economy
20
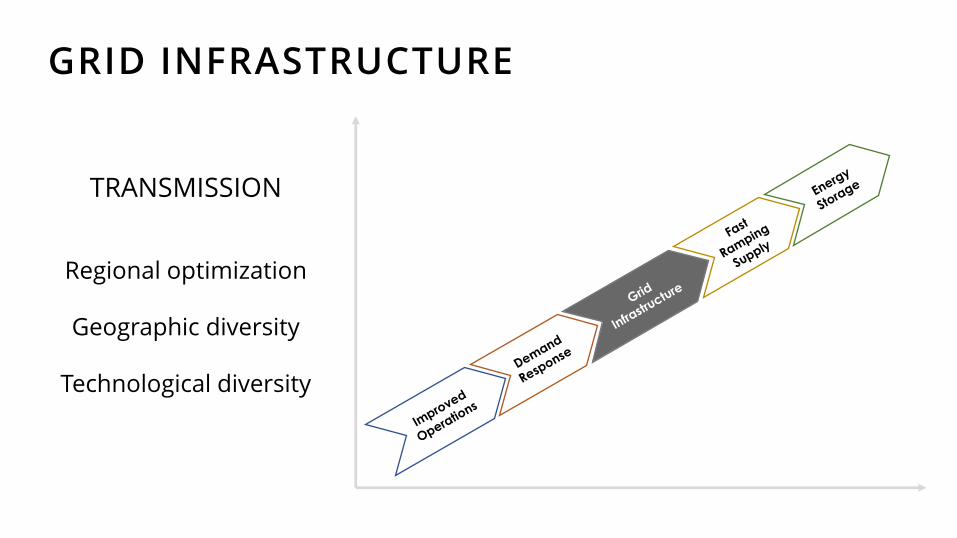
GRID INFRASTRUCTURE
TRANSMISSION
Regional optimization
Geographic diversity
Technological diversity
21
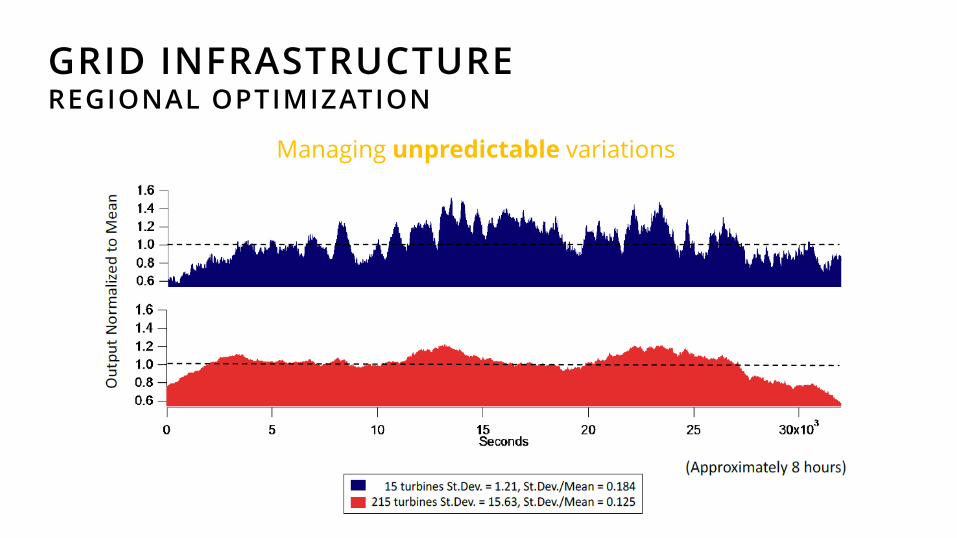
GRID INFRASTRUCTURE REGIONAL OPTIMIZATION
Managing unpredictable variations
22
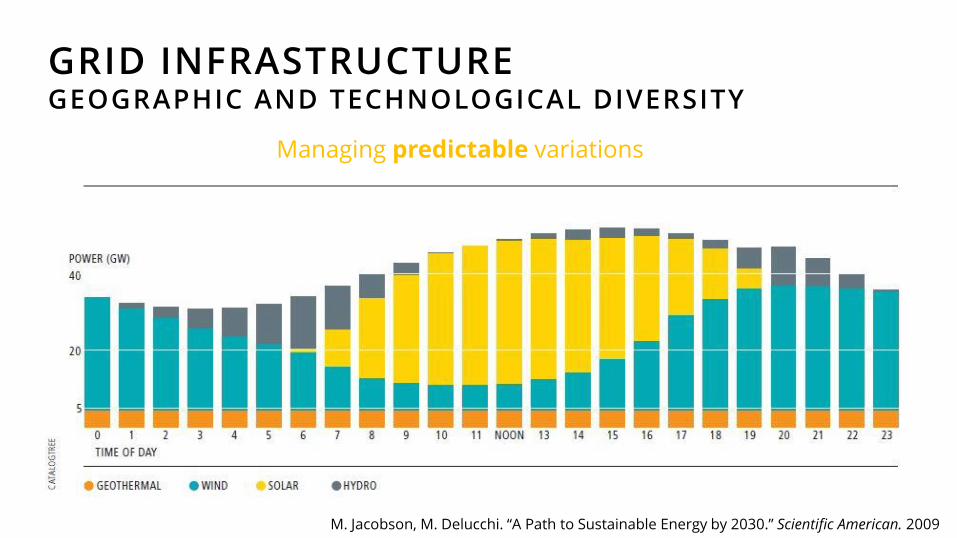
GRID INFRASTRUCTURE GEOGRAPHIC AND TECHNOLOGICAL DIVERSITY
M. Jacobson, M. Delucchi. “A Path to Sustainable Energy by 2030.” Scientific American. 2009
Managing predictable variations
23
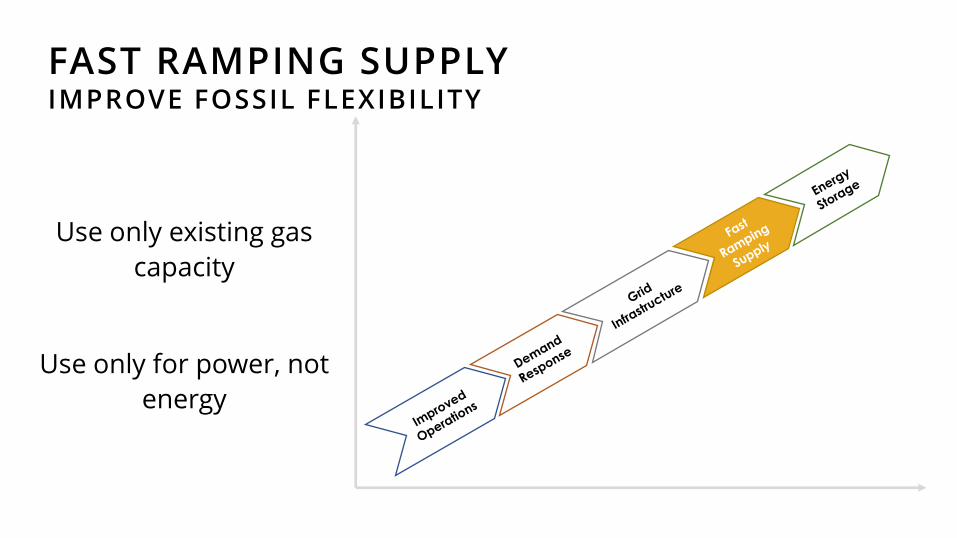
FAST RAMPING SUPPLY IMPROVE FOSSIL FLEXIBILITY
Use only existing gas
capacity
Use only for power, not
energy

24
FAST RAMPING SUPPLY
New natural gas WILL NOT get us to
our emissions reduction goals
Duke Energy (Flickr)
25
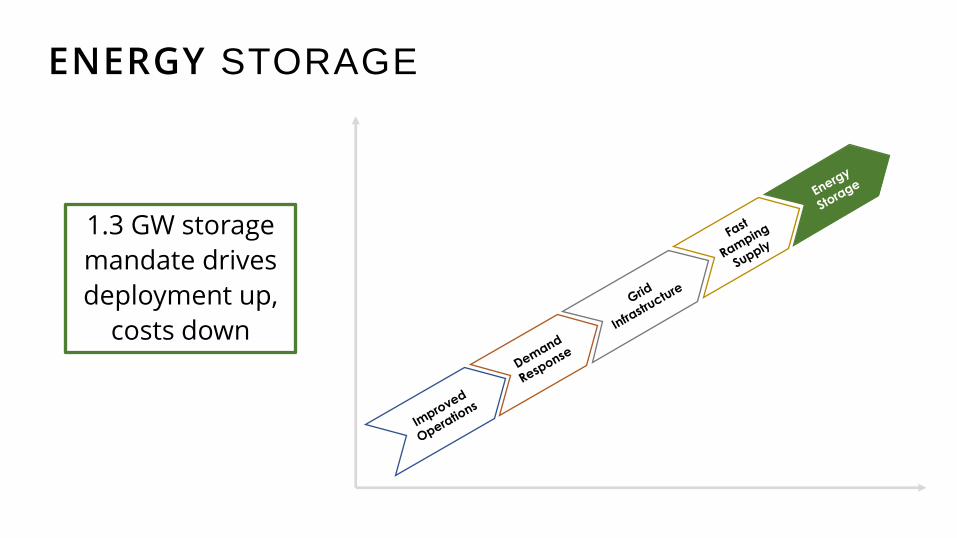
ENERGY STORAGE
1.3 GW storage
mandate drives
deployment up,
costs down

26
ENERGY STORAGE
Pumped hydro Battery storage
27
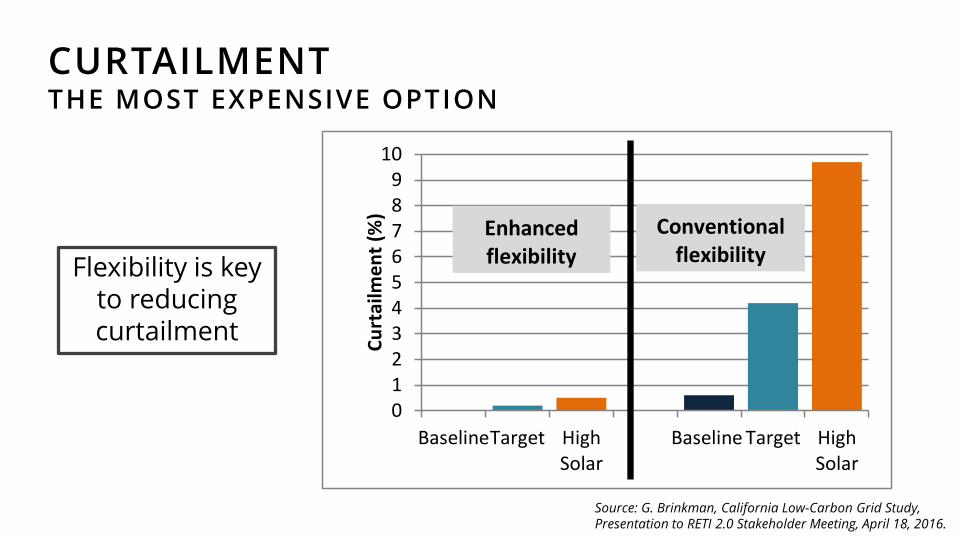
CURTAILMENT THE MOST EXPENSIVE OPTION
0123456789
10
BaselineTarget HighSolar
Baseline Target HighSolar
Cu
rtai
lme
nt
(%)
Enhanced flexibility
Conventional flexibility
Source: G. Brinkman, California Low-Carbon Grid Study, Presentation to RETI 2.0 Stakeholder Meeting, April 18, 2016.
Flexibility is key to reducing curtailment
28
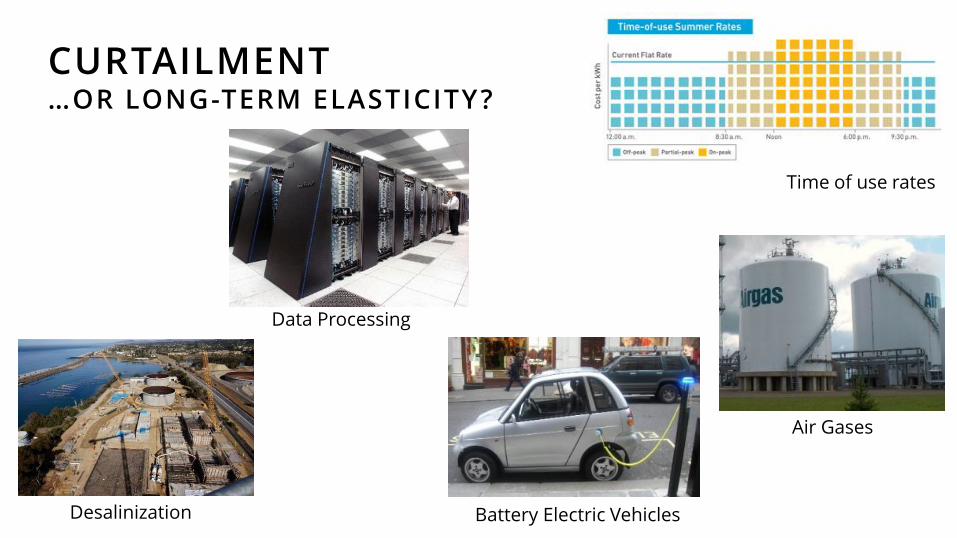
CURTAILMENT …OR LONG -TERM ELASTICITY?
Data Processing
Battery Electric Vehicles
Air Gases
Desalinization
Time of use rates
29
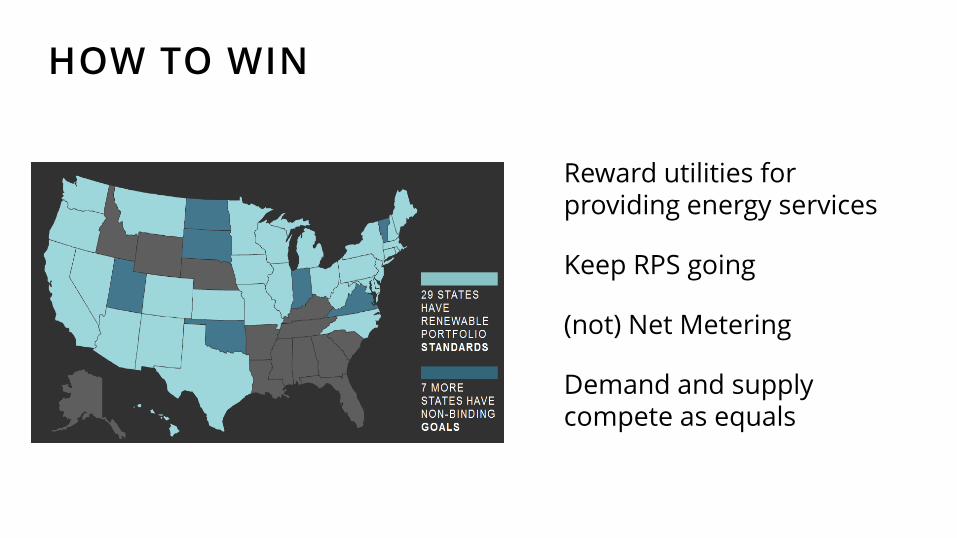
HOW TO WIN
1. Reward utilities for providing energy services
2. Keep RPS going
3. (not) Net Metering
4. Demand and supply compete as equals
Lawrence Berkeley National Lab
30
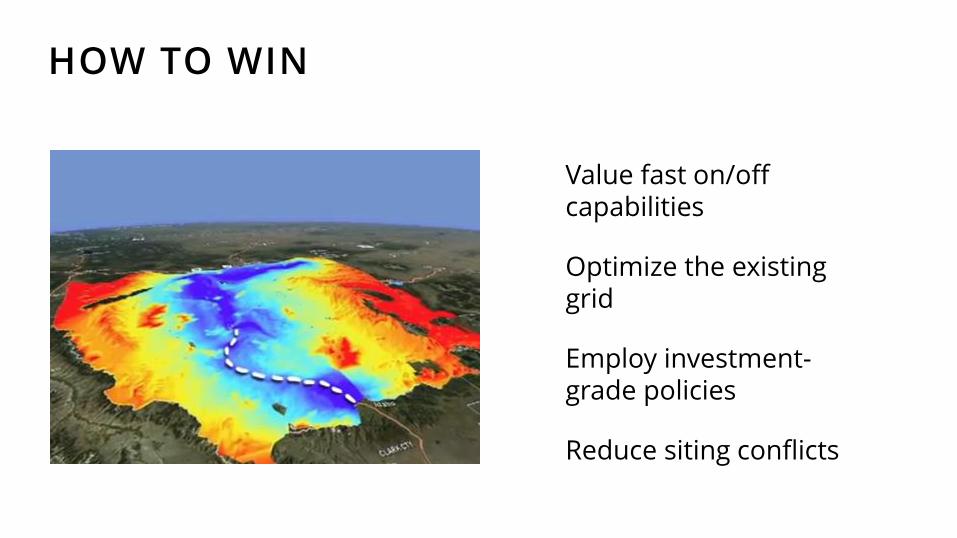
HOW TO WIN
5. Value fast on/off capabilities
6. Optimize the existing grid
7. Employ investment-grade policies
8. Reduce siting conflicts
MSTI Review Project

31 WWW.AMERICASPOWERPLAN.COM
32
THANK YOU
@HAL_HARVEY
@ENERGYINNOVLLC
WWW.ENERGYINNOVATION.ORG
Top Related