


Languages
Pages
Legal


Training manual for Rockford Region Vital SIgns Website
ROCKFORD METROPOLITAN AGENCY FOR PLANNING
RockfordRegion
VITAl SIGNSRegional Plan for Sustainable Development

2
BOONE & WINNEBAGO COUNTY REGIONAL SUSTAINABILITY PLANSince 2011, the Rockford Region has been working to develop our first regional plan for sustainable development. This initiative, called “Rockford Region Vital Signs”, is based first and foremost on taking the social, economic, and environmental pulse of the Rockford Region. Once community leaders know the strengths and weaknesses of the region’s sustainability and well-being, it is our belief they can be more strategic in determining what needs to be done to improve the community.
Three current conditions reports (social, economic, and envrionmental)have been released and aim to empower community leaders from diverse backgrounds, for perhaps the first time in concert, to have a clear picture of the region’s interworking parts. The hope is our regions’ leaders may then begin a conversation on how to improve the region’s sustainability by initiating one conversation as a region about our collective and individual future well-being.
Vital Signs is led by a local consortium of over 30 regional agencies agreeing to support and align their strategic plans and long-range visions to the final sustainability plan. The RMAP Policy Committee also formed a Steering Team of nearly 100 community leaders to help develop regional goals for the sixteen areas of sustainability and to recommend a governance structure empowered to implement the RPSD upon its submission and acceptance by the Department of Housing and Urban Development.
Many individuals have contributed to the development of the Vital Signs project. In particular the grant management staff wish to recognize the significant contribution of the Winnebago County Geographic Information System (WinGIS) for their technical expertise and assistance with deployment of the Vital Signs website and the open data platform on which it resides.
This initaitive is being accomplished in cooperation with the U.S. Department of Housing and Urban Development, the U.S. Department of Transportation and the U.S. Environmental Protection Agency. The contents, views, policies and conclusions expressed in this report are not necessarily those of the above agencies.

3
THE PROCESSThe Vital Signs project includes five agreed upon deliverable products to HUD:
• An open data platform consisting of a “data commons” that contains publicly-available and privately-purchased data sets to help document the current conditions of the region and to guide future performance measurement of sustainability implementation. As of the writing of this document this work is essentially complete. The Vital Signs website is www.ourvitalsigns.com.
• A regional governance model that empowers the region to compete, receive and implement sustainability initiatives and to plan for the entire metro area. RMAP has already received “Preferred Sustainability Status” from HUD, but currently the RMAP Policy Committee is only empowered to act on behalf of the census-defined urban areas within the two counties. As of this writing the recommendation of a regional governance model is before the RMAP Policy Committee.
• A formal regional analysis of housing, defined for grantees as a “Fair Housing Equity Assessment” by HUD. Additionally, RMAP has agreed to also include a regional “Analysis of Impediments to Fair Housing Choice”. This additional work will position entitlement grantees within the region (City of Rockford, Rockford Housing Authority) to align their HUD-required plans with a regional focus.
• A toolkit of model codes, ordinances, policies, incentives and agreements known as “implementation tools” that can assist the implementation of the RPSD.
• The final Regional Plan for Sustainable Development document. This plan document will have a 20-year horizon and include strategies and action steps for all levels of the region including local governments, businesses, non-profits, neighborhoods and individual citizens.
LOOKING AT SUSTAINABILITY THROUGH 16 TOPICSA crucial component of our process measuring regional sustainability indicators. These sustainability measurements help the community understand the social, economic, and environmental impact of our region’s 16 different areas of sustainability. Its preventative healthcare and home-grown remedies all in one.

4
INTRODUCING VITAL SIGNS...The Rockford Region Vital Signs website is an interactive data portal taking the pulse of the region’s sustainability. It includes an online mapping that provides a wealth of information about the Metro’s people, communities, and neighborhoods through a wide variety of topics -- from economic development and arts to the housing and transportation.
A resource for all those seeking to understand how the area is evolving with our Region’s sustainability goals, it helps residents, businesses, organizations, municipal staff, elected officials, and journalists explore options and make more strategic and informed decisions on how to help the region’s social, economic, and environmental well-being. We invite you to explore our region’s data, community snapshots, and maps on this site. Collectively these are called Visualizations (maps, charts, graphs, etc).
In addition, if you are interested in becoming an advanced user we encourage you to sign up for training and create your own visualizations and reports. Rockford Region Vital Signs is sponsored by the Rockford Metropolitan Agency for Planning. The website URL is http://www.ourvitalsigns.com.
The Vital Signs website uses a web-based visualization platform designed to enable visualization of any available data by anyone for any purpose named WEAVE. WEAVE is in development by the Open Indicators Consortium (OIC) To learn more about WEAVE, check out www.oicweave.org.
Steve Ernst, RMAP Executive Director
Phone: 815.964.RMAP [email protected]
Genevieve Borich, Project Manager
Phone: [email protected]
WWW.OURVITALSIGNS.COM

5
NEWSMISSION OF SITE
ROTATING HIGHLIGHTS FOR EACH TOPIC
STEP 1: PICK ONE OF 16 AREAS OF REGIONAL SUSTAINABILITY
NAVIGATION BAR

6
HO
ME
PAG
E
AB
OU
T T
HE
INIT
IAT
IVE
, C
UR
RE
NT
CO
NIT
ION
R
EP
OR
TS
, DE
TAILE
D
NE
WS
, EX
PLO
RIN
G
CO
NC
EP
T O
F S
US
TAIN
AB
ILITY, E
TC
LINK
TO
E
NG
AG
EM
EN
T S
ITE
FO
R P
LAN
GO
AL
SE
TT
ING
ON
LINE
EX
PLO
RE
DA
TA
VIS
UA
LIZA
TIO
NS
B
Y T
OP
IC
EX
PLO
RE
DA
TA
VIS
UA
LIZA
TIO
NS
B
Y C
RO
SS
CU
T
CO
MM
UN
ITY
S
NA
PS
HO
TS
W
ITH
ME
TR
O A
ND
C
OM
MU
NIT
Y-S
PE
CIFIC
V
ISU
ALIZ
AT
ION
S
OT
HE
R D
ATA
S
OU
RC
ES
CO
NTA
CT
US

7
STEP 2: SELECT DATA VISUALIATION IN DROPDOWN
STEP 3: PICK VISUALIZATION BY ECONOMIC, SOCIAL, OR ENVIRONMENTAL LENS

8STEP 3: SCROLL DOWN
VISUALIZATION TITLE
MAP
METADATA & ANALYSIS
COLOR LEGEND
TIME SLIDER
SCATTERPLOT
ATTRIBUTE SLIDER
SIZE LEGEND
BAR CHART

9
COLOR LEGEND
TIME SLIDER
ATTRIBUTE SLIDER
SIZE LEGEND
BAR CHART
STEP 4: ENTER FULLSCREEN MODE
(STEP 5: PRESS ESC TO EXIT FULLSCREEN MODE)

10
HIG
HLIG
HT
ING
D
ATA
C
OR
RE
SP
ON
DS
T
O A
LL DA
TA
VIS
UA
LIZA
TIO
NS
W
ITH
IN D
ATA
S
ES
SIO
N
TR
Y C
HA
NG
ING
A
TT
RIB
UT
E S
LIDE
R
SLID
E O
R P
US
H
PLA
Y B
UT
TO
N FO
R
TIM
E S
LIDE
RZ
OO
M IN
AN
D PA
N
WIH
TIN
MA
P
HIG
HLIG
HT
D
IST
RIC
TS
OR
B
RA
CK
ET
S O
N
CO
LOR
LEG
EN
D

11
Lan
d >
Dis
tric
t Cla
ssifi
catio
ns
Sou
rce:
Roc
kfor
d M
etro
polit
an A
genc
y fo
r Pla
nnin
g.
Dat
e: 2
012.

12
EXTRA TIPS• “Print screen” on your computer to save image for reports, presentations, or download
• Most data updated annually; will announce new data available on news section of site when major releases are posted
• Data source is within each data visualization’s title in green above visualization
• Find data visualizations by topic or by crosscut
• Under Community Snapshots view metro-level data...individual community snapshots will be available by May
• External data sources available on “Use the Data” page
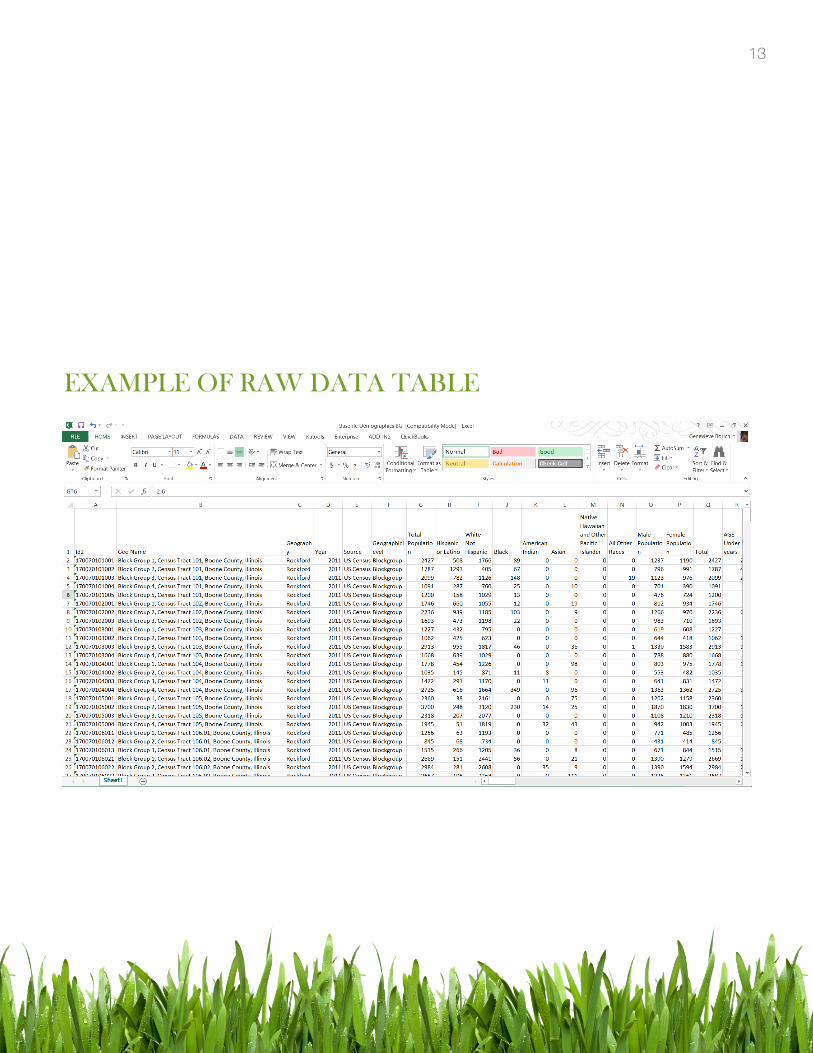
• Raw data will be available in geocoded CSV spreadsheets in Data Commons later this year for download
• Possible to create visualizations on external website with automatically updated data (example: EDEEN’s site)
• Rockford Register Star is doing year-long coverage of data from initiative
13
EXAMPLE OF RAW DATA TABLE

14
APPENDIX: ADDITIONAL SOCIAL VISUALIZATIONSThe following is a list of additional social visualizations available at www.ourvitalsigns.com. These provide a deeper insight in to the State of Social Well-being for the Rockford Region.
BUILT ENVIRONMENT • Public Spaces with Amenities
• Brownfield Sites
• Land Available for Recreation
• Third Places
CIVIC VITALITY• Mobility from the US Census Bureau
• Voter Turnout
• Single Parents and Children in Poverty from the US Census Bureau
• Linguistic Isolation from the US Census Bureau
• Ability to Speak English from the US Census Bureau
• Moved to Region and City Optimism
• Strength of Family Households from the US Census Bureau
• Segregation RCAP Index from the Department of Housing and Urban Development
• Change White vs Minority Population 2000 to 2010 from the US Census Bureau
• Percent Change of Young Adults Residents 2000 to 2010 from the US Census Bureau
• Elderly Characteristics from the US Census Bureau
• Black Population Characteristics from the US Census Bureau
• White Population Characteristics from the US Census Bureau
• Hispanic Characteristics from the US Census Bureau
• Average Household Expenditures on Communications Technology from the Consumer Expenditures Survey
• Armed Forces from the US Census Bureau
CULTURE• Average Household Expenditures on Passive Entertainment from the Consumer
Expenditure Survey
• Average Household Expenditures on Active Entertainment from the Consumer Expenditure Survey

15
ECONOMIC DEVELOPMENT• Households in Poverty from the US Census Bureau
• County Income From Transfer Payments from Woods and Poole
• Elderly Financial Stability from the US Census Bureau
• Portion of Income Coming from Transfer Payments from Woods and Poole
• Income by Gender from the US Census Bureau
• Male Households in Poverty from the US Census Bureau
• Female Households in Poverty from the US Census Bureau
• Unemployment by Race from the US Census Bureau
• Self Sufficiency Wage from Heartland Alliance
• Per Capita Income from the US Census Bureau
• Change in Per Capita Income from the US Census Bureau
• ousehold Income by Race from the US Census Bureau
• Population Lacking Self Sufficiency from the US Census Bureau and HUD
• Concentrations of Poverty from the US Census Bureau
• Percent Change White Collar Employees 2000 to 2010 from the US Census Bureau
• Population Lacking Self Sufficiency
• Income Characteristics by Race from the US Census Bureau
• Average Household Expenditures on Children from the Consumer Expenditures Survey
• Child Expenditures from the US Census Bureau
• Unemployment and Educational Attainment from the US Census Bureau
• Welfare Recipients from the US Census Bureau
• Women and Minority Owned Businesses from the NETS Database
• Income and Unemployment from the US Census Bureau
• age Characteristics from the US Census Bureau
• Transfer Payments from Woods and Poole
• Percent Households with Children Below Poverty from the US Census Bureau
• Unemployment Characteristics by Race and Education in 2000 from the US Census
• Unemployment Characteristics by Race and Education in 2010 from the US Census Bureau
• Additional Unemployment Characteristics by Race and Education in 2010 from the US Census Bureau
• 2011 Unemployment Rates for Metro from the US Census Bureau
• No Retirement Income from the US Census
EDUCATION• ISAT Scores from the Illinois Student Report Card

16
• Unemployment Map vs Bachelors Degrees from the US Census Bureau
• High School Graduation Rates by School from the Illinois Student Report Card
• Graduation Rates with Truancy and Dropping Out and Low Income from the Illinois
• Enrollment by Race to Low Income from the Illinois Student Report Card
• Attendance and Truancy by School from the Illinois Student Report Card
• Enrollment by Race and School Type
• Educational Attainment by Gender and Race from the US Census Bureau
• Educational Make Up by Race from the Illinois Student Report Card
• Unemployment vs High School Diplomas and Bachelors from the US Census Bureau
• Class Size vs Test Scores of High Schoolers from the Illinois Student Report Card
• Minority Enrollment and Low Income Students from the Illinois Student Report Card
• High School Graduation Rates from the Illinois Student Report Card
• Test Scores Below Standard by Socioeconomic Status from the Illinois Student Report
• Test Scores Exceeding Standards by Socioeconomic Status from the Illinois Student Report Card
• Test Scores Exceeding Standards by Gender from the Illinois Student Report Card
• Comparative Test Scores from the Illinois Student Report Card
• Dropout Rates, Graduation, and Attendance from the Illinois Student Report Card
• Change in Enrollment by School Type from the Illinois Student Report Card
• Percent Public School Attendance by Race from the Illinois Student Report Card
• Percent Attending Public and Private Schools from the Illinois Student Report Card
• Test Scores below Standard by Gender from the Illinois Student Report Card
• Percent Change College Graduates 2000 to 2010 from the US Census Bureau
• Selected Characteristics of Dropouts from the US Census Bureau
FOOD• Proximity to Healthy Food
• Average Household Fruit and Vegetable Expenditures from the Consumer Expenditures Survey
• Unhealthy Food Index from the Consumer Expenditures Survey
• Analysis of Average Household Food Consumption Patterns as Percent of Total Food Expenses from the CES
HEALTH• Health Insurance Coverage by Race from the Illinois Department of Health
• Average Household Expenditures on Smoking Products from the Consumer Expenditure Survey
• Average Household Expenditures on Alcohol Products from the Consumer Expenditure Survey

17
• Birth Statistics from the Illinois Department of Health
• Causes of Death from the Illinois Department of Health
• Obesity Statistics from the Illinois Department of Health
• Healthcare and Wellbeing from the Illinois Department of Health
• Health Conditions from the Illinois Department of Health
• Birth Statistics from CDC
• Selected Health Characteristics from the CDC
HOUSING• Loan Denial Rate by Race
• HUD Disparity Indices from HUD
• Owner Occupied Units vs Public Housing from the US Census Bureau
• Owner Occupied
• Minority Owner Occupied
• Population Change in Built Area from the US Census Bureau
• Subsidized Housing by Neighborhood from the Department of Housing and Urban Development
• Family Poverty Statistics from the US Census Bureau
• Characteristics of Average Household Size from the US Census Bureau
• Characteristics of Household Income from the US Census Bureau
• Housing Type by Minority Concentration from the US Census Bureau
• Housing Vacancies
• Subsidized Housing Characteristics from the Department of Housing and Urban Development
• Subsidized Housing Additional Facts from Department of Housing and Urban Development
• Subsidized Housing Additional Facts from Department of Housing and Urban Development
• Total Households from the US Census
LAND• Proximity to Recreational Space
SAFETY• Arrests and Jail Data from the Department of Justice
• Perceived Safety from the Healthy Communities Survey Study
• Crime vs Education and Income from the ESRI Crime Index and the US Census Bureau
18
• Crime vs Income from the ESRI Crime Index and the US Census Bureau
• Crime vs Population Characteristics from the ESRI Crime Index and the US Census Bureau
• ime vs Race from the ESRI Crime Index and the US Census Bureau
• Crime vs Housing vs Expenditures from the ESRI Crime Index, US Census Bureau, and the Consumer Expenditures Survey
• Characteristics of Crime Propensity from the ESRI Crime Index
TECHNOLOGY• Wifi Sites
TRANSPORTATION• Accidents from National Highway Traffic Safety Administration
• Accessibility of Cultural Resources
• Means of Transportation to Work from the US Census Bureau
• Number of Cars Per Household from the US Census Bureau
METRO-WIDE SOCIAL DATA VISUALIZATIONS• Community Race and Ethnicity from the US Census Bureau
• Community Age Distributions from the US Census Bureau
• County Income From Transfer Payments from Woods and Poole
• County Income From Transfer Payment Bar Chart from Woods and Poole
• Wealth Index Line Chart from Woods and Poole
• Portion of Income Coming from Transfer Payments Bar Chart from Woods and Poole
• Age Distribution from the US Census Bureau
• Black Population from the US Census Bureau
• Income and Poverty from the US Census Bureau
• Hispanic Population from the US Census Bureau
• Community Snapshot Educational Attainment from the US Census Bureau
• Race Distribution from the US Census Bureau
• Gender Distribution from the US Census Bureau
• Population Growth Trends from the US Census Bureau
• Winnebago County Origins and Destination from the IRS Migration Data
• Child Poverty and Educational Attainment by Community from the US Census Bureau
• Disparity Index from the Department of Housing and Urban Development
• Poverty by Race from the US Census Bureau
• Population Ages by Decade from Woods and Poole

19
• Race by Decade from Woods and Poole
• Age Projections from Woods and Poole
• Demographic Projections from Woods and Poole
• oone County Origins and Destination from the IRS Migration Data
• Migrant Trends Inbound from the IRS Migration Data
• Migrant Trends Outbound from the IRS Migration Data
• Unemployment Rates for Metro from the US Census Bureau
APPENDIX: ADDITIONAL ENVIRONMENTAL VISUALIZATIONSThe following is a list of additional Environmental visualizations available at www.ourvitalsigns.com. These provide a deeper insight in to the State of Environmental Well-being for the Rockford Region.
BIODIVERSITY• Farm Practices from USDA
• Agricultural Land Treated from USDA
• Cropland Harvested by Crop Type from the USDA
• Types of Agricultural Land from the USDA
• Land Enrolled in Crop Insurance and Conservation Programs from the USDA
• Total Cropland from USDA
• Woodland and Pastureland from the USDA
• USDA County Profiles
• Environmentally Sensitive Areas
• Wetlands
• Environmentally Sensitive Areas in Detail from USDA
• Endangered Species from the EPA
BUILT ENVIRONMENT• LEED Certified Buildings and Professionals
• Brownfields Sites Map
• Built Environment Bridges
• Bridges from IDOT

20
• Brownfields from RMAP
• Costs of Infrastructure per Capita by District from RMAP
• Structurally Deficient Bridges
• Built Environment Footprint
• EPA Regulated Facilities
• EPA Regulated Facilities
• EPA Regulated Facilities Map
CIVIC VITALITY• Child Care and Elderly Facilities from the NETS Database
• Civic Organizations and Non-Profits from the NETS Database
CULTURE• Distribution of Cultural Institutions from NETS
• Map of Cultural Places of Interest
ECONOMIC DEVELOPMENT• Local Multiplier Effect from RMAP
• USDA Animal and Animal Products Sales from the USDA
• Farm Asset Values from USDA
• Farm Production Expenses from USDA
• Vacant Commercial Sites from LOIS
• Vacant Industrial Sites from LOIS
EDUCATION• Elementary School Districts Locale Codes
• Secondary School Districts Locale Codes
• Illinois School Maintenance Project Grant Recipients
• Before and After School Programs
• School Construction Grants
• School Building Conditions
ENERGY• Energy Star Labeled Buildings

21
FOOD• Healthy Food Locations from RMAP
• Food Insecurity and Food Cost from the USDA
• USDA Population with Low Access to Healthy Food
• USDA Children with Low Access to Healthy Food
• USDA Seniors with Low Access to Healthy Food
• Food Access Tract Information
• Child Food Insecurity and Food Cost
• Locations of Food Pantries and Households in Poverty from NETS and Census
• Estimated Tons of Food Consumed
• Estimated Tons of Food Production Needed
• Major Food Production Needed and Consumed
HEALTH• Radon Levels by Zipcode from the Illinois Emergency Management Agency
• Lead Paint Risk from US Census Bureau
• Air Quality for Carbon Monoxide from the EPA
• Air Quality for Particulate Matter from the EPA
• Air Quality for Ozone from the EPA
• Lead Poisoning in Children Six and Younger from the Illinois Department of Public Health
• Lead Poisoning for Children Under Three from the Illinois Department of Public Health
HOUSING• Housing Built Before 1980 with Property Crime and Income from the US Census
Bureau and the ESRI Crime Index
• Vacancies Vs Occupancies from the US Census Bureau
• City of Rockford Percent Vacant Residential Addresses from RMAP
• Housing Units Per Acre from the US Census Bureau
• Average Lot Size
• Rooms per Unit from the US Census Bureau
• Bedrooms per Unit from the US Census Bureau
• Locally Owned Residential Properties
LAND• District Classifications
• Land Use in Acres by District from RMAP

22
• Change in Land Use from 2010-2012 from RMAP
• Soil Types by District
• Soils Map
• Acres of Greenways and Open Space
• Prime Farmland by County
• Prime Farmland
• Map of Greenways and Open Space from RMAP
SAFETY• Historical Hail Map
• Historical Locations of Tornadoes
• Households within Fire District Boundaries
• Fire Districts Map
• Crash Characteristics by County from IDPH
• Age and Gender of Motor Vehicle Occupants from the IDPH
• Occupants of Motor Vehicle Incidents
TECHNOLOGY• Land Mobile Radio Services from FCC
• Radio Broadcast Stations from FCC
• Wireless Telecommunications from the FCC
• Television Broadcasting Stations from the FCC
• Registered Antenna Structures from the FCC
• Wifi Sites from RMAP
• Wifi Locations by RMAP
TRANSPORTATION• Average Annual Daily Traffic
• Roadway Improvements from FY2012 to FY 2013
• Transportation and Land Use from RMAP
• Bus Routes
• Bus Routes with Amenities
• Transportation Bus Routes
• Bus Routes with Times and Stops from RMTD
• Public Transportation Accessibility with Major Employers from RMAP

23
WASTE• EPA Toxics Released Over Time
• Toxic Chemicals Released from the EPA
• Greenhouse Gas Emissions from the EPA
• Estimated Pounds of Recycled Material Collected
• Solid Wastes Deposited from RMAP
• Recycled Materials in Tons
WATER• Watersheds within MSA
• Water Floodplains Map
• Percent of District within Floodplain
• Water Impairments
• Historic Pumpage Data by Major Suppliers
• Floodplains vs Foreclosures and Vacancy
METRO• Mobility from the US Census Bureau
• Quality of Life Amenities by Community from the NETS Database
APPENDIX: ADDITIONAL ECONOMIC VISUALIZATIONSThe following is a list of additional Economic visualizations available at www.ourvitalsigns.com. These provide a deeper insight in to the State of Economic Well-being for the Rockford Region.
EDUCATION• Assorted Statistics by School District from the Illinois Student Report Card
• Sales and Money Spent on Elementary and Secondary Education from the Consumer Expenditures Survey
• Money Spent on College and Trade Schools from the Consumer Expenditure Survey
• School District Finances from the NETS Database
• HS Graduation versus Unemployment from the US Census Bureau

24
BUILT ENVIRONMENT• Address Vacancies by County from the USPS
• 2011 Farm Parcel Sales and Assessment from RMAP
• 2011 Commercial Parcel Sales and Assessment from RMAP
• 2011 Industrial Parcel Sales and Assessment from RMAP
• 2011 Residential Parcel Sales and Assessment from RMAP
• 2011 Tax Exempt Parcel Assessment from RMAP
• 2007-2011 Residential Parcel Analysis by District from RMAP
• 2007-2011 Commercial Parcel Analysis by District from RMAP
• 2007-2011 Industrial Parcel Analysis by District from RMAP
• 2007-2011 Farm Parcel Analysis by District from RMAP
• Average Sales and Assessment Value by District for 2007-2011 from RMAP
• Difference Between Fairmarket Value and Sale Price for 2007 to 2011 from RMAP
• Difference Between Sale Price and Fairmarket Over Time from 2007 to 2011 from RMAP
CIVIC VITALITY• Sales and Money spent on Children and Elderly from the Consumer Expenditure
Survey and the NETS Database
• Donations to Non-Profits and Organizations from the Consumer Expenditures Survey
• Insurance, Pensions and Similar Expenditures from the Consumer Expenditures Survey
• Insurance Carriers and Profits from the NETS Database
• Non-Profit Data Over Time from the NETS Database
CULTURE• Economic Impact of Nonprofits and Audiences from Americans for the Arts
• Economic Impact of Audiences from Americans for the Arts
• Creative Industries from the NETS Database
• Average Household Expenditures on Active and Passive Entertainment from the Consumer Expenditure Survey
• Spent on Sports Hobbies and Travel from the Consumer Expenditures Survey
• Establishment Churn by Industry from the NETS Database
• Entertainment Establishments and Revenues from the NETS Database
ECONOMIC DEVELOPMENT• Top Destination of Outbound Companies from NETS Database
25
• Employees and Sales from the NETS Database
• Employment Size and Categories from the NETS Database
• Self Employed Companies from the NETS Database
• Per Capita Income Rate Change 2000 to 2010 from the US Census Bureau
• Concentrations of Stage 2 Companies from the NETS Database
• Concentrations of Stage One and Two Companies from the NETS Database
• Businesses by NAICS from the NETS Database
• Businesses by SIC from the NETS Database
• Destinations of Outbound Companies from the NETS Database
• Origination of Inbound Companies from the NETS Database
• Companies with Risk of Late Payment from the NETS Database
• Private Establishments from the NETS Database
• Legal Status of Companies from the NETS Database
• Minority Foreign and Female Owned Establishments from the NETS Database
• Importing and Exporting Establishments from NETS Database
• Retail Gap Analysis from the ESRI Retail MarketPlace
• Potential Retail Sales from the ESRI Retail MarketPlace
• Boone County Commuting Patterns from the US Census Bureau
• Winnebago County Commuting Patterns from the US Census Bureau
• Occupations from the US Census Bureau
• Wages for the MSA from the IDES
• MSA Wage Comparisons to State from the IDES
• Headquarters and Standalone Establishments from the NETS Database
• Net Opened and Expanded Businesses from the NETS Database
• Establishment Churn by Establishment Stage from the NETS Database
• Establishment Stages from the NETS Database
• Employees by Industry from the NETS Database
• Cottage Establishment from the NETS Database
• Wealth Index by Decade from Woods and Poole
• Establishment Churn by Industry from the NETS Database
• Retail Leakage/Surplus Index from the ESRI Retail MarketPlace
• Wealth Index Line Chart from Woods and Poole
• Retail Business Information from the ESRI Retail MarketPlace
• Total Retail Sales from the ESRI Retail MarketPlace
• Industry Concentrations Over Time from the NETS Database
• Creative, Production, and Service Workers from the US Census Bureau
• Average Household Expenditures by Category from the Consumer Expenditure Survey
• Retail Sales Tax Revenue from the NETS Database

26
• Retail Sales Tax Revenue from ESRI
• Outbound and Inbound Businesses in Illinois from the NETS Database
• Outbound and Inbound Companies from Different States from the NETS Database
• Exporting Companies in the MSA from the NETS Database
• MSA Exports from ITA
• Commercial Vacancies by District from the USPS
• Occupational Class Wages from the IDES
• Percentage by Category of Average Household Expenses of Four Categories from the Consumer Expenditures Survey
• CAFR Net Assets by Municipality from RMAP
• CAFR Changes of Net Assets by Municipality from RMAP
• CAFR Government Funds by Municipality from RMAP
• CAFR Normalized Net Assets by Municipality from RMAP
• CAFR Normalized Changes in Net Assets by Municipality from RMAP
• CAFR Normalized Governmental Funds by Municipality from RMAP
• Industries Over Time from the NETS Database
• Innovation Index from StatsAmerica.org
• Industry and GMP from BEA
ENERGY• Average Household Expenditures on Energy Types from the Consumer Expenditures
Survey
FOOD• Population Characteristics of Food Stamp Recipients from the US Census Bureau
• Average Household Expenditures Spent on Food and Beverages from the Consumer Expenditure Survey
• Food Stores and Sales from the NETS Database
• Household Expenditures on Healthy Food from the Consumer Expenditure Survey
HEALTH• Health Care and Social Assistance Facilities from the NETS Database
• Health Insurance Coverage by Race from the Illinois Department of Health
HOUSING• Foreclosures and Other Housing Statistics for 2007 to 2008 from HUD
• Percent Rental Housing Units Unaffordable with Section 8

27
• Percent Change Housing Value 2000 to 2010 from the US Census Bureau
• Median Rental Rate 2000 to 2010 from the US Census Bureau
• Conventional Loans from the Federal Financial Institutions Examination Council
• FHA Loans from the Federal Financial Institutions Examination Council
• Home Improvement Loans from the Federal Financial Institutions Examination
• Average Household Expenditures on Mortgages and Taxes by Homeowners from the CES
• Average Household Expenditure on Home Maintenance from the CES
• Average Household Expenditures on Rented Dwellings from the Consumer Expenditures Survey
• Average Household Expenditures on Other Types of Housing from the CES
• Average Costs of Housing as a Part of Total Budgets from CNT
• Real Estate Agents and Brokers from the NETS Database
• Home Maintenance Stores and Services from the NETS Database
SAFETY• Average Household Dollars Spent on Safety from the Consumer Expenditures Survey
• Safety Oriented Establishments from the NETS Database
TECHNOLOGY• Average Household Expenditures on Technology from the Consumer Expenditure
Survey
• Telecommunications and Computer Establishments from the NETS Database
TRANSPORTATION• Average Household Expenditures on Vehicle Purchases from the Consumer
Expenditure Survey
• Average Household Expenditures on Transportation (nonvehicle purchases) from the Consumer Expenditure Survey
• Transportation as a Portion of Total Budget from the CNT Database
• Transportation Oriented Businesses from the NETS Database
WASTE• Average Household Dollars Spent on Water from the Consumer Expenditures Survey
• Average Household Expenditures on Waste Disposal from the Consumer Expenditures Survey
• Waste Oriented Businesses from the NETS Database
28
WATER• Water Supply and Irrigation Systems from the NETS Database
METRO• Employment Earnings by Community from the US Census Bureau
• Income Projections by County from Woods and Poole
• Community Snapshot Industry from the US Census Bureau
• Household Incomes Per Decade from Woods and Poole
• Personal Income by Decade from Woods and Poole
• Wealth Index by Decade from Woods and Poole
• Difference CES and CNT Housing and Transportation Analysis
• Income Projections from Woods and Poole
• Top Ten Employers by Community from the NETS Database

29

Transportation Energy Built Environment
Housing
Safety
Biodiversity
Education Waste
Civic Vitality
Food
Health
Culture Land
Water
TechnologyEconomicDevelopment
Top Related