


Languages
Pages
Legal

New Directions with data on Aboriginal Health and Wellbeing
J Moller and B Stewart
Aboriginal Health Council SA

Background
• The Aboriginal and Torres Strait Islander population of SA is approximately 25,000
• About half of this population lives in the metropolitan area and one quarter in remote areas
• The Aboriginal and Torres Strait Islander population of SA is much younger than the non Aboriginal population. In many places more than 60% of people are under 30 years of age. The median age is 21 years

Background
• Current routinely available health indicators are Mortality and Hospital Separations focusing on principal diagnosis
• The emphasis has been on comparisons between Aboriginal and non-Aboriginal measures. This masks differences between Aboriginal people living in different localities

Background
• Mortality. – While death rates in Aboriginal and Torres
Strait Islander populations are high, the total number of deaths per year are relatively few, making death an insensitive indicator of health Hospital Separations
– Inpatient data counts episodes of care and not people. It is mainly focussed on older and sicker people who need complex care.

A comparison of hospital inpatient and population age distributions
2000 1000 0 1000 2000
0to4
5to9
10to14
15to19
20to24
25to29
30to34
35to39
40to44
45to49
50to54
55to59
60to65
65 plus
Female seps
Male seps
Female pop
Male pop

What we need
• Measures of health that adequately cover the Aboriginal and Torres Strait Islander people of SA.– Measures of health as well as disease– Indicators of the health of youth and adults– Longitudinal measures useful to understand
early signs of health risk and to target prevention

The project
• Sponsored by the SA Aboriginal Health Partnership and Hosted by The Aboriginal Health Council of SA
• Developed a framework for better data on Aboriginal Health and Wellbeing in SA
• Extracted and reprocessed existing data to illustrate how data can guide decision making.
Framework concepts
• Use an Aboriginal perspective on health• Focus on differentials between Aboriginal people
living in different localities.• Use a geography that can be common between
sectors• Produce indicators that can be compared across
sectors.• Provide data for local, regional and State wide
decision making.
Data sources
• Education Department data on literacy and numeracy of children
• Department of Health, Hospital inpatient data from SA and NT
• Courts conviction data• Correctional services data• SAPOL apprehensions for criminal
offences data
Analytical methods
• Analysis by– Indigenous Area (ABS ATSIC AIGC)– Place of usual residence– Standardised indicators comparing each area
with the whole of the State Aboriginal population.
Analytical methods for hospital data
• Analysis by– Principal diagnoses– All diagnoses– Including Hospitalisations for persons resident
in SA treated in NT.

An example: The importance of local inequalities

An example: community differences in corrections
Mount Woodroffe
Amata & Homelands
Ernabella & Anilalya
Fregon & Homelands
West Coast
South Australia north-east
Coober Pedy (DC)
Indulkana
Mount Woodroffe
Ceduna (DC)
Whyalla
Port Augusta (C)
Port Lincoln (C)
Yorke Peninsula
Mid NorthRiverland
Berri
Murray Mallee
South East
Adelaide Hills
Adelaide Hills
Murray Bridge (RC)
SeeMetromap
Adelaide Hills
Port Augusta (C)
Strategic Planning and Research Branch,Department of Health, South AustraliaMay 2005ISAAC Hospital Inpatient Data Systems, 2002-03Dept. of Health SA and Dept. of Health NT
as defined by the ABS, 2001Lamberts Conformal Conic
Produced by:
Date:Data Sources:
Projection:
The information and material displayed herein are an information resource only and whilst all reasonable care has been taken in its preparation, the Department of Health does not make any representations or warranties as to its accuracy or otherwise. The Department of Health excludes all liability and or loss whatever its cause and to whomever arising directly or
indirectly from its use.
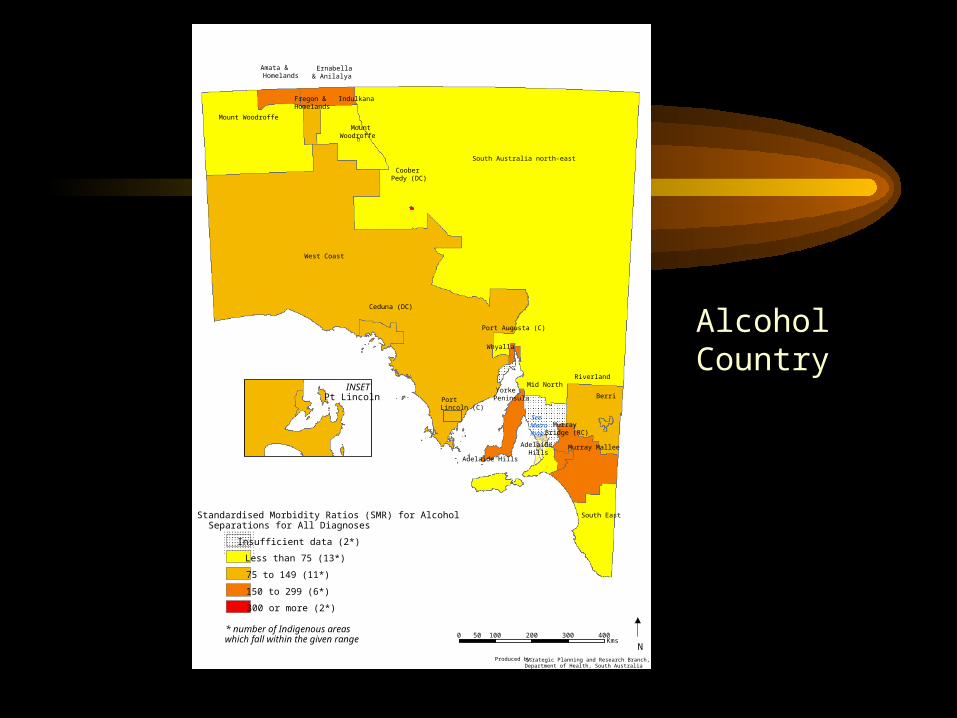
* number of Indigenous areas which fall within the given range
Standardised Morbidity Ratios (SMR) for AlcoholSeparations for All Diagnoses
Insufficient data (2*)
Less than 75 (13*)
75 to 149 (11*)
150 to 299 (6*)
300 or more (2*)
0 100 200 300 40050Kms
Pt LincolnINSET
N
Alcohol Country

Adelaide Hills
Mid North
Onkaparinga
Adelaide north
Adelaide south
Salisbury (C)
Adelaide east
Marion (C)
Tea Tree Gully (C)
Woodville
Adelaide west
Enfield east
Port Adelaide
Enfield inner
Adelaide (C)/Prospect (C)
Playford (C) - Elizabeth
Murray Mallee
Port Adelaide
* number of Indigenous areas in SAwhich fall within the given range
Standardised Morbidity Ratios (SMR) for AlcoholSeparations for All Diagnoses
Insufficient data (2*)
Less than 75 (13*)
75 to 149 (11*)
150 to 299 (6*)
300 or more (2*)
Alcohol Metro

Mount Woodroffe
Amata & Homelands
Ernabella & Anilalya
Fregon & Homelands
West Coast
South Australia north-east
Coober Pedy (DC)
Indulkana
Mount Woodroffe
Ceduna (DC)
Whyalla
Port Augusta (C)
Port Lincoln (C)
Yorke Peninsula
Mid NorthRiverland
Berri
Murray Mallee
South East
Adelaide Hills
Adelaide Hills
Murray Bridge (RC)
SeeMetromap
Adelaide Hills
Port Augusta (C)
* number of Indigenous areas which fall within the given range
Standardised Morbidity Ratios (SMR) for Mental HealthSeparations for All Diagnoses
0 100 200 300 40050Kms
Pt LincolnINSET
Insufficient data (0*)
Less than 75 (12*)
75 to 149 (16*)
150 to 299 (5*)
300 or more (1*)
N
Mental Health Country

Adelaide Hills
Mid North
Onkaparinga
Adelaide north
Adelaide south
Salisbury (C)
Adelaide east
Marion (C)
Tea Tree Gully (C)
Woodville
Adelaide west
Enfield east
Port Adelaide
Enfield inner
Adelaide (C)/Prospect (C)
Playford (C) - Elizabeth
Murray Mallee
Port Adelaide
* number of Indigenous areas in SAwhich fall within the given range
Standardised Morbidity Ratios (SMR) for Mental HealthSeparations for All Diagnoses
Less than 75 (12*)
75 to 149 (16*)
150 to 299 (5*)
300 or more (1*)
Insufficient data (0*)
Mental Health Metro

Mount Woodroffe
Amata & Homelands
Ernabella & Anilalya
Fregon & Homelands
West Coast
South Australia north-east
Coober Pedy (DC)
Indulkana
Mount Woodroffe
Ceduna (DC)
Whyalla
Port Augusta (C)
Port Lincoln (C)
Yorke Peninsula
Mid NorthRiverland
Berri
Murray Mallee
South East
Adelaide Hills
Adelaide Hills
Murray Bridge (RC)
SeeMetromap
Adelaide Hills
Port Augusta (C)
* number of Indigenous areas which fall within the given range
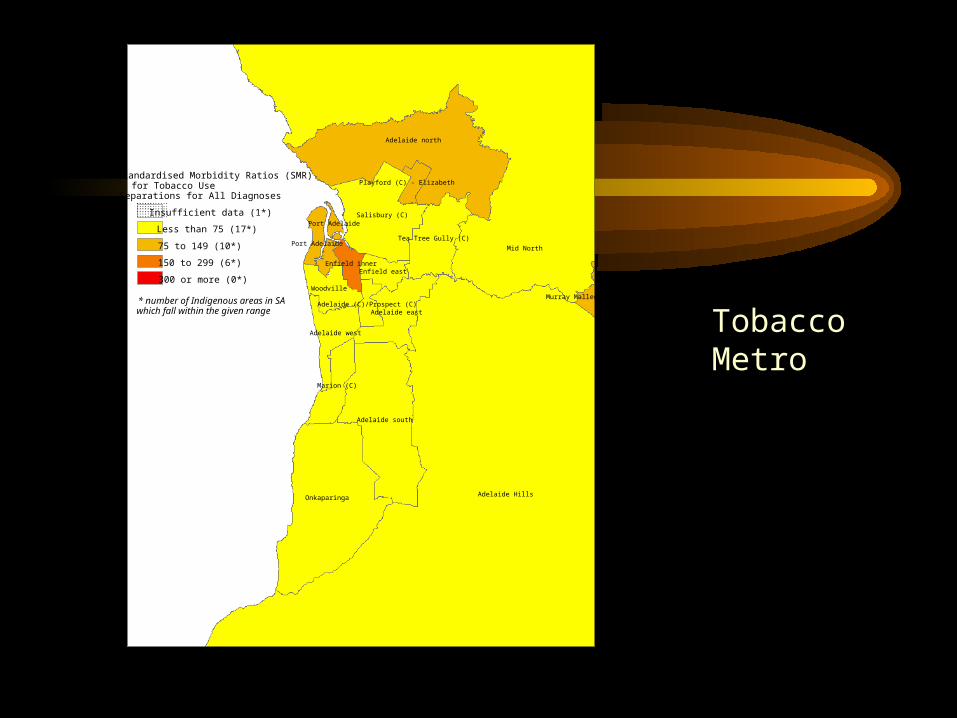
Standardised Morbidity Ratios (SMR) for Tobacco UseSeparations for All Diagnoses
0 100 200 300 40050Kms
Pt LincolnINSET
Insufficient data (1*)
Less than 75 (17*)
75 to 149 (10*)
150 to 299 (6*)
300 or more (0*)
N
Tobacco Country
Adelaide Hills
Mid North
Onkaparinga
Adelaide north
Adelaide south
Salisbury (C)
Adelaide east
Marion (C)
Tea Tree Gully (C)
Woodville
Adelaide west
Enfield east
Port Adelaide
Enfield inner
Adelaide (C)/Prospect (C)
Playford (C) - Elizabeth
Murray Mallee
Port Adelaide
* number of Indigenous areas in SAwhich fall within the given range
Standardised Morbidity Ratios (SMR) for Tobacco UseSeparations for All Diagnoses
Less than 75 (17*)
75 to 149 (10*)
150 to 299 (6*)
300 or more (0*)
Insufficient data (1*)
Tobacco Metro
Mount Woodroffe
Amata & Homelands
Ernabella & Anilalya
Fregon & Homelands
West Coast
South Australia north-east
Coober Pedy (DC)
Indulkana
Mount Woodroffe
Ceduna (DC)
Whyalla
Port Augusta (C)
Port Lincoln (C)
Yorke Peninsula
Mid NorthRiverland
Berri
Murray Mallee
South East
Adelaide Hills
Adelaide Hills
Murray Bridge (RC)
SeeMetromap
Adelaide Hills
Port Augusta (C)
* number of Indigenous areas which fall within the given range
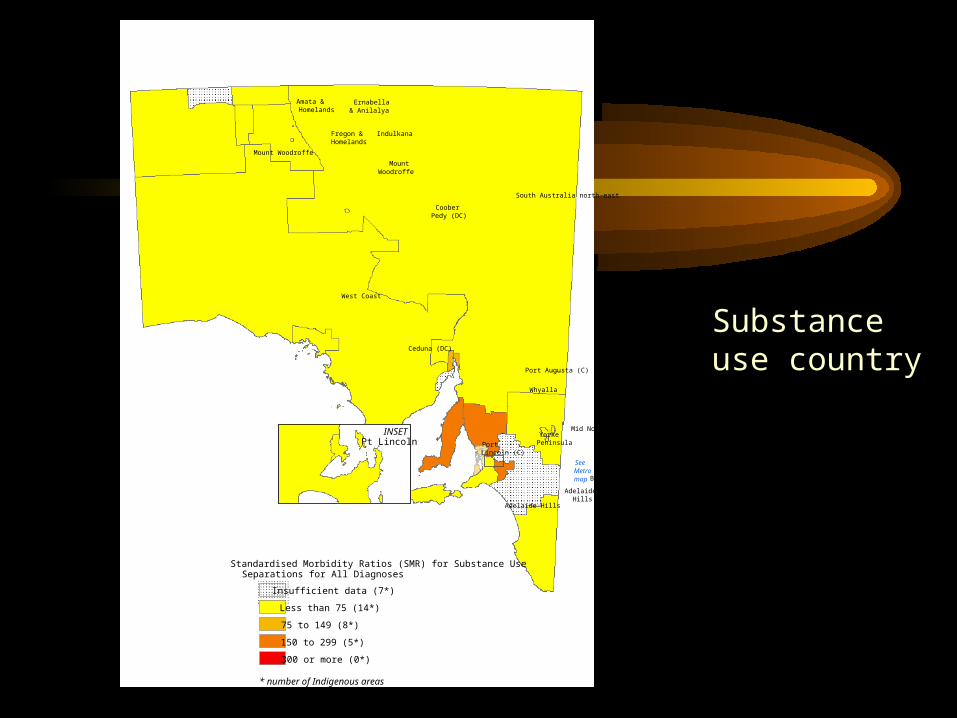
Standardised Morbidity Ratios (SMR) for Substance UseSeparations for All Diagnoses
Pt LincolnINSET
Insufficient data (7*)
Less than 75 (14*)
75 to 149 (8*)
150 to 299 (5*)
300 or more (0*)
Substance use country
An example of cross sectoral analysis
• A comparison of the geographic distribution of the comparative frequency of– Alcohol related hospital inpatient episodes– Mental health inpatient episodes and – Assault data from corrections and police
apprehensions
Correlation coefficient Alc
oh
ol
rela
ted
ho
spit
al s
epar
atio
ns
Men
tal
hea
lth
Sep
arat
ion
s
Men
tal
Hea
lth
Bed
day
s
SA
PO
L A
pp
reh
ensi
on
s o
ffen
ces
agai
nst
per
son
s
SA
PO
L A
ssau
lt p
oli
ce
Co
rrec
tio
ns
Ass
ault
o
ffen
ces
CS
O
Co
rrec
tio
ns
Ass
ault
off
ence
s P
riso
n
Co
rrec
tio
ns
tota
l o
ffen
ces
CS
O
Co
rrec
tio
ns
tota
l o
ffen
ces
pri
son
Co
rrec
tio
ns
tota
l C
SO
day
s
Co
rrec
tio
ns
tota
l p
riso
n d
ays
Co
rrec
tio
ns
tota
l C
SO
ep
iso
des
Co
rrec
tio
ns
tota
l p
riso
n e
pis
od
es
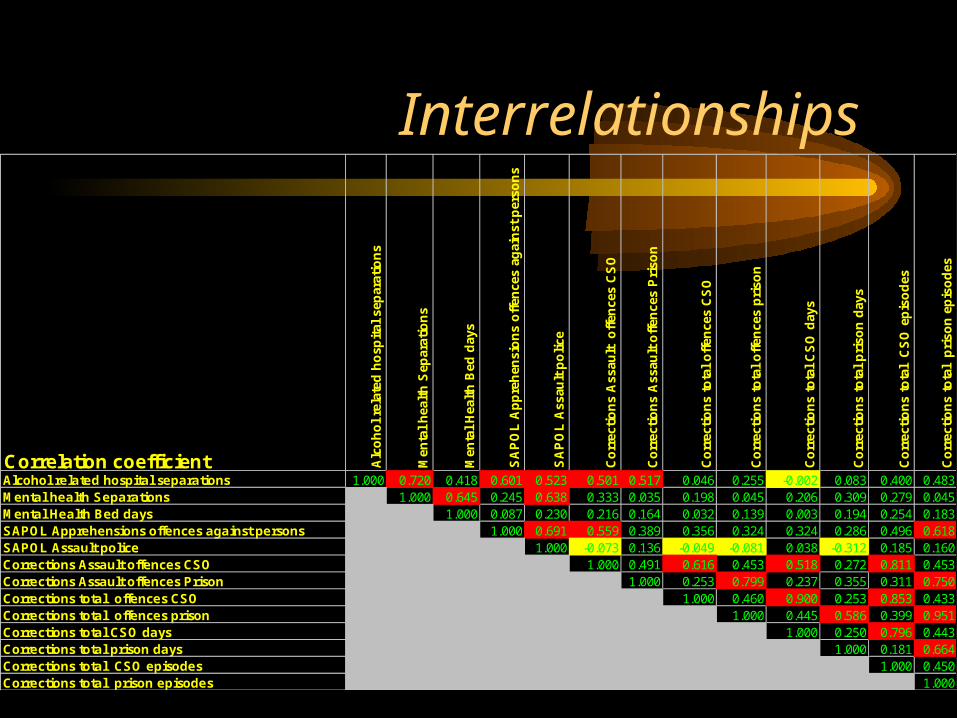
Alcohol related hospital separations 1.000 0.720 0.418 0.601 0.523 0.501 0.517 0.046 0.255 -0.002 0.083 0.400 0.483Mental health Separations 1.000 0.645 0.245 0.638 0.333 0.035 0.198 0.045 0.206 0.309 0.279 0.045Mental Health Bed days 1.000 0.087 0.230 0.216 0.164 0.032 0.139 0.003 0.194 0.254 0.183SAPOL Apprehensions offences against persons 1.000 0.691 0.559 0.389 0.356 0.324 0.324 0.286 0.496 0.618SAPOL Assault police 1.000 -0.073 0.136 -0.049 -0.081 0.038 -0.312 0.185 0.160Corrections Assault offences CSO 1.000 0.491 0.616 0.453 0.518 0.272 0.811 0.453Corrections Assault offences Prison 1.000 0.253 0.799 0.237 0.355 0.311 0.750Corrections total offences CSO 1.000 0.460 0.900 0.253 0.853 0.433Corrections total offences prison 1.000 0.445 0.586 0.399 0.951Corrections total CSO days 1.000 0.250 0.796 0.443Corrections total prison days 1.000 0.181 0.664Corrections total CSO episodes 1.000 0.450Corrections total prison episodes 1.000
Interrelationships
Major findings
• The prevalence in communities of Alcohol related disease and a wide range of assault measures and mental health prevalence are highly correlated.
• The prevalence in communities of Mental health diagnoses is more strongly associated with assaults to police than the prevalence of alcohol related disease.

Major findings
• Alcohol related disease and Mental Health diagnoses appear to be taken into account in choice of justice response.
• Community violence is strongly associated with the level of alcohol related disease.
• Patterns of Violence toward police suggest the need for earlier mental health intervention services and better police training in dealing with persons with mental health problems

Human CapitalCommunity Service Prison
NumberPer 1000 adults Number
Per 1000 adults
Days 166589 12992 54453 4247Episodes 483 38 383 30Offences Assault 261 20 413 32
Drug 81 6 10 1Other 1050 82 1259 98Traffic 759 59 496 39Total 2151 168 2178 170
Proportion Traffic offences 35% 23%
Notable features Almost 13 days per adult person on CSO4 days per adult in PrisonTraffic offences make up a significant proportion of the burden149 person years of imprisonment456 person years of Community service

Access to data
• The Aboriginal Health Council has produced a CD with detailed analyses including hospital data down to ICD10 Code for principal and all diagnoses [email protected]
• The South Australian Aboriginal Health Partnership is about to release a regional indicators publication which packages and maps summary data of key indicators by Indigenous Area [email protected]

The role of health researchers
• Extend the range of well documented health indicators
• Develop ways of analysing the data which take into account the small population and further explore local differentials and their causes.
Top Related