NACCHO Aboriginal Health News Alerts
77
Indigenous primary health care: results from the OSR and nKPI collections Web report | Last updated: 30 Jun 2020 | Author: AIHW | Citation AIHW Australian Institute of Health and Welfare 2020. Indigenous primary health care: results from the OSR and nKPI collections. Cat. no. IHW 227. Canberra: AIHW. Viewed 30 June 2020, https://www.aihw.gov.au/reports/indigenous-australians/indigenous-primary-health-care-results-osr- nkpi Information on organisations funded by the Australian Government under its Indigenous Australians’ Health Programme (IAHP) to deliver culturally appropriate primary health care services to Aboriginal and Torres Strait Islander Australians is available through two data collections—the Online Services Report (OSR); and the national Key Performance Indicators (nKPIs). This report presents the latest results from these collections. Cat. no: IHW 227 Findings from this report: At June 2019, 40% of Indigenous regular clients with type 2 diabetes had blood pressure in the recommended range Clients of Indigenous-specific primary health care organisations had 3.7 million episodes of care in 2018–19 Clients of Indigenous-specific primary health care organisations had 6.1 million contacts in 2018–19 At June 2019, 38% of Indigenous regular clients aged 50 and over were immunised against influenza Last updated 9/06/2020 v5.0 © Australian Institute of Health and Welfare 2020
Transcript of NACCHO Aboriginal Health News Alerts

Indigenous primary health care: results from the OSR and nKPI collectionsWeb report | Last updated: 30 Jun 2020 | Author: AIHW |
Citation
AIHW
Australian Institute of Health and Welfare 2020. Indigenous primary health care: results from the OSR and nKPI collections. Cat. no. IHW 227.
Canberra: AIHW. Viewed 30 June 2020, https://www.aihw.gov.au/reports/indigenous-australians/indigenous-primary-health-care-results-osr-
nkpi
Information on organisations funded by the Australian Government
under its Indigenous Australians’ Health Programme (IAHP) to deliver
culturally appropriate primary health care services to Aboriginal and
Torres Strait Islander Australians is available through two data
collections—the Online Services Report (OSR); and the national Key
Performance Indicators (nKPIs). This report presents the latest results
from these collections.
Cat. no: IHW 227
Findings from this report:
At June 2019, 40% of Indigenous regular clients with type 2
diabetes had blood pressure in the recommended range
Clients of Indigenous-specific primary health care organisations
had 3.7 million episodes of care in 2018–19
Clients of Indigenous-specific primary health care organisations
had 6.1 million contacts in 2018–19
At June 2019, 38% of Indigenous regular clients aged 50 and over
were immunised against influenza
Last updated 9/06/2020 v5.0
© Australian Institute of Health and Welfare 2020

Summary
Primary health care organisations play a critical role in helping to improve the health of Indigenous Australians. In 2018–19:
organisations provided Indigenous-specific
primary health care services
Read more on Organisations
FTE staff were employed
Read more on Workforce
clients were cared for
Read more on Clients
Most of these organisations provide data on a set of 24 process-of-care and health-outcome indicators for Indigenous Australians, focusing on
maternal and child health, preventative health and chronic disease management. At June 2019, these showed that, for Indigenous regular
clients:
aged 0–4 had a MBS health assessment
claimed in the last year
Read more on Maternal and child health
had risk factors recorded to enable CVD
assessment
Read more on Preventative health
with Type 2 diabetes had a HbA1c (blood
sugar) result within recommended guidelines
in the last 6 months
Read more on Chronic disease management
Last updated 12/06/2020 v13.0
© Australian Institute of Health and Welfare 2020

About this report
Primary health care organisations play a critical role in helping to improve health outcomes for Aboriginal and Torres Strait Islander Australians
(hereafter referred to as Indigenous Australians). Indigenous Australians may access either mainstream or Indigenous-specific primary health
care services (ISPHCS, hereafter referred to as organisations).
Information on organisations funded by the Australian Government under its Indigenous Australians’ Health Programme (IAHP) is available
through two data collections, the Online Services Report (OSR) and the national Key Performance Indicators (nKPIs):
OSR—collects information annually (financial year) on the organisations that provide Indigenous-specific primary health care services, such
contextual information about each organisation, client numbers, client contacts, episodes of care, and staffing levels
nKPIs—collects information twice a year (June and December) on a set of 24 process-of-care and health-outcome indicators for Indigenous
Australians, focusing on maternal and child health, preventative health and chronic disease management.
Most organisations contribute to both collections (Table 1).
Table 1: Number of organisations reporting to the OSR and nKPI collections, 2017, 2018 and 2019
June 2017(a) June 2018(a) June 2019(a)
Reporting to OSR 196 198 210
Reporting to nKPI 228 233 234
Reporting to both collections 179 184 201
a. Refers to the June collection period for the nKPI (covering the period January–June) and the financial year collection period for the
OSR. nKPI data are also collected in December each year (covering the period July–December).
Note: Excludes data from organisations receiving funding only for maternal and child health services.
This report presents the latest results from the OSR and nKPI collections. For more information on interpreting the data and data quality, see
Technical notes and Glossary. Detailed specifications and data quality statements for the collections are available on METeOR.
Purpose of the OSR and nKPI collections
The main purpose of the OSR and nKPI collections is to support continuous quality improvement (CQI) activity among organisations funded
under the IAHP. They can also be used to support policy and service planning at the national and state/territory levels, by monitoring
progress and highlighting areas for improvement. In addition to this, information from the collections helps monitor progress against the
Council of Australian Governments (COAG) Closing the Gap targets, and supports the national health goals set out in the Implementation
Plan for the National Aboriginal and Torres Strait Islander Health Plan 2013–2023.
Last updated 9/06/2020 v8.0
© Australian Institute of Health and Welfare 2020
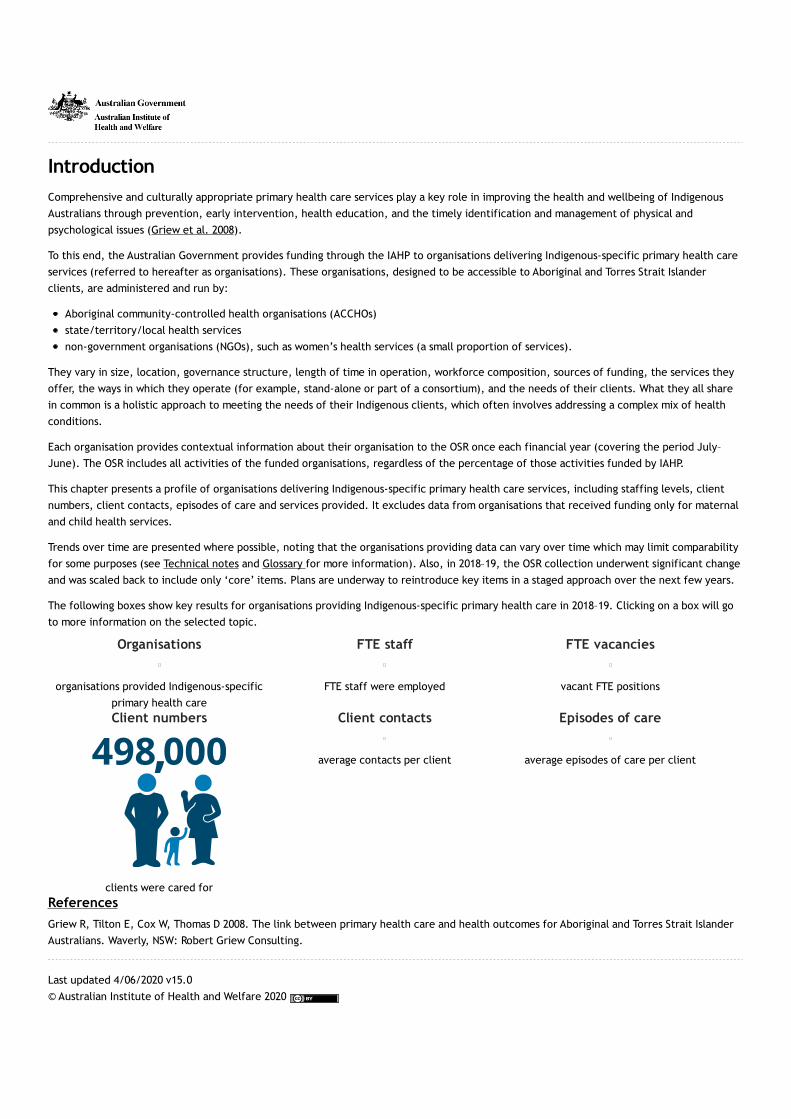
Introduction
Comprehensive and culturally appropriate primary health care services play a key role in improving the health and wellbeing of Indigenous
Australians through prevention, early intervention, health education, and the timely identification and management of physical and
psychological issues (Griew et al. 2008).
To this end, the Australian Government provides funding through the IAHP to organisations delivering Indigenous-specific primary health care
services (referred to hereafter as organisations). These organisations, designed to be accessible to Aboriginal and Torres Strait Islander
clients, are administered and run by:
Aboriginal community-controlled health organisations (ACCHOs)
state/territory/local health services
non-government organisations (NGOs), such as women’s health services (a small proportion of services).
They vary in size, location, governance structure, length of time in operation, workforce composition, sources of funding, the services they
offer, the ways in which they operate (for example, stand-alone or part of a consortium), and the needs of their clients. What they all share
in common is a holistic approach to meeting the needs of their Indigenous clients, which often involves addressing a complex mix of health
conditions.
Each organisation provides contextual information about their organisation to the OSR once each financial year (covering the period July–
June). The OSR includes all activities of the funded organisations, regardless of the percentage of those activities funded by IAHP.
This chapter presents a profile of organisations delivering Indigenous-specific primary health care services, including staffing levels, client
numbers, client contacts, episodes of care and services provided. It excludes data from organisations that received funding only for maternal
and child health services.
Trends over time are presented where possible, noting that the organisations providing data can vary over time which may limit comparability
for some purposes (see Technical notes and Glossary for more information). Also, in 2018–19, the OSR collection underwent significant change
and was scaled back to include only ‘core’ items. Plans are underway to reintroduce key items in a staged approach over the next few years.
The following boxes show key results for organisations providing Indigenous-specific primary health care in 2018–19. Clicking on a box will go
to more information on the selected topic.
Organisations
organisations provided Indigenous-specific
primary health care
FTE staff
FTE staff were employed
FTE vacancies
vacant FTE positions
Client numbers
clients were cared for
Client contacts
average contacts per client
Episodes of care
average episodes of care per client
References
Griew R, Tilton E, Cox W, Thomas D 2008. The link between primary health care and health outcomes for Aboriginal and Torres Strait Islander
Australians. Waverly, NSW: Robert Griew Consulting.
Last updated 4/06/2020 v15.0
© Australian Institute of Health and Welfare 2020
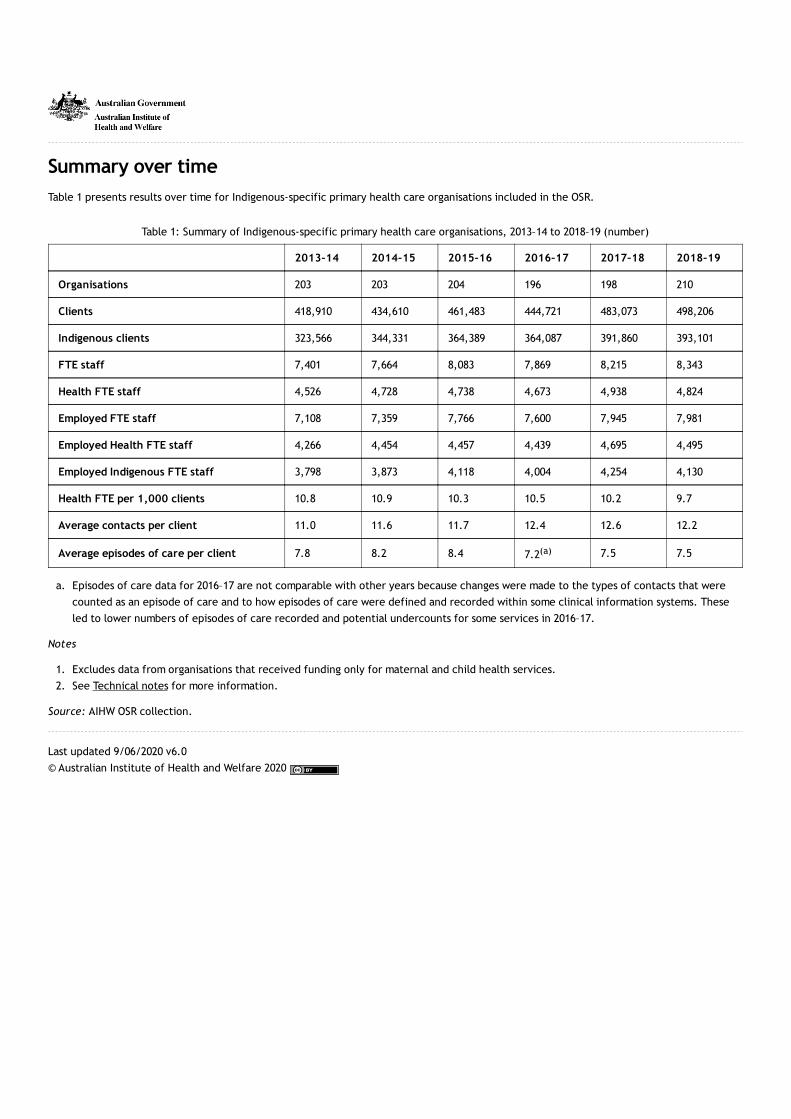
Summary over time
Table 1 presents results over time for Indigenous-specific primary health care organisations included in the OSR.
Table 1: Summary of Indigenous-specific primary health care organisations, 2013–14 to 2018–19 (number)
2013–14 2014–15 2015–16 2016–17 2017–18 2018–19
Organisations 203 203 204 196 198 210
Clients 418,910 434,610 461,483 444,721 483,073 498,206
Indigenous clients 323,566 344,331 364,389 364,087 391,860 393,101
FTE staff 7,401 7,664 8,083 7,869 8,215 8,343
Health FTE staff 4,526 4,728 4,738 4,673 4,938 4,824
Employed FTE staff 7,108 7,359 7,766 7,600 7,945 7,981
Employed Health FTE staff 4,266 4,454 4,457 4,439 4,695 4,495
Employed Indigenous FTE staff 3,798 3,873 4,118 4,004 4,254 4,130
Health FTE per 1,000 clients 10.8 10.9 10.3 10.5 10.2 9.7
Average contacts per client 11.0 11.6 11.7 12.4 12.6 12.2
Average episodes of care per client 7.8 8.2 8.4 7.2(a) 7.5 7.5
a. Episodes of care data for 2016–17 are not comparable with other years because changes were made to the types of contacts that were
counted as an episode of care and to how episodes of care were defined and recorded within some clinical information systems. These
led to lower numbers of episodes of care recorded and potential undercounts for some services in 2016–17.
Notes
1. Excludes data from organisations that received funding only for maternal and child health services.
2. See Technical notes for more information.
Source: AIHW OSR collection.
Last updated 9/06/2020 v6.0
© Australian Institute of Health and Welfare 2020
Organisations
In 2018–19, 210 primary health care organisations reported to the OSR.
Indigenous-specific primary health care organisations, by reporting period (number)
This Tableau visualisation shows the number of organisations for reporting periods 2013–14 to 2018–19.
Data supporting this visualisation are available in Excel supplementary data tables at Data.
Visualisation not available for printing
Of these:
one-third (33%) were in the Northern Territory
around two-thirds (65%) were Aboriginal Community Controlled Health Services (ACCHS), 30% were government-run organisations (many
of these were Northern Territory Government-run clinics) and 4% were other non-government-run organisations
just over one-third (36%) were in Very remote areas, 14% in Remote areas, 20% in Outer regional areas, 20% in Inner regional areas and
10% in Major cities.
Indigenous-specific primary health care organisations, by organisation type, 2018–19 (number and %)
This Tableau visualisation shows the number and percentage of organisations by the type of organisation (ACCHS, government, other) for
reporting period 2018–19.
Data supporting this visualisation are available in Excel supplementary data tables at Data.
Visualisation not available for printing
The size, in terms of number of clients, of organisations providing Indigenous-specific primary health care varies by jurisdiction, remoteness
and organisation type.
Indigenous-specific primary health care organisations, by client number (size) and state/territory or organisation type or remoteness,
reporting period (number)
This Tableau visualisation shows the number of organisations by the number of clients (<500, 500–1,499, 1,500–2,999, >3,000) for either:
type of organisation (ACCHS, government, other)
state/territory (NSW/ACT, Vic, Qld, WA, SA, Tas, NT)
remoteness area (Major cities, Inner regional, Outer regional, Remote, Very remote).
Reporting periods between 2013–14 to 2018–19 can be selected.
Data supporting this visualisation are available in Excel supplementary data tables at Data.
Visualisation not available for printing
Last updated 4/06/2020 v5.0
© Australian Institute of Health and Welfare 2020

Workforce
The OSR collects 2 measures of the workforce of organisations—full-time equivalent (FTE) staff and FTE vacancies.
The following boxes show key results for 2018–19. Clicking on a box will go to more information on the selected topic.
FTE staff
Indigenous staff
of employed FTE staff were Indigenous
Health staff
of employed FTE staff were health staff
Remoteness
of employed FTE were in Very remote areas
Vacant FTE positions
Indigenous vacancies
of vacant FTE positions were for Aboriginal
and Torres Strait Islander health workers and
practitioners
Health vacancies
of FTE vacancies were for health staff
Remoteness
of vacancies were in Very Remote areas
Last updated 29/05/2020 v8.0
© Australian Institute of Health and Welfare 2020

Workforce
Staffing (FTE)
At 30 June 2019, organisations employed just under 8,000 FTE staff. They also had around 360 visiting FTE staff not paid for by the
organisations themselves.
Employed FTE staff, by Indigenous status and state/territory or organisation type or remoteness, reporting period (number and %)
This Tableau visualisation shows the number and percentage of employed FTE staff by Indigenous status (Indigenous, non-Indigenous) for
either:
type of organisation (ACCHS, government, other)
state/territory (NSW/ACT, Vic, Qld, WA, SA, Tas, NT)
remoteness area (Major cities, Inner regional, Outer regional, Remote, Very remote).
Reporting periods between 2013–14 to 2018–19 can be selected.
Data supporting this visualisation are available in Excel supplementary data tables at Data
Visualisation not available for printing
Health staff represented over half (56%) of employed FTE staff (around 4,500 FTE). Nurses and midwives were the most common type of
health workers (15% of all employed FTE staff), followed by Aboriginal and Torres Strait Islander health workers and practitioners (12%) and
GPs (7%).
Around half of employed FTE staff were Indigenous (52%, or 4,100 FTE). Nearly half (47%) of health staff, and 58% of other staff, were
Indigenous.
Employed FTE staff, by position type and state/territory or organisation type or remoteness, reporting period (number in label and % on
axis)
This Tableau visualisation shows the number and percentage of employed FTE staff by position type for either:
type of organisation (ACCHS, government, other)
state/territory (NSW/ACT, Vic, Qld, WA, SA, Tas, NT)
remoteness area (Major cities, Inner regional, Outer regional, Remote, Very remote).
Reporting periods between 2013–14 to 2018–19 can be selected.
Data supporting this visualisation are available in Excel supplementary data tables at Data.
Visualisation not available for printing
Close to half (43%) of employed FTE staff were in either Very remote (23%) or Remote (19%) areas.
Last updated 4/06/2020 v4.0
© Australian Institute of Health and Welfare 2020

Workforce
Vacancies (FTE)
At 30 June 2019, organisations had over 390 vacant FTE positions. Of these:
77% of these were for health positions
36% were in Very Remote areas, 23% in Remote areas, 20% in Outer regional areas, 13% in Major cities, and 8% in Inner regional areas.
Vacant FTE positions, by vacancy type and state/territory or organisation type or remoteness, reporting period (number and %)
This Tableau visualisation shows the number and percentage of vacant FTE positions by vacancy type (health, other) for either:
type of organisation (ACCHS, government, other)
state/territory (NSW/ACT, Vic, Qld, WA, SA, Tas, NT)
remoteness area (Major cities, Inner regional, Outer regional, Remote, Very remote).
Reporting periods between 2013–14 to 2018–19 can be selected.
Data supporting this visualisation are available in Excel supplementary data tables at Data.
Visualisation not available for printing
Over half (51%) of health vacancies were for either:
Aboriginal and Torres Strait Islander health workers and practitioners (26%)
nurses and midwives (25%).
Vacant FTE positions, by vacancy type and state/territory or organisation type or remoteness, reporting period (number in label and %
on axis)
This Tableau visualisation shows the number and percentage of vacant FTE positions by vacancy type (expanded list) for either:
type of organisation (ACCHS, government, other)
state/territory (NSW/ACT, Vic, Qld, WA, SA, Tas, NT)
remoteness area (Major cities, Inner regional, Outer regional, Remote, Very remote).
Reporting periods between 2013–14 to 2018–19 can be selected.
Data supporting this visualisation are available in Excel supplementary data tables at Data.
Visualisation not available for printing
There were 0.8 vacant FTE positions per 1,000 clients. This was highest in Very remote and Remote areas—1.4 and 1.1 per 1,000 clients,
respectively, compared with 0.3 in Inner regional areas, 0.5 in Major cities and 0.6 in Outer regional areas.
Vacant FTE positions per 1,000 clients, by vacancy type and state/territory or organisation type or remoteness, reporting period
This Tableau visualisation shows the number of vacant FTE positions per 1,000 clients by vacancy type (health, other) for either:
type of organisation (ACCHS, government, other)
state/territory (NSW/ACT, Vic, Qld, WA, SA, Tas, NT)
remoteness area (Major cities, Inner regional, Outer regional, Remote, Very remote).
Reporting periods between 2013–14 to 2018–19 can be selected.
Data supporting this visualisation are available in Excel supplementary data tables at Data.
Visualisation not available for printing
Last updated 4/06/2020 v4.0
© Australian Institute of Health and Welfare 2020

Clients
The OSR collects 3 measures related to the clients that organisations see—client numbers, client contacts and episodes of care.
Client numbers
Client numbers refers to how many individuals receive health care by an organisation during the collection period. Each individual is
counted as a client once only, regardless of how many times they are seen. Visitors and transient clients are included in client counts, but
clients attending group activities only (and who do not receive individual care) are excluded. See also Regular client in Technical notes.
Client contacts
Client contacts are a count of the contacts made by each type of health worker in an organisation (both employed and visiting health
staff), and include those made by drivers and field officers (transport contacts). Client contacts do not include administrative contacts or
those relating to groups and residential care. See also Episodes of care and Technical notes.
Episodes of care
An episode of care is a contact between a client and 1 or more health workers in an organisation in 1 calendar day. All contacts with the
same client on the same day are counted as 1 episode of care only, but if more than 1 health worker sees that client in the same day (for
example, both a nurse and doctor see the same client) then 1 episode of care will count as multiple client contacts. An episode of care
may be provided by employed or visiting health staff, either on site or off site, and includes outreach, hospital contact with clients,
telephone contacts of a clinical nature, care delivered over the phone which results in an update to a client’s record and other clinical
consultations. Episodes of care do not include administrative contacts or those relating to groups and residential care.
Episodes of care data for 2016–17 are not comparable with other years. In that year, changes were made to the types of contacts that
were counted as an episode of care, with hospital-related contacts and telephone contacts excluded. There were also changes within
some clinical information systems in how episodes of care were defined and recorded. These led to lower numbers of episodes of care
recorded and potential undercounts for some services in 2016–17. See also Client contacts and Technical notes.
The following boxes show key results for 2018–19. Clicking on a box will go to more information on the selected topic.
Client numbers
Organisation type
of clients were seen by Aboriginal Community
Controlled Health Services
Indigenous clients
of clients were Indigenous
Remoteness
of clients were seen in Outer regional areas
Client contacts
Organisation type
client contacts at Aboriginal Community
Controlled Health Services
Indigenous clients
of Indigenous client contacts were with a
nurse/midwife
Remoteness
client contacts in Outer regional areas
Episodes of care

Episodes of care
Organisation type
episodes of care by Aboriginal Community
Controlled Health Services
Indigenous clients
of episodes of care were with Indigenous
clients
Remoteness
of episodes of care provided in Very remote
areas
Last updated 10/06/2020 v9.0
© Australian Institute of Health and Welfare 2020

Clients
Client numbers
In 2018–19, organisations saw around 498,000 clients.
Client numbers by sex and reporting period (number)
This Tableau visualisation shows the number of clients by sex for reporting periods 2013–14 to 2018–19.
Data supporting this visualisation are available in Excel supplementary data tables at Data.
Visualisation not available for printing
Of these:
46% were male
79% were Indigenous
25% were seen in Outer regional areas, 20% in both Major Cities and Very remote areas, 19% in Inner Regional areas, and 17% in Remote
areas
30% were seen in Queensland, 22% in New South Wales/the Australian Capital Territory (combined), and 21% in the Northern Territory
80% were seen by Aboriginal Community Controlled Health Services (ACCHS).
Client numbers, by sex and state/territory or organisation type or remoteness, reporting period (number and %)
This Tableau visualisation shows the number and percentage of clients by sex (male, female) for either:
type of organisation (ACCHS, government, other)
state/territory (NSW/ACT, Vic, Qld, WA, SA, Tas, NT)
remoteness area (Major cities, Inner regional, Outer regional, Remote, Very remote).
Reporting periods between 2013–14 to 2018–19 can be selected.
Data supporting this visualisation are available in Excel supplementary data tables at Data.
Visualisation not available for printing
Indigenous OSR clients and estimated Indigenous population, by state/territory, reporting period
This Tableau visualisation shows the number of Indigenous clients compared with the estimated Indigenous population (ERP). Reporting
periods between 2013–14 to 2018–19 can be selected.
Data supporting this visualisation are available in Excel supplementary data tables at Data.
Visualisation not available for printing
References
ABS (Australian Bureau of Statistics) 2019. Estimates and Projections, Aboriginal and Torres Strait Islander Australians, 2006 to 2031. ABS cat.
no. 3238.0. Canberra: ABS. [Series B projections]
Last updated 4/06/2020 v6.0
© Australian Institute of Health and Welfare 2020

Clients
Client contacts
In 2018–19, organisations had around 6.1 million client contacts.
Client contacts, by contact type and reporting period (number)
This Tableau visualisation shows the number of client contacts by contact type (general practitioner, nurse/midwife, AHP/APH, SEWB staff,
allied health/medical specialists, transport, other health) for reporting periods 2013–14 to 2018–19.
Data supporting this visualisation are available in Excel supplementary data tables at Data.
Visualisation not available for printing
Of these:
86% were with Indigenous clients
25% were provided in Outer regional areas
30% were provided in Queensland, 21% in New South Wales/the Australian Capital Territory (combined), and 21% in the Northern Territory
85% were provided by Aboriginal Community Controlled Health Services (ACCHS)
31% were made by nurses and midwives
29% were made by a general practitioner (GP)
16% were made by Aboriginal and Torres Strait Islander health workers and practitioners
7% were transport contacts by drivers and field officers.
Client contacts, by contact type and state/territory or organisation type or remoteness, reporting period (number and %)
This Tableau visualisation shows the number and percentage of client contacts by contact type (general practitioner, nurse/midwife,
AHP/APH, SEWB staff, allied health/medical specialists, transport, other health) for either:
type of organisation (ACCHS, government, other)
state/territory (NSW/ACT, Vic, Qld, WA, SA, Tas, NT)
remoteness area (Major cities, Inner regional, Outer regional, Remote, Very remote).
Reporting periods between 2013–14 to 2018–19 can be selected.
Data supporting this visualisation are available in Excel supplementary data tables at Data.
Visualisation not available for printing
There was an average of 12.2 contacts per client. This has generally increased over time.
Average number of client contacts per client, by contact type and state/territory or organisation type or remoteness, reporting period
This Tableau visualisation shows the average number of client contacts per client by contact type (general practitioner, nurse/midwife,
AHP/APH, SEWB staff, allied health/medical specialists, transport, other health) for either:
type of organisation (ACCHS, government, other)
state/territory (NSW/ACT, Vic, Qld, WA, SA, Tas, NT)
remoteness area (Major cities, Inner regional, Outer regional, Remote, Very remote).
Reporting periods between 2013–14 to 2018–19 can be selected.
Data supporting this visualisation are available in Excel supplementary data tables at Data.
Visualisation not available for printing
Last updated 4/06/2020 v7.0
© Australian Institute of Health and Welfare 2020

Clients
Episodes of care
In 2018–19, organisations had around 3.7 million episodes of care.
Episodes of care by sex and reporting period (number)
This Tableau visualisation shows the number of episodes of care by sex (male, female) for reporting periods 2013–14 to 2018–19.
Data supporting this visualisation are available in Excel supplementary data tables at Data.
Visualisation not available for printing
Of these:
85% were with Indigenous clients
58% were with female clients
23% were provided in Very remote areas
29% were provided in Queensland, 23% in the Northern Territory and 20% in New South Wales/the Australian Capital Territory (combined)
81% were provided by Aboriginal Community Controlled Health Services (ACCHS).
Episodes of care, by sex and state/territory or organisation type or remoteness, reporting period (number and %)
This Tableau visualisation shows the number and percentage of episodes of care by sex (male, female) for either:
type of organisation (ACCHS, government, other)
state/territory (NSW/ACT, Vic, Qld, WA, SA, Tas, NT)
remoteness area (Major cities, Inner regional, Outer regional, Remote, Very remote).
Reporting periods between 2013–14 to 2018–19 can be selected.
Data supporting this visualisation are available in Excel supplementary data tables at Data.
Visualisation not available for printing
There was an average of 7.5 episodes of care per client. This has generally decreased over time.
Average number of episodes of care per client, by sex and state/territory or organisation type or remoteness, reporting period
This Tableau visualisation shows the average number of episodes of care per client by sex (male, female) for either:
type of organisation (ACCHS, government, other)
state/territory (NSW/ACT, Vic, Qld, WA, SA, Tas, NT)
remoteness area (Major cities, Inner regional, Outer regional, Remote, Very remote).
Reporting periods between 2013–14 to 2018–19 can be selected.
Data supporting this visualisation are available in Excel supplementary data tables at Data.
Visualisation not available for printing
Last updated 4/06/2020 v5.0
© Australian Institute of Health and Welfare 2020

Services provided
An organisation may deliver services from one or more sites. In 2017–18, Indigenous-specific primary health care was delivered by 198
organisations from 383 service delivery sites (Table 1). Data on service delivery sites and services provided were not collected in 2018–19.
Work is underway to revise and reintroduce these items for future collections.
Most sites provided clinical services such as the diagnosis and treatment of chronic illnesses (88%), mental health and counselling services
(88%), maternal and child health care (86%), and antenatal care (78%). Around two-thirds provided tobacco programs (69%) and substance-use
and drug and alcohol programs (66%).
Most organisations provided access to a doctor (86%) and just over half (54%) delivered a wide range of services, including all of the following
during usual opening hours: the diagnosis and treatment of illness and disease; antenatal care; maternal and child health care; social and
emotional wellbeing/counselling services; substance use programs; and on‑site or off-site access to specialist, allied health and dental care
services.
Most organisations (95%) also provided group activities as part of their health promotion and prevention work. For example, in 2017–18, these
organisations provided around:
8,400 physical activity/healthy weight sessions
3,700 living skills sessions
4,600 chronic disease client support sessions
4,100 tobacco-use treatment and prevention sessions.
In addition to the services they provide, organisations reported on service gaps and challenges they faced and could list up to 5 of each from
predefined lists. These were not ranked in terms of priority. In 2017–18, around two-thirds of organisations (68%) reported mental
health/social and emotional health and wellbeing services as a gap faced by the community they served. This was followed by youth services
(54%). Over two-thirds of organisations (71%) reported the recruitment, training and support of Aboriginal and Torres Strait Islander staff as a
challenge in delivering quality health services.
Table 1: Service delivery sites, type of service, 2017–18
Type of service Number %
Social and emotional wellbeing/mental health/counselling 337 88.0
Diagnosis/treatment of chronic illness/disease 336 87.7
Transport 331 86.4
Maternal/child health care 328 85.6
Treatment of injury 317 82.8
Diagnosis/treatment of infectious illness/disease 316 82.5
Antenatal care 298 77.8
Tobacco programs 265 69.2
Substance use/drug and alcohol programs 252 65.8
Total sites 383 100.0
Clinical services provided, by either state/territory or organisation type or remoteness, by reporting period (number in label and % on
axis)
This Tableau visualisation shows the number and percentage of vacant FTE positions by vacancy type (expanded list) for either:
type of organisation (ACCHS, government, other)
state/territory (NSW/ACT, Vic, Qld, WA, SA, Tas, NT)
remoteness area (Major cities, Inner regional, Outer regional, Remote, Very remote).
Reporting periods between 2013–14 to 2017–18 can be selected. The option to explore further by the topic of interest (health promotion
activities; group activities; access to specialist, allied health and dental services; service gaps; service challenges) is provided.

Data supporting this visualisation are available in Excel supplementary data tables at Data.
Visualisation not available for printing
Last updated 4/06/2020 v7.0
© Australian Institute of Health and Welfare 2020

Introduction
The nKPIs are a set of 24 indicators provided by organisations receiving IAHP funding to deliver comprehensive and culturally appropriate
primary health care services to Indigenous Australians.
The nKPIs are collected for Indigenous regular clients of each organisation twice a year in:
July—covering the period 1 January–30 June
January—covering the period 1 July–31 December.
Indigenous regular clients
Organisations collecting nKPIs may see a mix of Indigenous and non-Indigenous clients. Some of these are considered regular clients of the
organisation. Only data for Indigenous regular clients are provided to the nKPIs.
For the purposes of the nKPIs, an Indigenous regular client is defined as an Aboriginal or Torres Strait Islander Australian who has an active
medical record—that is, who attended a particular primary health care organisation at least 3 times in the previous 2 years. This definition
is consistent with the RAGCP definition of an active patient (RACGP 2020). See Technical notes and Glossary for more information.
The nKPIs cover 15 process-of-care and 9 health-outcome indicators organised under three domains (see Technical notes for a list of
indicators by domain and type). While the process-of-care indicators are largely (but not completely) under the control of organisations and
indicate good practice in primary health care, health outcomes are influenced by a range of factors known as social determinants (such as
education, employment, housing, access to resources, racism) some of which are beyond the immediate control of organisations.
As such, the nKPIs needs to be viewed in context of the broader environment in which organisations operate and in which the data are
collected. In particular, it is important to acknowledge that the nKPIs capture only a subset of the important work that organisations do each
day. Data from this collection can make an important contribution when used by health service providers at the local level to identify
opportunities and to measure progress towards achieving change, or when used by policy makers to inform policy decisions.
This chapter presents results for each nKPI, providing an indication of areas where further investigation and improvements might be needed.
Where possible, trends over time are presented. However, the number of organisations included varies over time and by indicator for each
period depending on the quality of the data submitted. This may limit comparability over time for some purposes (see Technical notes for
more information).
The following tables show key trends over time for each indicator. Click on the link to get more information on the associated indicator.
Key: ✔ = improved; ✘ = not improved; ► = no change
Maternal and child health indicators
✔First antenatal visit before 13
weeks✔ Birthweight recorded ► Low birthweight
Read more on PI13 Read more on PI01 Read more on PI02
✔Smoking during pregnancy (current
smoker)✔ Child immunisation ✔
MBS health assessment (item 715)—
aged 0–4
Read more on PI11 Read more on PI04 Read more on PI03
Preventative health indicators
✔ Smoking status recorded ✘ Current smoker ✔Alcohol consumption status
recorded
Read more on PI09 Read more on PI10 Read more on PI16
✘ AUDIT-C result of high-risk ✔MBS health assessment (item 715)—
aged 25 and over✔
Risk factors to enable CVD
assessment
Read more on PI17 Read more on PI03 Read more on PI20

✔ High absolute cardiovascular risk ✘Cervical screening in previous 3
years ✔Immunised against influenza—aged
50 and over
Read more on PI21 Read more on PI22 Read more on PI14
✘BMI classified as overweight or
obese
Read more on PI12
Chronic disease management indicators
✔General Practitioner Management
Plan—type 2 diabetes✔
Team Care Arrangement—type 2
diabetes✔
Blood pressure result recorded—
type 2 diabetes
Read more on PI07 Read more on PI08 Read more on PI23
✘Blood pressure result of
≤130/80mmHg—type 2 diabetes✔
HbA1c result recorded (previous 6
months)—type 2 diabetes✔
HbA1c result of ≤53 mmol/mol—
type 2 diabetes
Read more on PI24 Read more on PI05 Read more on PI06
✔Kidney function test recorded—
type 2 diabetes✘
Kidney test, eGFR result of ≥60
mL/min/1.73m2—type 2 diabetes✔
Kidney test, ACR result of <2.5
(Males) or <3.5 (Females)—type 2
diabetes
Read more on PI18 Read more on PI19-A Read more on PI19-B
✔ Kidney function test recorded—CVD ✔Kidney test, eGFR result of ≥60
mL/min/1.73m2—CVD✔
Immunised against influenza—type
2 diabetes
Read more on PI18 Read more on PI19-A Read more on PI15
✔ Immunised against influenza—COPD
Read more on PI15
References
The Royal Australian College of General Practitioners. Standards for general practices. 5th edn. East Melbourne, Vic: RACGP, 2020.
Last updated 9/06/2020 v68.0
© Australian Institute of Health and Welfare 2020

Summary over time
Table 1 presents nKPI results and trends between the June 2017 and June 2019 reporting periods.
Maternal and child health indicators
Maternal and child health indicatorsJun.
2017
Dec.
2017
Jun.
2018
Dec.
2018
Jun.
2019Trend (b)
PI13: First antenatal visit before 13 weeks 39.2 41.2 42.4 42.0 40.6 ✔
PI01: Birthweight recorded 69.5 72.8 73.7 73.2 71.1 ✔
PI02: Low birthweight 11.4 12.4 13.2 12.1 11.6 ►
PI11: Smoking during pregnancy (current smoker) 48.9 50.0 49.2 48.0 48.2 ✔
PI04: Child immunisation(c) 69.1 69.1 73.4 69.5 73.0 ✔
PI03: MBS health assessment (item 715)—clients
aged 0–435.0 35.0 37.1 36.7 38.4 ✔
Preventative health indicators
Preventative health indicatorsJun.
2017
Dec.
2017
Jun.
2018
Dec.
2018
Jun.
2019Trend (b)
PI09: Smoking status recorded 80.3 81.3 82.2 82.0 81.8 ✔
PI10: Current smoker 51.7 52.1 52.1 51.9 52.2 ✘
PI16: Alcohol consumption status recorded 59.4 60.6 61.7 60.7 62.0 ✔
PI17: AUDIT-C result of high-risk 49.0 48.3 47.9 48.9 48.9 ✘
PI03: MBS health assessment (item 715)—aged 25
and over50.1 50.6 51.7 52.2 53.6 ✔
PI20: Risk factors to enable CVD assessment 46.1 47.0 48.7 49.9 50.3 ✔
PI21: High absolute cardiovascular risk 35.6 35.8 34.7 34.9 35.1 ✔
PI22: Cervical screening in previous 5 years (c) 43.9 43.8 46.7 42.7 42.5 ✘
PI14: Immunised against influenza—aged 50 and
over31.9 35.6 34.1 36.5 37.7 ✔
PI12: BMI classified as overweight or obese 71.0 70.7 70.8 71.2 71.2 ✘
Chronic disease management indicators
Chronic disease management indicatorsJun.
2017
Dec.
2017
Jun.
2018
Dec.
2018
Jun.
2019Trend (b)
PI07: General Practitioner Management Plan—type 2
diabetes53.6 54.7 56.2 56.4 56.1 ✔
PI08: Team Care Arrangement—type 2 diabetes 51.1 52.6 54.0 54.0 53.4 ✔

PI23: Blood pressure result recorded—type 2
diabetes 64.0 64.1 66.2 65.0 66.8 ✔
PI24: Blood pressure result of ≤130/80mmHg—type 2
diabetes41.0 42.7 41.3 42.9 40.3 ✘
PI05: HbA1c result recorded (previous 6 months)—
type 2 diabetes48.9 48.4 52.0 49.0 52.2 ✔
PI06: HbA1c result of ≤53 mmol/mol—type 2
diabetes38.3 36.5 38.9 37.9 38.6 ✔
PI18: Kidney function test recorded—type 2
diabetesn.a. 62.6 62.0 63.0 64.0 ✔
PI19-A: Kidney test, eGFR result of ≥60 mL/min/1.73
m2—type 2 diabetesn.a. 81.3 81.9 81.1 81.3 ✘
PI19-B: Kidney test, ACR result of <2.5 (Males) or
<3.5 (Females)—type 2 diabetesn.a. 39.3 41.2 41.7 43.7 ✔
PI18: Kidney function test recorded—CVD n.a. 57.9 58.9 60.9 62.0 ✔
PI19-A: Kidney test, eGFR result of ≥60 mL/min/1.73
m2—CVDn.a. 76.2 76.2 76.6 77.3 ✔
PI15: Immunised agains influenza—type 2 diabetes 30.6 36.1 33.8 36.2 36.0 ✔
PI15: Immunised against influenza—COPD 31.9 37.1 37.2 40.4 38.1 ✔
a. Proportions in this table are rounded to 1 decimal place.
b. Trend is calculated as a linear trend between the June 2017 and June 2019 reporting periods, including the December reporting periods.
c. This is affected by a change in cervical screening guidelines and the way it was collected in the nKPIs (see Technical notes for more
information)
Notes
1. Key: ✔ = improved; ✘ = not improved; ► = no change
2. The indicator ‘PI04: Child immunisation’ is excluded due to concerns over data validity.
3. See Technical notes for more information.
Last updated 5/06/2020 v33.0
© Australian Institute of Health and Welfare 2020

Organisations and clients
The number of organisations providing nKPI data each reporting period varies—in the June 2017 reporting period there were 228
organisations, increasing to 233 at June 2018, and again to 234 at June 2019.
Reporting organisations, by state/territory and remoteness, reporting period
This Tableau visualisation shows the number of organisations reporting to the nKPIs by:
state/territory (NSW/ACT, Vic, Qld, WA, SA, Tas, NT)
remoteness area (Major cities, Inner regional, Outer regional, Remote, Very remote).
Reporting periods of either June 2017, December 2017, June 2018, December 2018 or June 2019 can be selected.
Data supporting this visualisation are available in Excel supplementary data tables at Data.
Visualisation not available for printing
The number of Indigenous regular clients organisations see has increased over time—from 218,945 at June 2017, to 238,845 at June 2018, and
243,108 at June 2019.
Visualisation not available for printing
Visualisation not available for printing
Visualisation not available for printing
References
ABS (Australian Bureau of Statistics) 2019. Estimates and Projections, Aboriginal and Torres Strait Islander Australians, 2006 to 2031. ABS cat.
no. 3238.0. Canberra: ABS. [Series B projections]
Last updated 9/06/2020 v15.0
© Australian Institute of Health and Welfare 2020

Maternal and child health indicators
Maternal and child health indicators in the nKPIs consist of 4 process-of-care and 2 health-outcome indicators.
The following boxes show key results for Indigenous regular clients. Click on a box to get more information on the associated indicator.
First antenatal visit
who gave birth in the last year had their first
antenatal visit before 13 weeks
Process-of-care indicator
Birthweight recorded
born in the last year had their birthweight
recorded
Process-of-care indicator
Birthweight result
born in the last year had a normal
birthweight
Health-outcome indicator
Smoking during pregnancy
who gave birth in the last year were a
current smoker in that time
Health-outcome indicator
Child immunisation
aged 12–72 months were fully immunised
Process-of-care indicator
MBS health assessment
aged 0–4 had a MBS health assessment
claimed in the last year
Process-of-care indicator
Last updated 12/06/2020 v44.0
© Australian Institute of Health and Welfare 2020

Maternal and child health indicators
First antenatal visit (PI13)
This indicator is the proportion of female Indigenous regular clients who gave birth within the previous 12 months who had their first
antenatal care visit within the following periods:
before 13 weeks
13–19 weeks
20 or more weeks
not recorded or no visit.
It is collected for age groups:
less than 20
20–34
35 and over.
Why is antenatal care important?
Antenatal care is a planned visit between a pregnant woman and a midwife or doctor to assess and improve the wellbeing of the mother
and baby throughout pregnancy. It does not include visits where the sole purpose is to confirm the pregnancy.
Antenatal care provides an opportunity to find, treat, and provide advice on chronic or pre-existing conditions that might cause
pregnancy-related complications, such as hypertension, diabetes, mental health problems, sexually transmitted infections, tobacco and
alcohol misuse, inadequate nutrition, and unhealthy weight.
Regular antenatal care, and especially that starting in the first trimester, is associated with less pregnancy-related complications and with
positive maternal and child health outcomes (AIHW 2019a). Indigenous mothers are less likely than non-Indigenous mothers to have their
first antenatal care visit in the first trimester (AIHW 2019b).
At June 2019, 41% of female Indigenous regular clients who gave birth in the previous 12 months had their first antenatal visit in the first
trimester (before 13 weeks gestational age). The first trimester in the nKPIs is different to that collected in the National Perinatal Data
Collection (NPDC), which considers the first trimester as before 14 week gestational age.
Timing of first antenatal visit, by reporting period
This Tableau visualisation shows the percentage of female Indigenous regular clients who gave birth in the last year by the timing of their first
antenatal visit (gestational age not recorded, no visit recorded, before 13 weeks, 13–19 weeks, 20 or more weeks) and reporting period (June
2017, December 2017, June 2018, December 2018 and June 2019).
Data supporting this visualisation are available in Excel supplementary data tables at Data.
Visualisation not available for printing
Having the first antenatal visit in the first trimester was highest in
South Australia (52%)
Inner regional areas (49%).
It was lowest in:
Queensland (29%)
Major cities (29%).
However, this is affected by the completeness of the recording of antenatal visits in each jurisdiction (see Technical notes for more
information).
Timing of first antenatal visit, by either state/territory or remoteness, reporting period
Two Tableau visualisations are presented here. The first shows the percentage of female Indigenous regular clients who gave birth in the last
year by the timing of their first antenatal visit (select for gestational age not recorded, no visit recorded, before 13 weeks, 13–19 weeks, or
20 or more weeks) for either:
state/territory (NSW/ACT, Vic, Qld, WA, SA, Tas, NT, Australia)
remoteness area (Major cities, Inner regional, Outer regional, Remote, Very remote, Australia).

Reporting periods of either June 2017, December 2017, June 2018, December 2018 or June 2019 can be selected.
The second visualisation shows the selected information from the first visualisation by age group (<20, 20–34, 35+).
Data supporting this visualisation are available in Excel supplementary data tables at Data.
Visualisation not available for printing
References
AIHW (Australian Institute of Health and Welfare) 2019a. Australia’s mothers and babies 2017—in brief. Perinatal statistics series no. 35. Cat.
no. PER 100. Canberra: AIHW. Viewed 16 March 2020.
AIHW 2019b. Australia’s mothers and babies 2017—data visualisations. Cat. no. PER 101. Canberra: AIHW. Viewed 16 March 2020.
Last updated 12/06/2020 v11.0
© Australian Institute of Health and Welfare 2020

Maternal and child health indicators
Birthweight (PI01 and PI02)
Indicators related to birthweight in the nKPI are:
the proportion of Indigenous babies born within the previous 12 months whose birthweight was recorded at the primary health care
organisation
the proportion of Indigenous babies born within the previous 12 months whose birthweight results were low, normal or high.
Why is birthweight important?
Birthweight is a key indicator of a baby’s immediate health and a determinant of their future health. Measuring birthweight allows infants
to be given early and suitable intervention, which can mitigate adverse outcomes. Indigenous mothers are less likely to have a baby of
normal birthweight than non-Indigenous mothers (AIHW 2019b).
Low birthweight babies (less than 2,500 grams) are more likely to die in infancy or to be at increased risk of illness in infancy. Low
birthweight is closely associated with pre-term birth—almost 3 in 4 low birthweight babies were pre-term, and more than half of pre-term
babies were of low birthweight in 2017 (AIHW 2019a). Babies may also be low birthweight because they are small for gestational age, while
some low-birthweight babies may be both pre-term and small for gestational age.
High birthweight (4,500 grams or more) is also of concern. Data from 12 high, middle and low-income countries indicates that higher
birthweight was associated with increased odds of obesity among children aged 9–11 (Qiao et al. 2015).
Birthweight recorded (PI01)
This indicator is the proportion of Indigenous babies born within the previous 12 months whose birthweight has been recorded at the primary
health care organisation.
At June 2019, 71% of Indigenous babies born in the previous 12 months had their birthweight recorded.
Birthweight recorded, by reporting period
This Tableau visualisation shows the percentage of Indigenous babies born in the last year whose birthweight was recorded at the primary
health care organisation by reporting period (June 2017, December 2017, June 2018, December 2018 and June 2019).
Data supporting this visualisation are available in Excel supplementary data tables at Data.
Visualisation not available for printing
Recording of birthweight was highest in:
South Australia (81%)
Major cities (82%).
It was lowest in:
the Northern Territory (54%)
Very remote areas (55%).
Birthweight recorded, by either state/territory or remoteness, reporting period
This Tableau visualisation shows the percentage of Indigenous babies born in the last year whose birthweight was recorded at the primary
health care organisation for either:
state/territory (NSW/ACT, Vic, Qld, WA, SA, Tas, NT, Australia)
remoteness area (Major cities, Inner regional, Outer regional, Remote, Very remote, Australia).
Reporting periods of either June 2017, December 2017, June 2018, December 2018 or June 2019 can be selected.
Data supporting this visualisation are available in Excel supplementary data tables at Data.
Visualisation not available for printing
Birthweight result (PI02)

This indicator is the proportion of Indigenous babies born within the previous 12 months whose birthweight result recorded at the primary
health care organisation were low, normal or high.
At June 2019, 86% of Indigenous babies born in the previous year had a normal birthweight.
Birthweight result, by reporting period
This Tableau visualisation shows the percentage of Indigenous babies born in the last year whose birthweight was recorded at the primary
health care organisation by birthweight result (low, normal, high) and reporting period (June 2017, December 2017, June 2018, December
2018 and June 2019).
Data supporting this visualisation are available in Excel supplementary data tables at Data.
Visualisation not available for printing
Having a normal birthweight was highest in:
Queensland and South Australia (both 89%)
Major cities and Inner regional areas (both 88%).
It was lowest in:
Victoria/Tasmania (82% combined)
Remote areas (82%).
Birthweight result, by either state/territory or remoteness, reporting period
This Tableau visualisation shows the percentage of Indigenous babies born in the last year whose birthweight was recorded at the primary
health care organisation by birthweight result (select for low, normal, or high) for either:
state/territory (NSW/ACT, Vic, Qld, WA, SA, Tas, NT, Australia)
remoteness area (Major cities, Inner regional, Outer regional, Remote, Very remote, Australia).
Reporting periods of either June 2017, December 2017, June 2018, December 2018 or June 2019 can be selected.
Data supporting this visualisation are available in Excel supplementary data tables at Data.
Visualisation not available for printing
References
AIHW (Australian Institute of Health and Welfare) 2019a. Australia’s mothers and babies 2017—in brief. Perinatal statistics series no. 35. Cat.
no. PER 100. Canberra: AIHW. Viewed 16 March 2020.
AIHW 2019b. Australia’s mothers and babies 2017—data visualisations. Cat. no. PER 101. Canberra: AIHW. Viewed 16 March 2020.
Qiao Y, Ma J, Wang Y, Katzmarzyk P, Chaput J, Fogelholm M et al. 2015. Birth weight and childhood obesity: a 12-country study. International
Journal of Obesity Supplements 5, S74–S79.
Last updated 12/06/2020 v17.0
© Australian Institute of Health and Welfare 2020

Maternal and child health indicators
Smoking during pregnancy (PI11)
This indicator is the proportion of female Indigenous regular clients aged 15 and over who gave birth within the previous 12 months and whose
smoking status was recorded within the previous 12 months as:
current smoker
ex-smoker
never smoked.
It is collected for age groups:
15–19
20–24
25–34
35 and over.
Why not smoking during pregnancy is important?
Tobacco smoking is the smoking of tobacco products, including packet cigarettes, roll-your-own cigarettes, cigars or pipes.
Tobacco smoking during pregnancy is the most common preventable risk factor for pregnancy complications, and is associated with poorer
perinatal outcomes, including low birthweight, being small for gestational age, pre-term birth and perinatal death (AIHW 2019a; AIHW
2019b). Women who stop smoking during pregnancy can reduce the risk of adverse outcomes for themselves and their babies.
Indigenous mothers are more likely to smoke during pregnancy than non-Indigenous mothers. However, the proportion of Indigenous
mothers who smoke during pregnancy is decreasing (since 2010, when data first became atavailable) (AIHW 2019c).
At June 2019, 48% of Indigenous regular clients who gave birth in the previous 12 months were a current smoker in the previous 12 months.
Smoking during pregnancy, by reporting period
This Tableau visualisation shows the percentage of Indigenous regular clients who gave birth in the last year by their smoking status in the last
year (current smoker, ex-smoker, never smoked) and reporting period (June 2017, December 2017, June 2018, December 2018 and June
2019).
Data supporting this visualisation are available in Excel supplementary data tables at Data.
Visualisation not available for printing
This was lowest in:
New South Wales/Australian Capital Territory (combined) (44%)
Major cities (42%).
It was highest in:
the Northern Territory (52%)
Remote areas (53%).
Smoking during pregnancy, by either state/territory or remoteness, reporting period
Two Tableau visualisations are presented here. The first shows the percentage of Indigenous regular clients who gave birth in the last year by
their smoking status in the last year (select for current smoker, ex-smoker, or never smoked) for either:
state/territory (NSW/ACT, Vic, Qld, WA, SA, Tas, NT, Australia)
remoteness area (Major cities, Inner regional, Outer regional, Remote, Very remote, Australia).
Reporting periods of either June 2017, December 2017, June 2018, December 2018 or June 2019 can be selected.
The second visualisation shows the selected information from the first visualisation by age group (15–19, 20–24, 25–34, 35+).
Data supporting this visualisation are available in Excel supplementary data tables at Data.
Visualisation not available for printing

References
AIHW (Australian Institute of Health and Welfare) 2019a. National Core Maternity Indicators: smoking during pregnancy. Cat. no. PER 95.
Canberra: AIHW. Viewed 16 March 2020.
AIHW 2019b. Australia’s mothers and babies 2017—in brief. Perinatal statistics series no. 35. Cat. no. PER 100. Canberra: AIHW. Viewed 16
March 2020.
AIHW 2019c. Australia’s mothers and babies 2017—data visualisations. Cat. no. PER 101. Canberra: AIHW. Viewed 16 March 2020.
Last updated 12/06/2020 v15.0
© Australian Institute of Health and Welfare 2020

Maternal and child health indicators
Child immunisation (PI04)
This indicator is the proportion of Indigenous child regular clients who were ‘fully immunised’.
It is collected for age groups:
12–<24 months
24–<36 months
60–<72 months.
Why child immunisation is important?
Vaccination initiates the body’s natural defence mechanism—the immune response—to build resistance to specific infections (immunise).
It is a safe and effective way to protect against harmful communicable diseases.
Immunisation also helps to protect people who are not immunised through a process called ‘herd immunity’, where enough people are
immunised against a disease to stop the infection from spreading. Herd immunity helps to protect those more at risk of getting the
disease, as well as those who are unvaccinated, so that those who are too young or too sick to be vaccinated can be protected. Outbreaks
can occur where there is low immunisation coverage.
Children who do not receive complete and timely vaccinations are at risk of contracting vaccine-preventable diseases and the short and
long-term health consequences associated with these (AIHW 2019a; AIHW 2019b). Data from the Australian Immunisation Register (AIR)
show indicate that Indigenous children aged 2 have lower rates of full immunisation than non-Indigenous children (88% compared with
91%) (AIHW 2019a). Indigenous childhood immunisation rates fluctuated between 2009 and 2018, decreasing from 90% in 2009 to 86% in
2015, before increasing to 88% in 2018.
At June 2019, 73% of Indigenous child regular clients aged 12–<72 months were fully immunised:
74% aged 12–<24 months
75% aged 24–<36 months
70% aged 60–<72 months.
However, this indicator captures far fewer cases of fully immunised Indigenous children than the Australian Immunisation Register (AIR).
Anecdotal evidence suggests that not all organisations rely on their internal Clinical Information Systems (CIS) to track immunisation status.
Also, in some instances, nKPI organisations might not be the only or the major vaccination provider, which reduces the priority that some
organisations give to maintaining immunisation status information within their CIS. This indicator may therefore be an underestimate (see
AIHW 2018 for more information).
Visualisation not available for printing
Fully immunised children, by reporting period
This Tableau visualisation shows the percentage of Indigenous regular clients aged 12–72 months who were fully immunised by age group (12–
24 months, 24–36 months, 60–72 months) and reporting period (June 2017, December 2017, June 2018, December 2018 and June 2019).
Data supporting this visualisation are available in Excel supplementary data tables at Data.
Visualisation not available for printing
Full immunisation of Indigenous children aged 12–<72 months was highest in South Australia (91%) and lowest in Queensland (61%).
Fully immunised children, by either state/territory or remoteness, reporting period
This Tableau visualisation shows the percentage of Indigenous regular clients aged 12–72 months who were fully immunised by age group (12–
24 months, 24–36 months, 60–72 months) for either:
state/territory (NSW/ACT, Vic, Qld, WA, SA, Tas, NT, Australia)
remoteness area (Major cities, Inner regional, Outer regional, Remote, Very remote, Australia).
Reporting periods of either June 2017, December 2017, June 2018, December 2018 or June 2019 can be selected.
Data supporting this visualisation are available in Excel supplementary data tables at Data.

Visualisation not available for printing
References
AIHW (Australian Institute of Health and Welfare) 2018. National Key Performance Indicators for Aboriginal and Torres Strait Islander
primary health care: results for 2017. National key performance indicators for Aboriginal and Torres Strait Islander primary health care series
no. 5. Cat. no. IHW 200. Canberra: AIHW. Viewed 16 March 2020.
AIHW 2019a. Australia's children: immunisation. Cat. No. CWS 69. Canberra: AIHW. Viewed 16 March 2020.
AIHW 2019b. The burden of vaccine preventable diseases in Australia—summary. Cat. no. PHE 242. Canberra: AIHW. Viewed 16 March 2020.
Last updated 12/06/2020 v12.0
© Australian Institute of Health and Welfare 2020

Maternal and child health indicators
MBS health assessment aged 0–4 (PI03)
This indicator is the proportion of Indigenous regular clients aged 0–4 for whom a MBS health assessment for Aboriginal and Torres Strait
Islander people (MBS item 715) was claimed within the previous 12 months.
Why health checks are important?
Through Medicare (MBS item 715), Aboriginal and Torres Strait Islander people can receive Indigenous-specific health checks from their
doctor, as well as referrals for Indigenous-specific follow-up services (AIHW 2019).
The aim of the Indigenous-specific health check is to encourage early detection and treatment of common conditions that cause ill health
and early death.
At June 2019, 38% of Indigenous regular clients aged 0–4 had a MBS health assessment (MBS item 715) in the previous 12 months.
MBS health assessment (item 715)—aged 0–4, by reporting period
This Tableau visualisation shows the percentage of Indigenous child regular clients aged 0–4 who had a MBS health assessment for Aboriginal
and Torres Strait Islander people (MBS item 715) in the previous 12 months by reporting period (June 2017, December 2017, June 2018,
December 2018 and June 2019).
Data supporting this visualisation are available in Excel supplementary data tables at Data.
Visualisation not available for printing
This was highest in:
Queensland (43%)
Inner regional areas (43%).
It was lowest in:
Western Australia (33%)
Very remote areas (31%).
MBS health assessment (item 715)—aged 0–4, by either state/territory or remoteness, reporting period
This Tableau visualisation shows the percentage of Indigenous child regular clients aged 0–4 who had a MBS health assessment for Aboriginal
and Torres Strait Islander people (MBS item 715) in the previous 12 months for either:
state/territory (NSW/ACT, Vic, Qld, WA, SA, Tas, NT, Australia)
remoteness area (Major cities, Inner regional, Outer regional, Remote, Very remote, Australia).
Reporting periods of either June 2017, December 2017, June 2018, December 2018 or June 2019 can be selected.
Data supporting this visualisation are available in Excel supplementary data tables at Data.
Visualisation not available for printing
Reference
AIHW (Australian Institute of Health and Welfare) 2019. Indigenous health checks and follow-ups. Cat. no. IHW 209. Canberra: AIHW. Viewed
16 March 2020.
Last updated 12/06/2020 v5.0
© Australian Institute of Health and Welfare 2020

Preventative health indicators
Preventative health indicators in the nKPIs consist of 6 process-of-care and 4 health-outcome indicators.
The following boxes show key results for Indigenous regular clients. Click on a box to get more information on the associated indicator.
Smoking status recorded
had their smoking status recorded in the last
year
Process-of-care indicator
Smoking status result
were a current smoker in the last 2 years
Health-outcome indicator
Alcohol consumption recorded
had their alcohol consumption status
recorded in the last 2 years
Process-of-care indicator
AUDIT-C result
had a high-risk AUDIT-C result in the last 2
years
Health-outcome indicator
MBS health assessment
aged 25 and over had a MBS health
assessment claimed in the last 2 years
Process-of-care indicator
CVD risk assessment
had risk factors recorded to enable CVD
assessment
Process-of-care indicator
CVD risk assessment result
had a high absolute cardiovascular risk in the
last 2 years
Health-outcome indicator
Cervical screening
of females had a cervical screening test in
the last 5 years
Process-of-care indicator
Immunised against influenza
aged 50 and over were immunised against
influenza
Process-of-care indicator

BMI of overweight or obese
had their BMI classified as overweight or
obese in the last 2 years
Health-outcome indicator
Last updated 12/06/2020 v23.0
© Australian Institute of Health and Welfare 2020

Preventative health indicators
Smoking (PI09 and PI10)
Indicators related to smoking and preventative health in the nKPI are:
the proportion of Indigenous regular clients aged 15 and over whose smoking status was recorded within the previous 24 months
the proportion of Indigenous regular clients aged 15 and over whose smoking status was recorded within the previous 24 months as current
smoker, ex-smoker or never smoked.
Why not smoking is important?
Tobacco smoking is the smoking of tobacco products, including packet cigarettes, roll-your-own cigarettes, cigars or pipes.
It is an important cause of preventable ill health and death in Australia and is a leading risk factor for the development of many chronic
health conditions and premature. Health conditions often affected by tobacco smoking include many types of cancer, respiratory disease
and heart disease.
It is estimated that over one third of the overall disease burden experienced by Indigenous Australians could be prevented by removing
exposure to risk factors, such alcohol use (AIHW 2016).
Smoking status recorded (PI09)
This indicator is the proportion of Indigenous regular clients aged 15 and over whose smoking status was recorded within the previous 24
months.
It is collected for males and females in age groups:
15–24
25–34
35–44
45–54
55–64
65 and over.
At June 2019, 82% of Indigenous regular clients aged 15 and over had their smoking status recorded within the previous 24 months.
Smoking status recorded, by reporting period
This Tableau visualisation shows the percentage of Indigenous regular clients aged 15 and over who had their smoking status recorded in the
last 2 years by reporting period (June 2017, December 2017, June 2018, December 2018 and June 2019).
Data supporting this visualisation are available in Excel supplementary data tables at Data.
Visualisation not available for printing
This was highest in:
Western Australia (93%)
Major cities and Inner regional areas (both 90%).
It was lowest in:
the Northern Territory (68%)
Very remote areas (64%).
Smoking status recorded, by either state/territory or remoteness, reporting period
Two Tableau visualisations are presented here. The first shows the percentage of Indigenous regular clients aged 15 and over who had their
smoking status recorded in the last 2 years for either:
state/territory (NSW/ACT, Vic, Qld, WA, SA, Tas, NT, Australia)
remoteness area (Major cities, Inner regional, Outer regional, Remote, Very remote, Australia).
Reporting periods of either June 2017, December 2017, June 2018, December 2018 or June 2019 can be selected.

The second visualisation shows the selected information from the first visualisation by sex (male, female) and age group (15–24, 25–34, 35–44,
45–54, 55–64, 65+).
Data supporting this visualisation are available in Excel supplementary data tables at Data.
Visualisation not available for printing
Smoking status result (PI10)
This indicator is the proportion of Indigenous regular clients aged 15 and over whose smoking status was recorded within the previous 24
months as:
current smoker
ex-smoker
never smoked.
It is collected for males and females in age groups:
15–24
25–34
35–44
45–54
55–64
65 and over.
At June 2019, 52% of Indigenous regular clients aged 15 and over were current smokers, 33% had never smoked and 15% were ex-smokers.
Smoking status result, by smoking status and reporting period
This Tableau visualisation shows the percentage of Indigenous regular clients aged 15 and over who had their smoking status recorded in the
last 2 years by smoking status result (current smoker, ex-smoker, never smoked) and reporting period (June 2017, December 2017, June 2018,
December 2018 and June 2019).
Data supporting this visualisation are available in Excel supplementary data tables at Data.
Visualisation not available for printing
Being a current smoker was lowest in:
New South Wales/the Australian Capital Territory (combined) and Queensland (both 50%)
Major cities (48%).
It was highest in:
South Australia (59%)
Remote and Very remote areas (both 55%).
Smoking status result, by smoking status and either state/territory or remoteness, reporting period
Two Tableau visualisations are presented here. The first shows the percentage of Indigenous regular clients aged 15 and over who had their
smoking status recorded in the last 2 years by smoking status result (select for current smoker, ex-smoker, or never smoked) for either:
state/territory (NSW/ACT, Vic, Qld, WA, SA, Tas, NT, Australia)
remoteness area (Major cities, Inner regional, Outer regional, Remote, Very remote, Australia).
Reporting periods of either June 2017, December 2017, June 2018, December 2018 or June 2019 can be selected.
The second visualisation shows the selected information from the first visualisation by sex (male, female) and age group (15–24, 25–34, 35–44,
45–54, 55–64, 65+).
Data supporting this visualisation are available in Excel supplementary data tables at Data.
Visualisation not available for printing
References
AIHW (Australian Institute of Health and Welfare) 2016. Australian Burden of Disease Study: Impact and causes of illness and death in
Aboriginal and Torres Strait Islander people 2011. Australian Burden of Disease Study series no. 6. Cat. no. BOD 7. Canberra: AIHW.
Last updated 12/06/2020 v24.0
© Australian Institute of Health and Welfare 2020

Preventative health indicators
Alcohol consumption (PI16 and PI17)
Indicators related to alcohol consumption in the nKPI are:
the proportion of Indigenous regular clients aged 15 and over who had their alcohol consumption status recorded within the previous 24
months
the proportion of Indigenous regular clients aged 15 and over whose smoking status was recorded within the previous 24 months as current
smoker, ex-smoker or never smoked.
Why recording alcohol consumption and level is important?
Alcohol consumption refers to the consumption of drinks containing ethanol, commonly referred to as alcohol. The quantity, frequency or
regularity with which alcohol is drunk provides a measure of the level of alcohol consumption.
AUDIT-C is a screening tool used to help identify hazardous drinking or active alcohol use disorders. It is scored on a scale of 0–12. A total
score of 4 or more in males and 3 or more in females is considered positive. Generally the higher the score, the more likely it is that the
person’s drinking is affecting their safety (RACGP 2015).
The harmful use of alcohol has both short-term and long-term health effects. Short-term effects are mainly related to potential injury
suffered by the drinker and/or others who may be affected by the drinker’s behaviour. Over the longer term, harmful drinking may result
in alcohol dependence and other chronic conditions, such as high blood pressure, cardiovascular diseases, cirrhosis of the liver, types of
dementia, mental health problems and various cancers. Excessive drinking can impair judgment and coordination, and contributes to
crime, violence, anti-social behaviours and accidents. Alcohol use during pregnancy is associated with severe adverse perinatal outcomes,
such as foetal alcohol syndrome and alcohol-related birth defects and developmental disorders.
It is estimated that over one third of the overall disease burden experienced by Indigenous Australians could be prevented by removing
exposure to risk factors, such alcohol use (AIHW 2016).
Alcohol consumption recorded (PI16)
This indicator is the proportion of Indigenous regular clients aged 15 and over who had their alcohol consumption status recorded within the
previous 24 months.
It is collected for males and females in age groups:
15–24
25–34
35–44
45–54
55–64
65 and over.
At June 2019, 62% of Indigenous regular clients aged 15 and over had their alcohol consumption status recorded within the previous 24
months.
Alcohol consumption status recorded, by reporting period
This Tableau visualisation shows the percentage of Indigenous regular clients aged 15 and over who had their alcohol consumption status
recorded in the last 2 years by reporting period (June 2017, December 2017, June 2018, December 2018 and June 2019).
Data supporting this visualisation are available in Excel supplementary data tables at Data.
Visualisation not available for printing
This was highest in:
Western Australia (82%)
Major cities (67%).
It was lowest in:
the Northern Territory (54%)
Very remote areas (52%).

Alcohol consumption status recorded, by either state/territory or remoteness, reporting period
Two Tableau visualisations are presented here. The first shows the percentage of Indigenous regular clients aged 15 and over who had their
alcohol consumption status recorded in the last 2 years for either:
state/territory (NSW/ACT, Vic, Qld, WA, SA, Tas, NT, Australia)
remoteness area (Major cities, Inner regional, Outer regional, Remote, Very remote, Australia).
Reporting periods of either June 2017, December 2017, June 2018, December 2018 or June 2019 can be selected.
The second visualisation shows the selected information from the first visualisation by sex (male, female) and age group (15–24, 25–34, 35–44,
45–54, 55–64, 65+).
Data supporting this visualisation are available in Excel supplementary data tables at Data.
Visualisation not available for printing
AUDIT-C result (PI17)
This indicator is the proportion of Indigenous regular clients aged 15 and over who had an AUDIT-C result recorded in the previous 24 months
with a score of:
high risk—4 or more in males and 3 or more in females
low risk—less than 4 in males and less than 3 in females.
It is collected for males and females in age groups:
15–24
25–34
35–44
45–54
55–64
65 and over.
At June 2019:
51% of Indigenous regular clients aged 15 and over had an AUDIT-C result of low risk
49% had a result of high risk.
Alcohol consumption status recorded, by reporting period
This Tableau visualisation shows the percentage of Indigenous regular clients aged 15 and over who had an AUDIT-C result recorded in the last
2 years by AUDIT-C result (low risk, high risk) and reporting period (June 2017, December 2017, June 2018, December 2018 and June 2019).
Data supporting this visualisation are available in Excel supplementary data tables at Data.
Visualisation not available for printing
Having a low risk AUDIT-C result was highest in:
New South Wales/the Australian Capital Territory (combined, 52%)
Major cities (55%).
It was lowest in:
Victoria/Tasmania (combined, 48%)
Very remote areas (46%).
AUDIT-C result, by either state/territory or remoteness, reporting period
Two Tableau visualisations are presented here. The first shows the percentage of Indigenous regular clients aged 15 and over who had an
AUDIT-C result recorded in the last 2 years by AUDIT-C result (low risk, high risk) in the last 2 years for either:
state/territory (NSW/ACT, Vic, Qld, WA, SA, Tas, NT, Australia)
remoteness area (Major cities, Inner regional, Outer regional, Remote, Very remote, Australia).
Reporting periods of either June 2017, December 2017, June 2018, December 2018 or June 2019 can be selected.
The second visualisation shows the selected information from the first visualisation by sex (male, female) and age group (15–24, 25–34, 35–44,
45–54, 55–64, 65+).
Data supporting this visualisation are available in Excel supplementary data tables at Data.
Visualisation not available for printing
References

AIHW (Australian Institute of Health and Welfare) 2016. Australian Burden of Disease Study: Impact and causes of illness and death in
Aboriginal and Torres Strait Islander people 2011. Australian Burden of Disease Study series no. 6. Cat. no. BOD 7. Canberra: AIHW.
The Royal Australian College of General Practitioners (RACGP) 2015. Smoking, nutrition, alcohol, physical activity (SNAP): a population health
guide to behavioural risk factors in general practice, 2nd edition. Melbourne: RACGP. Viewed 16 March 2020.
Last updated 12/06/2020 v18.0
© Australian Institute of Health and Welfare 2020

Preventative health indicators
MBS health assessment (item 715)—aged 25 and over (PI03)
This indicator is the proportion of Indigenous regular clients aged 25 and over for whom a MBS health assessment for Aboriginal and Torres
Strait Islander people (MBS item 715) was claimed within the previous 24 months.
It is collected for males and females in age groups:
25–34
35–44
45–54
55–64
65 and over.
Why health checks are important?
Through Medicare (MBS item 715), Aboriginal and Torres Strait Islander people can receive Indigenous-specific health checks from their
doctor, as well as referrals for Indigenous-specific follow-up services (AIHW 2019).
The aim of the Indigenous-specific health check is to encourage early detection and treatment of common conditions that cause ill health
and early death—for example, diabetes and heart disease.
At June 2019, 54% of Indigenous regular clients aged 25 and over had a MBS health assessment for Aboriginal and Torres Strait Islander people
(MBS item 715) claimed within the previous 24 months.
MBS health assessment (item 715)—aged 25 and over, by reporting period
This Tableau visualisation shows the percentage of Indigenous regular clients aged 25 and over who had a MBS health assessment for Aboriginal
and Torres Strait Islander people (MBS item 715) in the last 2 years by reporting period (June 2017, December 2017, June 2018, December 2018
and June 2019).
Data supporting this visualisation are available in Excel supplementary data tables at Data.
Visualisation not available for printing
This was highest in:
Queensland (64%)
Major cities (63%).
It was lowest in:
South Australia (42%)
Very remote areas (42%).
MBS health assessment (item 715)—aged 25 and over, by either state/territory or remoteness, reporting period
Two Tableau visualisations are presented here. The first shows the percentage of Indigenous regular clients aged 25 and over who had a MBS
health assessment for Aboriginal and Torres Strait Islander people (MBS item 715) in the last 2 years for either:
state/territory (NSW/ACT, Vic, Qld, WA, SA, Tas, NT, Australia)
remoteness area (Major cities, Inner regional, Outer regional, Remote, Very remote, Australia).
Reporting periods of either June 2017, December 2017, June 2018, December 2018 or June 2019 can be selected.
The second visualisation shows the selected information from the first visualisation by sex (male, female) and age group (15–24, 25–34, 35–44,
45–54, 55–64, 65+).
Data supporting this visualisation are available in Excel supplementary data tables at Data.
Visualisation not available for printing
Reference
AIHW (Australian Institute of Health and Welfare) 2019. Indigenous health checks and follow-ups. Cat. no. IHW 209. Canberra: AIHW. Viewed
16 March 2020.

Last updated 12/06/2020 v6.0
© Australian Institute of Health and Welfare 2020

Preventative health indicators
Cardiovascular disease (CVD) risk assessment (PI20 and PI21)
Indicators related to CVD risk assessment in the nKPI are:
the proportion of Indigenous regular clients aged 35–74 with no known history of CVD who had information available to calculate their
absolute CVD risk in the previous 24 months
the proportion of Indigenous regular clients aged 35–74 with no known history of CVD who had an absolute CVD risk recorded as high,
moderate or low in the previous 24 months.
Why CVD risk assessment is important?
Cardiovascular disease (CVD) is a major cause of disease and death in Australia. CVD includes a range of conditions that affect the heart
and blood vessels. The most common and serious types of CVD include coronary heart disease, stroke and heart failure.
CVD is preventable in many cases, as a number of its risk factors are modifiable, such as overweight and obesity, tobacco smoking, high
blood pressure, high blood cholesterol, insufficient physical activity, poor nutrition and diabetes.
Absolute CVD risk assessment combines risk factors to calculate the probability that an individual will develop a cardiovascular event or
other vascular disease within a specified time frame (usually five years) (RACGP 2018).
Indigenous Australians generally have CVD hospitalisation and death rates that are almost twice as high as non-Indigenous Australians
(AIHW 2019).
Cardiovascular disease (CVD) risk assessment (PI20)
This indicator is the proportion of Indigenous regular clients aged 35–74 with no known history of CVD who had information available to
calculate their absolute CVD risk in the previous 24 months.
It is collected for males and females in age groups:
35–44
45–54
55–64
65–74.
At June 2019, 50% of Indigenous regular clients aged 35–74 with no known history of CVD had information available to calculate their absolute
CVD risk in the previous 24 months.
CVD risk assessment, by reporting period
This Tableau visualisation shows the percentage of Indigenous regular clients aged 35–74 with no known history of CVD who had information
available to calculate their absolute CVD risk in the last 2 years by reporting period (June 2017, December 2017, June 2018, December 2018
and June 2019).
Data supporting this visualisation are available in Excel supplementary data tables at Data.
Visualisation not available for printing
This was highest in:
the Northern Territory and Western Australia (both 57%)
Remote areas (60%).
It was lowest in:
Victoria/Tasmania (combined, 39%)
Inner regional areas (45%).
CVD risk assessment, by either state/territory or remoteness, reporting period
Two Tableau visualisations are presented here. The first shows the percentage of Indigenous regular clients aged 35–74 with no known history
of CVD who had information available to calculate their absolute CVD risk in the last 2 years for either:
state/territory (NSW/ACT, Vic, Qld, WA, SA, Tas, NT, Australia)
remoteness area (Major cities, Inner regional, Outer regional, Remote, Very remote, Australia).

Reporting periods of either June 2017, December 2017, June 2018, December 2018 or June 2019 can be selected.
The second visualisation shows the selected information from the first visualisation by sex (male, female) and age group (35–44, 45–54, 55–64,
65–74).
Data supporting this visualisation are available in Excel supplementary data tables at Data.
Visualisation not available for printing
Cardiovascular disease risk assessment result (PI21)
This indicator is proportion of Indigenous regular clients aged 35–74 with no known history of CVD who had an absolute CVD risk recorded in
the previous 24 months as:
high—greater than 15% chance of a cardiovascular event in the next 5 years
medium—10–15% chance of a cardiovascular event in the next 5 years
low—less than 10% chance of a cardiovascular event in the next 5 years.
It is collected for males and females in age groups:
35–44
45–54
55–64
65–74.
At June 2019, 59% of Indigenous regular clients aged 35–74 with no known history of CVD who had an absolute CVD risk recorded in the
previous 24 months had a low absolute CVD risk, 6% moderate, and 35% high.
CVD risk assessment result, by reporting period
This Tableau visualisation shows the percentage of Indigenous regular clients aged 35–74 with no known history of CVD who had information
available to calculate their absolute CVD risk in the last 2 years by CVD risk assessment result (low, medium, high) and reporting period (June
2017, December 2017, June 2018, December 2018 and June 2019).
Data supporting this visualisation are available in Excel supplementary data tables at Data.
Visualisation not available for printing
Having a low absolute CVD risk was highest in:
Victoria/Tasmania (combined, 69%)
Inner regional areas (67%).
It was lowest in:
South Australia (49%)
Very remote areas (53%).
CVD risk assessment result, by either state/territory or remoteness, reporting period
Two Tableau visualisations are presented here. The first shows the percentage of Indigenous regular clients aged 35–74 with no known history
of CVD who had information available to calculate their absolute CVD risk in the last 2 years by CVD risk assessment result (low, medium, high)
for either:
state/territory (NSW/ACT, Vic, Qld, WA, SA, Tas, NT, Australia)
remoteness area (Major cities, Inner regional, Outer regional, Remote, Very remote, Australia).
Reporting periods of either June 2017, December 2017, June 2018, December 2018 or June 2019 can be selected.
The second visualisation shows the selected information from the first visualisation by sex (male, female) and age group (35–44, 45–54, 55–64,
65–74).
Data supporting this visualisation are available in Excel supplementary data tables at Data.
Visualisation not available for printing
References
AIHW (Australian Institute of Health and Welfare) 2019. Heart, stroke & vascular diseases. Viewed 28 April 2020.
RACGP (The Royal Australian College of General Practitioners) 2018. Guidelines for preventive activities in general practice. 9th edition,
updated. East Melbourne, Vic: RACGP, 2018. Viewed 16 March 2020.
Last updated 12/06/2020 v12.0
© Australian Institute of Health and Welfare 2020


Preventative health indicators
Cervical screening (PI22)
This indicator is the proportion of female Indigenous regular clients aged 20–74 who have not had a hysterectomy and who had cervical
screening within the previous 2, 3 and 5 years.
It is collected for females in age groups:
20–24
25–34
35–44
45–54
55–64
65–69
70–74.
Why cervical screening is important?
Cervical screening aims to detect and treat precancerous abnormalities that might otherwise progress to cervical cancer. Indigenous
women generally experience a high burden from cervical cancer compared with non-Indigenous women (AIHW 2019).
The National Cervical Screening Program (NCSP), which aims to reduce mortality from cervical cancer, was originally targeted at women
aged 20–69 for a 2-yearly Papanicolaou (Pap) smear, or ‘Pap test’, to detect precancerous abnormalities of the cervix. From 1 December
2017, the NCSP changed to 5-yearly cervical screening for women aged 25–74 using a primary human papilloma virus (HPV) test with partial
HPV genotyping and reflex liquid-based cytology triage.
A National HPV Vaccination Program was introduced on 1 April 2007 to immunise girls (and extended in 2013 to also immunise boys) against
HPV types 16, 18, 6 and 11 (with an HPV vaccine against 9 HPV types introduced from 2018). While the HPV vaccine is very effective at
protecting against the 2 most common cervical cancer-causing types of HPV, it doesn’t protect against all types of HPV that can lead to
cervical cancer. This means that both HPV-vaccinated and unvaccinated women are recommended to have regular Cervical Screening Tests
(the Pap test replacement) to reduce their risk of developing cervical cancer.
From the June 2018 collection, this indicator was revised to align with the new NCSP. This resulted in additional screening points (at 2, 3
and 5 years) being collected, along with continuing to collect for clients aged 20–24, for an interim period until all women could be
expected to have moved across to the new requirements under the NCPS.
At June 2019, 34% of female Indigenous regular clients aged 20–74 who have not had a hysterectomy had cervical screening within the
previous 3 years. However, this is affected by a change in cervical screening guidelines and the way it was collected in the nKPIs (see
Technical notes for more information).
Cervical screening, by reporting period
This Tableau visualisation shows the percentage of female Indigenous regular clients aged 20–74 who have not had a hysterectomy by time
period of screening (2 years, 3 years, 5 years) and reporting period (December 2018 and June 2019).
Data supporting this visualisation are available in Excel supplementary data tables at Data.
Visualisation not available for printing
This was highest in:
the Northern Territory (44%)
Very remote areas (39%).
It was lowest in:
New South Wales/the Australian Capital Territory (combined, 28%)
Inner regional and Outer regional areas (both 30%).
Cervical screening, by either state/territory or remoteness, reporting period
This Tableau visualisation shows the percentage of female Indigenous regular clients aged 20–74 who have not had a hysterectomy by time
period of screening (2 years, 3 years, 5 years) for either:
state/territory (NSW/ACT, Vic, Qld, WA, SA, Tas, NT, Australia)
remoteness area (Major cities, Inner regional, Outer regional, Remote, Very remote, Australia).
Reporting periods of either December 2018 or June 2019 can be selected.
Data supporting this visualisation are available in Excel supplementary data tables at Data.
Visualisation not available for printing
Reference
Australian Institute of Health and Welfare 2019. Cervical screening in Australia 2019. Cancer series no. 123. Cat. no. CAN 124. Canberra:
AIHW.
Last updated 12/06/2020 v8.0
© Australian Institute of Health and Welfare 2020

Preventative health indicators
Immunised against influenza—aged 50 and over (PI14)
This indicator is the proportion of Indigenous regular clients aged 50 and over who had an influenza immunisation within the previous 12
months. It is collected for males and females.
Why immunisation against influenza is important?
Influenza (the flu) is a contagious respiratory disease that causes seasonal epidemics in Australia. Anyone can be infected with influenza
but some people, such as Indigenous Australians, have a higher chance of serious illness and complications, such as pneumonia. Some
people with influenza die as a result of their infection. Annual vaccination is the best way to prevent severe infections, hospitalisation
and death due to influenza.
While immunisation against influenza is recommended for all Indigenous people aged 6 months and over, it is particularly important for
those who are at a greater risk of complications from influenza infection, such as those aged 50 and over. Influenza vaccination
substantially reduces the risk of hospitalisation and death from influenza and pneumonia for older Indigenous Australians (AIHW 2018).
At June 2019, 38% of Indigenous regular clients aged 50 and over had an influenza immunisation within the previous 12 months.
Immunised against influenza—aged 50 and over, by reporting period
This Tableau visualisation shows the percentage of Indigenous regular clients aged 50 and over who had an influenza immunisation in the last
year by reporting period (June 2017, December 2017, June 2018, December 2018 and June 2019).
Data supporting this visualisation are available in Excel supplementary data tables at Data.
Visualisation not available for printing
This was highest in:
the Northern Territory (46%)
Very remote areas (43%).
It was lowest in:
New South Wales/the Australian Capital Territory (combined, 31%)
Inner regional and Outer regional areas (both 34%).
Immunised against influenza—aged 50 and over, by either state/territory or remoteness, reporting period
Two Tableau visualisations are presented here. The first shows the percentage of Indigenous regular clients aged 50 and over who had an
influenza immunisation in the last year for either:
state/territory (NSW/ACT, Vic, Qld, WA, SA, Tas, NT, Australia)
remoteness area (Major cities, Inner regional, Outer regional, Remote, Very remote, Australia).
Reporting periods of either June 2017, December 2017, June 2018, December 2018 or June 2019 can be selected.
The second visualisation shows the selected information from the first visualisation by sex (male, female).
Data supporting this visualisation are available in Excel supplementary data tables at Data.
Visualisation not available for printing
Reference
AIHW (Australian Institute of Health and Welfare) 2018. Vaccine-preventable diseases fact sheets. Cat no. PHE 236. Canberra: AIHW.
Last updated 12/06/2020 v4.0
© Australian Institute of Health and Welfare 2020

Preventative health indicators
Body Mass Index (BMI) classified as overweight or obese (PI12)
This indicator is the proportion of Indigenous regular clients aged 25 and over who had their Body Mass Index (BMI) classified as overweight or
obese within the previous 24 months.
It is collected for males and females in age groups:
25–34
35–44
45–54
55–64
65 and over.
Why not being overweight or obese is important?
Excess weight, especially obesity, is a major risk factor for cardiovascular disease, type 2 diabetes, some musculoskeletal conditions and
some cancers. As the level of excess weight increases, so does the risk of developing these conditions. In addition, being overweight or
obese can hamper the ability to control or manage chronic conditions.
Indigenous Australians are more likely to be overweight or obese than non-Indigenous Australians. It is estimated that over one third of
the overall disease burden experienced by Indigenous Australians could be prevented by removing exposure to risk factors such as high
body mass (AIHW 2016).
At June 2019, 71% of Indigenous regular clients aged 25 and over had their BMI classified as overweight or obese within the previous 24
months:
27% as overweight
44% as obese.
BMI classified as overweight or obese, by reporting period
This Tableau visualisation shows the percentage of Indigenous regular clients aged 25 and over who had their BMI classified as overweight or
obese in the last 2 years by BMI (overweight, obese) and reporting period (June 2017, December 2017, June 2018, December 2018 and June
2019).
Data supporting this visualisation are available in Excel supplementary data tables at Data.
Visualisation not available for printing
This was lowest in:
the Northern Territory (62%)
Very remote areas (66%).
It was highest in:
New South Wales/the Australian Capital Territory (combined, 75%)
Major cities and Inner regional areas (both 75%).
BMI classified as overweight or obese, by either state/territory or remoteness, reporting period
Two Tableau visualisations are presented here. The first shows the percentage of Indigenous regular clients aged 25 and over who had their
BMI classified as overweight or obese in the last 2 years by BMI (overweight, obese) for either:
state/territory (NSW/ACT, Vic, Qld, WA, SA, Tas, NT, Australia)
remoteness area (Major cities, Inner regional, Outer regional, Remote, Very remote, Australia).
Reporting periods of either June 2017, December 2017, June 2018, December 2018 or June 2019 can be selected.
The second visualisation shows the selected information from the first visualisation by sex (male, female) and age group (25–34, 35–44, 45–54,
55–64, 65+).
Data supporting this visualisation are available in Excel supplementary data tables at Data.

Visualisation not available for printing
Reference
AIHW (Australian Institute of Health and Welfare) 2016. Australian Burden of Disease Study: Impact and causes of illness and death in
Aboriginal and Torres Strait Islander people 2011. Australian Burden of Disease Study series no. 6. Cat. no. BOD 7. Canberra: AIHW.
Last updated 12/06/2020 v7.0
© Australian Institute of Health and Welfare 2020

Chronic disease management indicators
Chronic disease management indicators in the nKPIs consist of 6 process-of-care and 3 health-outcome indicators.
The following boxes show key results for Indigenous regular clients. Click on a box to get more information on the associated indicator.
MBS General Practitioner Mgmt.Plan (item 721)
with type 2 diabetes had a MBS General
Practitioner Management Plan claimed in the
last 2 years
Process-of-care indicator
MBS Team Care Arrangement (item723)
with type 2 diabetes had a MBS Team Care
Arrangement claimed in the last 2 years
Process-of-care indicator
Blood pressure result recorded
with type 2 diabetes had their blood pressure
result recorded in the last 6 months
Process-of-care indicator
Blood pressure result
with type 2 diabetes had a blood pressure
result within recommended guidelines in the
last 6 months
Health-outcome indicator
HbA1c result recorded
with type 2 diabetes had their HbA1c result
recorded in the last 6 months
Process-of-care indicator
HbA1c result
with type 2 diabetes had a HbA1c result
within recommended guidelines in the last 6
months
Health-outcome indicator
Kidney function test recorded
with type 2 diabetes had a kidney function
test recorded in the last year
Process-of-care indicator
Kidney function test recorded
with CVD had a kidney function test recorded
in the last year
Process-of-care indicator
Kidney function test result (eGFR)
with type 2 diabetes had a normal eGFR test
result in the last year
Health-outcome indicator
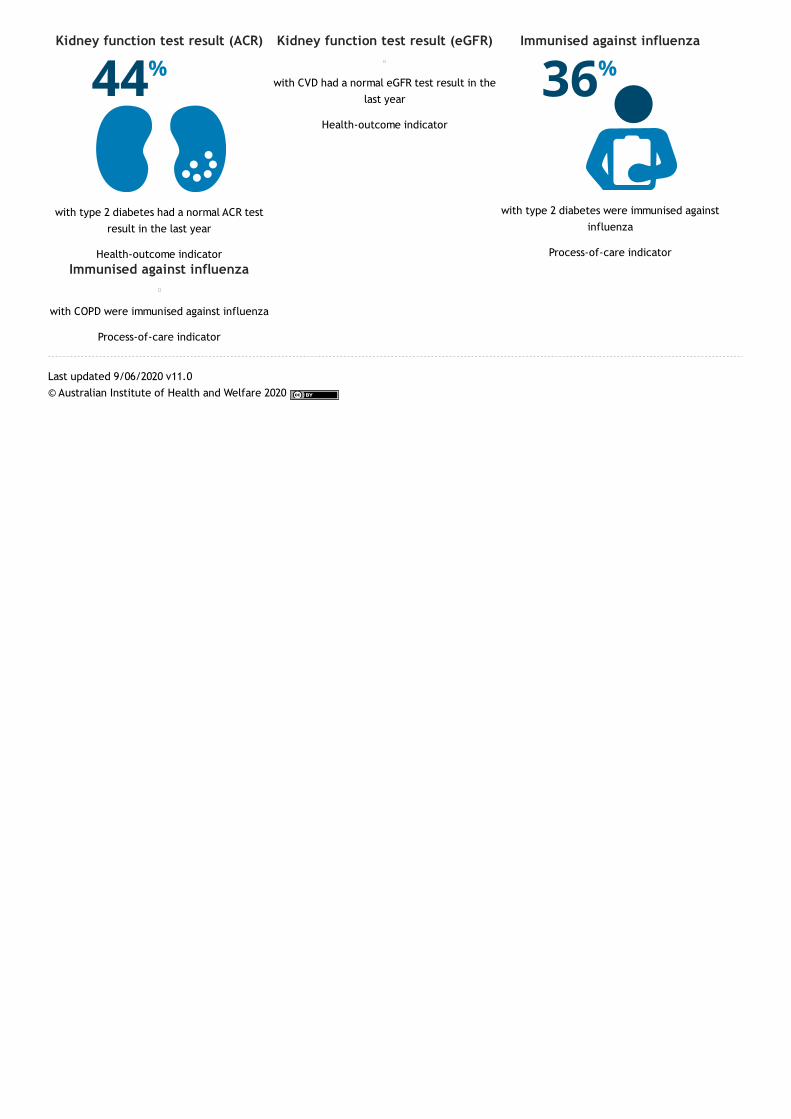
Kidney function test result (ACR)
with type 2 diabetes had a normal ACR test
result in the last year
Health-outcome indicator
Kidney function test result (eGFR)
with CVD had a normal eGFR test result in the
last year
Health-outcome indicator
Immunised against influenza
with type 2 diabetes were immunised against
influenza
Process-of-care indicator
Immunised against influenza
with COPD were immunised against influenza
Process-of-care indicator
Last updated 9/06/2020 v11.0
© Australian Institute of Health and Welfare 2020

Chronic disease management indicators
MBS General Practitioner Management Plan (item 721)—type 2 diabetes (PI07)
This indicator is the proportion of Indigenous regular clients with type 2 diabetes for whom a General Practitioner Management Plan (MBS item
721) was claimed within the previous 24 months.
It is collected for males and females in age groups from 0–4 to 65 and over. It is presented here for males and females in age groups:
under 35
35–44
45–54
55–64
65 and over.
Why MBS General Practitioner Management Plan (item 721) is important?
It is estimated that 64% of the burden of disease among Indigenous Australians is due to chronic disease (AIHW 2016).
Effective management of chronic disease can delay the progression of disease, decrease the need for high-cost interventions, improve
quality of life, and increase life expectancy. The development of a GP Management Plan is one way in which appropriate care can be
planned.
The MBS General Practitioner Management Plan (item 721) provides a rebate for a GP to prepare a management plan for a patient who has
a chronic or terminal medical condition with or without multidisciplinary care needs.
At June 2019, 56% of Indigenous regular clients with type 2 diabetes had a MBS item 721 claimed within the previous 24 months.
MBS General Practitioner Management Plan (item 721)—type 2 diabetes, by reporting period
This Tableau visualisation shows the percentage of Indigenous regular clients with type 2 diabetes who had a MBS item 721 in the last 2 years
by reporting period (June 2017, December 2017, June 2018, December 2018 and June 2019).
Data supporting this visualisation are available in Excel supplementary data tables at Data.
Visualisation not available for printing
This was highest in:
Queensland (64%)
Major cities (63%).
It was lowest in:
South Australia (47%)
Inner regional and Very remote areas (both 53%).
MBS General Practitioner Management Plan (item 721)—type 2 diabetes, by either state/territory or remoteness, reporting period
Two Tableau visualisations are presented here. The first shows the percentage of Indigenous regular clients with type 2 diabetes who had a
MBS item 721 in the last 2 years for either:
state/territory (NSW/ACT, Vic, Qld, WA, SA, Tas, NT, Australia)
remoteness area (Major cities, Inner regional, Outer regional, Remote, Very remote, Australia).
Reporting periods of either June 2017, December 2017, June 2018, December 2018 or June 2019 can be selected.
The second visualisation shows the selected information from the first visualisation by sex (male, female) and age group (<35, 35–44, 45–54,
55–64, 65+).
Data supporting this visualisation are available in Excel supplementary data tables at Data.
Visualisation not available for printing
Reference

AIHW (Australian Institute of Health and Welfare) 2016. Australian Burden of Disease Study: Impact and causes of illness and death in
Aboriginal and Torres Strait Islander people 2011. Australian Burden of Disease Study series no. 6. Cat. no. BOD 7. Canberra: AIHW.
Last updated 4/06/2020 v5.0
© Australian Institute of Health and Welfare 2020

Chronic disease management indicators
MBS Team Care Arrangement (item 723)—type 2 diabetes (PI08)
This indicator is the proportion of Indigenous regular clients with type 2 diabetes for whom a Team Care Arrangement (MBS item 723) was
claimed within the previous 24 months.
It is collected for males and females in age groups from 0–4 to 65 and over. It is presented here for males and females in age groups:
under 35
35–44
45–54
55–64
65 and over.
Why MBS Team Care Arrangement (item 723) is important?
It is estimated that 64% of the burden of disease among Indigenous Australians is due to chronic disease (AIHW 2016).
Effective management of chronic disease can delay the progression of disease, decrease the need for high-cost interventions, improve
quality of life, and increase life expectancy. As good quality care for people with chronic disease can involve multiple health-care
providers across multiple settings, the development of multidisciplinary care plans is one way in which appropriate care can be arranged
and coordinated.
A Team Care Arrangement (TCA) provides a rebate for a GP to coordinate the preparation of a TCA for a patient who has a chronic or
terminal medical condition who requires ongoing care from a multidisciplinary team of at least three health or care providers.
A person who has a chronic or terminal medical condition (with or without multidisciplinary care needs) can have a GP Management Plan
(GPMP) service. A person with a chronic or terminal medical condition and complex care needs, requiring care from a multidisciplinary
team, can have a GPMP and Team Care Arrangements (TCAs).
At June 2019, 53% of Indigenous regular clients with type 2 diabetes had a MBS item 723 claimed within the previous 24 months.
MBS Team Care Arrangement (item 723)—type 2 diabetes, by reporting period
This Tableau visualisation shows the percentage of Indigenous regular clients with type 2 diabetes who had a MBS item 723 in the last 2 years
by reporting period (June 2017, December 2017, June 2018, December 2018 and June 2019).
Data supporting this visualisation are available in Excel supplementary data tables at Data.
Visualisation not available for printing
This was highest in:
Queensland (61%)
Major cities (59%).
It was lowest in:
South Australia (45%)
Inner regional and Very remote areas (both 50%).
MBS Team Care Arrangement (item 723)—type 2 diabetes, by either state/territory or remoteness, reporting period
Two Tableau visualisations are presented here. The first shows the percentage of Indigenous regular clients with type 2 diabetes who had a
MBS item 723 in the last 2 years for either:
state/territory (NSW/ACT, Vic, Qld, WA, SA, Tas, NT, Australia)
remoteness area (Major cities, Inner regional, Outer regional, Remote, Very remote, Australia).
Reporting periods of either June 2017, December 2017, June 2018, December 2018 or June 2019 can be selected.
The second visualisation shows the selected information from the first visualisation by sex (male, female) and age group (<35, 35–44, 45–54,
55–64, 65+).
Data supporting this visualisation are available in Excel supplementary data tables at Data.

Visualisation not available for printing
Reference
AIHW (Australian Institute of Health and Welfare) 2016. Australian Burden of Disease Study: Impact and causes of illness and death in
Aboriginal and Torres Strait Islander people 2011. Australian Burden of Disease Study series no. 6. Cat. no. BOD 7. Canberra: AIHW.
Last updated 4/06/2020 v6.0
© Australian Institute of Health and Welfare 2020

Chronic disease management indicators
Blood pressure result—type 2 diabetes (PI23 and PI24)
Indicators related to blood pressure in the nKPIs are:
the proportion of Indigenous regular clients with type 2 diabetes whose blood pressure result was recorded in the last 6 months
the proportion of Indigenous regular clients with type 2 diabetes whose blood pressure result recorded in the last 6 months was less than
or equal to 130/80mmHg.
Why blood pressure result is important?
Blood pressure is the force exerted by the blood on the walls of the arteries and is written as systolic/diastolic (for example, 120/80
mmHg, stated as '120 over 80'). High blood pressure—also known as hypertension—is a risk factor for chronic conditions, including stroke,
coronary heart disease, heart failure and chronic kidney disease.
People with type 2 diabetes have a higher risk of developing high blood pressure. The RACGP diabetes management guidelines currently
recommend a target blood pressure of 130/80 mmHg for people with type 2 diabetes (RACGP 2016). Managing a healthy blood pressure can
reduce the risk and slow the progression of chronic conditions, such as cardiovascular disease, nephropathy, and diabetic eye disease.
Blood pressure result recorded—type 2 diabetes (PI23)
This indicator is the proportion of Indigenous regular clients with type 2 diabetes whose blood pressure result was recorded in the last 6
months.
It is collected for males and females in age groups from 0–4 to 65 and over. It is presented here for males and females in age groups:
under 35
35–44
45–54
55–64
65 and over.
At June 2019, 67% of Indigenous regular clients with type 2 diabetes had their blood pressure result recorded in the last 6 months.
Blood pressure result recorded—type 2 diabetes, by reporting period
This Tableau visualisation shows the percentage of Indigenous regular clients with type 2 diabetes who had their blood pressure recorded in
the last 6 months by reporting period (June 2017, December 2017, June 2018, December 2018 and June 2019).
Data supporting this visualisation are available in Excel supplementary data tables at Data.
Visualisation not available for printing
This was highest in:
Queensland (71%)
Major cities and Remote areas (both 70%).
It was lowest in:
the Northern Territory (62%)
Very remote areas (63%).
Blood pressure result recorded—type 2 diabetes, by either state/territory or remoteness, reporting period
Two Tableau visualisations are presented here. The first shows the percentage of Indigenous regular clients with type 2 diabetes who had their
blood pressure recorded in the last 6 months for either:
state/territory (NSW/ACT, Vic, Qld, WA, SA, Tas, NT, Australia)
remoteness area (Major cities, Inner regional, Outer regional, Remote, Very remote, Australia).
Reporting periods of either June 2017, December 2017, June 2018, December 2018 or June 2019 can be selected.
The second visualisation shows the selected information from the first visualisation by sex (male, female) and age group (<35, 35–44, 45–54,
55–64, 65+).

Data supporting this visualisation are available in Excel supplementary data tables at Data.
Visualisation not available for printing
Blood pressure result—type 2 diabetes (PI24)
This indicator is the proportion of Indigenous regular clients with type 2 diabetes whose blood pressure result recorded in the last 6 months
was less than or equal to 130/80mmHg.
It is collected for males and females in age groups:
under 35
35–44
45–54
55–64
65 and over.
At June 2019, 40% of Indigenous regular clients with type 2 diabetes had a blood pressure result recorded in the last 6 months of less than or
equal to 130/80mmHg.
Blood pressure result—type 2 diabetes, by reporting period
This Tableau visualisation shows the percentage of Indigenous regular clients with type 2 diabetes who had a blood pressure result of less than
or equal to 130/80mmHg in the last 6 months by reporting period (June 2017, December 2017, June 2018, December 2018 and June 2019).
Data supporting this visualisation are available in Excel supplementary data tables at Data.
Visualisation not available for printing
This was highest in:
the Northern Territory (44%)
Remote and Very remote areas (both 42%).
It was lowest in:
Queensland and New South Wales/the Australian Capital Territory (both 38%)
Major cities (37%).
Blood pressure result—type 2 diabetes, by either state/territory or remoteness, reporting period
Two Tableau visualisations are presented here. The first shows the percentage of Indigenous regular clients with type 2 diabetes who had a
blood pressure result of less than or equal to 130/80mmHg in the last 6 months for either:
state/territory (NSW/ACT, Vic, Qld, WA, SA, Tas, NT, Australia)
remoteness area (Major cities, Inner regional, Outer regional, Remote, Very remote, Australia).
Reporting periods of either June 2017, December 2017, June 2018, December 2018 or June 2019 can be selected.
The second visualisation shows the selected information from the first visualisation by sex (male, female) and age group (<35, 35–44, 45–54,
55–64, 65+).
Data supporting this visualisation are available in Excel supplementary data tables at Data.
Visualisation not available for printing
Reference
RACGP (Royal Australian College of General Practitioners) 2016. General practice management of type 2 diabetes, 2016–18. East Melbourne:
RACGP and Diabetes Australia.
Last updated 4/06/2020 v7.0
© Australian Institute of Health and Welfare 2020

Chronic disease management indicators
HbA1c measurement—type 2 diabetes (PI05 and PI06)
Indicators related to HbA1c in the nKPI are:
the proportion of Indigenous regular clients with type 2 diabetes who had a HbA1c measurement result recorded within the previous 6
months or within the previous 12 months
the proportion of Indigenous regular clients with type 2 diabetes who had a HbA1c measurement result recorded within the previous 6
months or within the previous 12 months that was within specified ranges.
Why HbA1c is important?
The HbA1c (glycosylated haemoglobin or glycated haemoglobin) blood test gives an indication of whether blood glucose levels have been
higher than normal over the preceding 6–8 weeks by looking at how much sugar (glucose) is bound in red blood cells. It is regarded as the
gold standard for assessing glycaemic control.
People who have diabetes need this test regularly to see if their levels are staying within range and whether they need to adjust their
diabetes management. The general glycated haemoglobin (HbA1c) target in people with type 2 diabetes is ≤53 mmol/mol (≤7%) (RACGP
2016).
HbA1c result recorded—type 2 diabetes (PI05)
This indicator is the proportion of Indigenous regular clients with type 2 diabetes who had a HbA1c measurement result recorded within the
previous 6 months or within the previous 12 months.
It is collected for males and females in age groups from 0–4 to 65 and over. It is presented here for males and females in age groups:
under 35
35–44
45–54
55–64
65 and over.
At June 2019:
52% of Indigenous regular clients with type 2 diabetes had a HbA1c measurement result recorded within the previous 6 months
67% of Indigenous regular clients with type 2 diabetes had a HbA1c measurement result recorded within the previous 12 months.
HbA1c result recorded—type 2 diabetes, by time period and reporting period
This Tableau visualisation shows the percentage of Indigenous regular clients with type 2 diabetes who had a HbA1c measurement result
recorded by time period of measurement (select for 6 months or 12 months) and reporting period (June 2017, December 2017, June 2018,
December 2018 and June 2019).
Data supporting this visualisation are available in Excel supplementary data tables at Data.
Visualisation not available for printing
Having a HbA1c measurement result recorded within the previous 6 months was highest in:
Western Australia (56%)
Major cities and Remote areas (both 54%).
It was lowest in:
New South Wales/the Australian Capital Territory (combined, 49%)
Inner regional areas (50%).
Having a HbA1c measurement result recorded within the previous 12 months was highest in:
Queensland and Western Australia (both 72%)
Remote areas (70%).
It was lowest in:

the Northern Territory (62%)
Inner regional areas (63%).
HbA1c result recorded—type 2 diabetes, by time period and either state/territory or remoteness, reporting period
Two Tableau visualisations are presented here. The first shows the percentage of Indigenous regular clients with type 2 diabetes who had a
HbA1c measurement result recorded by time period of measurement (select for 6 months or 12 months) for either:
state/territory (NSW/ACT, Vic, Qld, WA, SA, Tas, NT, Australia)
remoteness area (Major cities, Inner regional, Outer regional, Remote, Very remote, Australia).
Reporting periods of either June 2017, December 2017, June 2018, December 2018 or June 2019 can be selected.
The second visualisation shows the selected information from the first visualisation by sex (male, female) and age group (<35, 35–44, 45–54,
55–64, 65+).
Data supporting this visualisation are available in Excel supplementary data tables at Data.
Visualisation not available for printing
HbA1c result—type 2 diabetes (PI06)
This indicator is the proportion of Indigenous regular clients with type 2 diabetes who had a HbA1c measurement result recorded within the
previous 6 months or within the previous 12 months (mmol/mol):
≤53 (≤7%)
>53–≤64 (>7%–≤8%)
>64–<86 (>8%–<10%)
≥86 (≤10%).
It is collected for males and females in age groups:
under 35
35–44
45–54
55–64
65 and over.
At June 2019:
39% of Indigenous regular clients with type 2 diabetes had a HbA1c measurement result of ≤53 mmol/mol recorded within the previous 6
months
39% had a HbA1c measurement result of ≤53 mmol/mol recorded within the previous 12 months.
HbA1c result—type 2 diabetes, by time period and reporting period
This Tableau visualisation shows the percentage of Indigenous regular clients with type 2 diabetes who had a HbA1c measurement result
recorded by time period of measurement (select for 6 months or 12 months), HbA1C result in mmol/mol (≤53, >53–≤64, >64–<86, ≥86), and
reporting period (June 2017, December 2017, June 2018, December 2018 and June 2019).
Data supporting this visualisation are available in Excel supplementary data tables at Data.
Visualisation not available for printing
Having a HbA1c measurement result of ≤53 mmol/mol recorded within the previous 6 months was highest in:
New South Wales/the Australian Capital Territory (combined, 45%)
Inner regional areas (46%).
It was lowest in:
South Australia (34%)
Very remote areas (34%).
Having a HbA1c measurement result of ≤53 mmol/mol recorded within the previous 12 months was highest in:
New South Wales/the Australian Capital Territory (combined) and Victoria/Tasmania (combined) (both 46%)
Inner regional areas (47%).
It was lowest in:
South Australia (36%)
Very remote areas (35%).
HbA1c result—type 2 diabetes, by time period and either state/territory or remoteness, reporting period

Two Tableau visualisations are presented here. The first shows the percentage of Indigenous regular clients with type 2 diabetes who had a
HbA1c measurement result recorded by time period of measurement (select for 6 months or 12 months), HbA1C result in mmol/mol (select for
≤53, >53–≤64, >64–<86, or ≥86) for either:
state/territory (NSW/ACT, Vic, Qld, WA, SA, Tas, NT, Australia)
remoteness area (Major cities, Inner regional, Outer regional, Remote, Very remote, Australia).
Reporting periods of either June 2017, December 2017, June 2018, December 2018 or June 2019 can be selected.
The second visualisation shows the selected information from the first visualisation by sex (male, female) and age group (<35, 35–44, 45–54,
55–64, 65+).
Data supporting this visualisation are available in Excel supplementary data tables at Data.
Visualisation not available for printing
Reference
RACGP 2016. General practice management of type 2 diabetes, 2016–18. East Melbourne: RACGP and Diabetes Australia.
Last updated 10/06/2020 v6.0
© Australian Institute of Health and Welfare 2020

Chronic disease management indicators
Kidney function test—type 2 diabetes or CVD (PI18 and PI19)
Indicators related to kidney function tests in the nKPI are:
Type 2 diabetes:
the proportion of Indigenous regular clients aged 15 and over with type 2 diabetes who had an estimated glomerular filtration rate
(eGFR) recorded and/or an albumin/creatinine ratio (ACR) or other micro albumin test result recorded within the previous 12 months
the proportion of Indigenous regular clients aged 15 and over with type 2 diabetes who had an eGFR recorded within the previous 12
months within a specified range
the proportion of Indigenous regular clients aged 15 and over with type 2 diabetes who had an ACR recorded within the previous 12
months within a specified range.
CVD:
the proportion of Indigenous regular clients aged 15 and over with CVD who had an eGFR recorded within the previous 12 months
the proportion of Indigenous regular clients aged 15 and over with CVD who had an eGFR test recorded within the previous 12 months
within a specified range.
Why testing kidney function is important?
Type 2 diabetes and CVD can damage the kidneys. If kidney disease is diagnosed early, appropriate treatment can be given and its effects
can be closely monitored. Indigenous Australians, especially those living in remote areas, are at an increased risk of CKD (AIHW 2019).
RACGP guidelines recommend an annual screening of kidney function in patients with CVD and type 2 diabetes for albuminuria by ACR
(spot urine sample), and annual estimation of the eGFR (RACGP 2016).
A ‘normal’ eGFR result is considered to be ≥ 60 mL/min/1.73 m2 (Kidney Health Australia 2015).
Very low values for ACR (<2.5 for males or <3.5 for females) generally indicate that kidney function is normal if other tests of kidney
function also show no abnormality. A moderately increased ACR indicates an early phase of developing kidney disease. Very high values
indicate that kidney disease is present in a more severe form.
Kidney function test recorded—type 2 diabetes or CVD (PI18)
This indicator is:
the proportion of Indigenous regular clients aged 15 and over with type 2 diabetes who had an eGFR and/or ACR or other micro albumin
test result recorded within the previous 12 months; and
the proportion of Indigenous regular clients aged 15 and over with CVD who had an eGFR recorded within the previous 12 months.
It is collected for males and females in age groups from 15–24 to 65 and over. It is presented here for males and females in age groups:
under 35
35–44
45–54
55–64
65 and over.
At June 2019:
64% of Indigenous regular clients aged 15 and over with type 2 diabetes had an eGFR recorded and/or ACR or other micro albumin test
result recorded within the previous 12 months
62% of Indigenous regular clients aged 15 and over with CVD had an eGFR recorded test result recorded within the previous 12 months.
Visualisation not available for printing
Having an eGFR and/or ACR or other micro albumin test result recorded within the previous 12 months for clients with type 2 diabetes was
highest in:
Western Australia (69%)
Major cities and Remote areas (both 66%).
It was lowest in:

Victoria/Tasmania (combined, 59%)
Inner regional areas (60%).
Having an eGFR test result recorded within the previous 12 months for clients with CVD was highest in:
Western Australia (68%)
Remote areas (69%).
It was lowest in:
New South Wales/the Australian Capital Territory (combined, 55%)
Inner regional areas (54%).
Visualisation not available for printing
Kidney function test result (eFGR)—type 2 diabetes or CVD (PI19-A)
This indicator is the proportion of Indigenous regular clients aged 15 and over with type 2 diabetes or CVD who had an eGFR test result
recorded within the previous 12 months of (mL/min/1.73m2):
≥90
≥60–<90
≥45–<60
≥30–<45
≥15–<30
<15.
It is collected for males and females in age groups from 15–24 to 65 and over. It is presented here for all Indigenous regular clients aged 15 and
over.
At June 2019:
81% of Indigenous regular clients aged 15 and over with type 2 diabetes had an eGFR test result recorded within the previous 12 months of
≥60 mL/min/1.73m2
77% of Indigenous regular clients aged 15 and over with CVD had an eGFR test result recorded within the previous 12 months of ≥60
mL/min/1.73m2.
Kidney function test result (eGFR)—type 2 diabetes and CVD—≥60/mL/min/1.73m2, by time period and reporting period
This Tableau visualisation shows the percentage of Indigenous regular clients aged 15 and over with either type 2 diabetes or CVD who had an
eGFR kidney function test result of ≥60/mL/min/1.73m2 in the last year by reporting period (June 2017, December 2017, June 2018,
December 2018 and June 2019).
Data supporting this visualisation are available in Excel supplementary data tables at Data.
Visualisation not available for printing
Having an eGFR result of ≥60 mL/min/1.73m2 within the previous 12 months for clients with type 2 diabetes ranged from:
83% in New South Wales/the Australian Capital Territory, South Australia and the Northern Territory to 79% in Queensland and Western
Australia
from 84% in Major cities to 79% in Remote areas.
Having an eGFR result of ≥60 mL/min/1.73m2 within the previous 12 months for clients with CVD ranged from:
79% in the Northern Territory to 75% in Western Australian
81% in Major cities to 75% in both Remote and Very remote areas.
Kidney function test result (eGFR)—type 2 diabetes or CVD, by result level and either state/territory or remoteness, reporting period
This Tableau visualisation shows the percentage of Indigenous regular clients aged 15 and over with either type 2 diabetes or CVD who had an
eGFR kidney function test result by result level in mL/min/1.73m2 (select by ≥90, ≥60–<90, ≥45–<60, ≥30–<45, ≥15–<30, or <15) for either:
state/territory (NSW/ACT, Vic, Qld, WA, SA, Tas, NT, Australia)
remoteness area (Major cities, Inner regional, Outer regional, Remote, Very remote, Australia).
Reporting periods of either June 2017, December 2017, June 2018, December 2018 or June 2019 can be selected.
Data supporting this visualisation are available in Excel supplementary data tables at Data.
Visualisation not available for printing
Kidney function test result (ACR)—type 2 diabetes (PI19-B)
This indicator is:

the proportion of male Indigenous regular clients aged 15 and over with type 2 diabetes who had an albumin/creatinine ratio (ACR)
recorded within the previous 12 months of (mg/mmol):
<2.5
≥2.5–≤25
>25.
the proportion of female Indigenous regular clients aged 15 and over with type 2 diabetes who had an albumin/creatinine ratio (ACR)
recorded within the previous 12 months with a result of (mg/mmol):
<3.5
≥3.5–≤35
>35.
It is collected for males and females in age groups from 15–24 to 65 and over. It is presented here for all Indigenous regular clients aged 15 and
over.
At June 2019, 44% of Indigenous regular clients aged 15 and over with type 2 diabetes had an albumin/creatinine ratio (ACR) recorded within
the previous 12 months of <2.5 for males or <3.5 for females.
Kidney function test result (ACR)—type 2 diabetes, by time period and reporting period
This Tableau visualisation shows the percentage of Indigenous regular clients aged 15 and over with type 2 diabetes who had an ACR kidney
function test result in the last year by ACR result and reporting period (June 2017, December 2017, June 2018, December 2018 and June
2019).
Data supporting this visualisation are available in Excel supplementary data tables at Data.
Visualisation not available for printing
This was highest in:
New South Wales/the Australian Capital Territory (combined) and Victoria/Tasmania (combined) (both 57%)
Major cities and Inner regional areas (both 56%).
It was lowest in:
the Northern Territory (35%)
Very remote areas (34%).
Kidney function test result (ACR)—type 2 diabetes, by result level and either state/territory or remoteness, reporting period
This Tableau visualisation shows the percentage of Indigenous regular clients aged 15 and over with type 2 diabetes who had an ACR kidney
function test result in the last year, select for ACR result for either:
state/territory (NSW/ACT, Vic, Qld, WA, SA, Tas, NT, Australia)
remoteness area (Major cities, Inner regional, Outer regional, Remote, Very remote, Australia).
Reporting periods of either June 2017, December 2017, June 2018, December 2018 or June 2019 can be selected.
Data supporting this visualisation are available in Excel supplementary data tables at Data.
Visualisation not available for printing
References
AIHW (Australian Institute of Health and Welfare) 2019. Chronic kidney disease. Viewed 28 April 2020.
Kidney Health Australia 2015. Chronic Kidney Disease (CVK) management in general practice: guidance and clinical tips to help identify,
manage and refer patients with CKD in your practice. Kidney Health Australia. Viewed 16 March 2020.
RACGP 2016. General practice management of type 2 diabetes, 2016–18. East Melbourne: RACGP and Diabetes Australia.
Last updated 10/06/2020 v13.0
© Australian Institute of Health and Welfare 2020

Chronic disease management indicators
Immunised against influenza—type 2 diabetes or COPD (PI15)
This indicator is the proportion of Indigenous regular clients aged 15–49 with type 2 diabetes or chronic obstructive pulmonary disease (COPD)
who had an influenza immunisation within the previous 12 months.
It is collected for males and females in age groups from 15–24 to 45–49. It is presented here for males and females in age groups:
under 35
35–44
45–49.
Why immunisation against influenza is important?
Influenza (the flu) is a contagious respiratory disease that causes seasonal epidemics in Australia. Anyone can be infected with influenza
but some people, such as Indigenous Australians, have a higher chance of serious illness and complications, such as pneumonia. Some
people with influenza die as a result of their infection. Annual vaccination is the best way to prevent severe infections, hospitalisation
and death due to influenza.
While immunisation against influenza is recommended for all Indigenous people aged 6 months and over, it is particularly important for
those who are at a greater risk of complications from influenza infection, such as those with diabetes and COPD. Influenza vaccination
substantially reduces the risk of hospitalisation and death from influenza and pneumonia for people with type 2 diabetes and COPD (AIHW
2018).
At June 2019:
36% of Indigenous regular clients aged 15–49 with type 2 diabetes had an influenza immunisation within the previous 12 months
38% of Indigenous regular clients aged 15–49 with COPD had an influenza immunisation within the previous 12 months.
Immunised against influenza—type 2 diabetes or COPD, by reporting period
This Tableau visualisation shows the percentage of Indigenous regular clients aged 15–49 with either type 2 diabetes or COPD who were
immunised against influenza in the last year by reporting period (June 2017, December 2017, June 2018, December 2018 and June 2019).
Data supporting this visualisation are available in Excel supplementary data tables at Data.
Visualisation not available for printing
Influenza immunisation for those with type 2 diabetes was highest in:
the Northern Territory (42%)
Very remote areas (41%).
It was lowest in:
New South Wales/the Australian Capital Territory (combined, 26%)
Inner regional areas (27%).
Influenza immunisation for those with COPD was highest in:
the Northern Territory (51%)
Very remote areas (49%).
It was lowest in:
New South Wales/the Australian Capital Territory (combined, 28%)
Inner regional and Outer regional areas (both 29%).
Immunised against influenza—type 2 diabetes or COPD, by either state/territory or remoteness, reporting period
Two Tableau visualisations are presented here. The first shows the percentage of Indigenous regular clients aged 15–49 with either type 2
diabetes or COPD who were immunised against influenza in the last year for either:
state/territory (NSW/ACT, Vic, Qld, WA, SA, Tas, NT, Australia)
remoteness area (Major cities, Inner regional, Outer regional, Remote, Very remote, Australia).

Reporting periods of either June 2017, December 2017, June 2018, December 2018 or June 2019 can be selected.
The second visualisation shows the selected information from the first visualisation by sex (male, female) and age group (<35, 35–44, 45–49).
Data supporting this visualisation are available in Excel supplementary data tables at Data.
Visualisation not available for printing
Reference
AIHW (Australian Institute of Health and Welfare) 2018. Vaccine-preventable diseases fact sheets. Cat no. PHE 236. Canberra: AIHW.
Last updated 10/06/2020 v10.0
© Australian Institute of Health and Welfare 2020
Technical notes
Health services funded under the Indigenous Australians’ Health Programme (IAHP) collect and supply important Indigenous health data sets
to the Department of Health as part of their funding agreements. These are the:
Aboriginal and Torres Strait Islander National Key Performance Indicators (nKPI)—a set of indicators that are collected twice a year at the
health service level and which aggregate information on the regular clients that a health service sees.
Aboriginal and Torres Strait Islander health organisations: Online Services Report (OSR)—responses to an annual questionnaire that contains
information about the organisations that provide primary health care services for Indigenous Australians.
This chapter contains information to aid interpretation of the OSR and nKPI collections. Specific information on data quality for each
collection period can be found in the data quality statements for each collection period available on the AIHW’s Metadata Online Registry
(METeOR).
Last updated 26/05/2020 v2.0
© Australian Institute of Health and Welfare 2020

Technical notes
Interpreting OSR data
It is important that the following issues be considered when interpreting the OSR data presented in this report.
General notes
OSR data are collected using a web-based reporting tool designed to capture information about organisations funded by the Australian
Government to provide health services to Aboriginal and Torres Strait Islander people. Data for a small number of non-Indigenous clients
attending these services are also included.
A characteristic of the collection is that the number of organisations submitting data changes slightly each year. While for the most part, it is
the same organisations contributing to the collection, the number of organisations may change due to changes in funding, auspicing or
reporting arrangements at the local level.
Another characteristic of the collection is that the organisations submitting valid data for a particular data item may change over time. This is
because data with remaining quality issues at the cut-off date for each collection are excluded from national analyses. This means that in
each year some organisations' data are partially accepted rather than fully accepted. Both the changing organisations in scope for the
collection and the changing number of organisations with valid data for each data item may impact time series analyses. In this report, time
series analyses are based on all the organisations that provide valid data in each year, rather than on a subset which have valid data over all
years.
All OSR data in this report exclude that from organisations receiving funding only for maternal and child health services.
Changes to collection in 2018–19
In 2018–19, the OSR collection underwent significant change and was scaled back to include only ‘core’ items. Items dropped include the
substance use and social and emotional wellbeing modules, and the services provided and cultural safety items. Plans are underway to
reintroduce key items in a staged approach over the next few years.
Also, collections prior to 2018–19 had maternal and child health (MCH) questions in a separate module to preventative health (PH). In 2018–19
these were combined but the data range MCH services were required to report was only focused on what they received MCH funding for, not
through all types of PH services the health organisation offered.
Episodes of care
While the collection and validation processes for most years have been similar, episodes of care data for 2016–17 are not comparable with
other years because changes were made to the types of contacts that were counted as an episode of care and to how episodes of care were
defined and recorded within some clinical information systems. This meant some contact types (for example, health care delivered over the
telephone and hospital-related contacts) were excluded from the episode of care count in some organisations. These changes resulted in an
expected decrease in episodes of care counts in 2016–17. There was however also an unexpected decrease in episode counts in a few
organisations using Medical Director (MD), where some clinical contacts were not counted in their episodes of care data as they should have
been. These led to lower numbers of episodes of care recorded and potential undercounts for some services in 2016–17. In 2017–18, these
contact types were again included in the episodes of care count and the extraction issues around episodes of care counts were resolved.
Data quality and exclusions
In 2018–19, by the final cut-off date for submissions, most organisations (98%) had provided data that could be included in national analyses.
The remaining 2% (5 organisations) had a total of 10 data items excluded from national analyses due to remaining data quality issues (some
organisations had more than one item excluded). Exclusion rates vary by data item.
Common data quality queries received during data submission were around incomplete or inaccurate data (for example, workforce positions
were not reported or were reported in terms of the number of people rather than full-time equivalent positions); data discrepancies between
two or more questions (for example, the number of clients exceeded the number of episodes of care); and large increases or decreases in
data compared with previous submissions. Where significant data quality issues remained after follow-up, then these data were excluded from
national analyses.
Last updated 4/06/2020 v4.0
© Australian Institute of Health and Welfare 2020


Technical notes
Interpreting nKPI data
The nKPIs cover 15 process-of-care and 9 health-outcome indicators organised under three domains (Table A1).
Table A1: Indicators by domain and type
Maternal and child health indicators
Process-of-care indicators Health-outcome indicators
PI13: First antenatal visit PI02: Birthweight result
PI01: Birthweight recorded PI11: Smoking during pregnancy
PI04: Child immunisation
PI03: MBS health assessment—aged 0–4
Preventative health indicators
Process-of-care indicators Health-outcome indicators
PI09: Smoking status recorded PI10: Smoking status result
PI16: Alcohol consumption recorded PI12: BMI classified as overweight or obese
PI03: MBS health assessment—aged 25 and over PI17: AUDIT-C result
PI20: CVD risk assessment recorded PI21: CVD risk assessment result
Chronic disease management indicators
Process-of-care indicators Health-outcome indicators
PI07: General Practitioner Management Plan—type 2 diabetes PI24: Blood pressure result—type 2 diabetes
PI08: Team Care Arrangement—type 2 diabetes PI06: HbA1c result—type 2 diabetes
PI23: Blood pressure recorded—type 2 diabetes PI19-A: Kidney function test eGFR result—type 2 diabetes or CVD
PI05: HbA1c result recorded—type 2 diabetes PI19-B: Kidney function test result ACR result—type 2 diabetes
PI18: Kidney function test recorded—type 2 diabetes or CVD
PI15: Immunised against influenza—type 2 diabetes or COPD
The nKPIs, like performance indicator systems generally, are useful but imperfect measures of system characteristics that are agreed to be
important. To maximise their usefulness, it is important to understand where and how nKPI data may depart from the reality that the
indicators are trying to measure. As such, the following issues should be considered when interpreting the nKPI data presented in this report.
General issues
The number of organisations that provided valid data are different for different indicators. This means that the analysis of results for each
indicator may not be based on the same number of organisations.
Due to the small number of nKPI reporting organisations, data for Tasmania are combined with that for Victoria and data for the Australian
Capital Territory are combined with that for New South Wales.
There might be double-counting of the same client at multiple organisations due to a high level of mobility among Indigenous Australians.
Nationally, the extent of this is unknown and difficult to quantify.
Where an organisation has a small denominator—that is, fewer than 20 Indigenous regular clients—small changes in the numerator can have
a large impact on the overall proportion for that organisation.

For the most recent data, June 2018, the proportion of organisations with a denominator of fewer than 20 Indigenous regular clients
exceeded 10% of all contributing organisations for 12 of the 24 indicators. One indicator measure, PI15: Immunised against influenza—
clients with COPD, had 78% of organisations with a denominator of fewer than 20 Indigenous regular clients. This was higher than for all
other measures.
Due to the way in which data have been extracted for organisations funded by the Northern Territory Government since December 2015
(the exclusion of measurements or tests conducted outside an individual organisation), results might be underestimated for:
PI03: MBS health assessment—aged 0–4
PI05: Glycated haemoglobin (HbA1c) result recorded
PI07: General Practitioner Management Plan
PI08: Team Care Arrangement
PI09: Smoking status recorded
PI14: Immunised against influenza—aged 50 and over
PI15: Immunised against influenza—clients with type 2 diabetes or COPD
PI16: Alcohol consumption status recorded
PI22: Cervical screening
PI23: Blood pressure result recorded—clients with type 2 diabetes.
Starting with the June 2017 collection, changes were made to the electronic data extraction method for most organisations. AIHW analysis
identified time-series anomalies that indicated that the change in extraction method constitutes a break in series. This means that the
June 2017 collection represents a new baseline for the collection moving forward, as data from earlier collections are not comparable
with data from June 2017 onwards.
Until June 2016, the nKPI data were extracted from health organisations’ clinical software systems, largely by a single tool, PenCAT. This
tool was compatible with Medical Director, Best Practice, PractiX, Communicare and a version of Medinet. Some organisations also
submitted manually. Organisations using MMEx transmitted data directly.
For the June 2017 nKPI data collection, the Department of Health introduced a new direct load reporting process, which allowed
Communicare, Medical Director and PCIS clinical software systems to generate nKPI data within their clinical system and transmit it
directly. Best Practice organisations were provided with the Telstra Health tool, Elicio, to extract, transform and send their data. Some
Best Practice organisations used a Structured Query Language script developed by the Improvement Foundation in conjunction with the
manual submission form. Some changes were made to the MMEx extraction process as a result of the Data Validation Project. All of the
main clinical information systems now have direct load ability, and data validation is a significant and ongoing process for nKPI and OSR
direct load data.
MBS items are not claimed by all organisations, either because they do not have a general practitioner (GP) present, they are not eligible
to claim them, or clients are seen by other clinicians. As a result, the indicators based on MBS items might not reflect all related health
care activities carried out in an organisation. These indicators include MBS health assessment (item 715), GPMPs (item 721) and TCAs (item
723). In the case of child health checks, children may receive comprehensive health checks provided within a model of care that does not
suit or allow for the check to be claimed as an MBS item. MBS health checks are counted in Communicare at a point in the process before
its submission. Only claims explicitly discarded after a rejection are subsequently excluded (DMA 2017). The impact of this has not been
quantified.
GP availability might be limited in some areas, and have an impact on the results reported by organisations. For example, limited GP
availability might affect an organisation being able to claim MBS items (child and adult health checks, GPMPs, and TCAs).
Shared care arrangements between hospitals and primary health care organisations, between primary health care organisations, or
between primary health care organisations and other providers of similar care are not consistently supported by automatic data sharing.
This could lead to lower rates of data recording for some indicators, such as birthweight results and antenatal care. Similarly, it will be
difficult for organisations to obtain information on their regular clients who may choose to receive cervical screening elsewhere.
Smoking status categories are not yet fully agreed on. For example, there is not yet universally accepted guidance on how long a person
needs to have quit smoking to be considered an ex-smoker rather than a smoker. An increased number of types of ex‑smokers might
improve data quality, and lead to more frequent updating of clients’ records.
Small denominators can cause fluctuations in data over time, therefore results should be interpreted with caution.
For maternal and child health indicators, 10%–57% of organisations contributing to these indicators in June 2018 had denominators of
fewer than 20 clients.
For preventative health indicators, 1%–27% of organisations contributing to these indicators in June 2018 had denominators of fewer
than 20 clients.
For chronic disease management indicators 7%–18% of organisations contributing to these indicators in June 2018 had denominators of
fewer than 20 Indigenous regular clients.
For services using MMEX, data quality issues were identified which affected data submitted in collections from June 2019 and earlier for
the following indicators:
PI09 Smoking status recorded
PI10 Smoking status result
PI11 Smoking status of women who gave birth within the previous 12 months
PI16 Alcohol consumption recorded
PI17 AUDIT-C (alcohol consumption) results.
These submitted data had values drawn from all available time periods rather than the last 24 months. Data for all periods shown in this
report exclude services affected by this issue. As such, data for previous periods may differ from previously published data.
Regular clients

Regular clients
A regular client is defined as a person who has attended a particular primary health care organisation at least 3 times in the previous 2 years.
Starting from the June 2018 collection, the definition of a regular client excludes deceased patients. All of the indicators, except the 2
birthweight indicators, use the regular client definition. The following points should be noted when interpreting results:
The concept of a visit varies within CISs, and might be captured differently for services, clinical items, diagnoses, clinical procedures,
episodes of care, client contact, and other variables used in CIS data (DMA 2017). Vendors have been addressing these issues but any
subsequent residual impact on results has not been quantified.
During the June 2018 collection, updates to the clinical software Medical Director Insights and the Communicare Launchbar were released.
These updates meant that deceased patients were excluded from the regular client count. However, 10 organisations submitted nKPI data
using an older version of MD Insights and 22 organisations submitted nKPI data using an older version of the Communicare Launchbar.
Deceased clients may have been included in data for these organisations. At the national level, this may lead to an overrepresentation of
the number of regular clients and a lower proportion of people receiving appropriate health care.
There are various scenarios where a client would or would not be considered a regular client, which should be considered when
interpreting the data. These might include the following:
Some clients might attend an organisation 3 times in 2 years, but have another primary health care organisation as their primary place
of care. At the organisational level, this provides an invalid measure of the extent to which a person is receiving appropriate care from
the provider they visit 3 or more times, but which is not their main provider. Examples include where a patient declines a particular
service, having recently received it at their usual health organisation, or a clinician being able to see results due to a linked CIS or
shared electronic health records. At the national level, this will lead to double-counting of that person and underestimate the national
proportion of people who are receiving appropriate health care.
Some clients might be transient and stay in a community only temporarily. Organisations with a large proportion of transient clients
who are counted as regular clients might appear to have poorer results than other organisations, as they have less capacity to follow
up on patients, including those with chronic diseases. These organisations might also choose to allow a client’s usual primary health
care organisation to provide some MBS item services, including health checks, General Practitioner Management Plans (GPMPs), and
Team Care Arrangements (TCAs). This would underestimate the national proportion of people who are receiving appropriate health
care. Analysis of data in 2016 found that the nKPI definition leads to a higher count of regular clients for many indicators compared
with a definition that restricts the denominator to the usual clients of a health care organisation. The impact of this was that out of a
possible 24 measures, 21 measures had better results when the definition was restricted (see AIHW 2017).
Clients might access different health care organisations in the same general location, and might not use the same organisation
consistently. They might use various organisations for different purposes; for example, favouring one when they want increased
privacy and another because it bulk bills (Bailie et al. 2013). This behaviour might be more common in regions with more health care
options, and less frequent in areas where local health care options are more limited (for example, Very remote areas). This could
result in variations in the make-up of regular clients between regions.
Organisations operating out of regional centres in a given remoteness area (for example, Alice Springs, which is classified as a Remote
area) might have higher levels of regular clients who are not their usual clients than other Remote organisations. This is because they
might be regional centres used in transit, and because they provide a wider array of health care options.
Maternal and child health indicators
Babies’ records (rather than mothers’ records) are the specified source of data for indicators on birthweight recorded and results. But
data from organisations using MMEx source this information from the mothers' records (DMA 2017). The impact of this on results has not
been quantified. The standard nKPI Indigenous regular client definition does not apply to these indicators—the baby is considered a client
and counted in the nKPIs even if they attended only once, and their parents are not regular clients of the organisation. This might lead to
the inclusion of babies who visited the organisation purely for acute care, and whose carers might not have been able to confirm
birthweight.
Multiple births should not be included in birthweight results, as babies born as part of multiple births are more likely to have a lower
birthweight. But Medical Director and Communicare do not exclude multiple births, as this information is not captured in the baby’s
record. Nor do Medical Director and Communicare exclude babies with ‘unknown gestational age’ from the low birthweight indicator (DMA
2017). Although this finding was not expected to significantly affect the nKPIs, it is possible it might inflate the proportion of low
birthweight babies recorded in the data.
Babies’ birthweight and antenatal visits data may be underestimated, as results for Northern Territory Government organisations were
provided by the Northern Territory Government Midwifery Group Practice, but not entered as having occurred at the client’s usual health
centre. This was rectified for some Northern Territory Government organisations in December 2017 but may affect some data included in
this report.
Antenatal visits data for organisations using Communicare and Medical Director may have been affected by data extraction issues related
to the recording of the categories 'No visit recorded’ and ‘Timing of visit not recorded’. The issue was identified in data for June 2017,
December 2017 and June 2018. Further information is provided in Chapter 2 of the AIHW (2018) report National Key Performance Indicators
for Aboriginal and Torres Strait Islander primary health care: results for 2017.
Smoking status of women who gave birth in the previous 12 months records smoking status during pregnancy retrospectively, and the
information is updated only when women’s smoking status category is changed. Therefore, this indicator is a proxy for smoking during
pregnancy.
Child immunisation data for the nKPI collection indicates that primary health care records are capturing far fewer cases of fully immunised
Indigenous children than Australian Immunisation Register (AIR) data. nKPI data may therefore be an underestimate.
Preventative health indicators

Preventative health indicators
Influenza vaccination does not include clients who are offered a vaccination, but refuse. Also, organisations might not have records of
immunisations that occurred at other places, such as workplaces.
Time-stamped records normally ensure that a record or activity is fairly recent. A number of indicators (smoking status recorded, smoking
status result, and alcohol consumption) are based on the most recent record for the client (that is, treated as having been updated in the
previous 2 years), regardless of how old that record is. As a result, the indicator might not reflect the current smoking or alcohol
consumption status of the Indigenous regular client population, unless the data have been collected recently for all or most clients.
Differential BMI testing might occur in some organisations where BMI might be more likely to be measured in clients who look
underweight, overweight, or obese. This would result in the proportion of overweight or obese Indigenous regular clients being higher
than it actually is.
Recording of alcohol consumption status (PI16) is not restricted to a particular test or format for this indicator. Organisations can use tests
such as AUDIT or AUDIT-C, or simply record whether or not the client consumes alcohol. However, for the indicator on AUDIT‑C results
(PI17), only AUDIT-C results are included. This means that, for some organisations, test results in PI17 are a subset of the tests reporting in
PI16.
Risk factors to enable a CVD risk assessment require information on diabetes status. For the June 2017 collection, MMEx restricted the
count of clients with all the necessary risk factor information (that is, the numerator) to clients with a type 2 diabetes diagnosis, leading
to an under-count for this indicator. MMEx results for June 2017 are excluded from results presented.
Absolute cardiovascular risk assessments can be calculated using the NVDPA or the CARPA method. As the CARPA method applies an extra
5% loading for Indigenous Australians, nKPI data should have the 5% loading removed to make the data comparable with NVDPA data. As the
PCIS system is unable to deduct the 5% because the data are captured as categorical scores (low, medium, high), organisations using PCIS
(predominantly the Northern Territory Government) are not included in the results presented. Additionally, data do not capture clients
without known CVD whose risk factors mean they are categorised as ‘high risk’ and therefore do not require a risk assessment.
CVD risk calculators embedded in some CISs do not capture all the data needed to apply the full NVDPA risk assessment algorithm (Agostino
et al. 2020). For national, state and remoteness analysis, data are included only from services with CISs which do capture all the necessary
data. Data from services using CISs that do not capture all the necessary data may underestimate the number of clients at high CVD risk.
Cervical screenings are conducted for female regular clients who are Indigenous, aged 20–74. In June 2018, this indicator was revised to
align with the new National Cervical Screening Program (NCSP) where the previous Pap test is replaced by a HPV test from 1 December
2017. The key changes were that:
data are to be collected on clients who had either a Papanicolaou smear (Pap test) conducted prior to 1 December 2017 or a human
papillomavirus (HPV test) conducted from 1 December 2017
the HPV test can be based on a sample collected by a health practitioner or on a self-collected sample
the age range for this nKPI indicator has been revised to 20–74 for a transitional period. This is to accommodate the former reporting
age range (20–69) and the new age range (25–74).
An update for Medical Director Insights that incorporated the indicator changes was released during the July 2018 submission period.
Where organisations were identified as using an older version of this CIS, and therefore submitting data that did not align with the PI22
changes, data were excluded from the results. As a result, the number of cervical screenings may be underrepresented in the results
presented. In addition, some data mapping issues related to the pathology codes used were identified for organisations using MMEX. This
issues was addressed in August 2018 and some organisations were able to amend data values. The impact of this issue has not been
quantified.
Chronic disease management indicators
Influenza vaccination does not include clients who are offered a vaccination, but refuse. Also, organisations might not have records of
immunisations that occurred at other places, such as workplaces.
Pathology results held at an organisation might not reflect all pathology tests that have occurred for its Indigenous regular clients.
Organisations without systems in place might not have recorded the information, or results might not have been picked up accurately.
Access to allied health providers might be limited in some areas, in which case TCAs might not be practical. This is often the case in
remote regions.
Clinical definitions for type 2 diabetes, CVD and COPD vary across CISs, as different coding schemes are used. Medical Director uses doctor
command language (DOCLE) codes, Communicare uses International Classification of Primary Care 2nd edition (ICPC2), and MMEx uses
Systematized Nomenclature of Medicine (SNOMED). This leads to some variation in the patients who will be picked up by different CISs
(DMA 2017).
Kidney function test recorded and result (type 2 diabetes and CVD) data were excluded from June 2018 national reporting for
organisations using Medical Director Insights v1.5. Kidney function test recorded (type 2 diabetes) has had ongoing data quality issues
since June 2017. Because of this, results for this indicator are not presented for June 2017. In December 2017, results from organisations
using Best Practice and Medical Director were excluded.
References
Agostino J, Wong D, Paige E, et al. 2020. Cardiovascular disease risk assessment for Aboriginal and Torres Strait Islander adults aged under 35
years: a consensus statement. Medical Journal of Australia; Published online: 16 March 2020.
AIHW (Australian Institute of Health and Welfare) 2017. National Key Performance Indicators for Aboriginal and Torres Strait Islander primary
health care: results from June 2016. National key performance indicators for Aboriginal and Torres Strait Islander primary health care series
no 4. Cat. no. IHW 177. Canberra: AIHW.

AIHW (2018). National Key Performance Indicators for Aboriginal and Torres Strait Islander primary health care: results for 2017. National key
performance indicators for Aboriginal and Torres Strait Islander primary health care series no. 5. Cat. no. IHW 200. Canberra: AIHW.
Ballie RS, Griffin J, Kelaher M, McNeair T, Percival N, Laycock A et al. 2013. Sentinel sites evaluation: final report. Report prepared by Menzies
School of Health Research for the Department of Health. Canberra: DoH.
DMA (Doll Martin Associates) 2017. National Key Performance Indicators for Aboriginal and Torres Strait Islander primary health care: Data
Validation Project report. Canberra: DoH.
Last updated 9/06/2020 v24.0
© Australian Institute of Health and Welfare 2020

Glossary
Aboriginal and/or Torres Strait Islander: A person who identified themselves, or was identified by another household member, as being of
Aboriginal or Torres Strait Islander origin. See also Indigenous.
Aboriginal Community Controlled Health Services (ACCHSs): Health services operated by local Indigenous communities to deliver
comprehensive, holistic and culturally appropriate health care to their communities. They range from large services with several medical
practitioners who provide a range of services, to small services that rely on nurses and/or Aboriginal health workers to provide most services,
and are controlled through a locally elected board of management. For more information see the National Aboriginal Community Controlled
Health Organisation (NACCHO) website.
Aboriginal and Torres Strait Islander health worker: An Aboriginal and/or Torres Strait Islander person with a minimum qualification in the
field of primary health-care work or clinical practice. Aboriginal and Torres Strait Islander health practitioners are one speciality stream of
health worker. Health workers liaise with patients, clients and visitors to hospitals and health clinics, and work as a team member to arrange,
coordinate and provide health-care delivery in community health clinics.
Aboriginal and Torres Strait Islander health practitioner: A person who has completed Certificate IV in Aboriginal and/or Torres Strait
Islander Primary Health Care (Practice) and is registered with the Aboriginal and Torres Strait Islander Health Practice Board of Australia. The
practitioner may undertake higher levels of clinical assessment and care within their agreed scope of practice. This role became nationally
registered from 1 July 2013 under the National Registration and Accreditation Scheme for health professions.
Accessibility/Remoteness Index of Australia (ARIA): ARIA measures the remoteness of a point based on the physical road distances to the
nearest urban centre in each of 5 size classes. Therefore, not all remoteness areas are represented in each state or territory.
There are 6 remoteness areas in this structure:
Major cities—collection districts (CDs) with an average ARIA index value between 0 and less than or equal to 0.2
Inner regional areas—CDs with an average ARIA index value greater than 0.2 and less than or equal to 2.4
Outer regional areas—CDs with an average ARIA index value greater than 2.4 and less than or equal to 5.92
Remote areas—CDs with an average ARIA index value greater than 5.92 and less than or equal to 10.53
Very remote areas—CDs with an average ARIA index value greater than 10.53
Migratory—composed of offshore, shipping and migratory CDs.
aged care: This is defined in the OSR as the organisation routinely provides clinical and support services to older people, including any of the
following: coordination of care; assessment, case management, therapy and review; routine management of acute and chronic medical
conditions; referral and support to access aged care services; specific group activities for older people; and visiting services to older people
at home or in residential aged care facilities.
albumin/creatinine ratio (ACR): A measure of renal function that assesses albumin in the urine. A healthy result was considered as less than
2.5 for males and less than 3.5 for females.
allied health professionals: Includes professionals working as an audiologist/audiometrist, diabetes educator, dietitian, optometrist,
pharmacist, physiotherapist, podiatrist, speech pathologist and ‘other’ allied health professionals not already specified.
AUDIT-C: An Alcohol Use Disorders Identification Test screening tool, which is sensitive to the early detection of risky and high-risk (or
hazardous and harmful) drinking.
birth: Birth of a viable fetus, which is defined as a birth occurring after 20 weeks of pregnancy or the fetus weighing more than 400 grams at
birth (live, still, singleton, multiple).
birthweight: Birthweight is defined as low (birthweight of less than 2,500 grams), normal (birthweight of 2,500–4,499 grams), or high
(birthweight of 4,500 grams and over).
body mass index (BMI): A measure of an adult’s weight (body mass) relative to height, used to assess the extent of weight deficit or excess,
where height and weight have been measured. BMI is the weight in kilograms divided by the square of the height in metres.
cardiovascular disease (CVD): Any disease of the circulatory system, namely the heart (cardio) or blood vessels (vascular).
cervical screening: A procedure involving a Pap test or HPV test, which is used to detect cancer and pre-cancerous abnormalities of the
cervix.
chronic obstructive pulmonary disease (COPD): Serious, progressive and disabling long‑term lung disease where damage to the lungs—
usually because of both emphysema and chronic bronchitis—obstructs oxygen intake, and causes increasing shortness of breath.

client numbers: Counts how many individuals receive health care by an organisation during the collection period. Each individual is counted
as a client once only, regardless of how many times they are seen. Visitors and transient clients are included in client counts, but clients
attending group activities only (and who do not receive individual care) are excluded.
client contacts: Counts the client contacts made by each type of health worker from an organisation during the collection period. Includes
contacts made by both employed and visiting staff and transport contacts. Contacts made as part of a group are excluded from the count, as
are administrative contacts and residential care contacts.
clinical information system (CIS): A computer system used to manage client records.
episodes of care: Counts the episodes of care provided by each organisation during the collection period. This is based on a count of the
contacts between an individual client and 1 or more staff providing health care within 1 calendar day. All contacts with the same client on the
same day are treated holistically as 1 episode of care. Includes contacts with both employed and visiting staff. Transport-only contacts and
those made as part of a group are excluded from the count, as are administrative contacts and residential care contacts.
estimated glomerular filtration rate (eGFR): A measure of how well the kidneys filter waste from the blood. The eGFR is the best measure of
kidney function. A result of 60mL/min/1.73m2 or over was considered as normal or close to normal.
first antenatal visit: The contact at which the initial antenatal check-ups are done—for example, to confirm pregnancy, establish history, and
conduct blood tests.
full-time equivalent (FTE) staff: Counts how many FTE positions an organisation paid the wages or salary for at the 30 June (employed staff),
how many staff worked for but were not paid for by the organisation during the collection (visiting staff) and how many vacant positions
there were at 30 June. FTE is a standard measure of the size of a workforce that takes into account both the number of workers and the
hours that each works. For example, if a workforce comprises 2 people working full-time 40 hours a week and 2 working half-time, this is the
same as 3 working full-time—an FTE of 3.
fully immunised: Describes children who have received all immunisations according to the AIR.
Children aged 12–<24 months are required to have received all immunisations that are due at 6 months:
3 doses of diphtheria, tetanus, and pertussis (whooping cough)
3 doses of polio
2 or 3 doses of haemophilus influenzae type B
2 or 3 doses of hepatitis B.
Children aged 24–<36 months are required to have received all immunisations that are due at 12 months:
3 doses of diphtheria, tetanus, and pertussis (whooping cough)
3 doses of polio
3 or 4 doses of haemophilus influenzae type B
3 doses of hepatitis B
1 dose of measles, mumps and rubella (MMR).
Children aged 60–<72 months are required to have received all immunisations that are due at age 4:
4 doses of diphtheria, tetanus, and pertussis (whooping cough)
4 doses of polio
2 doses of measles, mumps and rubella (MMR).
General Practitioner Management Plan (GPMP): Chronic disease management plan carried out according to the MBS Schedule (item 721).
haemoglobin A1c (HbA1c or glycated haemoglobin): A measurement that acts as an indicator of time-averaged blood glucose levels (over the
previous 2–3 months). It is used as the best marker of long-term diabetes control (Jones et al. 2011).
health staff: The following positions are counted as ‘health’ staff in this report: Aboriginal and Torres Strait Islander health workers;
Aboriginal and Torres Strait Islander health practitioners; doctors/GPs; nurses and midwives; substance misuse and drug and alcohol workers;
tobacco workers and coordinators; dentists or dental therapists; dental support workers; sexual health workers; outreach workers; traditional
healers; environmental health workers and officers; medical specialists; social and emotional wellbeing staff and counsellors; allied health
professionals; health promotion or prevention workers; training or trainee health positions; other health workers (not reported elsewhere).
indicator: See definition for national Key Performance Indicators.
Indigenous: Used interchangeably with Aboriginal and Torres Strait Islander. See also Aboriginal and/or Torres Strait Islander.
influenza: An acute contagious viral respiratory infection marked by fever, muscle aches, headache, cough, and sore throat.
MBS health assessment: Health assessment for those aged 0–4 and 25 and over, which are done according to the MBS Schedule (item 715).
medical specialists: Medical practitioners who are registered as specialists under a law of state or territory or recognised as specialists or
consultant physicians by a specialist recognition advisory committee, such as paediatricians, ophthalmologists, cardiologists, ear, nose and
throat specialists, obstetricians and surgeons.
national Key Performance Indicators (nKPIs): A set of indicators that monitor the major health issues of the regular client population of
Indigenous-specific primary health care organisations.
non-Indigenous: A person who has indicated they are not of Aboriginal and/or Torres Strait Islander origin.
other staff: The following positions are counted as ‘other’ staff in this report: chief executive officers (CEOs); managers and supervisors;
drivers and field officers; finance and accounting staff; administrative and clerical staff; information technology (IT) and data management
staff; cleaners, security and other support staff; administrative and support trainees.
palliative care: This is defined in the OSR as: the organisation provides clinical management and care coordination, including assessment,
triage and referral using a palliative approach for patients with uncomplicated needs associated with a life-limiting illness or end of life care.
The organisation also has formal links with a specialist palliative care provider for purposes of referral, consultation and access to specialist
care as necessary.
primary health care organisations: Organisations that receive funding from the Australian Government Department of Health to provide
primary health care services. While some primary health care organisations constitute an individual health care clinic, others have multiple
clinics, and provide combined data for all their clinics. Other nKPI reporting organisations are intermediaries (for example, Primary Health
Networks), which might also combine the data for the clinics where they subcontract services.
program: A planned, regular activity organised by an organisation.
regular client: A client who has visited a particular primary health care provider 3 or more times in the previous 2 years.
remoteness areas: The remoteness areas divide Australia into broad geographic regions that share common characteristics of remoteness for
statistical purposes. Each state and territory is divided into several regions based on their relative accessibility to goods and services (such as
GPs, hospitals and specialist care) as measured by road distance. These regions are based on the Accessibility/Remoteness Index of Australia
(ARIA). The main categories are Major cities, Inner regional, Outer regional, Remote, and Very remote . Individual states and territories may
not contain areas of every class: for example, the Northern Territory does not contain a Major city or an Inner regional classification.
remoteness structure: One of 7 geographical structures listed in the Australian Standard Geographic Classification. Its purpose is to classify
collection districts that share characteristics of remoteness into broad geographical regions called remoteness areas.
service delivery site: Includes all service delivery sites owned, leased or otherwise controlled by an organisation. It does not include outlets
or sites only visited by mobile services.
smoking status: Current smoker includes those who smoke daily, weekly, or less often than weekly; ex-smoker refers to a person who does
not smoke at all now, but has smoked at least 100 cigarettes, or a similar amount of other tobacco product, in his/her lifetime; never smoked
refers to a person who does not smoke now, and has smoked fewer than 100 cigarettes, or a similar amount of other tobacco product, in
his/her lifetime.
social and emotional wellbeing (SEWB) staff: These include (but are not limited to) psychologists, counsellors, mental health workers, social
workers and welfare workers.
Tackling Indigenous Smoking and Healthy Lifestyle Program: A program funded by the Australian Government focusing on health promotion
around smoking and healthy lifestyles to help close the gap between the health of Indigenous Australians and non-Indigenous Australians, and
to reduce chronic disease in Aboriginal people. The team is made up of regional tobacco action workers and healthy lifestyle workers, and all
are trained outreach Aboriginal health workers.
Tackling Indigenous Smoking Program: Funded by the Australian Government, this targeted activity aims to prevent the uptake of smoking
and supports smoking cessation among Aboriginal and Torres Strait Islander people. It is a multi-component program that focuses on evidence-
based activities and tobacco reduction outcomes. It uses proven approaches to change smoking behaviours, with activities delivered at
multiple levels, including health service funding, workforce training and organisational support, and support for smokers through Quitline
funding. The Tackling Indigenous Smoking Program replaces the previous Tackling Indigenous Smoking and Healthy Lifestyle Program.
Team Care Arrangement (TCA): Chronic disease management plan carried out according to the MBS Schedule (item 723).
type 2 diabetes: The most common form of diabetes, occurring mostly in people aged 40 or over, and marked by reduced or less effective
insulin.
Last updated 4/06/2020 v5.0
© Australian Institute of Health and Welfare 2020

Data
Data tables: OSR organisational profile
Download Data tables: OSR organisational profile. Format: XLSX 87Kb XLSX 87Kb
Data tables: OSR workforce
Download Data tables: OSR workforce. Format: XLSX 257Kb XLSX 257Kb
Data tables: OSR client numbers
Download Data tables: OSR client numbers. Format: XLSX 104Kb XLSX 104Kb
Data tables: OSR client contacts
Download Data tables: OSR client contacts. Format: XLSX 151Kb XLSX 151Kb
Data tables: OSR episodes of care
Download Data tables: OSR episodes of care. Format: XLSX 123Kb XLSX 123Kb
Data tables: OSR services provided
Download Data tables: OSR services provided. Format: XLSX 344Kb XLSX 344Kb
Data tables: nKPI child and maternal health indicators
Download Data tables: nKPI child and maternal health indicators. Format: XLSX 241Kb XLSX 241Kb
Data tables: nKPI preventative health indicators
Download Data tables: nKPI preventative health indicators. Format: XLSX 720Kb XLSX 720Kb
Data tables: nKPI chronic disease management indicators
Download Data tables: nKPI chronic disease management indicators. Format: XLSX 890Kb XLSX 890Kb
Data tables: further information about the nKPI collection
Download Data tables: further information about the nKPI collection. Format: XLSX 91Kb XLSX 91Kb
Last updated 19/03/2020 v1.0
© Australian Institute of Health and Welfare 2020

Related material
Related topics
Primary health care
Last updated 10/06/2020 v3.0
© Australian Institute of Health and Welfare 2020