


Languages
Pages
Legal


MS Thesis
Environment and Natural Resources
Productive performance of the Lake Victoria fishing fleet in Uganda:
Technical efficiency and fishers’ perspective
Veronica Mpomwenda
Advisors: Daði Már Kristófersson and Jón Geir Pétursson
Faculty of Economics
June 2018
Performance of the Lake Victoria fishing fleet in Uganda:
Technical efficiency change and fishers’ perspective
Veronica Mpomwenda
60 ECTS thesis submitted in partial fulfilment of a Magister Scientiarum degree in
Environment and Natural Resources
Advisors: Daði Már Kristófersson and Jón Geir Pétursson
Faculty of Economics
School of Social Sciences
June 2018

Performance of the Lake Victoria fishing fleet in Uganda; Technical efficiency and fishers’ perspective
This thesis equals 60 ECTS credits towards partial fulfilment for a Magister
Scientiarum degree at the Faculty of Economics, School of Social Sciences,
University of Iceland.
Work on this thesis has been supported by a scholarship from the United
Nations University Fisheries Training Program, Reykjavik Iceland.
© 2018 Veronica Mpomwenda.
This thesis can only be copied with the author’s permission
Printed and bound by: Háskólaprent.
Reykjavik, 2018

i
Abstract
Successful exploitation of biological resources, like fisheries, depends on monitoring
and evaluation of stock size and active management to stop overexploitation. This can
be difficult due to limited information available to resource managers to make
management decisions, particularly in developing countries with weak institutions and
limited resources. In this study, the performance of the fishing fleet of the Lake Victoria
fisheries in Uganda is determined and used as an indicator of stock health and
development. The analysis in the study is two-fold based on technical efficiency change
of the fishing fleet and also fishers’ perceptions of the production environment. The
fishing fleet is categorized into six vessel groups distinguished as motorized or paddled
using three gear categories; gill nets and long lines for the Lates niloticus (Nile perch)
fishery, and small seine nets for the Rastrineobola argentea (dagaa/mukene/omena)
fishery. In determining technical efficiency, the study employs the stochastic frontier
approach for eight-year unbalanced panel data and assessment of fishers’ responses
during interviews analyzed in IBM-SPSS. Results indicated that maximum output in the
fishery was obtained by motorized vessels, with the highest rate of technical progress
(94%) for the motorized dagaa fishery. In terms of technical efficiency change, a general
decrease in technical efficiency was observed for all vessel groups for the period 2005
to 2015. This was coupled with declining returns to scale as vessel inputs employed for
the same time period resulted to declining catches. Declines were higher for the Nile
perch long line and gillnet vessel groups than in the dagaa vessel groups. Labour hours
in the dagaa fishery indicated congestion while more labour hours were required for
maximising catches in the motorized Nile perch vessels. Fishers also perceived catches
of Nile perch to be poorer than catches in the dagaa fishery thus more likely to affect
the performance of the Nile perch vessel groups than the dagaa vessels.
Therefore, effort restricting policy measures for all fishery inputs should be
integrated into the fishery management objectives, and the capacity for grassroots
fisheries management developed.

ii
Table of contents
Abstract ....................................................................................................................... i
Table of contents ....................................................................................................... ii
List of figures ............................................................................................................. iv
List of tables .............................................................................................................. vi
List of acronyms ........................................................................................................ vii
1. Introduction ..................................................................................................... 8
1.1 Background ................................................................................................... 8
1.2 Overview of Lake Victoria fisheries .............................................................. 9
1.2.1 Geography and socio-economy ............................................................ 9
1.2.2 Fishing effort and technology ............................................................. 11
1.2.3 Fisheries management ........................................................................ 12
1.3 The objective of the study .......................................................................... 13
1.4 The significance of the study ...................................................................... 13
1.5 Research questions .................................................................................... 14
1.6 Structure of the thesis. ............................................................................... 14
2 Literature review ............................................................................................... 15
2.1 Technical efficiency .................................................................................... 15
2.1.1 Definition and scope ........................................................................... 15
2.1.2 Technical efficiency in fisheries .......................................................... 16
2.1.3 Methods for determining technical efficiency................................... 18
2.1.4 Model specification-Stochastic Frontier Analysis ............................... 18
2.2 Fishers’ perceptions ................................................................................... 20
3 Material and Methods ....................................................................................... 21
3.1 Study area ................................................................................................... 21
3.2 Data ............................................................................................................ 22
3.2.1 Technical efficiency ............................................................................. 22

iii
3.2.2 Fisher perception ................................................................................ 25
3.3 Data analysis ............................................................................................... 26
3.3.1 Technical efficiency ............................................................................. 26
3.3.2 Empirical model .................................................................................. 26
3.3.3 Fishers perceptions ............................................................................. 30
4 Results ................................................................................................................ 31
4.1 Respondents’ profile and fishery characteristics ....................................... 31
4.2 Technical efficiency .................................................................................... 33
4.2.1 Hypothesis testing............................................................................... 33
4.2.2 Output elasticity .................................................................................. 36
4.2.3 Returns to scale ................................................................................... 39
4.2.4 Technological change .......................................................................... 40
4.2.5 Technical efficiency ............................................................................. 41
4.3 Fishers’ perceptions ................................................................................... 45
4.3.1 Perception of fish catches ................................................................... 45
4.3.2 Factors when choosing a fishing site .................................................. 46
4.3.3 Challenges faced in fishing. ................................................................. 47
4.3.4 Knowledge about fishery regulations ................................................. 48
4.3.5 Suggested management institutions .................................................. 50
5 Discussion .......................................................................................................... 52
5.1 Technical efficiency .................................................................................... 52
5.2 Fishers’ perceptions ................................................................................... 55
5.3 Conclusion and recommendations............................................................. 58
6 Acknowledgement ............................................................................................. 60
7 References ......................................................................................................... 61
8 Appendix ............................................................................................................ 67

iv
List of figures
Figure 1. Fisheries production in Lake Victoria by species (Source; Kolding et al.,
2013; LVFO, 2016). ............................................................................................... 10
Figure 2: Technical efficiency of a single input-output production; technical
efficiency score for an efficient firm is 1 and operates some point (AI)
along the frontier OP whereas the technically inefficient firm has a score
less than 1 and given as OQ1/OQ or BI/AI ( Fried et al., 1993). ........................... 15
Figure 3: Study area and reference landing sites. ............................................................ 21
Figure 4: The relationship between fishers experience and age. .................................... 31
Figure 5: Change in output elasticity of the input variables for the different vessel
groups over time; SMS-Motorised and SP-Paddled vessels using LL-long
lines, GN-gillnets and SS-small seines; vertical scale based on target
species as LL & GN target Nile perch while SS target
Dagaa/Omena/Mukene. ...................................................................................... 37
Figure 6: Returns to scale for the different vessel groups over time; SMS-
Motorised and SP-Paddled vessels using LL-long lines, GN-gillnets and SS-
small seines; vertical scale based on target species as LL & GN target Nile
perch while SS target Dagaa/Omena/Mukene. ................................................... 40
Figure 7: Technical efficiency change of the vessel fleet over time; SMS-
Motorised and SP-paddled vessels using GN-gillnets, LL-long lines and SS-
small-seine ............................................................................................................ 43
Figure 8: Changes in technical efficiency for the period 2005-2008; 2010-2011;
2014-2015 for vessel group A-SMS-LL and B-SP-LL .............................................. 44
Figure 9: Perception of dagaa catches between respondents using motorised and
paddled vessels. ................................................................................................... 45
Figure 10: Respondents’ choice of the fishing site based on weather Vis a Vis
their fishing experience ........................................................................................ 47
Figure 11: Perceived severity of high input costs based on respondents marital
status. ................................................................................................................... 47

v
Figure 12: Respondents support for BMU and fishers as their suggested
management institution according to landing site. ............................................. 51

vi
List of tables
Table 1: The Key fishery effort variables in Lake Victoria (Source; regional frame
survey reports 2000-2014) ................................................................................... 12
Table 2: Summary statistics for the SFA model variables for the different vessel
groups. .................................................................................................................. 25
Table3: Respondent and fleet characteristics based on the type of fishery- Nile
perch, dagaa and Tilapia. ..................................................................................... 32
Table4: Statistics for the hypothesis tests of the stochastic frontier production
model. ................................................................................................................... 35
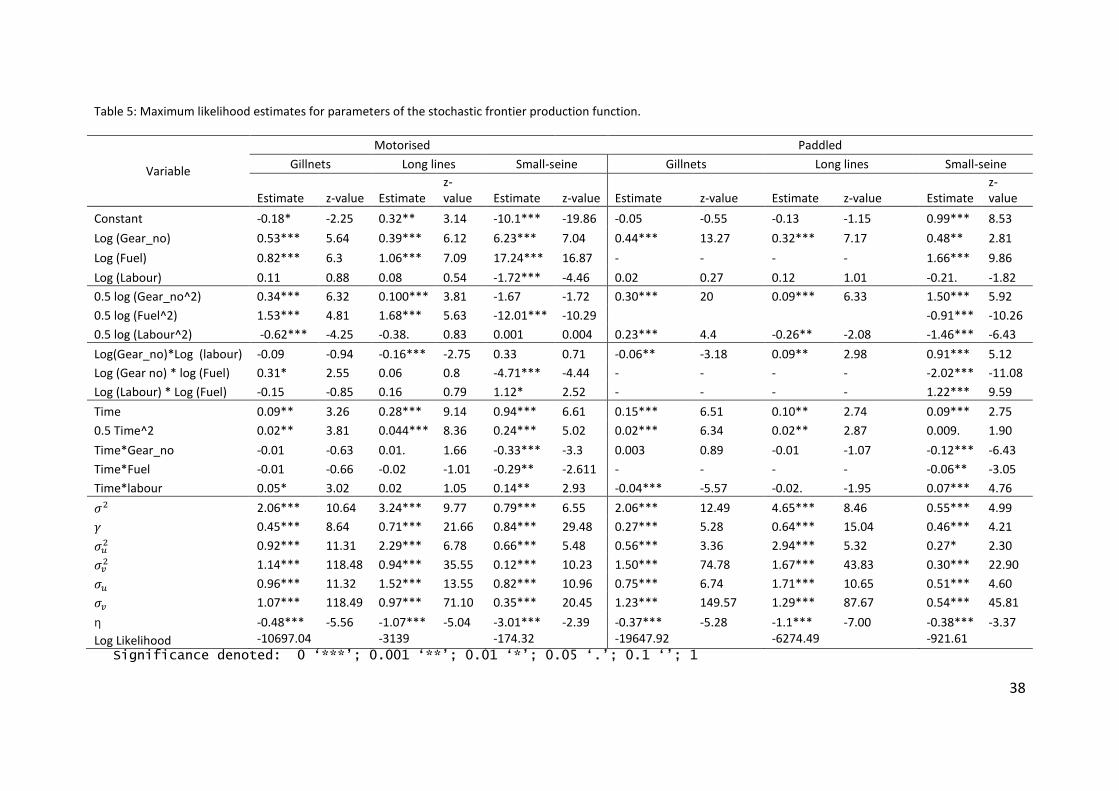
Table 5: Maximum likelihood estimates for parameters of the stochastic frontier
production function. ............................................................................................ 38
Table 6: The rate of technical progress for all vessel groups ........................................... 41
Table 7: Respondent’s perceptions of the status of fish catches ..................................... 45
Table 8: Respondents motive for the choice of fishing site ............................................. 46
Table 9: Challenges as perceived by the fishers based on 273 questionnaires,
albeit not all questions were answered (n= number of respondents). ............... 48
Table10: Respondents’ knowledge about regulations ..................................................... 49
Table11: Respondents’ perception of the existing fisheries regulations ......................... 49
Table12: Suggested management institutions ................................................................. 50

vii
List of acronyms
BMU Beach Management Unit
DEA Data Envelopment Analysis
DFR Directorate Fisheries Resources
EAC East African Community
EAFRRO East Africa Freshwater Fisheries Research Organization
FAO Food and Agriculture Organisation
GN Gillnet
IFMP Implementation of Fisheries Management Plan
KLEMs Capital, Labour, Energy and Materials
LL Long line
LVEMP Lake Victoria Environmental Management Plan
LVFO Lake Victoria Fisheries Organisation
PPF Production Possibility Frontier
RTP Rate of Technical Progress
RTS Returns to Scale
SFA Stochastic Frontier Analysis
SMS Motorised fishing Vessel
SP Paddled fishing vessel
SS Small seine net

8
1. Introduction
1.1 Background
As an economic activity, fishing plays a significant role to many in the developing
countries around the world. In these countries, fishing practices are recognized as artisanal
or small-scale with uses ranging from cultural/social bonding to economic use values. On a
global scale, small-scale fisheries contribute about 50% of the global capture fisheries
estimated at 93.7 million tonnes. Concurrently, fisheries support the livelihoods of about 8-
12% of the global population from which 90% of the people are directly dependent on
capture fisheries work with equal proportions between men and women (Jentoft &
Chuenpagdee, 2015; FAO, 2016); therefore contributing to livelihoods, rural development,
and poverty eradication.
In inland fisheries, generally characterized by small-scale/household-based activities, fish
acts as an important source of animal proteins as two-thirds of the catches are destined for
direct consumption (Welcomme et al., 2010; FAO, 2015). As a traditional and enduring
livelihood in fishing communities, fisheries in developing countries have persevered through
a combination of adaptation and resistance to changing environmental, social, political and
economic conditions (Smith et al., 2017). However, given the challenges in an increasingly
industrial and global world coupled with population growth, these fisheries have undergone
efforts to improve their performance through technological improvement of the fishing fleet
to cope with this trend. In Africa, technological improvements in the fisheries were
introduced by the early colonial governments by replacing the then perceived inefficient and
ancient traditional fishing methods with modern fishing equipment such as new gears like
synthetic gill nets and trawls; and outboard engines to expand access to fishing grounds
(Squires et al., 2003; Kudhongania, and Chitamwebwa, 1995). In addition, technological
development strategies in artisanal fisheries were initiated in the mid-1980s, with assistance
programs directed towards improving the performance in a way of increased output from
the harvesting sector (Squires et al., 2003). Concurrently, the commercial importance of the
fisheries grew with increased markets and infrastructure development resulting in expansion
of fishing effort.
9
Initially, technological improvements in fisheries allow any given quantity of fish to be
caught at lower unit costs thus improving performance (Cunningham et al. 1985). However,
where there is no defined property rights (free entry and exit), this encourages the
persuasive and excessive use of the given technology thus leading to overcapacity and
overcapitalization. If these scenarios are not controlled, extraction rates, in the long run,
exceed fish stock replenishment resulting in a decline in the catch per unit of effort and
diminishing economic rents (Purcell & Pomeroy, 2015).
Studies determining the performance of fishing fleet technology have become of great
importance in small-scale fisheries with the main aim of determining optimal levels of
harvesting the fish resources while considering biological safe limits of fish stocks (Pinello et
al, 2016). The economic objectives of fisheries management include improving the economic
benefits to the participants, appropriate allocation of resources between competing users
and generation of economic benefits to the broader community (Morrison, 2010). However,
achieving these objectives is difficult due to insufficient information on the performance of
the fisheries resource and development under changing technological state of the fleet.
With reference to the Lake Victoria fisheries in Uganda, the study aims at determining the
performance of the fisheries with reference to the existing technology used by the fishing
fleet. Besides, fishers’ insight of their production environment is also sought. In measuring
productive performance, the input-output relationship of the fishing fleet is assessed
through determining the technical efficiency changes and also users are assessed to
determine the nature of their production environment and the possible effect on
productivity.
1.2 Overview of Lake Victoria fisheries
1.2.1 Geography and socio-economy
Lake Victoria is Africa’s largest freshwater lake with a surface area of 68,800 km2 shared
by three countries, Kenya (6%), Tanzania (51%) and Uganda (43%). The lake has a catchment
area of 194,200 km2 extending to countries Rwanda and Burundi with a rapidly growing
population estimated at over 33 million people settled around the lake and up to 70 million
around the lake’s basin directly depending on the ecosystem services like water, hydro-
power generation and food (Downing et al., 2014; Nyamweya, 2017). Fishing on the lake

10
provides employment for about four million people involved both directly and indirectly
(Taabu-Munyaho, 2014) making it important for the livelihoods of millions of East Africans.
In terms of the fisheries resources, historically, the lake was dominanted by cichlid fishes
composed of over 500 species. However, the introduction of the predatory Nile perch in the
1960s led to ecosystem changes with the elimination of about 60% of the >500
haplochromine cichlid species (Witte et al., 1992; Taabu, 2014). Consequently, the lake’s
fishery changed from the indigenous less valued species at the time and is currently
dominated by three species composed of Nile perch, Nile tilapia, and the small pelagic
Rastrineobola argentae (locally referred to as mukene in Uganda, omena in Kenya and dagaa
in Tanzania). Currently, fish catches are estimated to account for about 1% of the global
landings and 8% of the inland capture fisheries landings (FAO, 2016; Nyamweya, 2017).
However, the species composition of the landed catches has varied over time. In the 1980s,
the haplochromine species dominated (> 80%) followed by the Nile perch dominance (>70%)
in 1980 to 1990s which later stabilised to about 250,000 tons in the mid-2000s; and the
expansion of the small pelagic (dagaa/omena/mukene) in the early 1990s which has
dominated the landed catch (> 65%) post the mid-2000s from less than 10% in the early
1970s. A resurgence of the haplochromine species has been observed in the last decade
(Figure 1).
Figure 1. Fisheries production in Lake Victoria by species (Source; Kolding et al., 2013; LVFO, 2016).

11
1.2.2 Fishing effort and technology
It is also important to note that the growing fisheries production is coupled with
increasing fishing effort and changes in fishing technology. The fishing technology involves
the techniques and methods of catching fish (Kirkley & Squires, 1998). In Lake Victoria, these
have undergone dynamic changes with the introduction of outboard engines and use of
more efficient fishing gears such as gillnets long lines and seine nets compared to the
traditional artisanal gears like basket traps and spears (Kudhongania and Chitamwebwa,
1995; Branch et al., 2002). Thus, the fishing technology in the lake is reflected by a
combination of effort indicators which are quite complex, composed of a variety of fishing
vessel types, gears and vessel propulsion (LVFO, 2014).
Statistics indicate that the number of fishers increased from about 40,000 fishers in the
1970s to over 200,000 fishers in 2014 indicating a labour intensive fishery; the number of
fishing vessels also increased from over 40000 vessels to over 70,000 in the same time
period (Kolding et al., 2014; LVFO, 2014). Similarly, statistics from fisheries frame surveys
conducted from 2000 indicate an increase in the number of some of the major gear types.
The number of gillnets increased from 650,000 in 2000 to over one million units in 2014,
long line hooks from three million to over 14 million units and seine nets from 3000 units to
over 18000 units over the same time period. Vessel propulsion, which specifies the nature of
vessel navigation technology, is composed of three main methods; outboard engines,
paddles and sails. There has been a four-fold increase in the number of fishing vessels using
outboard engines from 4180 in 2000 to about 21,600 in 2014, paddled vessels which are the
dominant fishing vessels increased by 30% and sailed vessels by 17% for the same time
period (Table 1). This is indicative of the growing importance of vessel motorisation in the
fishery with time.

12
Table 1: Key fishery effort variables in Lake Victoria (Source; regional frame survey reports 2000-2014)
Variable Year
2000 2002 2004 2006 2008 2010 2012 2014
Change (%)
fishers 129,305 175,890 167,466 196,426 199,242 194,172 205,249 208,270 61
Vessels by the operation mode
Outboard engines 4,108 6,552 9,609 12,765 13,721 16,188 20,217 21,578 425
Paddled 32,032 35,720 33,405 45,753 43,553 39,771 41,392 41,658 30
Sailed 6,304 9,620 8,672 10,310 9,811 8,424 7,871 7,346 17
Total Vessels 42,444 51,892 51,686 68,828 67,085 64,383 69,480 70,582 66
Major gear types
GN 650,592 903,084 1,233,052 1,222,307 1,013,632 867,305 1,032,984 1,637,639 152
LL 3,496,247 8,098,023 6,096,338 9,044,550 11,267,606 11,472,068 13,257,248 14,217,648 307
SS 3,588 7,795 8,601 9,632 10,276 13,514 15,064 18,807 424
1.2.3 Fisheries management
Efforts to manage fisheries on the lake have been going on since the early 20th century
when the fish protection ordinance was enacted (Geheb, 1997) and the first stock
assessment was conducted in the late 1920s by Graham and in 1957 by Beverton (Kolding et
al., 2014). These led to the first fishery regulation, the gillnet minimum mesh size regulation
for the native Tilapia fishery. In 1947, the Lake Victoria Fisheries Services (LVFS) was formed
to enforce fisheries regulations. This was later taken over by the East Africa Freshwater
Fisheries Research Organization (EAFFRO) in 1960, which was disbanded with the dissolution
of the East African Community in 1977. In 1994, the Convention on Lake Victoria
Organisation was signed by the three East African Community Partner States namely Kenya,
Tanzania, and Uganda leading to the current regional Lake Victoria Fisheries Organization
with its headquarters in Jinja Uganda. The management approach with the earlier
institutions (LVFS and EAFFRO) were based on top-down enforcement of fisheries
management measures, with little consultation and participation of fishing communities
(Nunan et al., 2015). Later, the co-management approach was introduced in 2000 based on
the donor-driven need to involve the communities in small-scale fisheries management
which was being promoted all over the world (Jentoft et al., 1998). On Lake Victoria, this was
responding to the growing concern relating the prevalence of illegal fishing practices on the
fisheries resource and the inadequate capacity within the central governments to effectively
manage the lake fisheries (Nunan et al., 2015; Kolding, 2013). Consequently, management of
the Lake Victoria fisheries is undertaken at different levels from the local, national and
regional levels with fishery policies and regulations set at both the regional and national

13
levels. Implementation of these policies and regulations is the core role of the local
community management or Beach Management Units (BMUs) with the help of the national
governments (Nunan et al., 2015).
In Uganda, fisheries management is guided using laws and policies specified in the Fish
protection ordinance of 1950, Uganda’s Fish Act 1970, the fisheries act cap 197 of 2000 and
the National Fisheries policy 2007. From these, the most common regulations enforced by
the department of fisheries through the BMUs include a mesh size regulation for gillnets,
gear ban of gears like cast nets, beach seines and monofilament gill nets, licencing and
vessel/fisher registration.
1.3 The objective of the study
The main objective of the study was to determine the performance of the Lake Victoria
fishing fleet in Uganda. Specifically, the study also determined the;
- Technical efficiency changes of the fishing fleet over time; and
- Fishers’ perceptions of the nature of their production environment.
1.4 The significance of the study
The fisheries resources in Uganda are important to the nation’s socio-economic
development, contributing about 2.5% to the national GDP and 12% to the agricultural GDP.
Fisheries generate foreign exchange and provide livelihoods, income and food security to
about 1.2 million people (UBOS, 2016). In Uganda, Lake Victoria contributes to almost half of
the total fish production (DFR, 2012). Therefore any information towards the development
of the fishery is vital to the fisheries managers.
According to Vision 2040, a development strategy, the Uganda government emphasizes
the need for sustainable utilisation of the natural resources for socio-economic and
environmental benefits (The Republic of Uganda, 2012). The results of the study are
expected to contribute to the sustainable utilisation of the fishery resources in Uganda. The
outcomes may support resource managers, policymakers, fishers and other relevant
stakeholders in the fishery sector in making informed decisions to promote the sustainable
management of fisheries resource in Uganda. Furthermore, the knowledge gained from this
14
study could be applied to other Lake Victoria riparian countries such as Kenya and Tanzania
in addition to other entities within the fisheries sector such as fish factories and aquaculture.
1.5 Research questions
In order to ascertain the performance of the fishing fleet, the technical performance of
the existing fishing fleet and perception from the fleet users, the following research
questions were considered;
i. What are the characteristics of the fishing fleet and how does the fleet differ from each other?
ii. What is the technical efficiency of the fishing fleet and how has it changed over time?
iii. What are the main factors affecting the fleet technical efficiency change and how have they varied over time?
iv. How has the fleet technology changed over time and what is the effect of technical efficiency change?
v. How do the current fisher perceptions relate to the technical efficiency changes of the fishing fleet?
1.6 Structure of the thesis.
The thesis comprises five main chapters summarised as follows.
In chapter one, the study gives an overview of technological changes of the fishing fleet in
developing countries, the method used, objectives, research questions and significance of
the study. In chapter two, a review of the concept of technical efficiency, its application in
fisheries and possible methods; and a brief review of using the importance of fishers’ related
information in the study are given. In chapter three, a detailed account of the
methodological aspects of the study, including the primary and secondary methods of data
collection, the empirical model used to determine technical efficiency for the secondary data
and organization of fisher perception data are discussed. In chapter four, the study results
are given and are organized into two parts; the technical efficiency change of the fishing
fleet and information from fishers about their production environment. The last chapter
gives the discussion of the results, study limitations, recommendations and study
conclusions are highlighted.

15
2 Literature review
2.1 Technical efficiency
2.1.1 Definition and scope
Technical efficiency is defined by Kumbhakar & Lovell (2000) as the ability of a firm to
obtain maximum output from a given set of inputs or to produce an output using the lowest
possible amount of inputs. According to Koopmans (1951) “a producer is technically efficient
if an increase in an output requires a reduction in at least one other output or at least one
input, and if a reduction in any input requires an increase in at least one other input or a
reduction in at least one output”. Therefore, a technically inefficient producer could produce
the same output with less of at least one input or could use the same inputs to produce
more of at least one output. The concept of technical efficiency, its measurement, and the
factors determining it are of crucial importance in production theory of firms in economics
(Fried, Lovell, & Schmidt, 1993). Technical efficiency can be illustrated in form of a simple
production process involving a single input and output (figure 2).
Figure 2: Technical efficiency of a single input-output production; technical efficiency score for an efficient firm is 1 and operates some point (AI) along the frontier OP whereas the technically inefficient firm has a score less than 1 and given as OQ1/OQ or BI/AI ( Fried et al., 1993).
Technical efficiency of a firm and the degree of use of variable inputs determines the
output and capacity utilization of a firm's given technology. It is also worth noting that over
time, for output maximising firms, the level of output a firm is capable of producing will
increase due to technological changes that affect the ability of a firm to combine inputs

16
(Coelli et al., 2005). These technological changes cause the Production Possibility Frontier
(PPF) to shift upwards as more output is obtainable from the same level of inputs. Therefore,
determining the factors affecting it allows stakeholders to take measures to limit or improve
it. Technical efficiency measurement has been applied to a variety of firms ranging from
small to large firms and also in different economic sectors in business, national accounts and
in resource management. In this study, the application is based on fisheries resources.
2.1.2 Technical efficiency in fisheries
The concept of efficiency in fisheries economics was earlier suggested by Schaefer (1954)
and Scott (1955). These studies conveyed the idea of input usage in terms of effort variables
used in fishing and the output variables as either the fish catch or revenue or sometimes
both. In estimating efficiency, the primal production theory used for estimating firm
efficiency is determined using four key determinants; capital, labour, energy and materials
(KLEMs). However, in fisheries production literature, studies have applied composite effort
variables to represent the production function depending on the researcher’s objective
(Morrison et al., 2010). The capital input for example in fisheries is heterogeneous involving
vessel-specific measures such as engine size/power and gear stock, fishing strategies such as
duration of hauls and one can consider representing all or a few of the capital inputs
(Felthoven et al., 2009; Morrison 2010). In doing so, heterogeneity of the capital input is
accounted for, the different variables can also be distinguished and the constrained inputs
can be substituted. Besides, distinguishing the inputs that are constrained like vessel
characteristics can allow for substitutability between the constrained and unconstrained
outputs. This helps determine the degree to which input controls (like boat size and engine
power) in fisheries are likely to be effective and also their effect on the efficiency of fishery
participants (Kompas et al., 2004; Morrison 2010). Another important component is the
ability to determine the effects of fishing technology embodied in the fishing fleet such as
fish finders or fish aggregating devices (Natsir, 2016) whose input in a fishery affects
efficiency; and fishery regulations such as gear limitations and management regimes like
ITQ’s (Morrison, 2010). Similarly, user/fisher variables such as skipper experience can also be
used to determine fleet performance and can be obtained by using proxies such as
education and fishing experience. These are considered as unobservable inputs in the

17
production process which are not expressed in the original production function (Kirkley &
Squires, 1998; Eggert, 2001; Squires et al.,2003; Lokina, 2009 and Morrison, 2010).
In the case of outputs, some fisheries are composed of single species, although majority
have multiple species. Therefore, the production structure specification can also be used in
measuring efficiency to incorporate multiple outputs/species (Madau, Idda, & Pulina, 2009;
Squires,2003; Herero et al, 2006; Färe et al., 2006). This, therefore, enables analysts to
examine the degree of jointness or separability among the species impacting how the
different species should be managed (Morrison, 2010).
Lastly, the production environment also affects fishing as an economic activity. This can
be through random shocks such as movement of fish stocks, seasonal variations in stock
availability or unavoidable weather factors that affect efficiency. Therefore, in the
specification of efficiency models, researchers ought to consider this randomness (Morrison
et al., 2010).
Efficiency studies in fisheries have been used widely in both small scale (see Pinello et al,
2016; Anene et al., 2010 ; Jinadu, 2000; Squires et al., 2003;Pham et al., 2014) and
commercial fisheries (Felthoven, 2000; Madau et al., 2009; Morrison, 2000) to tackle issues
related to fishing capacity and capacity utilisation (Pham et al., 2014; Felthoven, 2000;
Madau et al., 2009; Morrison, 2000) and risk analysis (Herrero, 2004). Since economic
inefficiency of fisheries might be a result of overcapacity, many researchers have focused on
how to measure efficiency with regards to the fishing capacity (Morrison, 2011).
Overcapitalisation in fisheries develops as a result of market imperfection, such as absence
of clear property rights leading to problems including over-investment in fishing boats, gear
and outboard engines, too many fishers/over manning, reduced profit, deterioration of
livelihoods, increasing conflict in the fishery, and political strife in the management process
(Pomeroy, 2012). Modelling and measuring of the fleet efficiency are aimed at enhancing
fisheries’ performance either by reducing fishing inputs due to overcapitalization or as a way
to improve input variables through technological modifications of the fleet such as vessel
size and engine fuel efficiency among others. Cases of these have largely been applied in
developed industrial fisheries in Norway, Iceland, and Italy among others (Curtis & Squires,
2008).

18
Considering fisheries in developing countries, cases of overcapitalization have been
reported in the coastal fisheries of South East Asia where over manning was reported (see
Pomeroy, 2012) and also in Nigeria were artisanal inshore fisheries were more efficient than
the overcapitalized offshore trawl fisheries (FAO/DANIDA, 1998). Most technological
improvements in the fisheries of developing countries are based on subsidies, indicating the
negative implication of subsidies on a fishery in improving the performance of the vessels
(Kirkley & Squires, 1998).
2.1.3 Methods for determining technical efficiency
Various tools have been proposed or developed and applied to determine efficiency in
fisheries and other sectors. These include the parametric Stochastic Frontier Analysis (SFA)
method, the non-parametric Data Envelopment Analysis (DEA) and econometric
transformation models (Fried, Lovell & Schmidt, 1993). In fisheries, most technical efficiency
studies have focussed on SFA and DEA. Comparisons between these methods have been
studied by Herrero (2005) and can be applied based on researchers objectives. The
advantage of DEA over SFA is that it can be used for multi-species fisheries as it considers
multiple inputs and outputs in the analysis whereas SFA is basically applicable to single
species fisheries i.e. multiple input-single outputs. On the other hand, the SFA’s functional
structure can account for and specify vessels technical inefficiency caused by randomness,
vessel characteristics or both. Since fishing is a stochastic activity susceptible to random
shocks such as weather and seasonal stock variations, the study employed the SFA to assess
the technical efficiency of the Lake Victoria fishing fleet.
Unlike the DEA, the SFA model specifications present a natural way of modelling technical
efficiency change for multiple observations over a period of time (Schmidt et al., 1993). Since
the study aims at determining technical efficiency change over time using panel data for the
Lake Victoria fishing fleet, it is therefore more reasonable to use the SFA over the DEA.
2.1.4 Model specification-Stochastic Frontier Analysis
The Stochastic Frontier Analysis (SFA) was first proposed by Meeusen and Van den Broek
(1977) and Aigner, Lovell, and Schmidt (1977). The authors applied the method to cross-
sectional data, specifying one sided-error distribution for inefficiency. Later, the SFA method
was further modified by Greene ( 1980a, 1980b) to include the distributional related ideas;

19
Stevenson 1980 who let the mode of inefficiency to be positive and Jondrow et al., (1982)
who discovered an estimator for the level of inefficiency. Based on Aigner, Lovell, & Schmidt
(1977), the SFA follows a natural estimation method of maximum likelihood method (MLE)
due to the parametric assumptions of the model. The parametric assumptions include the
half-normal model, assuming that the inefficiency components are identically and
independently distributed ( ) half-normal random variables with variance
)) and statistical components are normally distributed with zero
means and variance
)). However, Schmidt and Sickles (1984) noted that
stochastic frontier models that use cross sectional models have three major shortcomings.
First, the consistency of the technical efficiency estimates of a given firm can vary from one
period to another since the variance of distribution is conditional on the whole error term
for each producer does not vanish as the size of the cross section increases. Secondly, the
MLE based on the SFA and separation of the technical inefficiency from statistical noise, both
require a strong distributional assumption that is to say, half-normal for the earlier and
normal distribution for the latter. Finally, the assumption that the non-negative technical
inefficiency error components are not related to the independent variables in the model
could be biased since the firms technical inefficiencies could be correlated with their input
choices. Technical efficiency using the Stochastic Frontier Production function on Lake
Victoria was earlier conducted by Lokina (2009) to determine the technical efficiency of the
fishing fleet for the Nile perch and mukene/dagaa/omena fishers using cross sectional data.
In this study, the function was extended to panel data to determine technical efficiency
changes in the fishing fleet for the same species.
Stochastic frontier production model for panel data
A panel data set has multiple entities, each of which has measurements at different time
periods. Basically, a panel data occurs in the form;
) for , Equation 1
Where is the vessel dimension and is the time dimension.
is the (log) output of vessel at a given time ;
) is a function that indicates functional form (e.g. Cobb-Douglas or translog) of the
production function.

20
is a ) vector of vessels input quantities at time and is a vector of
unknown parameters.
The error term is specified as;
Equation 2
Where, is the statistical noise assumed to be identically and independently distributed
( ) ) and independent of the are the non-negative random variables assumed
to account for technical efficiency (see definition above). The represent those effects
that cannot be controlled by a vessel, considering in fisheries these can occur as weather
conditions and measurement errors.
2.2 Fishers’ perceptions
Aggregate production functions fail to consider policy invariant parameters/effects on
fishers’ choices and behaviour to maximize output based on existing policies and
management institutions (Reimer et al., 2017). Therefore, besides using the production
models to represent performance in fisheries, interviews with fishermen or contingent-
behaviour experiments may provide researchers with valuable supplementary data to help
select and explain models that are robust across the necessary range of institutional
circumstances. Therefore, fishermen behaviour and perceptions towards the nature of their
production environment was also sought with a series of questions involving their thoughts
on the catches, challenges faced and effect of the existing management institutions.
21
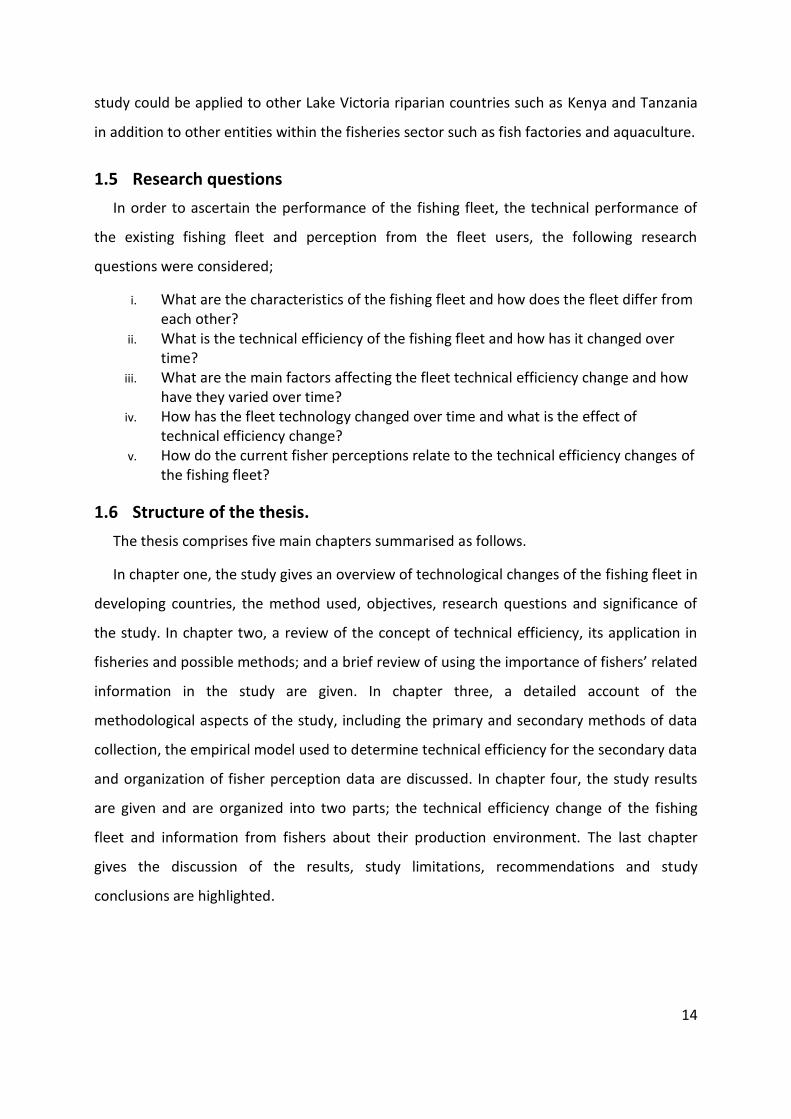
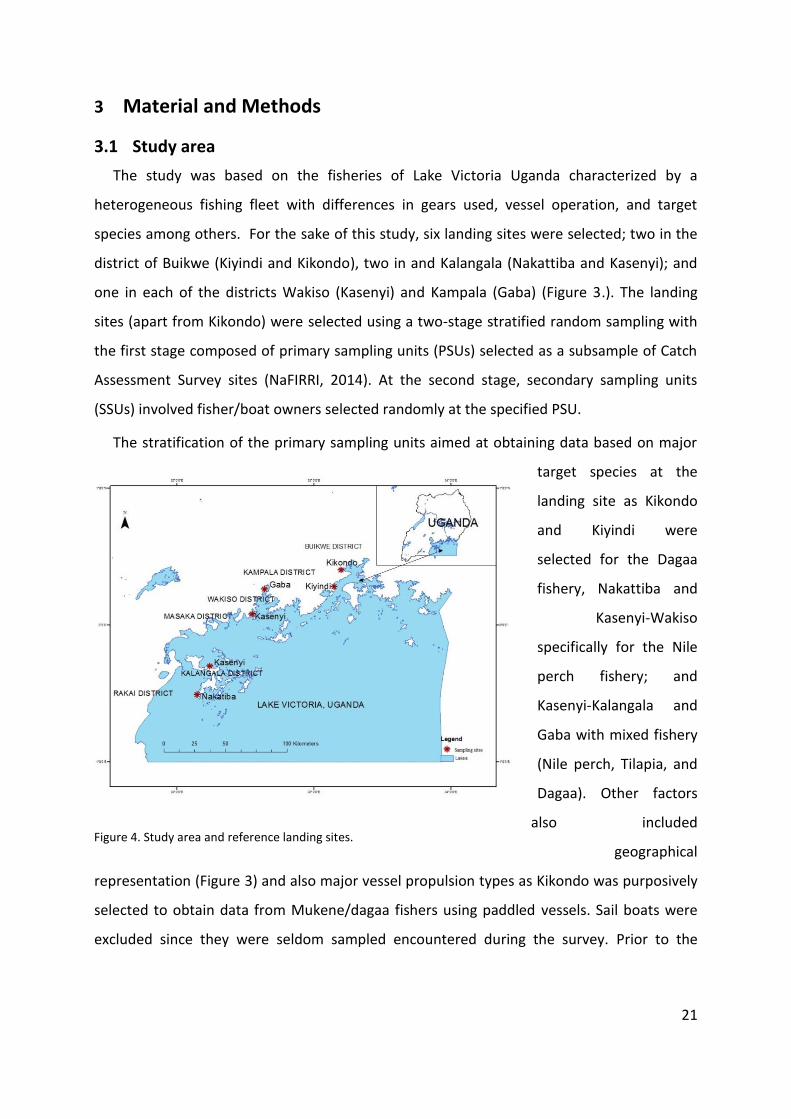
Figure 3: Study area and reference landing sites.
3 Material and Methods
3.1 Study area
The study was based on the fisheries of Lake Victoria Uganda characterized by a
heterogeneous fishing fleet with differences in gears used, vessel operation, and target
species among others. For the sake of this study, six landing sites were selected; two in the
district of Buikwe (Kiyindi and Kikondo), two in and Kalangala (Nakattiba and Kasenyi); and
one in each of the districts Wakiso (Kasenyi) and Kampala (Gaba) (Figure 3.). The landing
sites (apart from Kikondo) were selected using a two-stage stratified random sampling with
the first stage composed of primary sampling units (PSUs) selected as a subsample of Catch
Assessment Survey sites (NaFIRRI, 2014). At the second stage, secondary sampling units
(SSUs) involved fisher/boat owners selected randomly at the specified PSU.
The stratification of the primary sampling units aimed at obtaining data based on major
target species at the
landing site as Kikondo
and Kiyindi were
selected for the Dagaa
fishery, Nakattiba and
Kasenyi-Wakiso
specifically for the Nile
perch fishery; and
Kasenyi-Kalangala and
Gaba with mixed fishery
(Nile perch, Tilapia, and
Dagaa). Other factors
also included
geographical
representation (Figure 3) and also major vessel propulsion types as Kikondo was purposively
selected to obtain data from Mukene/dagaa fishers using paddled vessels. Sail boats were
excluded since they were seldom sampled encountered during the survey. Prior to the
Figure 4. Study area and reference landing sites.

22
survey, selection of the landing sites was guided by frame survey data statistics (NaFIRRI,
2014).
3.2 Data
In order to answer the objectives of the study, data requirements were twofold and are
described to represent technical efficiency data variables and fishers’ perceptions.
3.2.1 Technical efficiency
In order to estimate the technical efficiency of the fishing fleet, eight-year panel data1
(2005-2008; 2010-2011; 2014-2015) on the fishing vessels of five Lake Victoria riparian
districts in Uganda was acquired from the stock assessment unit of National Fisheries
Resources Research Institute (NaFIRRI). The panel structure of the data was organized as a
series of independent cross-section surveys carried out in the given years. The organization
was based on Deaton (1985) and Verbeek (2007) who suggested that individuals sharing
common characteristics can be grouped into cohorts (e.g. vessel propulsion and gear type)
and treated as observations in panel data. One major limitation of using repeated cross-
section observations as panel data is that the same individuals are not always followed over
time as it is with most panels. However, this type of panel data suffers less from problems of
attrition and non-response from individuals and often has a substantially larger number of
observations for both individuals and in time (Verbeek, 2007).
In the existing panel data, the study considered the variable catch as the output variable
and gear numbers, and labour and fuel as the input variables for the SFA model. For the
study, the choice of variables was based on physical capital measures (quantities) other than
economic capital measures (prices) since the estimated function is a production possibilities
frontier. According to Pascoe & Mardle (2003), both physical and economic variables can be
used in the SFA model, however, the use of economic information is advantageous because
it enables one to account for the whole capital stock which is not the case with physical
measurements. It should, however, be noted that the selection of physical units in the
present study is because the data on the physical measures such as gear numbers, number
1 Series of catch assessment surveys conducted with support from the Implementation of Fisheries Management Plan
(IFMP) project during 2005-2008; and Lake Victoria Environmental Management Program (LVEMP1) 2011 and 2014 &
2015 by LVEMP2.

23
of crew and hours fished were readily available in the panel than the economic data. It is
also important to note that fuel (in litres) was not in the panel data however was considered
in the cross sectional survey.
Fuel acts as a key input variable used by vessels especially in getting to their destined
fishing grounds. Therefore, selection of the fuel variable was to characterise vessel
technology by assessing the performance of the vessels using outboard engines dependent
on fuel and those using paddles. Therefore, for purposes of including the fuel variable in the
existing panel data to fit the theoretical model, an independent cross-sectional study was
conducted from six landing sites as specified in the study area. The questionnaire used in the
survey was a modified questionnaire of the Catch Assessment Survey2 to include the fuel use
by motorized vessels, a missing input variable in the panel data.
Based on the empirical estimation of the cross-sectional data, the fuel model was
estimated using a forward stepwise selected model (James et al., 2014) and specified as;
Equation 3
The fuel model was largely related to the fleet location, labour component, amount of
catch and vessel length (Equation 3). The adjusted R square for the model was at 66% (cross-
sectional data statistics in Appendix 1 and fuel model in Appendix 2) thus a reasonably good
model for predicting fuel for the SMS and SP-SS vessel groups.
Summary statistics for the variables used in the stochastic frontier analyses are presented
in Table 2 and in Appendix 3 for the time variation for the different variables.
From the data, six vessel-groups were identified and organized based on vessel
propulsion mode and gear used; initials SMS are used for the motorized vessels and SP for
paddled vessels fishing with either gillnets (GN), long lines (LL) or small seine nets (SS). It is
also noteworthy that the SMS-SS group in the panel was available for only three years (2011,
2014 and 2015) opposed to eight years in the other vessel groups.
The mean values of trip-level data on the number of gears used, fuel quantity in litres and
labour (product of crew number and hours fished) are presented as input variables and catch
2 Catch Assessment surveys are surveys aimed at the fish harvest sector to generate information relating to
both fish catches and fishing effort.
24
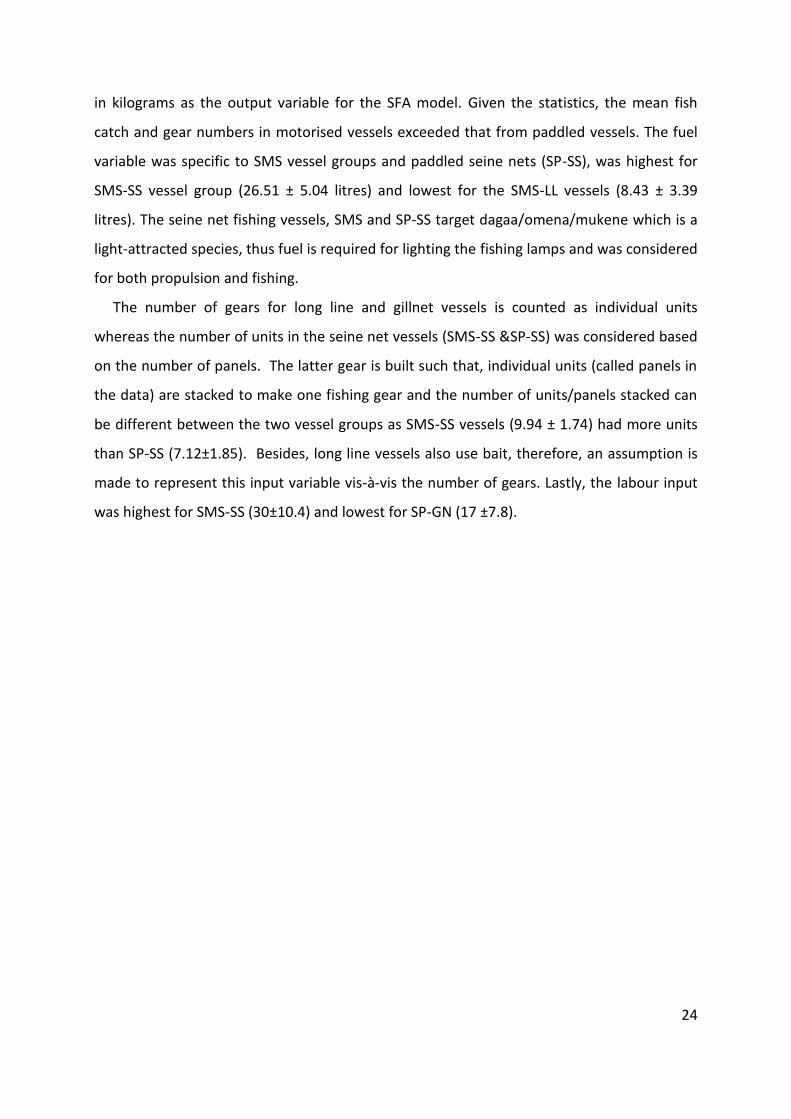
in kilograms as the output variable for the SFA model. Given the statistics, the mean fish
catch and gear numbers in motorised vessels exceeded that from paddled vessels. The fuel
variable was specific to SMS vessel groups and paddled seine nets (SP-SS), was highest for
SMS-SS vessel group (26.51 ± 5.04 litres) and lowest for the SMS-LL vessels (8.43 ± 3.39
litres). The seine net fishing vessels, SMS and SP-SS target dagaa/omena/mukene which is a
light-attracted species, thus fuel is required for lighting the fishing lamps and was considered
for both propulsion and fishing.
The number of gears for long line and gillnet vessels is counted as individual units
whereas the number of units in the seine net vessels (SMS-SS &SP-SS) was considered based
on the number of panels. The latter gear is built such that, individual units (called panels in
the data) are stacked to make one fishing gear and the number of units/panels stacked can
be different between the two vessel groups as SMS-SS vessels (9.94 ± 1.74) had more units
than SP-SS (7.12±1.85). Besides, long line vessels also use bait, therefore, an assumption is
made to represent this input variable vis-à-vis the number of gears. Lastly, the labour input
was highest for SMS-SS (30±10.4) and lowest for SP-GN (17 ±7.8).

25
Table 2: Summary statistics for the SFA model variables for the different vessel groups.
Variable Measure Statistics SMS SP
Total GN LL SS GN LL SS
Fish catch kilograms
Mean 23.81 41.25 283.36 12.02 22.57 190.21 561.2
Std Dev 23.63 48.19 247.85 15.18 24.28 181.24 540.4
Min 0.00 0.00 0.00 0.00 0.00 0.00 0.0
Max 302 540 1820 400 412 1600 5074.0
Gear Number of units
Mean 60.39 776.96 9.94 28,2 369.12 7.12 1223.5
Std Dev 16.76 647.35 1.74 24,13 341.42 1.85 1009.1
Min 1.00 1.00 4.00 1.00 1.00 2.00 10.0
Max 320 12000 14 600 9000 13 21947.0
Fuel Litres
Mean 11.33 8.43 26.51 - - 8.62 53.8
Std Dev 3.05 3.39 5.04 - - 3.83 13.1
Min 4.23 2.2 18.42 - - 4.7 29.6
Max 22.23 27.81 55.01 - - 36.9 127.3
Labour Crew*hours fished
Mean 19.54 22.45 30.45 17.28 18.64 29.54 137.9
Std Dev 5.49 9.84 10.37 7.75 8.17 13.39 47.30
Min 2.00 3.00 8.00 1.00 1.00 4.00 18.00
Max 72.00 108.00 60.00 80.00 80.00 80.00 480.00
Years observed 8 8 3 8 8 8 8
Sample (n) 7149 2217 289 12064 3796 1102 26617
3.2.2 Fisher perceptions
Data were obtained through face-to-face interviews with fishers and boat owners using a
semi-structured questionnaire during the period June-August 2017. The questionnaire aimed
at obtaining fishers perceptions on the fishery and was arranged to capture information on:
i) Respondent information such as fishing experience, age, gender, number of
dependants and their involvement in fishing activities, occupation in fishing activity
(Boat owner or crew), involvement (full-time/part-time), Vessel-gear combination
used as well as the targeted species;
ii) fishery production related questions such as the choice of fishing site, status of
catches and challenges faced in fishing as an economic activity (production
environment)
iii) fisheries management related questions such as knowledge and perception of the
existing regulations, the status of catches for the targeted species, existing
management and regulations, their suggestions for effective management in the
fishery.

26
Questions on fishery production and management were ordered questions following a
categorised (yes/no) and Likert scale to obtain responses on how important or severe the
aspect was to them.
3.3 Data analysis
3.3.1 Technical efficiency
Technical efficiency estimation requires an input-output relationship of a firm. For this
study, the output variable was specified based on two main target species Nile perch and
mukene/dagaa/omena since they were the dominant species during the survey albeit some
vessels targeted other species too. In cases where a vessel was recorded with more than one
target species, output was standardised to represent these two species. This was done using
a formula specified;
∑
………..Equation 4
Where, is the total catch of a particular vessel represented in terms of species say
Nile perch.
represents catch of another species obtained in the same the vessel say tilapia and;
is the price of a kilogram of tilapia and is the price per kilogram for Nile perch of
the vessel.
3.3.2 Empirical model
Estimation of the SFA model requires a particular functional form of the production
function. There is a range of functional forms available for the production frontier. The study
focuses on the two commonly used specifications, the Cobb-Douglas (Equation 5) and the
Translog production function (Equation 6). The Cobb-Douglas is a restricted model that
includes parameters as first-order functional form whereas the translog is a less restrictive
functional form that also includes second-order parameter interactions to provide the
second order approximation (Coelli, 2005). The specifications are indicated as;
Cobb-Douglas functional form;
…………………..Equation 5

27
The translog functional form;
…………………….Equation 6
where the subscripts and refer to the vessel observation at time period .
, is the production frontier intercept common to all producers in the period t
, represents the catch in kilograms for two main species that is Nile perch for the
longline and gillnet vessels; and dagaa for the small seine vessels.
, represents the total number of gears
, represents the quantity of fuel used in litres
, represents the labour used as a product of the number of crew per boat and the
hours fished
, represents a time trend used as a proxy for technical change for a given vessel group
Technical change, in this case, is used to describe the ability of a vessel to produce more
(or less) with a given vector of inputs quantities in the period t in comparison to the levels
feasible in period s (Coelli, 2005).
In equation 6, the study accounted for constant and non-neutral technical change.
However, it is also important to note that technical change is not always constant in
production activities especially in stochastic activities such as fishing. Therefore, a
production function that accounts for increasing or decreasing rates of technological change
as well as biased (input specific) technological change by including a quadratic time trend
and interaction terms between time and input quantities as indicated in Equation 7.
Therefore, the model in Equation 7 can further be specified as;
Equation 7
Production function given in equation 7 does not impose restrictions on the Returns To
Scale (RTS) or the elasticity of scale function ) and the Rate of Technical Change (RTC). In
this regard, the RTS can be estimated from the sum of the marginal elasticity of output with
regard to each input. The elasticity of scale can be estimated from the sum of the marginal
elasticity of output with time regard to each input specified as;

28
) ∑
∑ ………………………Equation 8
The function ) is not only vessel specific, it varies overtime unless the production
function is homogenous of degree one. Therefore, Equation 8 defines elasticity of scale as a
directional elasticity of the production function.
Besides, the Rate of Technical Change (RTC) this is derived as;
∑ Equation 9
Technical progress is neutral if
Where represents the vessel input quantities.
The model contains the term represented as the error term. This is further
decomposed into two components specified as;
= Equation 10
representing the random noise and representing the technical inefficiency
component. Since the aim of the study was to determine vessel technical efficiency for a
given period of time, the study therefore applied a model specification of Battese & Coelli
(1992) to determine the technical inefficiency of a vessel at a given time period t. This
is further specified as;
) ….................Equation 11
Where, )
Where Is an unknown scalar parameter that captures the temporal variation of the
firm’s output-oriented technical efficiency. The parameter are assumed to be
independently and identically distributed as truncations at zero of the variance )
distribution. The level of technical efficiency of a vessel in period is obtained as;
) Equation 12
With the best predictor of the ) obtained by using the conditional expectation
of ) given , ) . In this specification, the exponential function is
given as ) has a value of one when t=T, the random variable can be
considered as the technical inefficient effect of the vessel in the last period of the

29
panel. The nature of a firm’s technical efficiency depends on the sign of the parameter , If
is positive, then the model shows increasing technical efficiency) whereas a negative sign is
indicative of decreasing technical efficiency (Coelli et al., 1998).
The main disadvantage of this specification is that the ordering of the firms according to the
magnitude of the technical inefficiency effects is the same at all periods (Coelli, 2005).
However, in the study, vessels are organized based on an aggregate representation of the
fleet characteristics (vessel propulsion and gear) rather than individual vessels.
The study also employs the parameterisation of Battese et al., (1977) who replace and
with
and
). This helps in decomposing the error
components with significant emphasis on the inefficiency term . The parameter gamma
) must lie between zero and 1. If , it indicates that the deviations from the
frontier are due to entirely random noise ( ) whereas if indicates that the
deviations from the frontier are entirely due to inefficiency effects ( ) in the model.
Prior to the final model specification for the Lake Victoria fishing fleet, different
hypothesis were tested and these included;
i. The structural form of the production function that is the Cobb-Douglas
specification (Equation 5) or the translog specification (Equation 6).
ii. Presence of constant and neutral technical change ( ).
iii. Presence of time-varying assumptions ) of the inefficiency term ( )
These were tested using a generalized likelihood ratio test specified;
) )
Where ) and ) are obtained from the maximized values of the log-
likelihood function under the null hypothesis ( ) and the alternative hypothesis ( ).
Additionally the L,-R statistic has a chi-square distribution with degrees of freedom equal to
the number of restrictions involved in a given test. Prior to the estimation of the models, the
data were normalized such that the mean value of each logged variable was zero following
Coelli et al., (2005). Estimation of the SFA model and prediction of technical efficiencies for
the fishing fleet was then performed using R 3.2.2 software (R Core Team, 2017). In the R,
packages frontier developed by Coelli & Henningsen (2013) and plm, special package for
panel data developed by Croissant & Milo (2008) were used for the analysis.

30
3.3.3 Fisher perceptions
Fisher perceptions determined from the quantitative survey data obtained were analyzed
using non-parametric tests in SPSS (IBM SPSS, 2013). Responses followed a categorical
yes/no and Likert scale type format measuring the level of agreement or disagreement with
the question. Descriptive statistics of the respondent's profile and vessel characteristics
were obtained based on frequencies. To test for significance between variables, Chi-square
tests for independence were conducted to test for dependent relationships between
variables with the level of significance (α) determined at α = 0.05. For the case Likert scale
questions, the five-point Likert type scale questions (from strongly agree, agree, neutral,
disagree and strongly disagree) were collapsed to three (agree, neutral, disagree) for
simplicity in analysis and interpretation. Responses were grouped to represent the main
target species that is dagaa, Nile perch, and tilapia.

31
4 Results
4.1 Respondents profiles and fishery characteristics
A total of 273 respondents from six landing sites of Gaba (25), Kasenyi-Wakiso (36),
Kikondo (47), Kiyindi (82), Nakattiba (45) and Kasenyi-Kalangala (38) were obtained (Table 3).
Of the 273 respondents, 49% engaged in the Nile perch fishery, 48% engaged in the dagaa
fishery while the remaining few engaged in the tilapia fishery. Respondents were
predominantly male (99%), with the few women participants specializing in the dagaa
fishery. Majority engaged in fishing as crew (86%) while others were vessel owners (13%)
and managers (1%) specifically in the Nile perch fishery. Fishing experience in the study was
divided into three groups; involving new entrants with five years’ experience or less (45%),
experienced fishers with six to fifteen years of experience (33%), and very experienced
fishers with more than 15 years of experience (22%). Overall, fishers experience increased
with age (Figure 4). Engagement in fishing activities was considered a full-time activity by the
majority (88%) of the respondents and those who were part-time fishers engaged in other
activities such as farming, fish trade, and small-scale businesses. Half of the respondents
engaged some of their household members in fishing activities, from which 90% engaged
them as fishing crew while 10% engaged them in other related activities such as net
preparation and fish trade. In terms of leadership positions, only 7% of the respondents
interviewed held positions with the local beach management.
Figure 5: The relationship between fishers experience and age.

32
A relatively high number of respondents (74%) operated in motorized vessels than paddled
ones in all fisheries, however, paddled vessels were more common with the dagaa fishery
(n=44) than the Nile perch (n=23). The type of gears used was related to the target species
that is; Nile perch fishers largely used gill nets and long lines whereas dagaa fishers
predominantly used seine nets. Ownership of vessels varied between the two fisheries as
the average number of vessels owned in the Nile perch fishery had a wide variation albeit
relatively higher (6.45 ± 8.8) than for the dgaa fishery (1.41 ± 0.7). In case of other target
species, Nile perch fishers were likely to also target tilapia, lung and catfish; whereas the
dagaa fishers were also likely to target haplochromine species.
Table3: Respondent and fleet characteristics based on the type of fishery- Nile perch, dagaa and tilapia.
Type of fishery.
Variable Description Nile perch Dagaa Tilapia Grand Total
Status of respondent Boat manager 2
2
Boat owner 9 28 2 39
Crew member 123 104 5 232
Gender Men 134 129 7 270
Women 3 3
Education level No education 32 15 - 47
Primary level 79 83 4 166
Secondary level 19 29 2 50
Tertiary level 4 5 1 10
Age Average 32.7 34.4 34.3 33.6
St Dev 8.8 10.2 12 9.6
Involvement in fishing Fulltime 119 116 6 241
Part-time 15 16 1 32
Experience in fishing 1 to 5 years 53 64 3 120
6 to 15 years 51 39 2 92
Above 15 years 30 29 2 61
Number of dependants Average 3.7 4 1.6 3.8
St Dev 4.8 4.7 2.1 4.7
Household help in fishing Yes 65 73 138
No 69 59 7 135
Household activities Fishing crew 62 58
120
Post-fishing 3 11 14
Involvement in management Yes 12 7 1 20
No 122 125 6 253
Vessel operation Motor Engine 111 88 3 202
Paddle 23 44 4 71
Vessels owned per boat owner Average 6.45 1.4 3 2.9
StDev 8.8 0.7 2.8 5.1

33
Type of fishery.
Variable Description Nile perch Dagaa Tilapia Grand Total
Min 1 1 1 1
Max 32 3 5 32
Gear used GN 110 - 7 117
LL 19 -
19
SS 4 129
133
Others 1 3 4
Other target species Haplochromines - 6 - -
Lung and catfish 8 - - -
Dagaa 4 - - -
Tilapia 27 - - -
Synodontis - - 1 -
Landing site Gaba 20 3 2 25
K-Wakiso 35 1
36
Kikondo 4 43
47
Kiyindi 7 75
82
Nakattiba 36 9
45
K-Kalangala 32 1 5 38
Sample N 134 132 7 273
4.2 Technical efficiency
4.2.1 Hypothesis testing
Considering Equation 14, different hypotheses were tested. For a good structural form of
the model, different hypotheses were tested and results indicated in Table 4. In the first
step, the hypothesis was tested to determine a representative structure of the production
function based on the two functions given as the Cobb-Douglas (Equation 5) and translog
production function (Equation 6). For all the vessel groups, the Cobb-Douglas specification
was rejected in favour of the translog specification (Table 4). In general, the translog
production function places no functional constraints on the returns to scale, the elasticity of
substitution and homotheticity thus the input and substitution elasticity is not under
constant returns but rather variable returns to scale (Lundvall and Battese, 2000) for all
vessel groups. Secondly, the hypothesis for technical change was tested for all vessel groups
and two equations were run where represents constant and neutral technical change
(Equation 6) and the (Equation 7) represents non-constant and non-neutral technical
change. The in this case was also rejected in favour of the alternative hypothesis for all

34
vessel groups. Finally, the of time-invariant technical inefficiency was tested, similar to
the above mentioned tests, the two models were also considered with as in Equation 6 to
represent time-invariant technical inefficiency and the formulated as Equation 7 with an
extra parameter Eta ( ) representing the technical inefficiency temporal variation specified
in Equation 11 to represent a model with time variant technical efficiency. The null
hypothesis involving time invariant technical inefficiency was rejected for all vessel groups
indicating that the technical inefficiency component of the vessel groups varied over the
specified time period. For all hypothesis tested, the log-likelihood values indicated in Table 4
for the were significantly maximised (lower negative likelihood) compared to the null
hypothesis ( ) and accepted at 5 percent level of significance or less.

35
Table 4: Statistics for the hypothesis tests of the stochastic frontier production model.
Vessel group Hypothesis Log-Likelihood Chi-square p-value Decision
) )
Cobb-Douglas Vs Translog function
SMS-GN -10860 -10817 84.85 3.5e-16 *** Reject
SP-GN -19910 -19694 430.96 2.2e-16 *** Reject
SMS -SS -299.01 -218.62 161.12 2.2e-16 *** Reject
SP-SS -1084.1 -980.5 207.3 2.2e-16 *** Reject
SMS-LL -3236 -3196 80.12 3.4e-16 *** Reject
SP-LL -6403.7 -6370.4 66.48 2.4e-14 *** Reject
Neutral Vs Non- neutral technical change
SMS-GN -10817 -10716 201.76 2.2e-16 *** Reject
SP-GN -19687. -19694 14.43 5.8e-16 *** Reject
SMS-SS -218.45 -214.62 7.66 0.018* Reject
SP-SS -980.5 -924.7 111.52 2.2e-16 ***
Reject
SMS-LL -3196.0 -3178.5 35.01 1.49e-16 *** Reject
SP-LL -6370.4 -6309.0 122.79 2.2e-16 *** Reject
Time-variant Vs. time invariant technical efficiency
SMS-GN -10817 -10697 240 2.2e-16 *** Reject
SP-GN -19694 -19648 92.63 2.2e-16 *** Reject
SMS-SS -218.45 -174.33 88.25 2.2e-16 *** Reject
SP-SS -980.5 921.6 117.8 2.2e-16 *** Reject
SMS-LL -3196.0 -3139.71 112.5 2.2e-16 *** Reject
SP-LL -6370.4 -6274.5 191.87 2.2e-16 *** Reject

36
4.2.2 Output elasticity
Table 5 demonstrates the estimates obtained from the SFA model described by the
translog production function specified in Equation 7. From this, we observe the output
elasticity of vessel input variables, the nature of technical change and technical efficiency
given parameters and η.
The first aspect of the SFA model deals with the output elasticity for the different vessel
groups. In production economics, determination of elasticity is necessary for the estimation
of responsiveness of yield (in this case fish catch) based on the given inputs (Coelli et al.,
2005). Output elasticity from the translog SFA model can be represented by the first order
coefficients given that input variables are mean-scaled (Henningsen, 2014; Pascoe &
Mardle, 2003). Subsequently, based on the SFA model (Table 4), output elasticity for the
number of gear and fuel3 inputs were statistically significant with the expected signs
(positive) for all vessel groups; however, the output elasticity for the labour input was
negative for the SMS & SP-SS vessel groups and not different from zero for other vessel
groups. On that note, the estimated first-order coefficients of the inputs (Table 4) may not
be particularly meaningful in explaining vessel inputs (gear numbers, fuel and labour)
responsiveness to the fish catch. Therefore, the study considered estimating output
elasticity derived from Equation 8. Results are presented in Table 6, and Figure 5 which
depicts a graphical representation of the different output elasticity for the different input
variables for the given time period. The output elasticity for each vessel input varied among
the different vessel groups although labour indicated the most outstanding variation. The
responsiveness of labour to fish catch increased by seven-fold for the SMS-LL and by 1.3
times for the SMS-GN between 2005 and 2015 while indicating a decline for the other
vessel groups with the most drastic decline for the SMS-SS by 2.3 times from 2011 to 2015
and by 1.9 times for the SP-GN vessel group.
The elasticity of the number of gear units increased for the SMS-LL from 22% in 2005 to
2015. Other vessel groups such as the SP-GN and SP-LL experienced a gradual increase
from 2005 to 2011 followed by a gradual decline from 2011 to 2015; and gradual decline by
the SP-SS vessel group (Figure 5). Lastly, the fuel variable common to the SMS and SP-SS
3 For vessels using fuel to fish

37
vessel groups indicated the highest responsiveness to output relative to other variables.
The elasticity of the fuel variable, however, indicated a declining trend for the vessel
groups apart from the SP-SS whose elasticity was relatively constant over the study period.
Slow declining fuel elasticity was recorded for the SMS-GN, drastic decline for the SMS-LL
and SMS-SS vessel groups from 2011 to 2015 preceding a period of constant returns from
2005 to 2008 for the SMS-LL.
Figure 6: Change in output elasticity of the input variables for the different vessel groups over time; SMS-Motorised and SP-Paddled vessels using LL-long lines, GN-gillnets and SS-small seines; vertical scale
based on target species as LL & GN target Nile perch while SS target Dagaa/Omena/Mukene.
38
Table 5: Maximum likelihood estimates for parameters of the stochastic frontier production function.
Variable
Motorised Paddled
Gillnets Long lines Small-seine Gillnets Long lines Small-seine
Estimate z-value Estimate z-value Estimate z-value Estimate z-value Estimate z-value Estimate
z-value
Constant -0.18* -2.25 0.32** 3.14 -10.1*** -19.86 -0.05 -0.55 -0.13 -1.15 0.99*** 8.53
Log (Gear_no) 0.53*** 5.64 0.39*** 6.12 6.23*** 7.04 0.44*** 13.27 0.32*** 7.17 0.48** 2.81
Log (Fuel) 0.82*** 6.3 1.06*** 7.09 17.24*** 16.87 - - - - 1.66*** 9.86
Log (Labour) 0.11 0.88 0.08 0.54 -1.72*** -4.46 0.02 0.27 0.12 1.01 -0.21. -1.82
0.5 log (Gear_no^2) 0.34*** 6.32 0.100*** 3.81 -1.67 -1.72 0.30*** 20 0.09*** 6.33 1.50*** 5.92
0.5 log (Fuel^2) 1.53*** 4.81 1.68*** 5.63 -12.01*** -10.29 -0.91*** -10.26
0.5 log (Labour^2) -0.62*** -4.25 -0.38. 0.83 0.001 0.004 0.23*** 4.4 -0.26** -2.08 -1.46*** -6.43
Log(Gear_no)*Log (labour) -0.09 -0.94 -0.16*** -2.75 0.33 0.71 -0.06** -3.18 0.09** 2.98 0.91*** 5.12
Log (Gear no) * log (Fuel) 0.31* 2.55 0.06 0.8 -4.71*** -4.44 - - - - -2.02*** -11.08
Log (Labour) * Log (Fuel) -0.15 -0.85 0.16 0.79 1.12* 2.52 - - - - 1.22*** 9.59
Time 0.09** 3.26 0.28*** 9.14 0.94*** 6.61 0.15*** 6.51 0.10** 2.74 0.09*** 2.75
0.5 Time^2 0.02** 3.81 0.044*** 8.36 0.24*** 5.02 0.02*** 6.34 0.02** 2.87 0.009. 1.90
Time*Gear_no -0.01 -0.63 0.01. 1.66 -0.33*** -3.3 0.003 0.89 -0.01 -1.07 -0.12*** -6.43
Time*Fuel -0.01 -0.66 -0.02 -1.01 -0.29** -2.611 - - - - -0.06** -3.05
Time*labour 0.05* 3.02 0.02 1.05 0.14** 2.93 -0.04*** -5.57 -0.02. -1.95 0.07*** 4.76
2.06*** 10.64 3.24*** 9.77 0.79*** 6.55 2.06*** 12.49 4.65*** 8.46 0.55*** 4.99
0.45*** 8.64 0.71*** 21.66 0.84*** 29.48 0.27*** 5.28 0.64*** 15.04 0.46*** 4.21
0.92*** 11.31 2.29*** 6.78 0.66*** 5.48 0.56*** 3.36 2.94*** 5.32 0.27* 2.30
1.14*** 118.48 0.94*** 35.55 0.12*** 10.23 1.50*** 74.78 1.67*** 43.83 0.30*** 22.90
0.96*** 11.32 1.52*** 13.55 0.82*** 10.96 0.75*** 6.74 1.71*** 10.65 0.51*** 4.60
1.07*** 118.49 0.97*** 71.10 0.35*** 20.45 1.23*** 149.57 1.29*** 87.67 0.54*** 45.81
η -0.48*** -5.56 -1.07*** -5.04 -3.01*** -2.39 -0.37*** -5.28 -1.1*** -7.00 -0.38*** -3.37
Log Likelihood -10697.04 -3139 -174.32 -19647.92 -6274.49 -921.61
Significance denoted: 0 ‘***’; 0.001 ‘**’; 0.01 ‘*’; 0.05 ‘.’; 0.1 ‘’; 1

39
4.2.3 Returns to scale
The returns to scale values were obtained from the aggregate value of the output
elasticity of the vessel inputs derived from Equation 8. Results for the returns to scale for
the study vessel groups are and shown graphically in Figure 6. In general, the seine net
vessel groups (SMS & SP-SS) accrued the highest returns compared to other vessel groups
(values in Appendix 5). Based on the comparison between vessel propulsion with respect to
the gears used, it is observed that the motorised (SMS) vessel groups accrued higher
returns to scale values than their paddled (SP) counterparts. Increasing returns (>1) were
specific to the SMS and SP-SS vessel groups while decreasing returns were indicated by the
SP-GN and SP-SS vessel groups throughout the study period. However, it is also observed
that the returns to scale for all vessel groups declined over time irrespective of their vessel
operation and gear used.
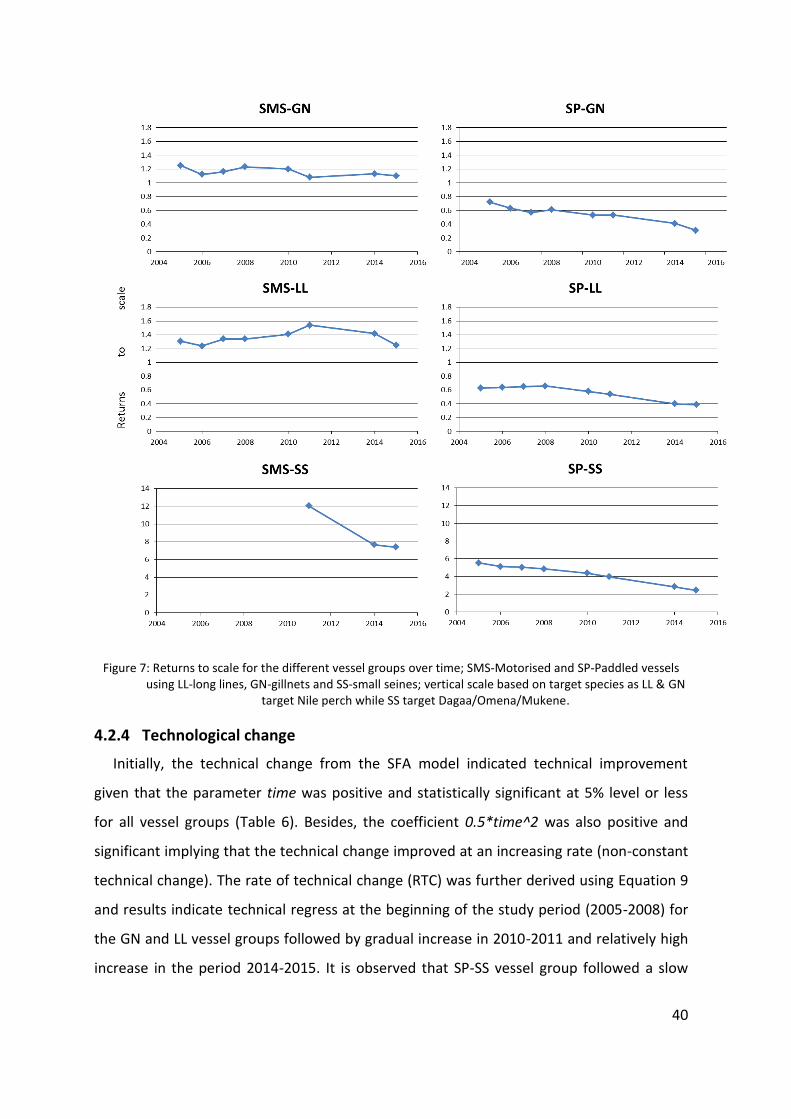
40
Figure 7: Returns to scale for the different vessel groups over time; SMS-Motorised and SP-Paddled vessels using LL-long lines, GN-gillnets and SS-small seines; vertical scale based on target species as LL & GN
target Nile perch while SS target Dagaa/Omena/Mukene.
4.2.4 Technological change
Initially, the technical change from the SFA model indicated technical improvement
given that the parameter time was positive and statistically significant at 5% level or less
for all vessel groups (Table 6). Besides, the coefficient 0.5*time^2 was also positive and
significant implying that the technical change improved at an increasing rate (non-constant
technical change). The rate of technical change (RTC) was further derived using Equation 9
and results indicate technical regress at the beginning of the study period (2005-2008) for
the GN and LL vessel groups followed by gradual increase in 2010-2011 and relatively high
increase in the period 2014-2015. It is observed that SP-SS vessel group followed a slow

41
gradual increase in RTC while the SMS-SS vessel group which is also the most recent vessel
group in the study observed the highest rate of technical change (progress) in the study
(Table 6). The SMS-SS vessel group indicated technical regress at the beginning of vessel
operation in 2011 (-0.31) followed by a two-fold increase in technical improvement in 2014
and further improvement in 2015. Additionally, slow rates of change occurred for the SMS-
GN and SP-LL vessel groups with only 10% in 2015.
Table 6: The rate of technical progress for all vessel groups
Vessel group RTP
2005 2006 2007 2008 2010 2011 2014 2015
SMS-GN -0.09 -0.07 -0.05 -0.03 0.01 0.02 0.08 0.10
SMS-LL -0.17 -0.12 -0.08 -0.03 0.06 0.10 0.24 0.28
SMS-SS
-0.32 0.37 0.61
SP-GN -0.07 -0.04 -0.02 0.00 0.05 0.07 0.13 0.16
SP-LL -0.06 -0.05 -0.03 -0.02 0.01 0.03 0.09 0.10
SP-SS 0.02 0.03 0.03 0.05 0.09 0.09 0.14 0.14
4.2.5 Technical efficiency
Similar to the technical change, technical efficiency (TE) results were estimated using
the residuals of the first step estimation of the SFA model with parameters
associated with the distribution of TE; and parameter η for the temporal variation of
technical efficiency (Table 4). Parameters u and v are the decomposed error terms of the
SFA model indicated as σu and σv representing the technical inefficiency of the fishing
vessels and random noise respectively. From Table 4, it is observed that the error due to
vessel specific technical inefficiency was greater than random noise component for
the SMS-LL, SMS-SS and SP-SS. On the other hand, was greater than the for the SMS-
GN, SP-GN and SP-SS vessel groups. Nevertheless, the technical inefficiency term σU for all
vessel groups was significant values and also the parameter η. Thus, the time variant
technical efficiency values were further derived using Equation 11 for all vessel groups (see
Appendix 5 and Figure 8). Comparison between vessel propulsion (SMS & SP) with respect
to gear types showed minimal variation in the technical efficiency estimates (Figure 7). At
the beginning of the study period, each vessel group4 irrespective of propulsion and gear
type operated at efficient points along the production frontier (recall Figure 1) with TE
4 Recall SMS-SS is observed from 2011

42
estimates ranging from 0.97 and 0.96 for the SP-GN and SMS-GN vessel groups to 1 for the
other vessel groups. Both GN and SP-SS vessel groups indicated a gradual decline in vessel
technical efficiency throughout the study period whereas the vessels in the SMS-LL and SP-
LL vessel groups indicated relatively stable efficiency estimates for the period 2005-2008,
followed by a gradual decline in 2010-2011 and a more drastic decline in the years 2014-
2015. This was also similar with vessels in the SMS-SS vessel group that operated with
relatively stable technical efficiency in 2011 and 2014, followed by a drastic decline in
2015. Decline in vessel group technical efficiency over time is associated with the negative
value of η in the SFA model (Table 4) indicating a shift towards technically inefficient points
of the production frontier.

43
Figure 8: Technical efficiency change of the vessel fleet over time; SMS-Motorised and SP-paddled vessels using GN-gillnets, LL-long lines and SS-small-seine
Figure 8, further indicates the annual technical efficiency distribution for long line
vessels groups. To recall, the technical inefficient component in these vessel groups is
greater than the random noise component . Thus, for both the SMS-LL (Figure 8a) and
SP-LL (Figure 8b) vessel groups, it is evident that most vessels operated at >0.95 technical
efficiently in the years 2005-2008 with low variation in TE estimates for both vessel groups,
followed by a slight decline in technically efficient vessels in 2010-2011 and a drastic
decline in the technically efficient of vessels with great variability in the TE estimates
ranging from 0 - 0.80 in 2015 for the SMS-LL and 0 - 0.70 for the SP-LL.

44
Figure 9: Changes in technical efficiency for the period 2005-2008; 2010-2011; 2014-2015 for vessel group A-SMS-LL and B-SP-LL

45
4.3 Fishers’ perceptions
4.3.1 Perception of fish catches
Respondents rated the catches of Nile perch as the worst with a mean response of
2.83 ± 0.5, followed by tilapia 2.35 ± 0.7. The dagaa catches, on the other hand, were
rated as rather stable following a mean response rate of 2.01 ± 0.8 (Table 7). Rating of
the dagaa catches was significantly related to vessel propulsion (ꭓ2 (2) = 18.16, p< 0.05)
as paddled vessels fishers were more likely to rate the catches as better off (49%) than
their motorised counterparts (25%) (Figure 9). Respondents’ perception on the catches
was however not significantly related to other fisher/vessel characteristics.
Table 7: Respondent’s perceptions of the status of fish catches
Target species
Rating Nile perch Dagaa Tilapia Other species
Better off 8 51 8 3
Constant 8 43 19 2
Worse off 125 53 27 5
Mean 2.83 2.01 2.35 2.2
StDev 0.5 0.8 0.7 0.9
Min 1 1 1 1
Max 3 3 3 3
Sample size 141 147 57 10
Rating based on a scale; 1- Better off, 2- Constant off, 3- Worse off.
Some respondents answered for multiple species based their perceived knowledge in fishing thus the total sample size is greater than 273.
Figure 10: Perception of dagaa catches between respondents using motorised and paddled vessels.
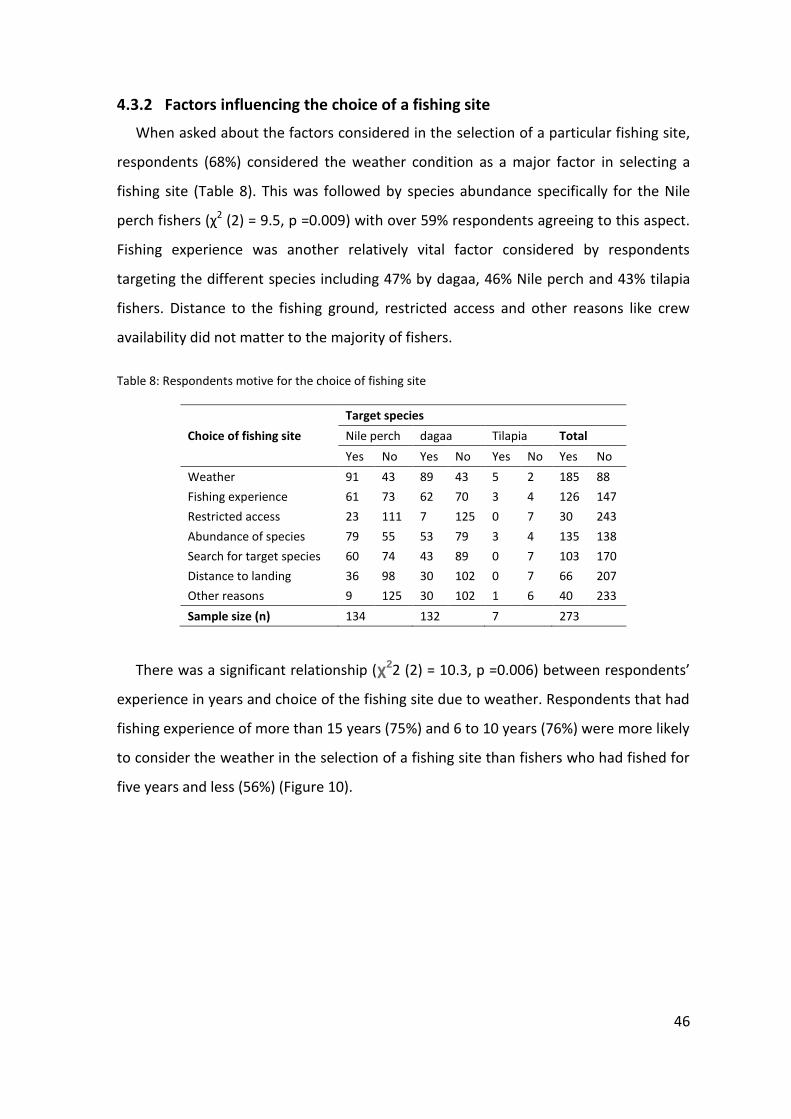
46
4.3.2 Factors influencing the choice of a fishing site
When asked about the factors considered in the selection of a particular fishing site,
respondents (68%) considered the weather condition as a major factor in selecting a
fishing site (Table 8). This was followed by species abundance specifically for the Nile
perch fishers (χ2 (2) = 9.5, p =0.009) with over 59% respondents agreeing to this aspect.
Fishing experience was another relatively vital factor considered by respondents
targeting the different species including 47% by dagaa, 46% Nile perch and 43% tilapia
fishers. Distance to the fishing ground, restricted access and other reasons like crew
availability did not matter to the majority of fishers.
Table 8: Respondents motive for the choice of fishing site
Choice of fishing site
Target species
Nile perch dagaa Tilapia Total
Yes No Yes No Yes No Yes No
Weather 91 43 89 43 5 2 185 88
Fishing experience 61 73 62 70 3 4 126 147
Restricted access 23 111 7 125 0 7 30 243
Abundance of species 79 55 53 79 3 4 135 138
Search for target species 60 74 43 89 0 7 103 170
Distance to landing 36 98 30 102 0 7 66 207
Other reasons 9 125 30 102 1 6 40 233
Sample size (n) 134 132 7 273
There was a significant relationship (χ22 (2) = 10.3, p =0.006) between respondents’
experience in years and choice of the fishing site due to weather. Respondents that had
fishing experience of more than 15 years (75%) and 6 to 10 years (76%) were more likely
to consider the weather in the selection of a fishing site than fishers who had fished for
five years and less (56%) (Figure 10).
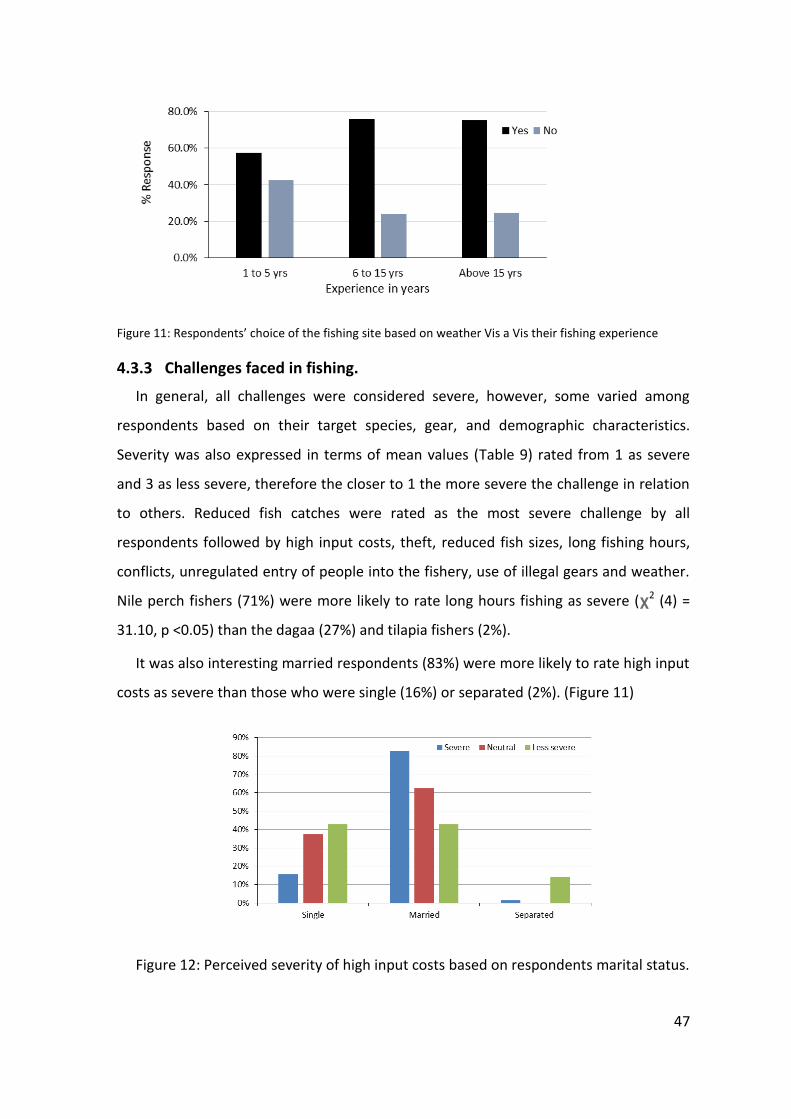
47
Figure 11: Respondents’ choice of the fishing site based on weather Vis a Vis their fishing experience
4.3.3 Challenges faced in fishing.
In general, all challenges were considered severe, however, some varied among
respondents based on their target species, gear, and demographic characteristics.
Severity was also expressed in terms of mean values (Table 9) rated from 1 as severe
and 3 as less severe, therefore the closer to 1 the more severe the challenge in relation
to others. Reduced fish catches were rated as the most severe challenge by all
respondents followed by high input costs, theft, reduced fish sizes, long fishing hours,
conflicts, unregulated entry of people into the fishery, use of illegal gears and weather.
Nile perch fishers (71%) were more likely to rate long hours fishing as severe (χ2 (4) =
31.10, p <0.05) than the dagaa (27%) and tilapia fishers (2%).
It was also interesting married respondents (83%) were more likely to rate high input
costs as severe than those who were single (16%) or separated (2%). (Figure 11)
Figure 12: Perceived severity of high input costs based on respondents marital status.

48
Table 9: Challenges as perceived by the fishers based on 273 questionnaires, albeit not all questions were answered (n= number of respondents).
Target species
Rate Conflicts
Unregulated entry
Reducing catch
High costs
Illegal gears
Reducing sizes
Long fishing hours
Bad weather
Theft
Nile perch
Severe
107 69 107 95 68 84 88 39 35
Neutral
5 25 4 7 23 17 6 23 4
Less severe
12 18 4 4 16 7 5 22 2
Dagaa Severe
82 67 88 87 47 61 34 47 32
Neutral
6 32 10 8 25 13 23 17 1
Less severe
22 10 2 3 14 4 4 6 4
Tilapia Severe
4 2 5 3 4 6 2 2 3
Neutral
1 2 0 1 1 0 0 1 0
Less severe
2 2 0 0 1 0 1 1 1
Mean 1.35 1.52 1.12 1.14 1.56 1.27 1.3 1.63 1.23
StDev 0.73 0.72 0.4 0.44 0.75 0.56 0.56 0.78 0.59
Min 1 1 1 1 1 1 1 1 1
Max 3 3 3 3 3 3 3 3 3
n 241 227 220 208 199 192 163 158 82
Rating based on a scale; 1- Severe, 2- Neutral, 3- Less severe
4.3.4 Knowledge about fishery regulations
More respondents were familiar with regulations concerning mesh size (mean
1.1±0.42), illegal gear (1.13±0.5) and boat registration/licensing (1.23±0.61) than closed
fishing seasons (2.25±0.76) and closed fishing areas (2.29 ± 0.89) (Table 10). Responses
on mesh size regulation, illegal gear ban and boat registration were comparable among
respondents of different target species. However, responses varied for closed fishing
seasons and areas as respondents who targeted Nile perch (n=11) and tilapia (n = 1)
were less likely (p<0.04) to know about closed fishing seasons than those targeting
dagaa (n =25).

49
Table10: Respondents’ knowledge about regulations
Knowledge of regulations
Species response Mesh size Illegal gear Closed seasons Closed areas Boat registration
Nile perch
Yes 121 122 11 27 94
Not sure 1 2 19 18 6
No 6 5 85 69 13
Dagaa
Yes 104 96 25 35 85
Not sure 1 0 16 9 2
No 5 10 63 52 5
Tilapia
Yes 7 7 1 1 3
Not sure 0 0 0 0 0
No 0 0 5 5 2
Overall
Yes 232 225 37 63 182
Not sure 2 2 35 27 8
No 11 15 153 126 20
N 245 242 225 216 210
Mean 1.1 1.13 2.52 2.29 1.23
StDev 0.42 0.5 0.76 0.89 0.61
Min 1 1 1 1 1
Max 3 3 3 3 3
Better off- 1; Neutral-2; Worse off-3
Knowledge of a particular regulation was likely to influence respondent’s perception
of the effectiveness of that particular regulation. There were significant relationships
between knowledge of mesh size regulation (χ2 (4) = 14.6, p =0.006), boat registration
(χ2 (4) = 22.5, p < 0.000) and closed seasons (χ2 (4) = 20.7, p <0.000) with respondent
perception on effectiveness of the respective regulation. With the exception of closed
fishing seasons, all the stated regulations were perceived to ensure effectiveness that is,
mesh size (1.04 ± 0.25), illegal gear (1.04 ± 0.25), boat registration and closed areas
(1.6 ± 0.84). Most respondents (n = 147) irrespective of target species did not agree
with closed fishing seasons as an effective regulation (2.38 ± 0.88) in ensuring fisheries
management (Table 11).
Table11: Respondents’ perception of the existing fisheries regulations
Perception of the effectiveness of regulation
Species response Mesh size
regulation
Illegal gear
ban
Closed
fishing seasons
Closed
fishing areas
Boat
registration.
Nile perch Agree 128 114 27 71 97
Neutral 1 8 11 14 4

50
Perception of the effectiveness of regulation
Species response Mesh size
regulation
Illegal gear
ban
Closed
fishing seasons
Closed
fishing areas
Boat
registration.
Disagree 0 3 75 32 11
Dagaa Agree 103 92 32 71 91
Neutral 3 12 9 16 1
Disagree 3 6 68 19 4
Tilapia Agree 7 7 1 3 4
Neutral 0 0 1 1 2
Disagree 1 0 4 2 0
Overall Agree 238 213 60 145 192
Neutral 4 20 21 31 7
Disagree 3 9 147 53 15
N 245 242 228 229 214
Mean 1.04 1.16 2.38 1.6 1.17
StDev 0.25 0.46 0.88 0.84 0.53
Min 1 1 1 1 1
Max 3 3 3 3 3
Based on Likert scale Agree =1, Neutral=2 Disagree=3.
4.3.5 Suggested management institutions
Based on the 250 respondents who stated their suggested management, 42%
recommended fishers, 38% local beach management (BMU), 30% central government
and only 8% suggested local government (Table 12). Respondents’ suggestions on
fishers and local beach management varied depending on their target species. Dagaa
fishers were more likely to suggest the local beach management (n= 56), whereas the
tilapia (n= 4) and Nile perch (n= 62) respondents suggested fishers as their preferred
management institution. The response towards central government and local
government was quite comparable among the respondents as these were the least
preferred management institutions. Management suggestions also varied based on the
type of gear used (χ2 (3) = 16.6, p = 0.001) as respondents using long lines (61%) were
more likely to prefer local beach management than gillnet fishers (52%) who were more
likely to suggest fishers. Seine net fishers were divided between the two institutions.
Table12: Suggested management institutions
Suggested management.

51
Species Response Fishers BMU Local Gov. Central Gov.
Nile perch Yes 62 37 12 40
No 62 87 112 84
Silver fish Yes 39 56 8 33
No 80 63 111 86
Tilapia Yes 4 1 0 3
No 3 6 7 4
Overall Yes 105 94 20 76
No 145 156 230 174
Sample n 250 250 250 250
There were also variations based on landing site as local beach management
institutions were preferred for 58% of respondents in Kikondo and almost half the
respondents at Kasenyi-Wakiso whereas fisher-based institution was preferred by 64%
respondents at Gaba and Nakattiba (Figure 12).
Figure 13: Respondents support for BMU and fishers as their suggested management
institution according to landing site.
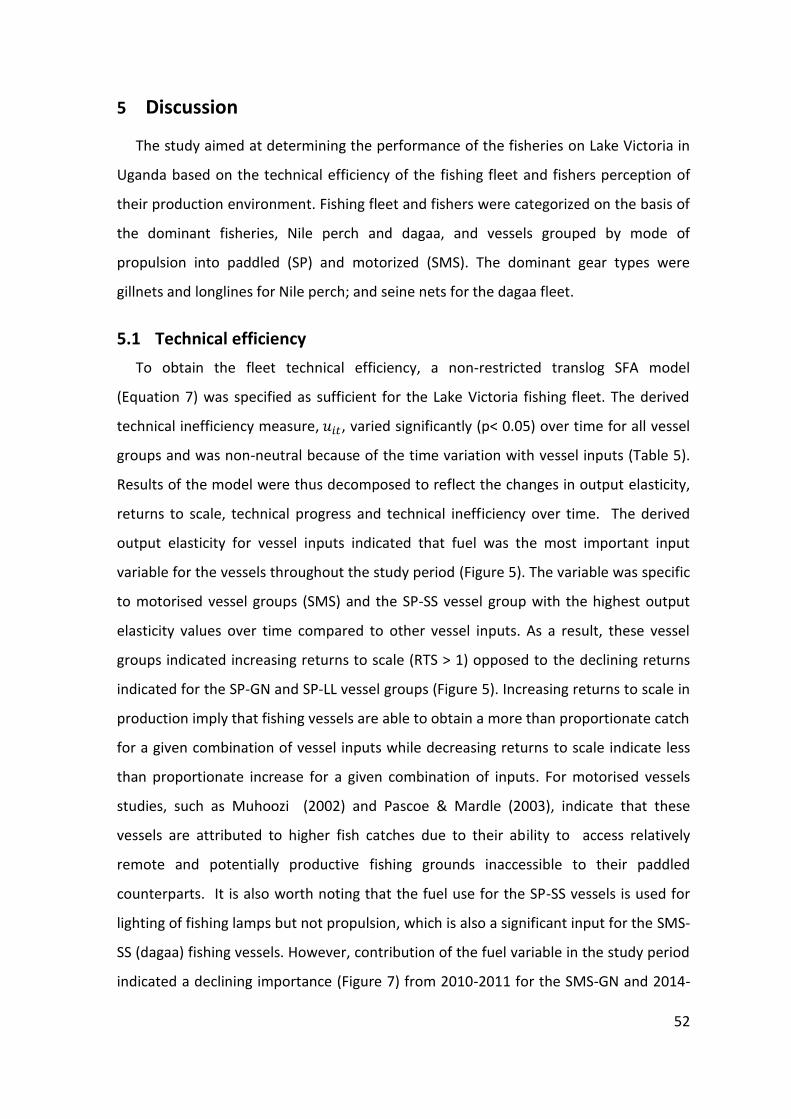
52
5 Discussion
The study aimed at determining the performance of the fisheries on Lake Victoria in
Uganda based on the technical efficiency of the fishing fleet and fishers perception of
their production environment. Fishing fleet and fishers were categorized on the basis of
the dominant fisheries, Nile perch and dagaa, and vessels grouped by mode of
propulsion into paddled (SP) and motorized (SMS). The dominant gear types were
gillnets and longlines for Nile perch; and seine nets for the dagaa fleet.
5.1 Technical efficiency
To obtain the fleet technical efficiency, a non-restricted translog SFA model
(Equation 7) was specified as sufficient for the Lake Victoria fishing fleet. The derived
technical inefficiency measure, , varied significantly (p< 0.05) over time for all vessel
groups and was non-neutral because of the time variation with vessel inputs (Table 5).
Results of the model were thus decomposed to reflect the changes in output elasticity,
returns to scale, technical progress and technical inefficiency over time. The derived
output elasticity for vessel inputs indicated that fuel was the most important input
variable for the vessels throughout the study period (Figure 5). The variable was specific
to motorised vessel groups (SMS) and the SP-SS vessel group with the highest output
elasticity values over time compared to other vessel inputs. As a result, these vessel
groups indicated increasing returns to scale (RTS > 1) opposed to the declining returns
indicated for the SP-GN and SP-LL vessel groups (Figure 5). Increasing returns to scale in
production imply that fishing vessels are able to obtain a more than proportionate catch
for a given combination of vessel inputs while decreasing returns to scale indicate less
than proportionate increase for a given combination of inputs. For motorised vessels
studies, such as Muhoozi (2002) and Pascoe & Mardle (2003), indicate that these
vessels are attributed to higher fish catches due to their ability to access relatively
remote and potentially productive fishing grounds inaccessible to their paddled
counterparts. It is also worth noting that the fuel use for the SP-SS vessels is used for
lighting of fishing lamps but not propulsion, which is also a significant input for the SMS-
SS (dagaa) fishing vessels. However, contribution of the fuel variable in the study period
indicated a declining importance (Figure 7) from 2010-2011 for the SMS-GN and 2014-

53
2015 for both SMS-LL and SMS-GN vessel groups indicating that over time, the amount
of fuel used accrued lesser catches than before.
Labour output elasticity among the vessel groups was interesting and varied in
several ways. Declining labour elasticity was observed for the paddled (SP) and the
motorised dagaa (SMS-SS) vessel groups, with negative labour elasticity for the seine
net (SS) vessel groups (Figure 5). With reference to the production function, the
negative output elasticity observed for the dagaa vessel groups (SMS and SP-SS) are
indicative of heavy input usage or input congestion (Coelli et al., 2005). The implication
of input congestion occurs as an opportunity cost in either lost output or loss in other
input dimensions to maintain the existing output (Briec et al., 2016). Therefore, the
decline in the labour elasticity over time indicates that more crew hours than required
were used in the dagaa fishery. On the contrary, the labour elasticity of the SMS-GN and
SMS-LL vessel groups indicated a gradual increase from the negative and null elasticity
at the beginning of the study period to positive elasticity at the end of the study period
(Figure 7). This implies that over time, employing more of crew hours (labour) is
becoming vital in maximising fish catches for the two vessel groups SMS-LL and SMS-
GN. Similarly, employing more gear units (long line hooks) also accrued catches for the
SMS-LL vessel group over the study time. Based on the labour input, the results also
indicate the likely labour developments in the two fisheries in Lake Victoria. The Nile
perch (SMS-GN & SMS-LL) and dagaa fisheries (SMS & SP-SS) could indicate fisher
adjustment strategies given the changing composition of fish stocks in Lake Victoria
(Figure 1). Fishers either participate in the motorised GN and LL and fish for longer
hours for the large size fish or target smaller sized Nile perch using the SP-GN and SP-LL
vessel groups (Mpomwenda, 2016). Furthermore, it is highly likely that they have joined
the thriving dagaa fisheries for maximum output thus better wages leading to labour
congestion. Considering the high level of unemployment in Uganda (UBOS, 2016), it is
also possible that the marginal cost of labour on the lake is very low making it is easy for
vessel captains to hire an additional crew or even employ household members,
especially for the dagaa while elevating their social status. Labour input congestion in
the dagaa fishery was also indicated by Lokina (2009) in Lake Victoria Tanzania based on
a cross-sectional study.

54
The rate of technical change (RTC) observed for all vessel groups indicatesg an
upward shift in the production frontier OP (Figure 2). To recall, technical progress is
concerned with the ability of a vessel to produce more with the given vector of input
quantities for the specified time period (Coelli et al., 2005). The annual RTC growth
through the study period was highest for the motorised dagaa fishing vessels (SMS-SS)
and lowest for the SMS-GN fishers. In the study, the two vessel groups depict the
commercial fishing fleet for the two species, merging this to the fisheries production
developments in the lake, the observed changes in the proportions of species (Figure 1)
for which the slow growth of the Nile perch fishery could be due to the decline in
harvestable stocks by the motorised Nile perch fishing fleet and increased RTP for the
now abundant dagaa stocks (Taabu, 2014). Although the study period is limited to the
mid-2000s, it is likely that earlier development of the Nile perch species was linked to a
higher RTC prior to its decline. Squires & Vestergaard (2013) indicate that for common
property resources like fisheries, technical progress results in an enigma, where vessels
interested in private efficiency induce process innovations that eventually surpass
resource stock leading to a decline in the catches. This can also be explained as “fishing
down the food chain” (Pauly et al., 2000), whereby some fishers are transferring their
effort (motorised vessel) to fishing smaller sized fishes for the Nile perch and also the
dagaa fishery (using the SMS & SP-SS vessels). Therefore, it is likely that fishing effort is
gradually shifting from the large predatory Nile perch fishery to the small pelagic dagaa
species due to overexploitation. In an earlier study by Davis et al (1987), technical
progress was attributed to the decline of whales. Technical progress is perceived as one
of the greatest pressure on global fisheries given that capital stocks of fishing fleets
have built up to an over capitalised state but policy advice remains focused solely on
reducing capital stocks, fishing effort or subsidies ignoring technical progress (Squires &
Vestergaard, 2013).
On the other hand, technical efficiency results indicated a declining trend for all
vessel groups. Based on the 2015 technical efficiency estimates, the dagaa fishing fleet
(SMS & SP-SS) indicated more efficient vessels that is, 0.71 for SP-SS and 0.63 for SMS-
SS than the Nile perch fishery with less than 0.6 efficiency for GN and LL vessel groups.
Therefore, based on species, it is evident that dagaa fishery attained a better

55
performance in terms of maximising catches than the Nile perch fishing fleet. However,
the technical efficiency estimates in this study are contrary to the results from a cross-
sectional study by Lokina (2009), where the technical efficiency level for the Nile perch
vessels was relatively higher (0.75) than the Dagaa vessels (0.70). The general decline in
fleet technical efficiency in the study matched the declining returns to scale (RTS) for all
the vessel groups, albeit all SMS and SP-SS vessel groups operated at RTS>1. Scholars in
fisheries efficiency note that while vessels operate with increasing returns, they are
likely to experience short-run productivity gains as they increase fishing effort.
Consequently, this leads to reduced efficiency in the long run as catch is reduced for
their given effort level thus declining catch per unit effort (Pauly and Zeller, 2005;
Kirkley & Squires, 1999). This is not surprising especially for the SMS-GN vessel group as
declining CPUE was observed using the same data (Mpomwenda, 2016). Thus reduction
in efficiency of the fishing fleet would indicate declining catches resulting from
overharvesting.
It is worth noting that this study is the first to explore technical efficiency changes for
the Lake Victoria fishing fleet using the available catch assessment survey panel data.
Unfortunately, determining of the fleet technical efficiency in the study did not include
the vessel specific effects such as skipper experience, education, vessel and gear age,
and environmental variables (such as seasonality) as suggested by Pascoe and Mardle
(2003). Thus the TE estimates in the study could possibly be overestimated or even
biased. However, the use of such information was outside the scope for the study as
such information in the fisheries is not always available for fisheries in developing
countries especially on a long term basis.
Nevertheless, a further study could be done to compare the TE changes for similar
vessel groups in the Lake Victoria riparian countries of Kenya and Tanzania.
5.2 Fishers’ perceptions
Fishers were asked for information on five main issues pertaining to their production
environment. These included; factors that affected their choice of fishing area,
perception of fish catches, challenges faced in the fishery, perception on the fishery
regulations and management institutions. Seeking fishers’ perception in the study

56
aimed to provide the researcher with valuable supplementary information in making
comparison of the performance of the different vessel groups (fishing fleet) on Lake
Victoria as indicated in the previous section on TE. It should however be noted that
fishers responses in the survey were primarily influenced by target species rather than
vessel group as most sampled respondents operated in motorised fishing vessels (Table
3). Vessel group representativeness in both fisheries was minor as most fishers sampled
(74%) operated in motorised fishing vessels than paddled ones. Therefore, fisher
perceptions were based on target species (Nile perch and dagaa fishery) rather than the
study’s specified vessel groups.
Based on the result, some of the noticeable socio-economic features between these
fisheries were based on the status of the respondents and vessel ownership. Boat
owners and fishing crew were common to both fisheries, however, in the Nile perch
fishery, boat managers were encountered for boat owners having several vessels and
fishing crew. This description was earlier reported for the Nile perch fishery given that
its earlier development (Figure 1) accrued profits to fishers leading to heavy investment
in motorised vessels and employment of fishing crew (Benkenstein, 2011). Therefore,
fewer owners with relatively large number of vessels were sampled in the Nile perch
fishery than the dagaa fishery whose development (in terms of vessel motorisation) is
recent as indicated in the existing panel data. It was also interesting to note that in both
fisheries, respondents sampled engaged household labour in fishing thus signifying the
importance of the social ties and structures in the Lake Victoria fisheries (Nunan et al.,
2018) and labour-using component specified earlier for the vessel groups.
Another important aspect was on the nature of the production environment, as the
weather condition on the lake mattered most to fishers thus reflecting the degree of
stochasticity in their production environment.
On rating performance based on the fish catches, it was common that the catches of
the Nile perch fishery were rated worse whereas those of the dagaa fishery were rated
as relatively stable. Thus from this it is likely that paddled dagaa fishing vessels
performed better relative to other vessel groups similar to the TE results. Furthermore,
comparison within the vessel propulsion in the dagaa fishery (SS vessel groups)
indicated that respondents from motorised dagaa vessels were also more likely to

57
indicate that the state of their catches had declined than their paddled counterparts.
This was not surprising as most fishers indicated that reducing fish catches was one of
the major challenges faced in the Lake. Similar results on fishers perception on the
status of catches were reported by Cepid & Nunan (2017) supporting that majority of
fishers sampled at selected landing sites of the three riparian Lake Victoria countries
expressed the belief that catches had declined in the fishery.
In assessing the nature of fishery regulations, fishers frequently supported
regulations they were aware of such as mesh size regulation, illegal gear ban and vessel
registration. Other two specified regulations that is, closed areas and closed fishing
seasons were seldom known with limited support for the closed fishing seasons. All the
regulations examined in the study are stipulated in the fisheries laws of Uganda (Fish
protection ordinance 1950, the Uganda’s Fish Act, cap 197 of 2000 and the National
Fisheries policy 2007), therefore it is likely that fishers are better informed about the
mesh size, gear ban and boat registration than closed fishing seasons and areas.
It is also important to note that fisheries management is based on co-management
that was established with the core objective of eliminating illegal fishing methods
(Onyango, 2015) thus less emphasis on closed fishing seasons. Closed fishing seasons
would also be seen as a potential threat to fisher’s livelihoods as majority of
respondents were fulltime fishers with limited alternative activities. Similar findings on
negative perception on closed fishing seasons has been reported in other fisheries such
as in the Brazilian small-scale shrimp fishery (Musiello-Fernandes et al., 2017) and also
on Mafia Island in Tanzania (Kincaid, et al., 2014).
In assessing the preferred management, respondents were more likely, to support
fisher-based management institution than other alternatives. The least preferred
alternative was management by the local government. However, local government
officials are seen to have inadequate capacity and personnel to effectively manage
fisheries (Nunan et al., 2015; Kolding, 2013). Based on empirical evidence, fishers and
BMU members are much closer to the resource and knowledgeable about fisheries
operations than local government officials. Local government officials and sometimes
government officials were seen as being more interested in collecting taxes and license

58
fees rather than in enforcing other important regulations. Therefore, fishers would
regard them as ineffective in ensuring management on the lake.
5.3 Conclusion and recommendations
Determining the performance of fishing fleet in data deficient fisheries is quite
complex. In this study, the performance of the Lake Victoria fishing fleet was
determined based on the technical efficiency and fisher’s perception of their production
environment. The study applies a panel data SFA model to determine the technical
efficiency of the fishing fleet based on the dagaa and Nile perch fishery. To attain the
fleet technical efficiency, the study illustrated a cost-effective way to measure resource
situation and development by using an existing panel data and an independent cross-
section study to manipulate missing data variables. In the study, six dominant vessel
groups were identified based on vessel propulsion (motorised or paddled) and gear type
(LL and GN for Nile perch fishery and SS for the dagaa fishery). It is suggested that the
potential of maximising output from the Lake Victoria fishery resource is obtained by
operating motorised fishing vessels rather than paddled vessels. Comparison between
species indicated that the dagaa fishing vessels (SMS-SS and SP-SS) performed better
than the Nile perch fishing vessels (GN and LL) indicated by higher returns to scale,
relatively higher technical efficiency estimates (as of 2015) and also fishermen’s
perceptions on the status of the species catches.
It is also interesting to note that in the fishery, two major fleet developments have
emerged in relation to the Nile perch; in the motorised gillnet and long line vessels,
fishing labour (crew*hours) is increasingly becoming important in maximising output
whereas in other vessel groups there is a tendency of over manning. This indicates
fishers engaged in the motorised Nile perch fishery going longr distances to catch big
fish while their paddled counterparts go shorter distances to catch smaller fish
indicating clear signs of overexploitation thus a need for management measures. The
decline in technical efficiency indicates that too many vessels chasing too few fish
indicated by the increased rate of technical change for all vessel groups. These would
therefore require relegating vessels in the fishery to only those that give maximum
returns to the fisher as suggested above. From the study, therefore, it is recommended
that;

59
Motorised vessels in the fishery should be maintained as they accrue increasing returns
from the fishery thus are suitable for maximising output to fishers than the paddled
counterparts.
For maximum returns to scale, vessel input combinations for vessel groups SMS-GN be
maintained at 2005 levels, SMS-LL and SMS-SS at 2011 levels.
.
In addition, there is need for the government to create networks for alternative
livelihood opportunities to fishers and fisher communities. These would include
developing infrastructure for other fishing activities especially in post-harvest fishing
activities such as community fish handling and processing infrastructure, marketing
among others. As a result, this will also curb over manning observed in the
dagaa/omena/mukene fishery as alternative livelihoods will create alternative sources
of income other than fishing.
In general, effort restricting policy measures for all fishery inputs should be
integrated into the fishery management objectives, and also building the capacity in
grassroots fisheries management to incorporate and implement measures such as
closed fishing seasons and areas for better stock health management.
The results of the present study indicate that it is essential to periodically monitor
and assess the performance of the fishing fleet and its effect on the fishery stock health.
This is because other factors such as seasonality and other vessel specific characteristics
were out of the scope of the study due to limited data for those variables, however,
these should be explored in future research opportunities.
Finally, there is also need to assess the changes in technical efficiency of the fishing
fleet on other Lake Victoria riparian countries (Kenya and Tanzania) for a better
comparison of the study results. This will help identify the inter-country differences and
similarities, create a more proficient conclusion and policy recommendation for the
trans-boundary fisheries resource.

60
6 Acknowledgement
Greatest thanks to the UNU-FTP staff, Dr Tumi Tómasson, Þór Ásgeirsson, Mary
Frances Davidson, Stefán Úlfarsson and Julie Ingham for granting me the opportunity
and support in attaining this milestone in life. Through this, I have not only gained
fisheries knowledge but also built confidence in writing and expression.
Greatest thanks to my supervisors Dr Daði Már Kristófersson and Jon Geir Petursson
for the academic guidance received during this period of study. The critics and advice
have helped me build confidence in academic research.
Am so grateful to the Director of the National Fisheries Resources Research Institute
(NaFIRRI), Dr Anthony Taabu Munyaho for the limitless support granted to me during
my study period. Many thanks to the members of the capture fisheries and biodiversity
conservation program especially Dr Nkalubo Winy, Mr Nakiyende Herbert, Mr Basa
Samuel, Mr Muhumuza Elias, Mr Natugonza Vianny and Ms Kagoya Esther for the
guidance and critical views contributed to this study.
I would also not forget to thank my field research team Mr Kamya Ashiraf, Mr
Nduwayesu Everest, Mr Akol John Michael and Madoi Mohammed, who together we
toiled through challenging conditions to collect the study’s data.
And lastly, to my family who encouraged me in prayer and also provided emotional
support during the period of the study, I will forever be grateful.

61
7 References
Aigner, D., Lovell, C. A. K., & Schmidt, P. (1977). Formulation and estimation of
stochastic frontier production function models. Journal of Econometrics, 6(1), 21–
37.
Anene, A., Ezeh, C. I., & Oputa, C. O. (2010). Resources use and efficiency of artisanal
fishing in Oguta , Imo State , Nigeria. Developement and Agricultural Economics,
2(March), 94–99.
Battese, G. E., & Coelli, T. J. (1992). Frontier production functions, technical efficiency
and panel data: with application to paddy farmers in India. Journal of Productivity
Analysis, 3(1–2), 153–169.
Branch, G. M., Hauck, M., Siqwana-Ndulo, N., & Dye, A. H. (2002). Defining fishers in the
South African context: subsistence, artisanal and small-scale commercial sectors.
South African Journal of Marine Science, 24(1), 475–487.
http://doi.org/10.2989/025776102784528493
Briec, W., Kerstens, K., & Van de Woestyne, I. (2016). Congestion in production
correspondences. Journal of Economics/ Zeitschrift Fur Nationalokonomie, 119(1),
65–90. http://doi.org/10.1007/s00712-016-0484-6
Cepid, D., & Nunan, F. (2017). Justifying non-compliance: The morality of illegalities in
small scale-fisheries of Lake Victoria, East Africa. Marine Policy, 86(June), 104–110.
http://doi.org/10.1016/j.marpol.2017.09.018
Coelli, T. J., Rao, D. S. P., O’Donnell, C. J., & Battese, G. E. (2005). An introduction to
efficiency and productivity analysis. Springer Science & Business Media.
Coelli, T., Rao, D. S. P., & Battese, G. E. (2005). An introduction to efficiency and
productivity analysis (2nd ed.). Queensland: Springer.
Curtis, R., & Squires, D. (2008). Fisheries buybacks. John Wiley & Sons.
Deaton, A. (1985). Panel Data from Time Series of Cross Sections. Journal of
Econometrics, 30, 109–126.
Downing, A. S., Van Nes, E. H., Balirwa, J. S., Beuving, J., Bwathondi, P., Chapman, L. J., …
Mooij, W. M. (2014). Coupled human and natural system dynamics as key to the

62
sustainability of Lake Victoria’s Ecosystem services. Ecology and Society, 19(4), 31–
49. http://doi.org/10.5751/ES-06965-190431
Eggert, H. (2001). Technical efficiency in the Swedish trawl fishery for Norway lobster. In
IIFET 2000 Proceedings (p. 9). Gorteborg: International Institute of Fisheries
Economics and Trade.
Eseza, K., & Sterner, T. (2012). Production Functions for Nile Perch and Tilapia Fisheries :
A case study of Uganda ’ s Section of Lake Victoria. Crown Journal of Agriculture,
1(1).
FAO. (2015). Voluntary Guidelines for Securing Sustainable Small-Scale Fisheries in the
context of Food Security and Poverty Eradication. Fao. Retrieved from
http://www.fao.org/docrep/field/003/ab825f/AB825F00.htm#TOC
FAO / DANIDA. (1998). Guidelines for routine collection of capture fishery data. (FAO
Fisheries Technical paper No. 382). Bangkok.
Felthoven, R. G. (2000). Measuring Fishing Capacity : An Application to in North Pacific
Groundfish Fisheries.
Fried, H. O., Lovell, K. C. A., & Schmidt, S. S. (1993). The measurement of productive
efficiency: Techniques and Applications. (H. O. Fried, K. C. A. Lovell, & S. S. Schmidt,
Eds.). New York: Oxford University Press.
Greene, W. (1980a). Fixed and random effects in stochastic frontier models. Journal of
Productivity Analysis, 23(1), 7–32.
Greene, W. (1980b). Reconsidering heterogenity in panel data estimators of the
stochastic frontier model. Journal of Econometrics, 126(2), 269–303.
Henningsen, A. (2014). Introduction to Econometric Production Analysis with R.
Copenhagen.
Herrero, I. (2004). Risk and strategy of fishers alternatively exploiting sea bream and
tuna in the Gibraltar Strait from an efficiency perspective. ICES Journal of Marine
Science: Journal Du Conseil, 61(2), 211–217.
Herrero, I. (2005). Different approaches to efficiency analysis. An application to the
Spanish Trawl fleet operating in Moroccan waters. European Journal of Operational
Research, 167(1), 257–271. http://doi.org/10.1016/j.ejor.2004.03.019
63
James, G., Witten, D., Hastie, T., & Tibshirani, R. (2014). An Introduction to Statistical
Learning: With Applications in R. Springer Science & Business Media.
Jentoft, S., McCay, B. J., & Wilson, D. C. (1998). Social theory and fisheries co-
management. Marine Policy, 22(4–5), 423–436. http://doi.org/10.1016/S0308-
597X(97)00040-7
Jinadu, O. O. (2000). Economic Efficiency in the Coastal Small-scale Fisheries in Lagos
State , Nigeria. In IIFET 2000 Proceedings (p. 14).
Jondrow, J., Lovell, C. A. K., Materov, I. S., & Schmidt, P. (1982). On the estimation of
technical inefficiency in the stochastic frontier production function model. Journal
of Econometrics, 19(2–3), 233–238.
Kincaid, K. B., Rose, G., & Mahundi, H. (2014). Fishers perception of the multiple-use
marine protected area: Why communities and gear users differe at Mafia Island,
Tanzania. Marine Policy, 43, 226–235.
Kirkley, J. E., & Squires, D. (1999). Capacity and capacity utilization in fishing industries.
Discussion paper 99-16. Carlifornia.
Kirkley, J., & Squires, D. (1998). Measuring capacity and capacity utilization in fisheries.
In FAO Technical Working Group on the Management of Fishing Capacity. La Jolla
CA.
Kolding, J., Medard, M., Mkumbo, O. C., & van Zwieten, P. A. M. (2013). Status, trends
and management of the Lake Victoria Fisheries. Inland Fisheries Evolution and
Management – Case Studies from Four Continents., 1–19.
Kompas, T., Che, T. N., & Quentin Grafton*, R. (2004). Technical efficiency effects of
input controls: evidence from Australia’s banana prawn fishery. Applied Economics,
36(15), 1631–1641.
Koopmans, T. . (1951). An analysis of production as an efficient combination of
activities. In T. . Koopmans (Ed.), Activity analysis of production and of activities.
New York: Wiley.
Kudhongania, A.W. Chitamwebwa, D. B. R. (1995). Impact of environmental change,
species introductions and ecological interactions on the fish stocks in Lake Victoria.
In T. J. Pitcher & P. J. B. Hart (Eds.), The impact of species changes in African lakes.

64
(pp. 19–32).
Kumbhakar, S. C., & Lovell, K. C. A. (2000). Stochastic Frontier Analysis. Ne York:
Cambridge Univ Press.
Lokina, R. B. (2009). Technical efficiency and the role of skipper skill in artisanal Lake
Victoria fisheries. Environment and Development Economics, 14(4), 497–519.
LVFO. (2014). Regional Lake Victoria fisheries frame survey report-2014. Jinja, Uganda.
LVFO. (2016). Regional Catch Assessment Survey Synthesis Report June 2005 to
November/December 2015. Jinja.
Madau, F. A., Idda, L., & Pulina, P. (2009). Capacity and economic efficiency in small-
scale fisheries : Evidence from the Mediterranean Sea. Marine Policy, 33(5), 860–
867. http://doi.org/10.1016/j.marpol.2009.03.006
Mpomwenda, V. (2016). Development and effects of the gillnet mesh size regulation on
Lake Victoria, Uganda; The case of the Nile perch fishery. United Nations
University- Fisheries Training Program., Reykjavik.
Musiello-Fernandes, J., Zappes, C. A., & Hostim-Silva, M. (2017). Small-scale shrimp
fisheries on the Brazilian coast: Stakeholders perceptions of the closed season and
integrated management. Ocean and Coastal Management, 148, 89–96.
http://doi.org/10.1016/j.ocecoaman.2017.07.018
Natsir, M. (2016). Technical efficiency of fish aggregating devices associated Tuna
fisheries in Kendari fishing port- Indonesia. United Nationa University Fisheries
Training Program, Reykjavik, Iceland.
Nunan, F., Cepid, D., Mbilingi, B., Odongkara, K., Yongo, E., Owili, M., … Onyango, P.
(2018). Community Cohesion : Social and Economic Ties in the Personal Networks
of Fisherfolk Community Cohesion : Social and Economic Ties in the. Society &
Natural Resources, 31(3), 306–319.
http://doi.org/10.1080/08941920.2017.1383547
Nunan, F., Hara, M., & Onyango, P. (2015). Institutions and Co-Management in East
African Inland and Malawi Fisheries : A Critical Perspective. World Development,
70, 203–214. http://doi.org/10.1016/j.worlddev.2015.01.009
Pascoe, S., & Mardle, S. (2003). Single output measures of technical efficiency in EU

65
fisheries. University of Portsmouth.
Pauly, D., Christensen, V., Froese, R., & Palomares, M. (2000). Fishing Down Aquatic
Food Webs. American Scientist, 88, 46. http://doi.org/10.1511/2000.15.764
Pham, T. D. T., Huang, H. W., & Chuang, C. T. (2014). Finding a balance between
economic performance and capacity efficiency for sustainable fisheries: Case of the
Da Nang gillnet fishery, Vietnam. Marine Policy, 44, 287–294.
http://doi.org/10.1016/j.marpol.2013.09.021
Pinello, D., Liontakis, A., Sintori, A., Tzouramani, I., & Polymeros, K. (2016). Assessing the
efficiency of small-scale and bottom trawler vessels in Greece. Sustainability, 8(7),
1–11. http://doi.org/10.3390/su8070681
Purcell, S. W., & Pomeroy, R. S. (2015). Driving small-scale fisheries in developing
countries. Frontiers in Marine Science, 2(June), 1–7.
http://doi.org/10.3389/fmars.2015.00044
R Core Team. (2017). R: A language and environment for statistical computing. Vienna,
Austria: R Foundation for Statistical Computing. Retrieved from http://www.r-
project.org/.
Schaefer, M. B. (1954). Some aspects of the dynamics of populations important to the
management of the commercial marine fisheries. Inter-American Tropical Tuna
Commission Bulletin, 1(2), 23–56.
Smith, H., Garcia Lozano, A., & Basurto, X. (2017). Staying with the Trouble of Defining
Small-Scale Fisheries. Tbd.
SPSS. (2013). IBM SPSS statistics 22. IBM Corp New York.
Squires, D., Grafton, R. Q., Alam, M. F., & Omar, I. H. (2003a). Technical efficiency in the
Malaysian gill net artisanal fishery. Environment and Development Economics, 8(3),
481–504. http://doi.org/10.1017/S1355770X0300263
Squires, D., Grafton, R. Q., Alam, M. F., & Omar, I. H. (2003b). Technical efficiency in the
Malaysian gill net artisanal fishery The suggestions of three anonymous reviewers,
the editor, Mohammad Alauddin, Boris Bravo-Ureta, Harry Campbell, Stephen
Cunningham, Diane Dupont, Sam Herrick, Larry Jacobson, John Kurien, Do.
Environment and Development Economics, 8(3), 481–504.

66
http://doi.org/10.1017/S1355770X0300263
Squires, D., & Vestergaard, N. (2013). Technical change and the commons. Review of
Economics and Statistics, 95(1), 1769–1787.
Taabu, M. A. (2014). Anthropogenic and environmental impacts on the abundance and
distribution of commercial fish stocks of Lake Victoria, East Africa. Faculty of Life
and Environment Sciences, University of Iceland,182 pp. University of Iceland.
The Republic of Uganda. (2012). Uganda Vision 2040. Kampala.
UBOS. (2016). Statistical abstract 2016.Uganda Beaurea of Statistics. Kampala, Uganda.
Verbeek, M. (2007). Pseudo-Panels and Repeated Cross-Sections. SSRN Electronics
Journal, 369–383. http://doi.org/10.1007/978-3-540-75892-1_11
Welcomme, R. L., Cowx, I. G., Coates, D., Béné, C., Funge-Smith, S., Halls, A., & Lorenzen,
K. (2010). Inland capture fisheries. Philosophical Transactions of the Royal Society
of London. Series B, Biological Sciences, 365(1554), 2881–96.
http://doi.org/10.1098/rstb.2010.0168
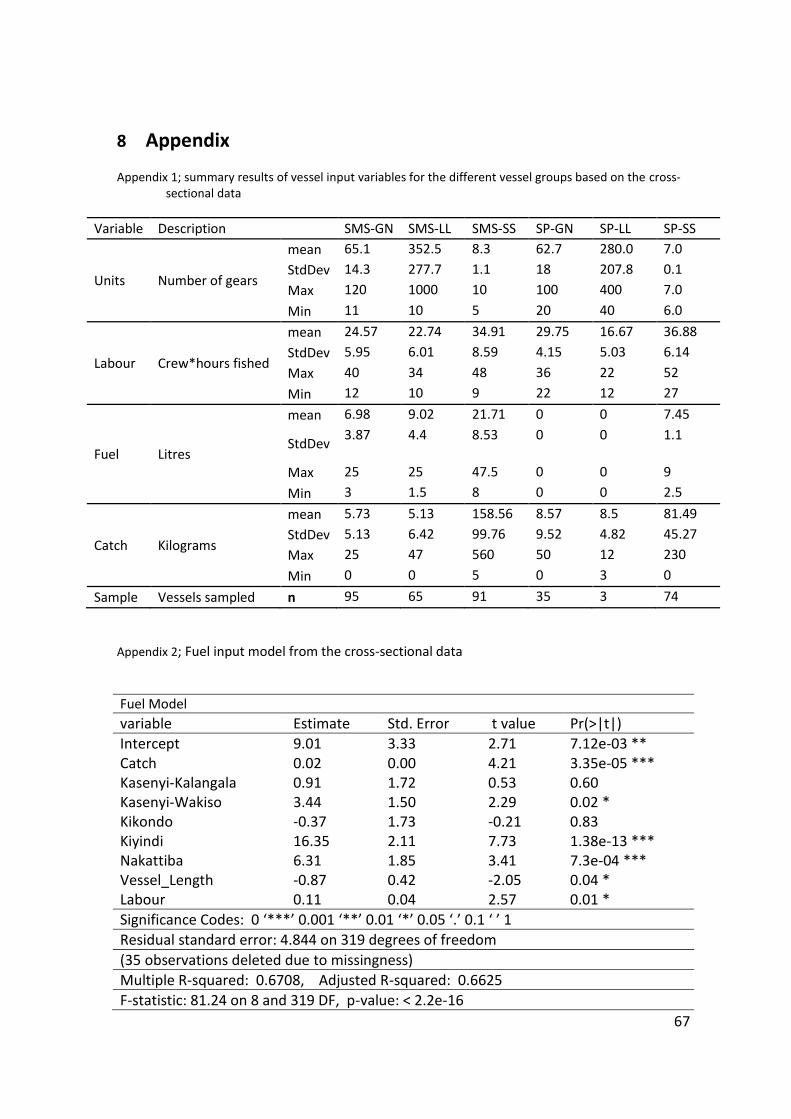
67
8 Appendix
Appendix 1; summary results of vessel input variables for the different vessel groups based on the cross-sectional data
Variable Description SMS-GN SMS-LL SMS-SS SP-GN SP-LL SP-SS
Units Number of gears
mean 65.1 352.5 8.3 62.7 280.0 7.0
StdDev 14.3 277.7 1.1 18 207.8 0.1
Max 120 1000 10 100 400 7.0
Min 11 10 5 20 40 6.0
Labour Crew*hours fished
mean 24.57 22.74 34.91 29.75 16.67 36.88
StdDev 5.95 6.01 8.59 4.15 5.03 6.14
Max 40 34 48 36 22 52
Min 12 10 9 22 12 27
Fuel Litres
mean 6.98 9.02 21.71 0 0 7.45
StdDev 3.87 4.4
8.53 0 0 1.1
Max 25 25 47.5 0 0 9
Min 3 1.5 8 0 0 2.5
Catch Kilograms
mean 5.73 5.13 158.56 8.57 8.5 81.49
StdDev 5.13 6.42 99.76 9.52 4.82 45.27
Max 25 47 560 50 12 230
Min 0 0 5 0 3 0
Sample Vessels sampled n 95 65 91 35 3 74
Appendix 2; Fuel input model from the cross-sectional data
Fuel Model
variable Estimate Std. Error t value Pr(>|t|)
Intercept 9.01 3.33 2.71 7.12e-03 ** Catch 0.02 0.00 4.21 3.35e-05 *** Kasenyi-Kalangala 0.91 1.72 0.53 0.60 Kasenyi-Wakiso 3.44 1.50 2.29 0.02 * Kikondo -0.37 1.73 -0.21 0.83 Kiyindi 16.35 2.11 7.73 1.38e-13 *** Nakattiba 6.31 1.85 3.41 7.3e-04 *** Vessel_Length -0.87 0.42 -2.05 0.04 * Labour 0.11 0.04 2.57 0.01 *
Significance Codes: 0 ‘***’ 0.001 ‘**’ 0.01 ‘*’ 0.05 ‘.’ 0.1 ‘ ’ 1
Residual standard error: 4.844 on 319 degrees of freedom
(35 observations deleted due to missingness)
Multiple R-squared: 0.6708, Adjusted R-squared: 0.6625
F-statistic: 81.24 on 8 and 319 DF, p-value: < 2.2e-16

68
Appendix 3; Changes in the SFA model variables-Catch, number of gears, labour and fuel for the specified time period

69
Appendix 4; estimated change in output elasticity for the vessel input variables for the different vessel groups
Output elasticity
Vessel group Input variables 2005 2006 2007 2008 2010 2011 2014 2015
SMS-GN
Gear number 0.63 0.58 0.59 0.60 0.57 0.52 0.48 0.45
Fuel 0.97 0.83 0.83 0.85 0.81 0.66 0.55 0.53
Labour -0.35 -0.29 -0.26 -0.22 -0.18 -0.10 0.10 0.12
SMS-LL
Gear number 0.22 0.21 0.25 0.28 0.30 0.33 0.38 0.43
Fuel 1.09 1.05 1.13 1.07 1.09 1.16 0.96 0.68
Labour 0.00 -0.02 -0.04 -0.01 0.02 0.05 0.08 0.14
SMS-SS
Gear number
3.54 2.08 1.96
Fuel
7.97 5.93 6.16
Labour 0.55 -0.33 -0.72
SP-SS
Gear number 2.13 1.93 2.18 2.18 2.01 1.71 0.81 0.74
Fuel 2.62 2.72 2.43 2.45 2.78 2.58 2.61 2.40
Labour 0.79 0.48 0.43 0.22 -0.40 -0.32 -0.57 -0.70
SP-GN Gear number 0.26 0.23 0.22 0.31 0.30 0.34 0.33 0.29
Labour 0.46 0.40 0.35 0.30 0.23 0.19 0.08 0.02
SP-LL Gear number 0.27 0.30 0.30 0.33 0.34 0.35 0.28 0.27
Labour 0.36 0.34 0.35 0.33 0.24 0.19 0.12 0.12
Appendix 5 ; Change in the average technical efficiency of the Lake Victoria fishing fleet.
Vessel type summary Year % TE change
2005 2006 2007 2008 2010 2011 2014 2015
SMS
GN Mean 0.97 0.96 0.94 0.90 0.84 0.77 0.67 0.54 -0.43
StDev 0.01 0.01 0.02 0.03 0.06 0.09 0.11 0.13
SS Mean 1.00 0.97 0.63 -0.37
StDev 0.00 0.02 0.14
LL Mean 1.00 1.00 0.99 0.98 0.96 0.88 0.73 0.45 -0.55
StDev 0.00 0.00 0.00 0.01 0.03 0.07 0.12 0.16
SP
GN Mean 0.96 0.94 0.91 0.88 0.83 0.77 0.70 0.60 -0.37
StDev 0.01 0.01 0.02 0.03 0.05 0.07 0.08 0.10
SS Mean 0.97 0.96 0.94 0.92 0.89 0.84 0.79 0.71 -0.27
StDev 0.01 0.02 0.02 0.03 0.05 0.06 0.09 0.11
LL Mean 1.00 1.00 0.99 0.98 0.94 0.84 0.66 0.40 -0.60
StDev 0.00 0.00 0.00 0.01 0.03 0.07 0.14 0.16

70
Appendix 6; Questionnaire one
Questionnaire 1
The purpose of this survey is to assess the productive performance of fishing vessels on Lake
Victoria through collecting data on vessel level inputs and their costs and the outputs in terms of
prices and landed catch.
Date
Vessel serial number Country
District Sub-county
Landing site Enumerators’ name
Name of respondent Phone
1. Status of respondent
Boat owner Fisher Other (Specify)
2. Fishing experience of respondent (years)
1-5
6-10
11-15
Above 15
VESSEL INPUT FIXED COSTS
3. Vessel ownership
Own Rent Other specify………………….
4. If you rent a boat, how much do you pay per day? _____________ (Shs per day).
5. If you own a boat, give relevant information in table below
Type of boat Num
ber
Len
gth
Unit
cost
Repair costs (Shs/half
yearly)
Lifespan
(Years)
Ssesse Flat
Ssesse pointed
Parachute
Other
(specify)……….
6. Vessel operation mode.
Propulsion mode Number Unit cost Repair/maintenance
costs Life
span
Motor engine (--------HP)
Paddles
Large
Small
7. Gear information; Types, numbers, and cost of gear(s) used.
Gear Types Numbe
r
Size
(Meshes
/hook size)
Unit cost
(Shs/unit)
Repair
costs
(Shs/month)
Life span
(Months)
Gillnets –
multifilament
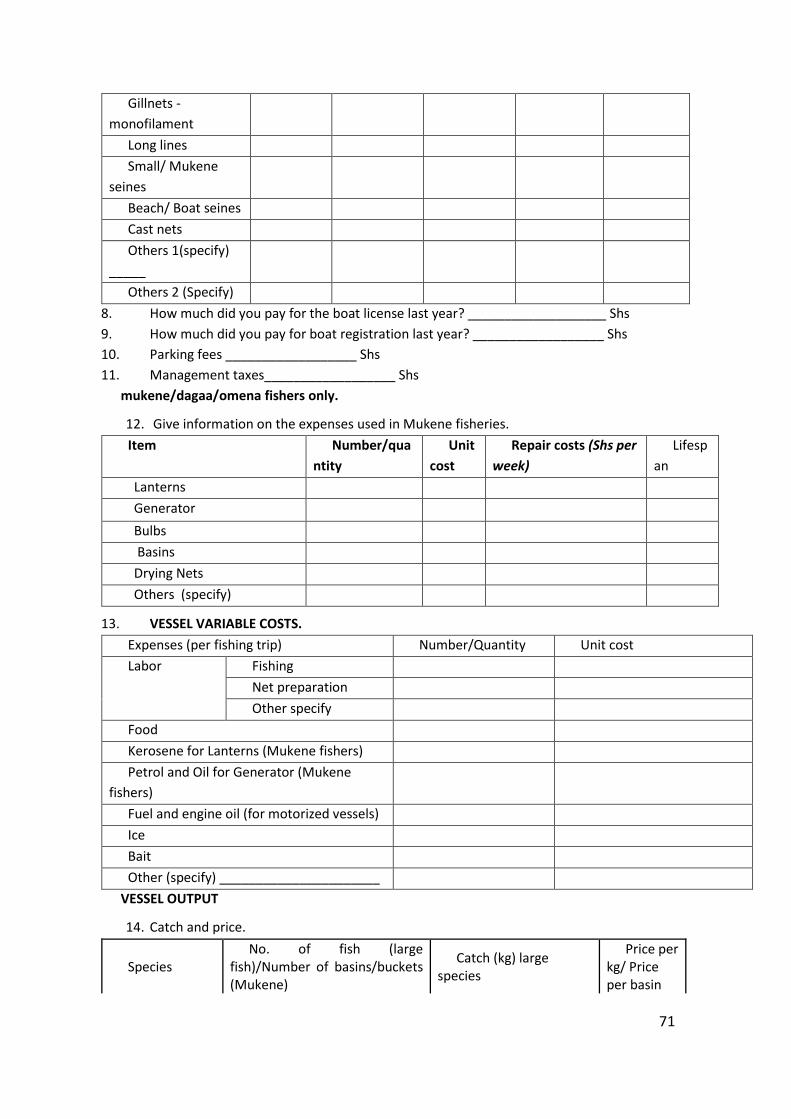
71
Gillnets -
monofilament
Long lines
Small/ Mukene
seines
Beach/ Boat seines
Cast nets
Others 1(specify)
_____
Others 2 (Specify)
8. How much did you pay for the boat license last year? ___________________ Shs
9. How much did you pay for boat registration last year? __________________ Shs
10. Parking fees __________________ Shs
11. Management taxes__________________ Shs
mukene/dagaa/omena fishers only.
12. Give information on the expenses used in Mukene fisheries.
Item Number/qua
ntity
Unit
cost
Repair costs (Shs per
week)
Lifesp
an
Lanterns
Generator
Bulbs
Basins
Drying Nets
Others (specify)
13. VESSEL VARIABLE COSTS.
Expenses (per fishing trip) Number/Quantity Unit cost
Labor Fishing
Net preparation
Other specify
Food
Kerosene for Lanterns (Mukene fishers)
Petrol and Oil for Generator (Mukene
fishers)
Fuel and engine oil (for motorized vessels)
Ice
Bait
Other (specify) ______________________
VESSEL OUTPUT
14. Catch and price.
Species No. of fish (large
fish)/Number of basins/buckets (Mukene)
Catch (kg) large species
Price per kg/ Price per basin
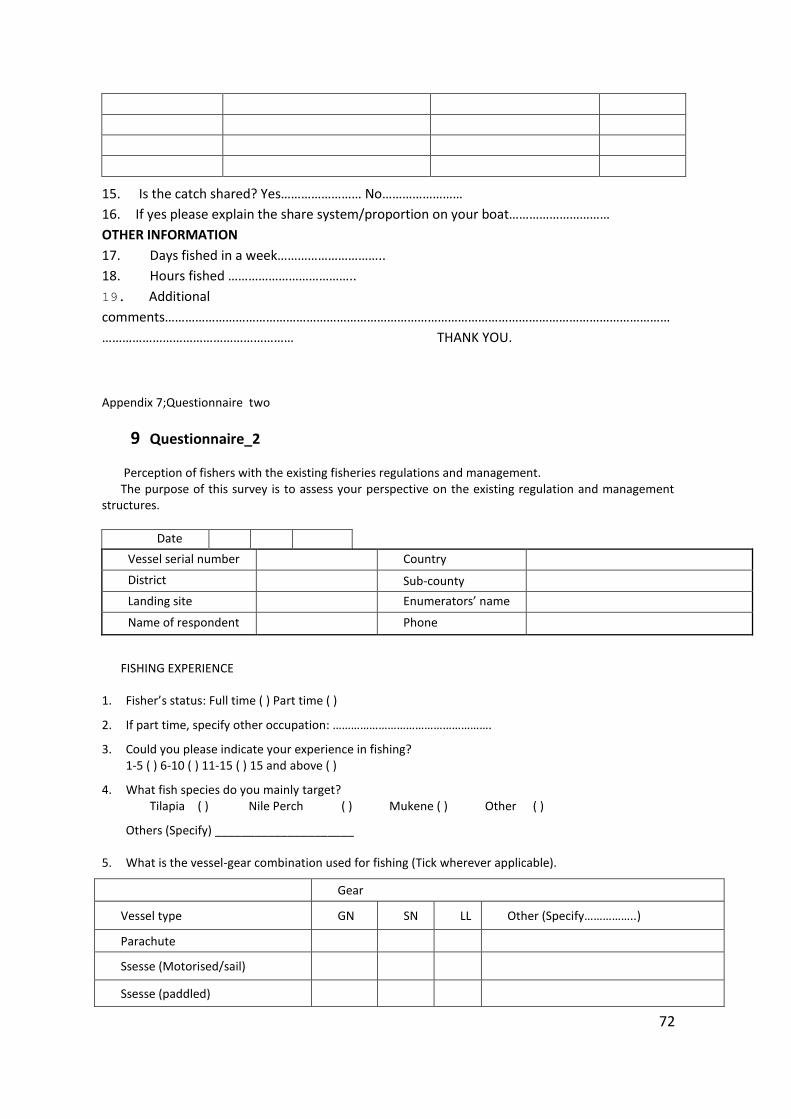
72
15. Is the catch shared? Yes…………………… No……………………
16. If yes please explain the share system/proportion on your boat…………………………
OTHER INFORMATION
17. Days fished in a week…………………………..
18. Hours fished ………………………………..
19. Additional
comments……………………………………………………………………………………………………………………………………
………………………………………………… THANK YOU.
Appendix 7;Questionnaire two
9 Questionnaire_2
Perception of fishers with the existing fisheries regulations and management. The purpose of this survey is to assess your perspective on the existing regulation and management
structures.
Date
Vessel serial number Country
District Sub-county
Landing site Enumerators’ name
Name of respondent Phone
FISHING EXPERIENCE
1. Fisher’s status: Full time ( ) Part time ( )
2. If part time, specify other occupation: …………………………………………….
3. Could you please indicate your experience in fishing? 1-5 ( ) 6-10 ( ) 11-15 ( ) 15 and above ( )
4. What fish species do you mainly target? Tilapia ( ) Nile Perch ( ) Mukene ( ) Other ( )
Others (Specify) _____________________
5. What is the vessel-gear combination used for fishing (Tick wherever applicable).
Gear
Vessel type GN SN LL Other (Specify……………..)
Parachute
Ssesse (Motorised/sail)
Ssesse (paddled)

73
Other (Specify……...)
6. Please rate how the following factors affect the choice of your fishing site.
Aspect Please tick where
applicable.
Weather
Fishing experience
Crew availability
Restricted access to other fishing
grounds
Abundance of fish
Looking for particular species.
Distance to the landing site
Theft
PERCEPTION ON CATCHES
7. How would you rate the general catches over the last 10 years for the main target species [represent; 1= Better off, 2= Worse off, 3= Constant]?
Species Better off Constant Worse off
Nile perch
Nile Tilapia
Silver fish/ Mukene
Haplochromines
Others, specify……….
8. Based on your experience in the fishery, please rate the nature following problems in affecting fishing as an economic activity? (What are the major problems faced in fishing).
Aspect Very
severe
Severe Neutral less severe Not
sure.
Unregulated entry of people
into the fishery.
Conflicts over fishing grounds
Reducing fish catches
Increasing use of illegal gears
Increasing fishing input costs
Looking for particular species.
Decreasing fish sizes
Changing weather variations
Other specify………….
MANAGEMENT ASPECTS
9. Are you a member of the local beach management/landing site committee? Yes ( ) No ( )

74
10. If yes, how are you involved? 1. Member ( ) 2. None ( ) 3. Top management
(Specify)………………………….
11. Which of the following fishing regulation are you familiar with?
Regulation Yes No Not sure
The gillnet mesh size regulation
Illegal fish gear ban
Closed fishing seasons
Closed areas (breeding and nursery grounds)
Boat registration and licensing
12. Do you think that all fishers at this beach are aware of these regulations? Yes ( ) No ( )
13. If no, why do you think so...?
14. In your own opinion can you please rate the following regulations in ensuring effective fisheries management at this landing site? Mark with X your preference.
Regulation Strongly agree
Agree
Neither
Disagree
Strongly disagree
Gillnet minimum mesh size regulation.
Fish gear Ban (Beach seines, cast nets, etc.)
Closed fishing seasons
Closed areas/restrictions on Breeding and Nursery grounds
Boat registration and licensing with BMU/landing site.
15. What roles does the current management execute?
…………………………………………………………………………………………………………………………………………………………………………………………………………………………………………………………………………………………………………………………………………………………………………………………………………
16. In your own opinion which one of the following Institutions would effectively handle cases when regulations are broken? (Please mark priority with X and choose one) Fishers ( ) BMU office ( ) Local government fisheries office ( ) State government ( ) All the above ( ) None ( )
17. In your own opinion what suggestions would be appropriate in improving the fisheries? (Mark where appropriate) 1. ………………………………………………………………………………………………………………………………………………………
………………………………………………………………………………………………………………………………………………………………………………………………………………………………………
Socio-demographic characteristics of respondents
18. Gender: Male ( ) Female ( ) Age: ……………………………………….
19. Marital status: Single ( ) Married ( ) Widow ( ) others (specify): ……………….
20. Number of households: …………………………………….

75
21. Are any of them involved in fishing activities? Yes ( ) No ( )
22. If yes, what role do they play? ……………………………
23. Education level: No education ( ) Primary Education ( ) Secondary education ( ) Tertiary/Vocational
Studies ( ) Senior School Certificate ( ) Tertiary education ( ) Name of fishing village/Landing site:
………………………
24. Ethnic group: ……………………………………
THANK YOU FOR YOUR PARTICIPATION.