


Languages
Pages
Legal


Q4’13 ResultsFebruary 2014
2

Safe harbor“Safe Harbor” statement under the Private Securities Litigation Reform Act of 1995: This presentation contains forward-looking statements about our products, including our investments in products, technology and other key strategic areas, certain non-financial metrics, such as member growth and engagement, and our expected financial metrics such as revenue, adjusted EBITDA, depreciation and amortization and stock-based compensation for the first quarter of 2014 and the full fiscal year 2014. The achievement of the matters covered by such forward-looking statements involves risks, uncertainties and assumptions. If any of these risks or uncertainties materialize or if any of the assumptions prove incorrect, the company’s results could differ materially from the results expressed or implied by the forward-looking statements the company makes.
The risks and uncertainties referred to above include - but are not limited to - risks associated with: our limited operating history in a new and unproven market; engagement of our members; the price volatility of our Class A common stock; general economic conditions; expectations regarding the return on our strategic investments; execution of our plans and strategies, including with respect to mobile products and features; security measures and the risk that they may not be sufficient to secure our member data adequately or that we are subject to attacks that degrade or deny the ability of members to access our solutions; expectations regarding our ability to timely and effectively scale and adapt existing technology and network infrastructure to ensure that our solutions are accessible at all times with short or no perceptible load times; our ability to maintain our rate of revenue growth and manage our expenses and investment plans; our ability to accurately track our key metrics internally; members and customers curtailing or ceasing to use our solutions; our core value of putting members first, which may conflict with the short-term interests of the business; privacy and changes in regulations in the United States, Europe or elsewhere, which could impact our ability to serve our members or curtail our monetization efforts; litigation and regulatory issues; increasing competition; our ability to manage our growth; our ability to recruit and retain our employees; the application of US and international tax laws on our tax structure and any changes to such tax laws; acquisitions we have made or may make in the future; and the dual class structure of our common stock.
Further information on these and other factors that could affect the company’s financial results is included in filings it makes with the Securities and Exchange Commission from time to time, including the section entitled “Risk Factors” in the company’s Annual Report on Form 10-K for the year ended December 31, 2012, as well as the company’s most recent Quarterly Report on Form 10-Q for the quarter ended September 30, 2013, and additional information will also be set forth in our Form 10-K that will be filed for the year ended December 31, 2013, which should be read in conjunction with these financial results. These documents are or will be available on the SEC Filings section of the Investor Relations page of the company's website at http://investors.linkedin.com/. All information provided in this presentation is as of February 6, 2014, and LinkedIn undertakes no duty to update this information.
3

Who we are
4

Connect the world’s professionals to make them more productive
and successful
Our mission
5

Create economic opportunity for every member of the global
workforce
Our vision
6

What we do
7
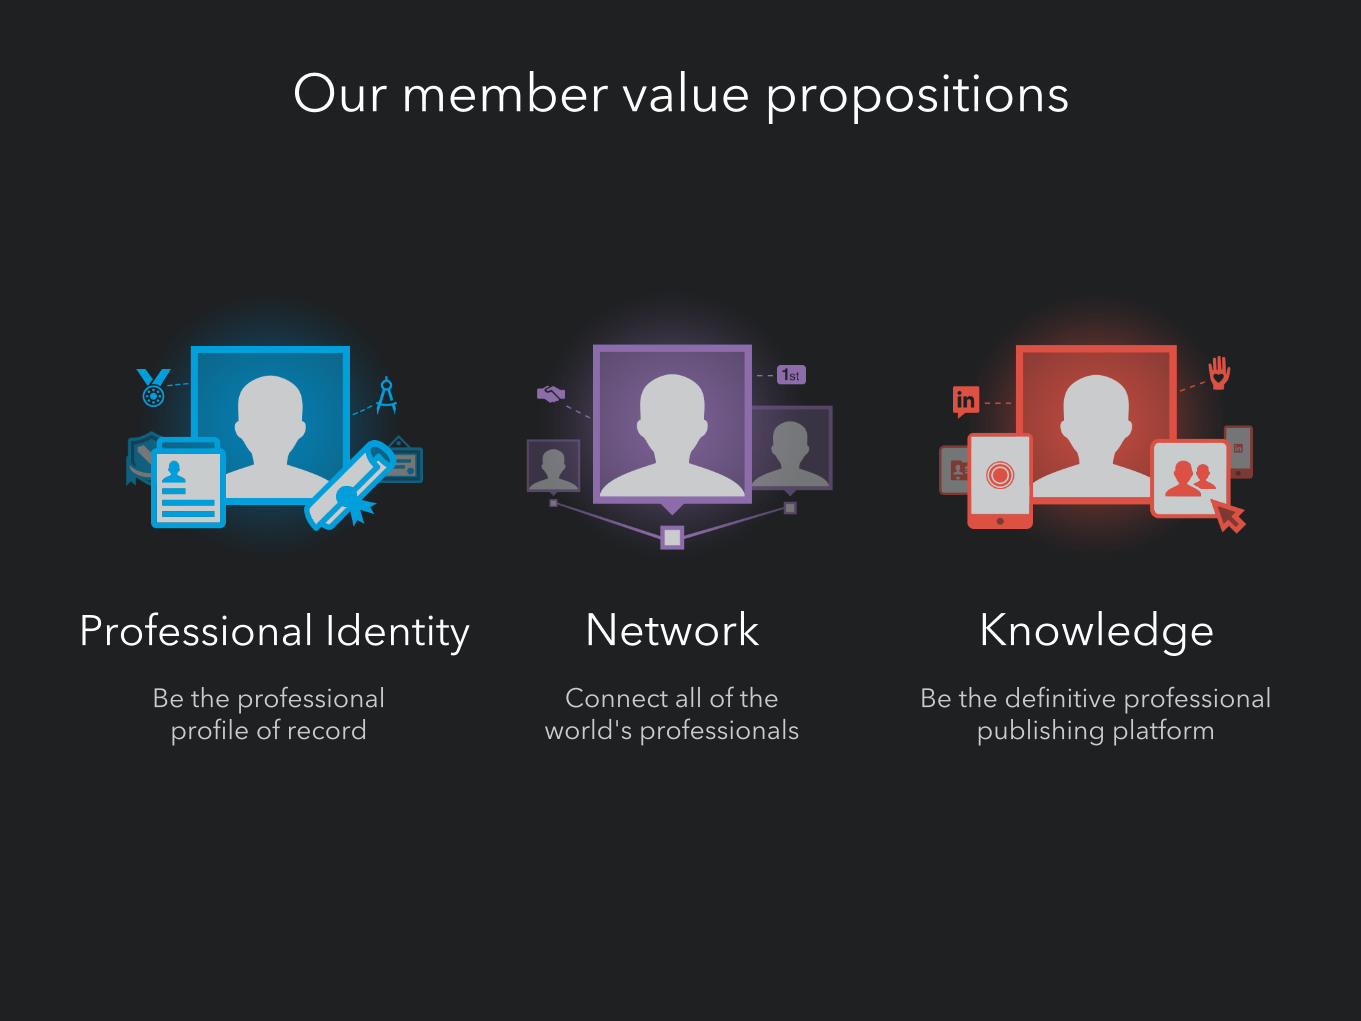
Our member value propositions
Professional IdentityBe the professional
profile of record
NetworkConnect all of the
world's professionals
KnowledgeBe the definitive professional
publishing platform
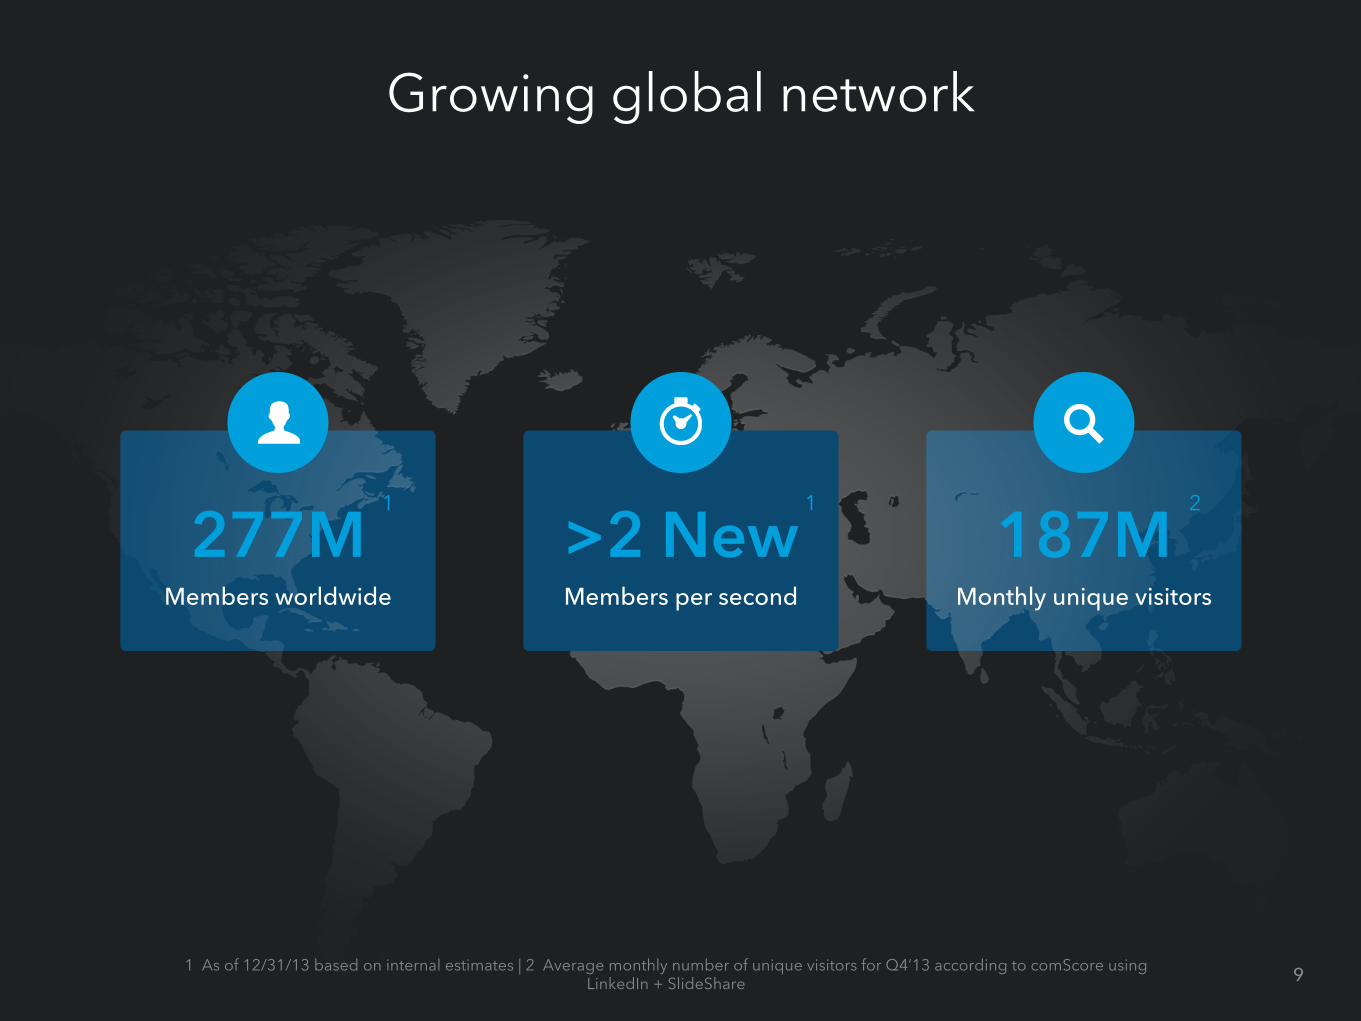
Growing global network
277MMembers worldwide
>2 NewMembers per second
187MMonthly unique visitors
1 As of 12/31/13 based on internal estimates | 2 Average monthly number of unique visitors for Q4’13 according to comScore using LinkedIn + SlideShare
1 1 2
9
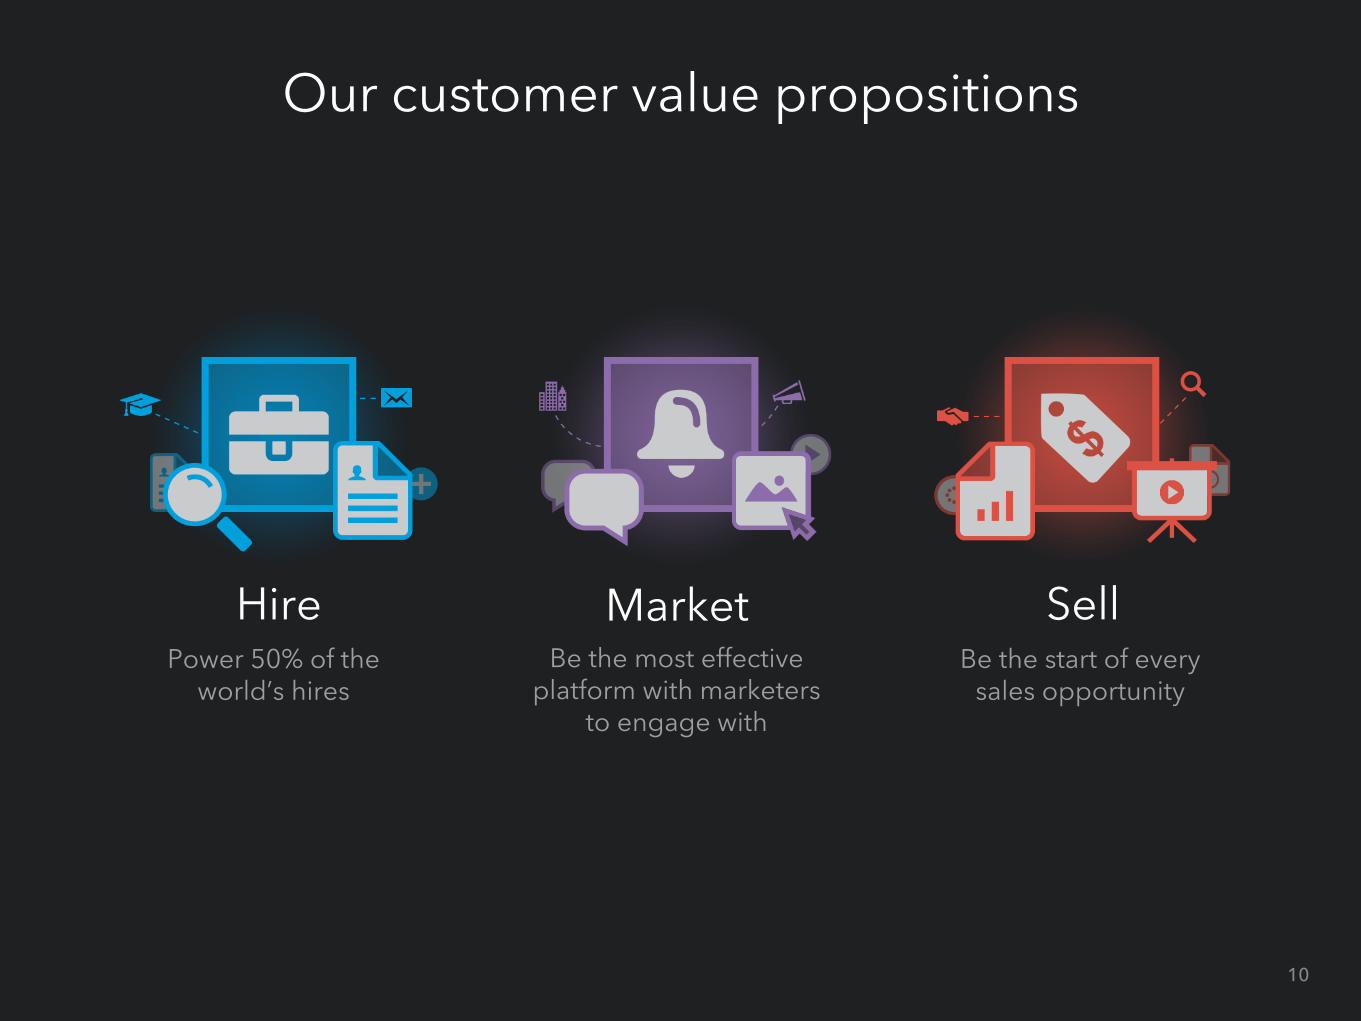
HirePower 50% of the
world’s hires
MarketBe the most effective
platform with marketers to engage with
SellBe the start of every
sales opportunity
Our customer value propositions
10
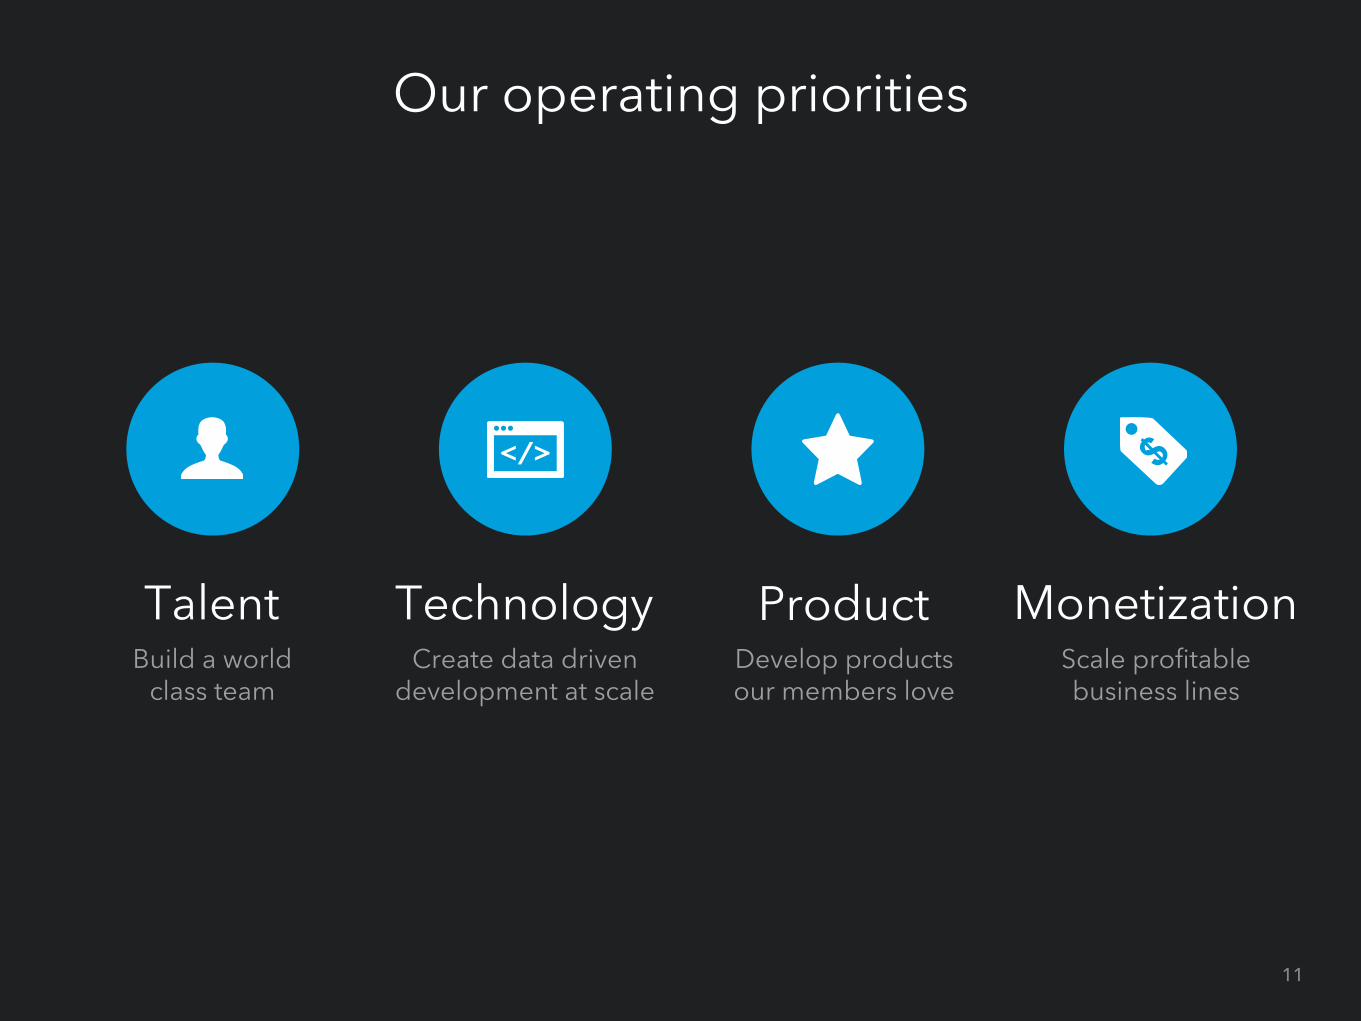
Our operating priorities
TalentBuild a world
class team
TechnologyCreate data driven
development at scale
ProductDevelop products our members love
MonetizationScale profitable business lines
11
Key metrics and results
12

Engagement metricsQ
1’11
Q2’
11
Q3’
11
Q4’
11
Q1’
12
Q2’
12
Q3’
12
Q4’
12
Q1’
13
Q2’
13
Q3’
13
Q4’
13
277
259
238
218
202
187
174
161
145
131
116
102
Members (mn)
Q1’
11
Q2’
11
Q3’
11
Q4’
11
Q1’
12
Q2’
12
Q3’
12
Q4’
12
Q1’
13
Q2’
13
Q3’
13
Q4’
13
139142143
132
116110
106103
9288
82
75
Unique visitors, comScore (mn)
Q1’
11
Q2’
11
Q3’
11
Q4’
11
Q1’
12
Q2’
12
Q3’
12
Q4’
12
Q1’
13
Q2’
13
Q3’
13
Q4’
13
10.6
11.611.7
11.1
9.8
8.99.39.4
7.67.67.17.1
Page views, comScore (bn)
1 comScore metrics reflect LinkedIn site only, not including SlideShare 13
1 1
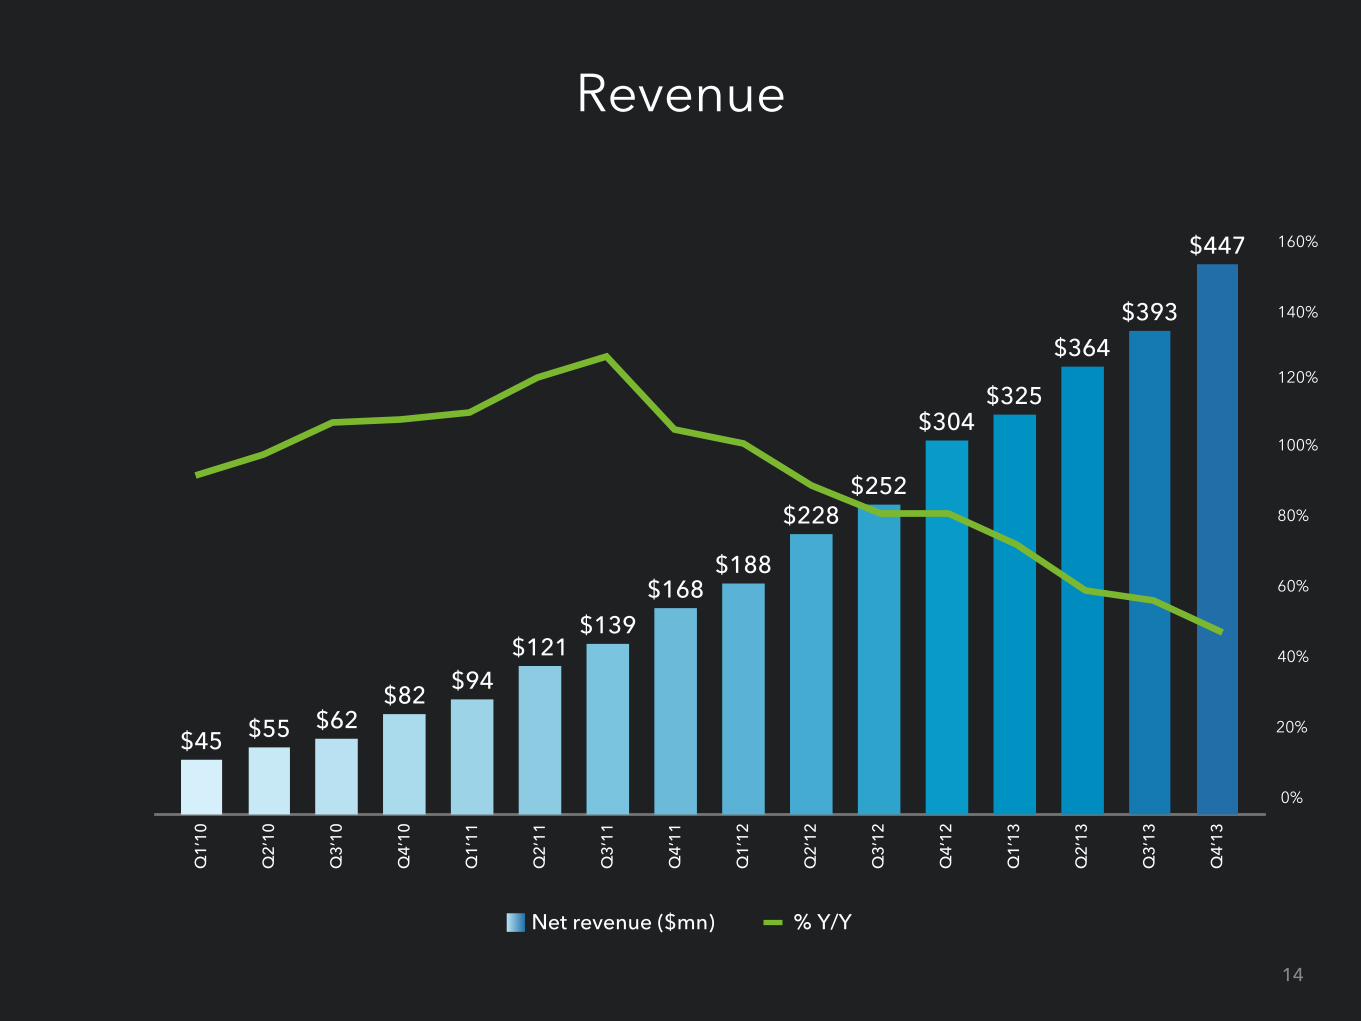
Revenue
Q1’
10
Q2’
10
Q3’
10
Q4’
10
Q1’
11
Q2’
11
Q3’
11
Q4’
11
Q1’
12
Q2’
12
Q3’
12
Q4’
12
Q1’
13
Q2’
13
Q3’
13
Q4’
13
$447
$393$364
$325$304
$252$228
$188$168
$139$121
$94$82$62$55$45
% Y/YNet revenue ($mn)
0%
20%
40%
60%
80%
100%
120%
140%
14
160%

Revenue by productQ
1’10
Q2’
10
Q3’
10
Q4’
10
Q1’
11
Q2’
11
Q3’
11
Q4’
11
Q1’
12
Q2’
12
Q3’
12
Q4’
12
Q1’
13
Q2’
13
Q3’
13
Q4’
13
Talent Solutions Marketing Solutions Premium Subscriptions
38%32%30%
40%33%27%
44%
30%25%
44%
34%
22%
49%
29%
21%
48%
32%
20%
51%
29%
20%
51%
30%
20%
54%
25%
20%
53%
28%
19%
55%
25%
20%
53%
27%
20%
57%
23%
20%
56%
24%
20%
57%
23%
20%
$45 $55 $62$82 $94
$121$139
$168$188
$228$252
$304$325
$364
$393
15
55%
25%
20%
$447
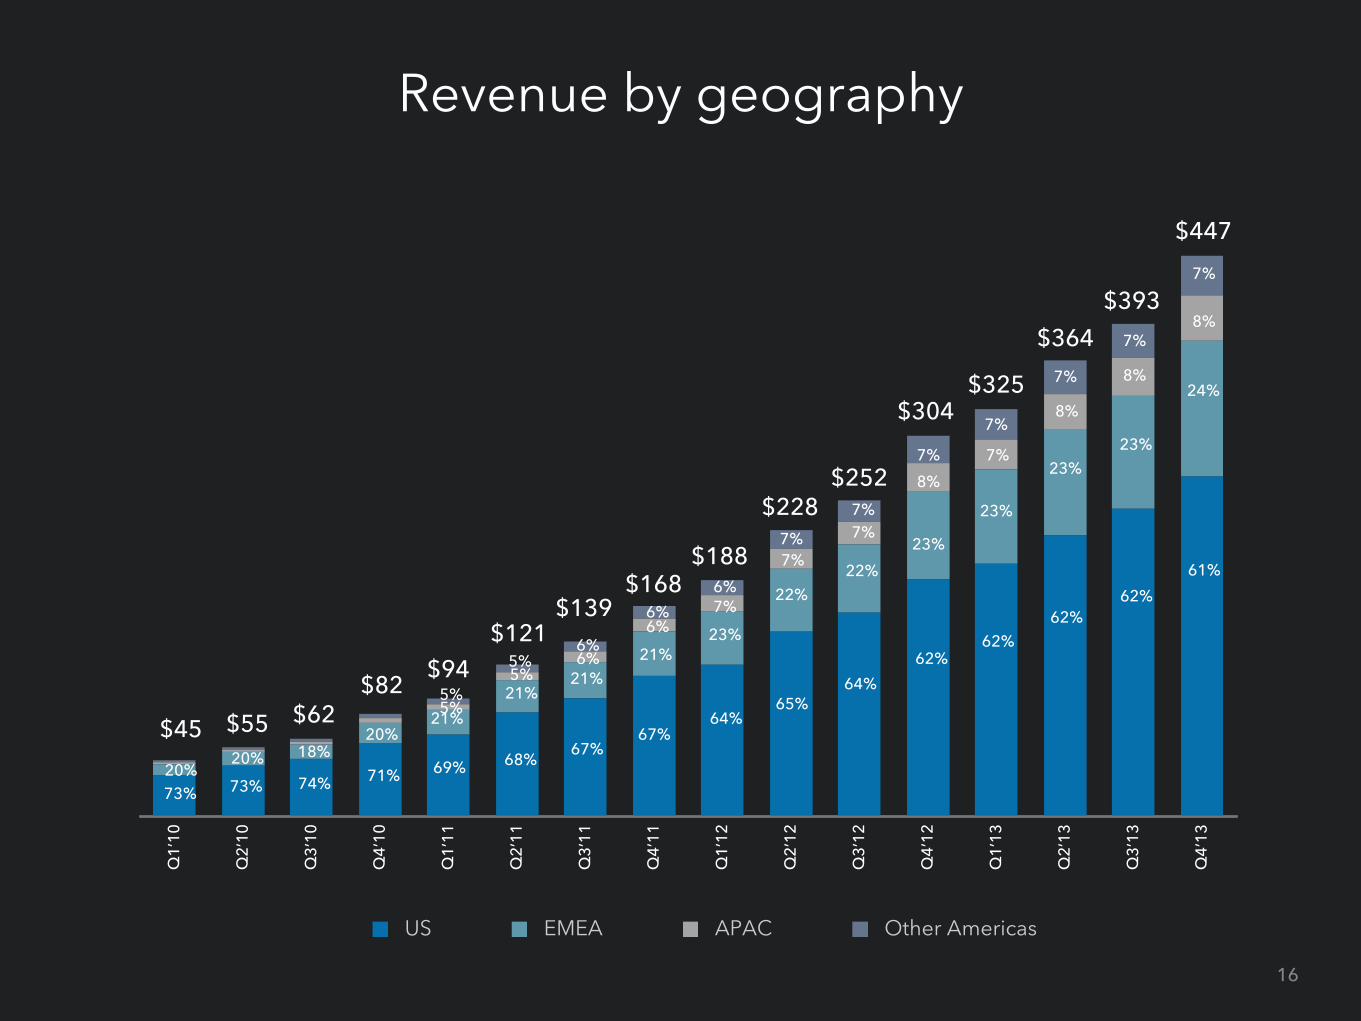
Revenue by geographyQ
1’10
Q2’
10
Q3’
10
Q4’
10
Q1’
11
Q2’
11
Q3’
11
Q4’
11
Q1’
12
Q2’
12
Q3’
12
Q4’
12
Q1’
13
Q2’
13
Q3’
13
Q4’
13
US EMEA APAC Other Americas
73%20%
73%
20%
74%
18%71%
20%
69%
21%
68%
21%5%
67%
21%6%
67%
21%
6%
64%
23%
7%
65%
22%
7%
64%
22%
7%
62%
23%
8%
62%
23%
7%
62%
23%
8%
62%
23%
8%
$45 $55 $62$82
$94$121
$139$168
$188
$228$252
$304$325
$364$393
5%
5%5%
6%
6%
6%
7%
7%
7%
7%
7%
7%
16
61%
24%
8%
$447
7%
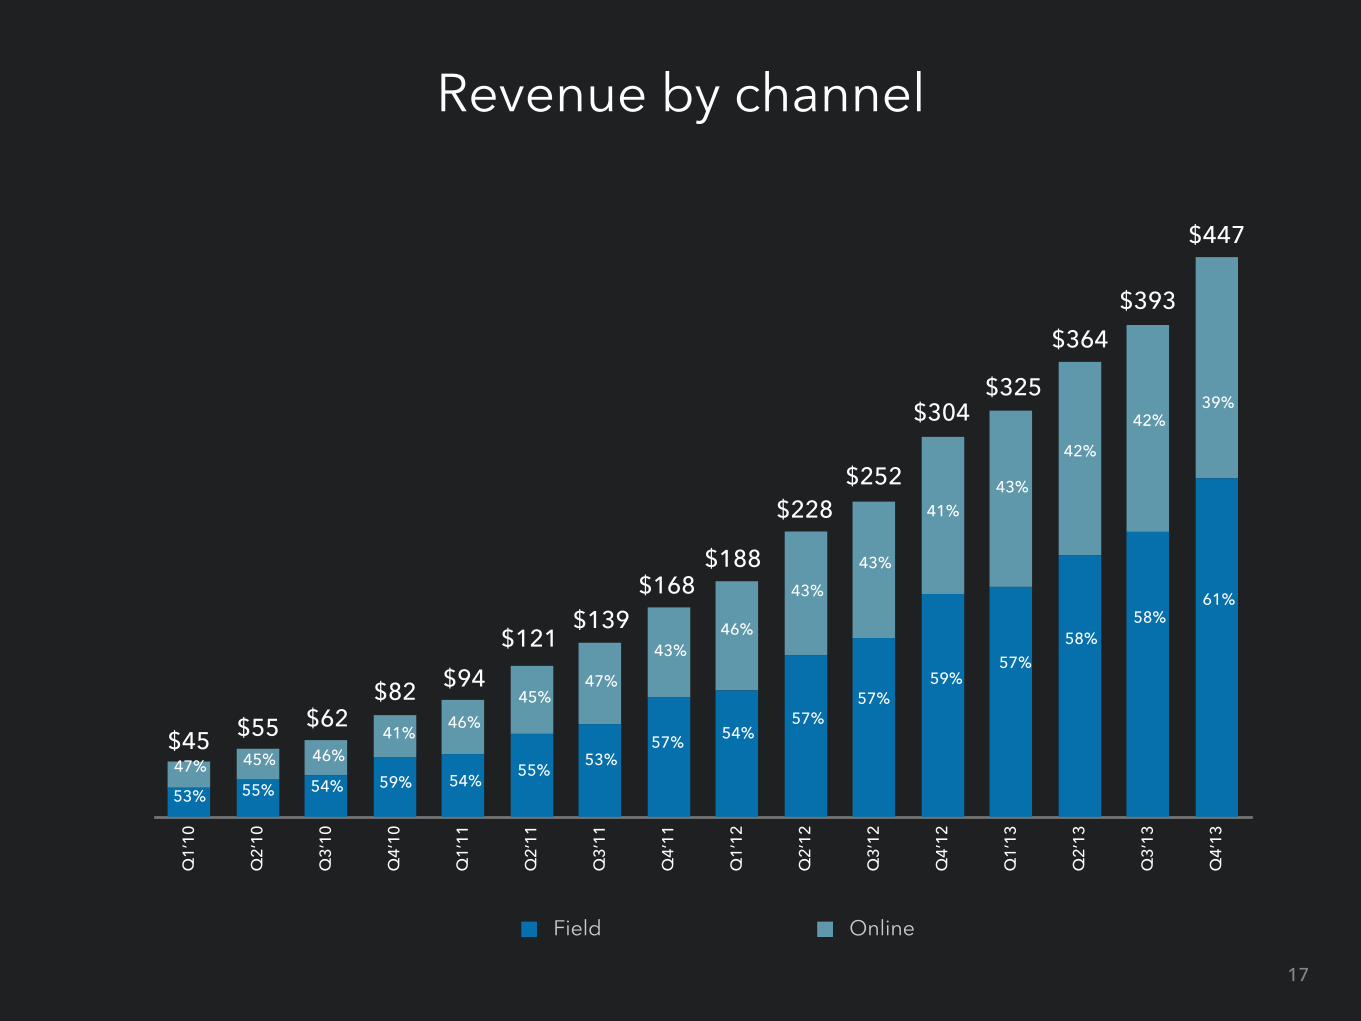
Revenue by channelQ
1’10
Q2’
10
Q3’
10
Q4’
10
Q1’
11
Q2’
11
Q3’
11
Q4’
11
Q1’
12
Q2’
12
Q3’
12
Q4’
12
Q1’
13
Q2’
13
Q3’
13
Q4’
13
Field Online
53%
47%55%
45%
54%
46%
59%
41%
54%
46%
55%
45%
53%
47%
57%
43%
54%
46%
57%
43%
57%
43%
59%
41%
57%
43%
58%
42%
58%
42%
$45 $55 $62$82 $94
$121$139
$168$188
$228$252
$304$325
$364
$393
17
61%
39%
$447
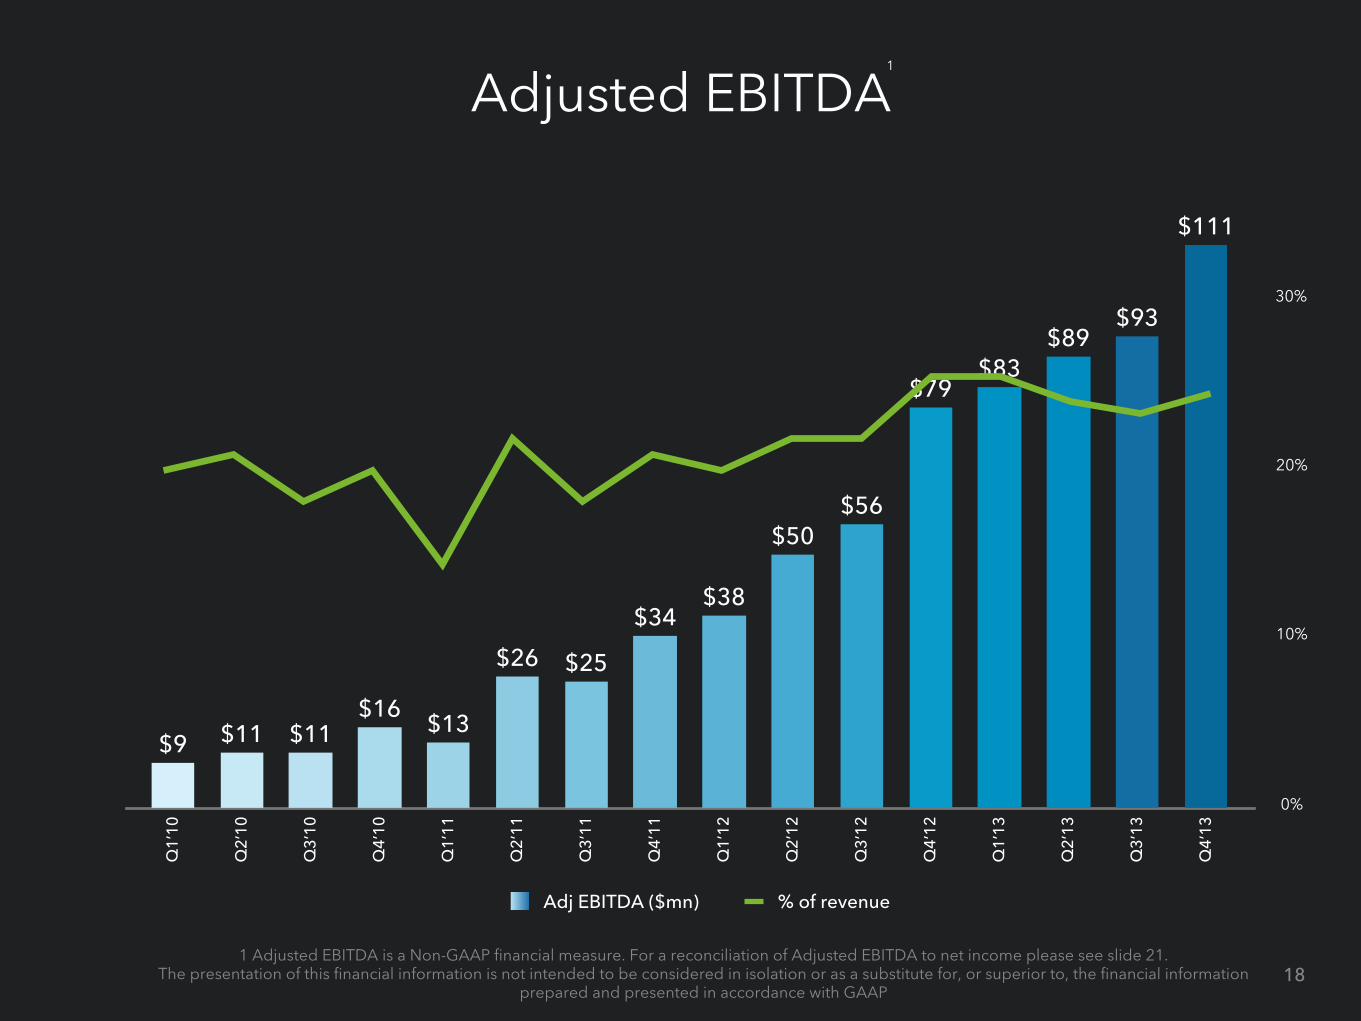
Adjusted EBITDAQ
1’10
Q2’
10
Q3’
10
Q4’
10
Q1’
11
Q2’
11
Q3’
11
Q4’
11
Q1’
12
Q2’
12
Q3’
12
Q4’
12
Q1’
13
Q2’
13
Q3’
13
Q4’
13
$111
$93$89
$83$79
$56$50
$38$34
$25$26
$13$16
$11$11$9
% of revenueAdj EBITDA ($mn)
0%
10%
20%
30%
181 Adjusted EBITDA is a Non-GAAP financial measure. For a reconciliation of Adjusted EBITDA to net income please see slide 21.
The presentation of this financial information is not intended to be considered in isolation or as a substitute for, or superior to, the financial information prepared and presented in accordance with GAAP
1
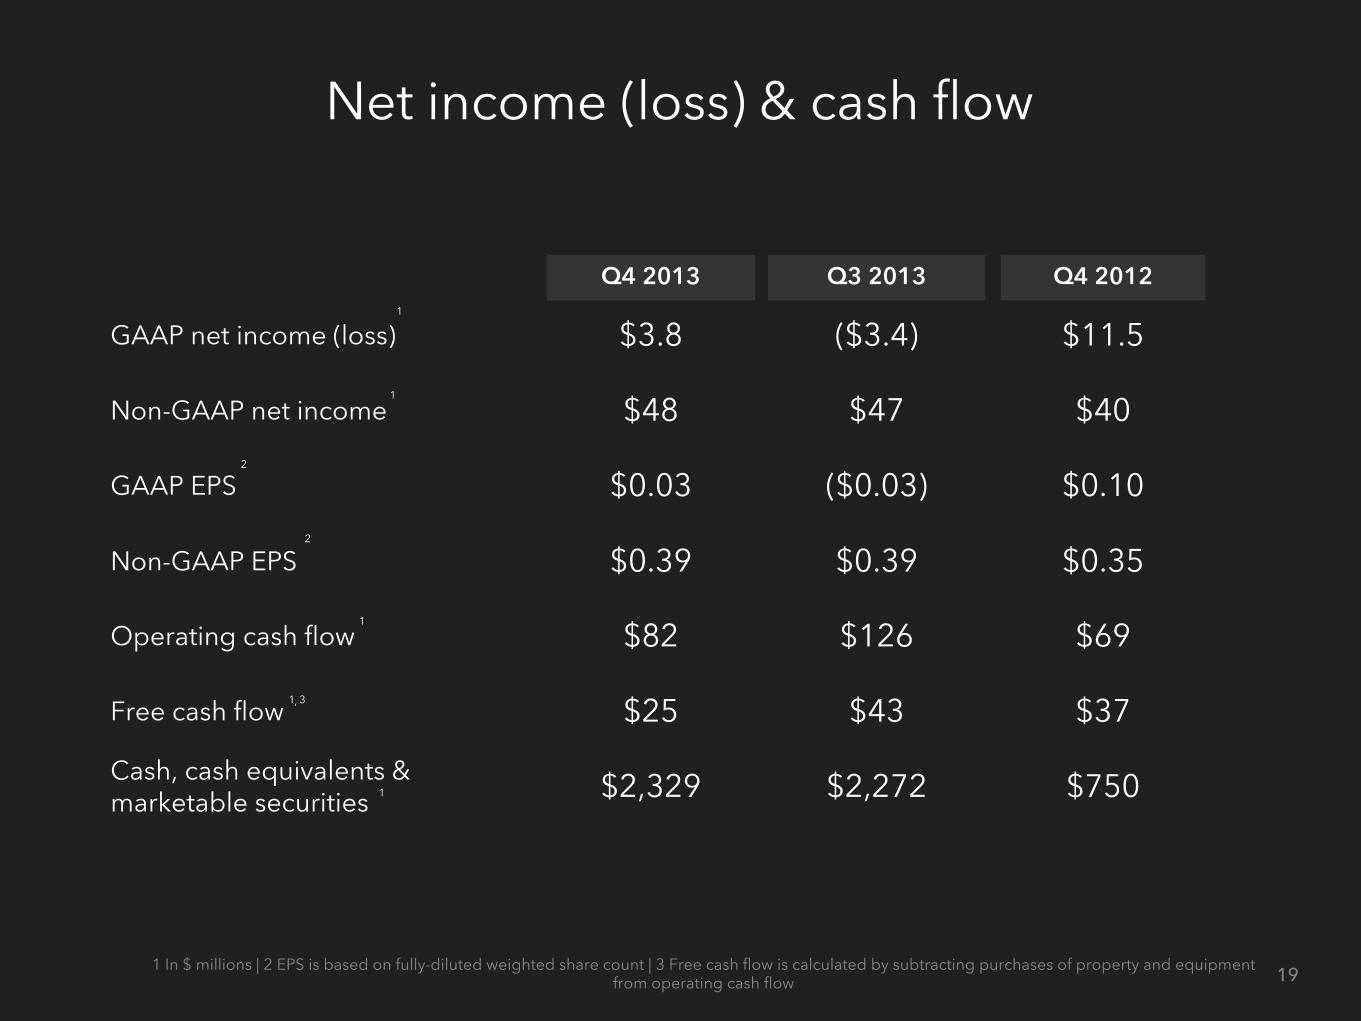
Net income (loss) & cash flow
Q4 2013 Q3 2013 Q4 2012
GAAP net income (loss) $3.8 ($3.4) $11.5
Non-GAAP net income $48 $47 $40
GAAP EPS $0.03 ($0.03) $0.10
Non-GAAP EPS $0.39 $0.39 $0.35
Operating cash flow $82 $126 $69
Free cash flow $25 $43 $37
Cash, cash equivalents & marketable securities $2,329 $2,272 $750
1 In $ millions | 2 EPS is based on fully-diluted weighted share count | 3 Free cash flow is calculated by subtracting purchases of property and equipment from operating cash flow 19
3
2
2
,
1
1
1
1
1
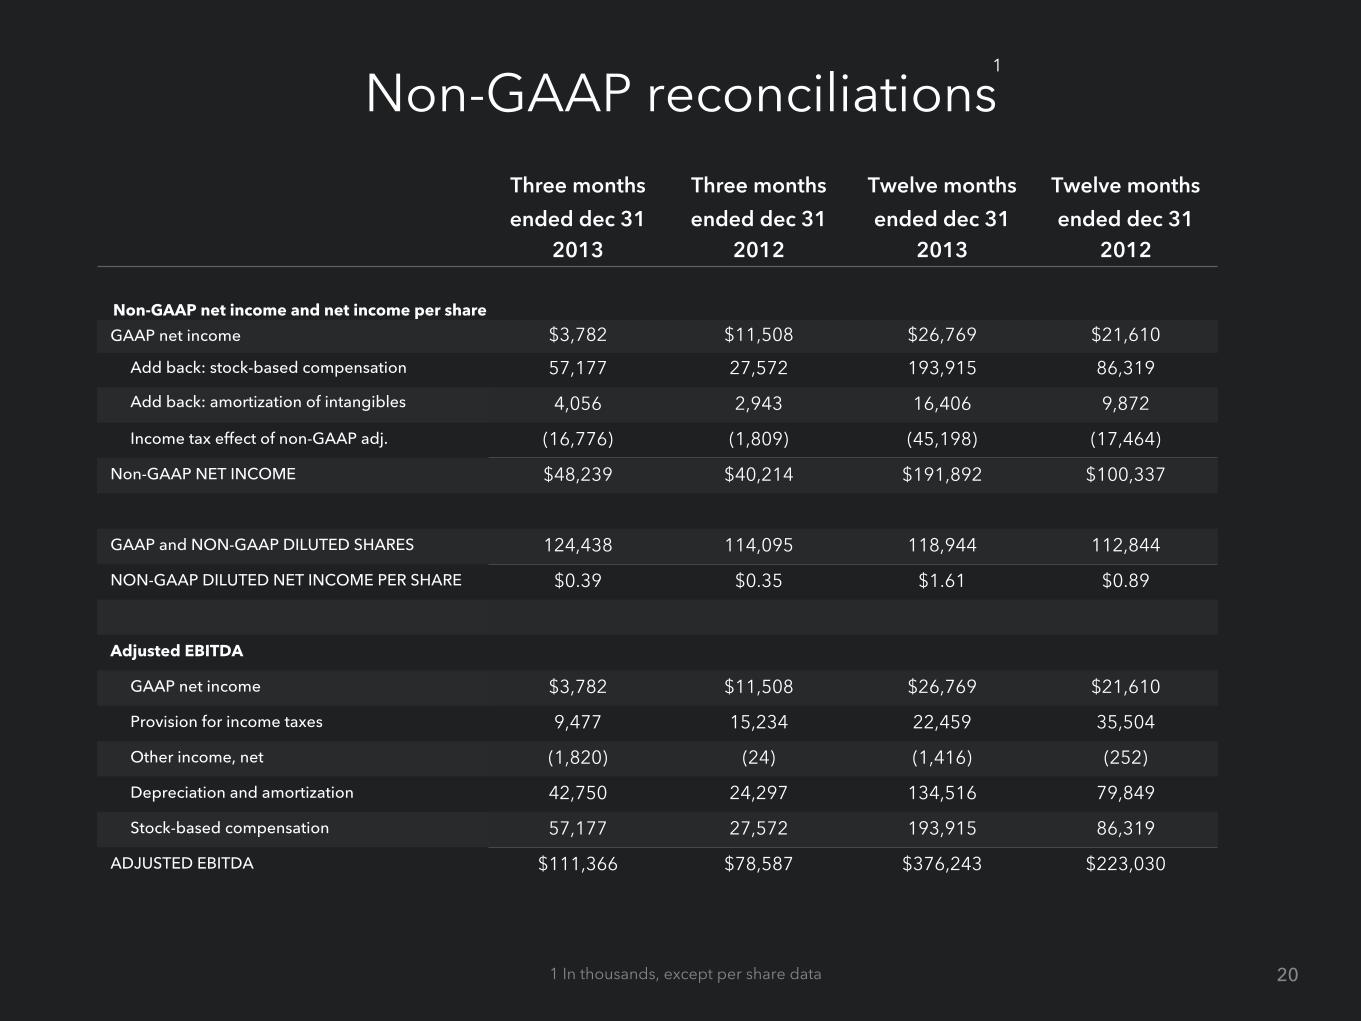
Non-GAAP reconciliations1
Three months Three months Twelve months Twelve monthsended dec 31 ended dec 31 ended dec 31 ended dec 31
2013 2012 2013 2012
Non-GAAP net income and net income per share GAAP net income $3,782 $11,508 $26,769 $21,610
Add back: stock-based compensation 57,177 27,572 193,915 86,319
Add back: amortization of intangibles 4,056 2,943 16,406 9,872
Income tax effect of non-GAAP adj. (16,776) (1,809) (45,198) (17,464)
Non-GAAP NET INCOME $48,239 $40,214 $191,892 $100,337
GAAP and NON-GAAP DILUTED SHARES 124,438 114,095 118,944 112,844
NON-GAAP DILUTED NET INCOME PER SHARE $0.39 $0.35 $1.61 $0.89
Adjusted EBITDA
GAAP net income $3,782 $11,508 $26,769 $21,610
Provision for income taxes 9,477 15,234 22,459 35,504
Other income, net (1,820) (24) (1,416) (252)
Depreciation and amortization 42,750 24,297 134,516 79,849
Stock-based compensation 57,177 27,572 193,915 86,319
ADJUSTED EBITDA $111,366 $78,587 $376,243 $223,030
201 In thousands, except per share data
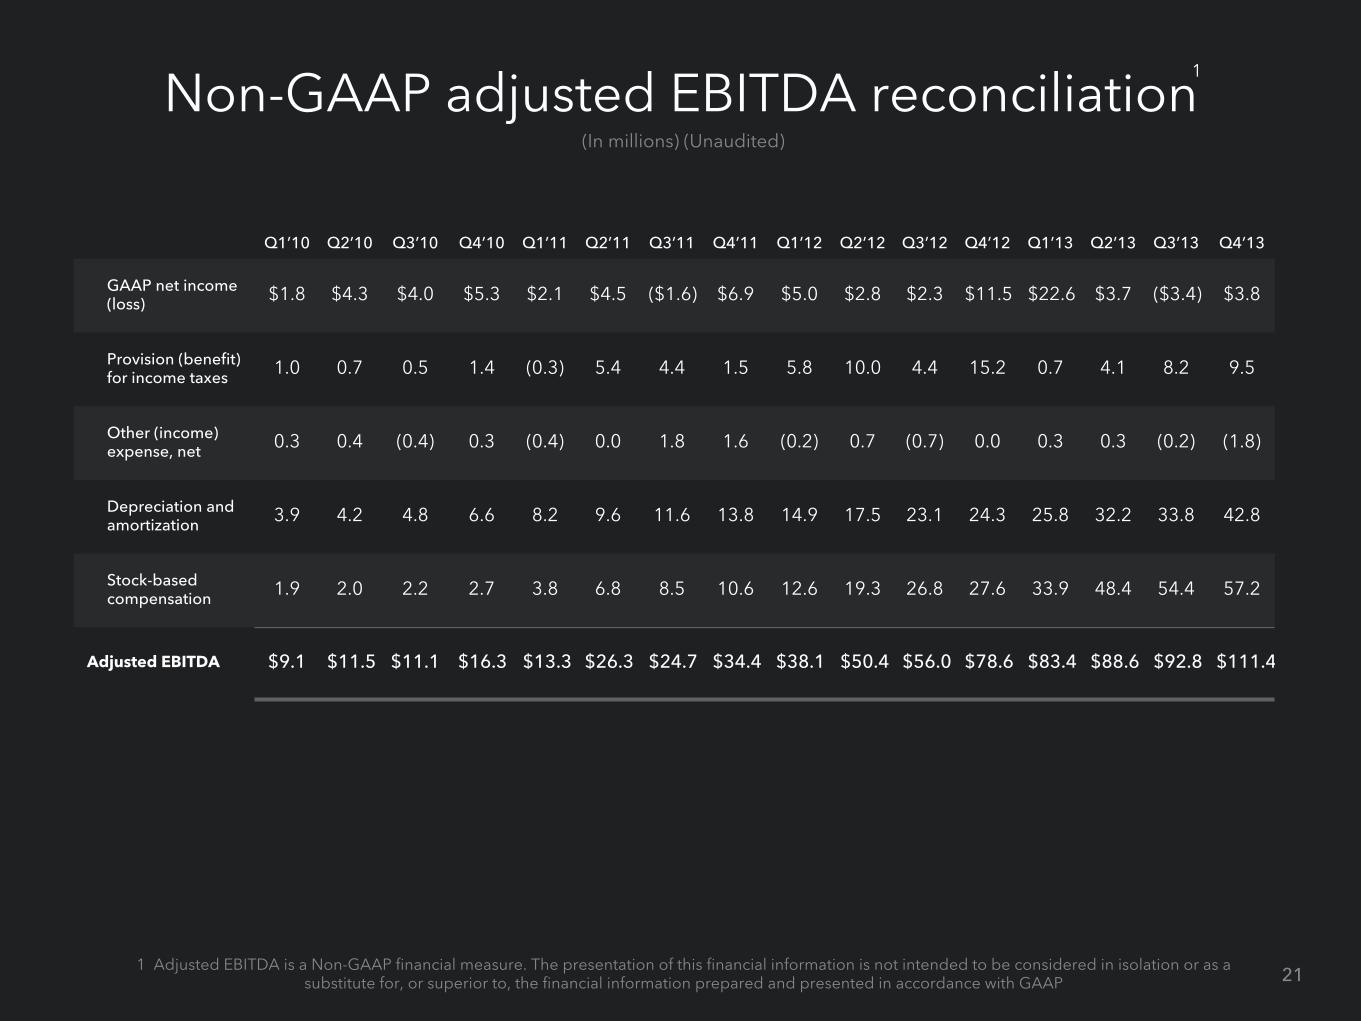
Non-GAAP adjusted EBITDA reconciliation(In millions) (Unaudited)
Q1’10 Q2’10 Q3’10 Q4’10 Q1’11 Q2’11 Q3’11 Q4’11 Q1’12 Q2’12 Q3’12 Q4’12 Q1’13 Q2’13 Q3’13 Q4’13
GAAP net income (loss) $1.8 $4.3 $4.0 $5.3 $2.1 $4.5 ($1.6) $6.9 $5.0 $2.8 $2.3 $11.5 $22.6 $3.7 ($3.4) $3.8
Provision (benefit) for income taxes 1.0 0.7 0.5 1.4 (0.3) 5.4 4.4 1.5 5.8 10.0 4.4 15.2 0.7 4.1 8.2 9.5
Other (income) expense, net 0.3 0.4 (0.4) 0.3 (0.4) 0.0 1.8 1.6 (0.2) 0.7 (0.7) 0.0 0.3 0.3 (0.2) (1.8)
Depreciation and amortization 3.9 4.2 4.8 6.6 8.2 9.6 11.6 13.8 14.9 17.5 23.1 24.3 25.8 32.2 33.8 42.8
Stock-based compensation 1.9 2.0 2.2 2.7 3.8 6.8 8.5 10.6 12.6 19.3 26.8 27.6 33.9 48.4 54.4 57.2
Adjusted EBITDA $9.1 $11.5 $11.1 $16.3 $13.3 $26.3 $24.7 $34.4 $38.1 $50.4 $56.0 $78.6 $83.4 $88.6 $92.8 $111.4
211 Adjusted EBITDA is a Non-GAAP financial measure. The presentation of this financial information is not intended to be considered in isolation or as a substitute for, or superior to, the financial information prepared and presented in accordance with GAAP
1
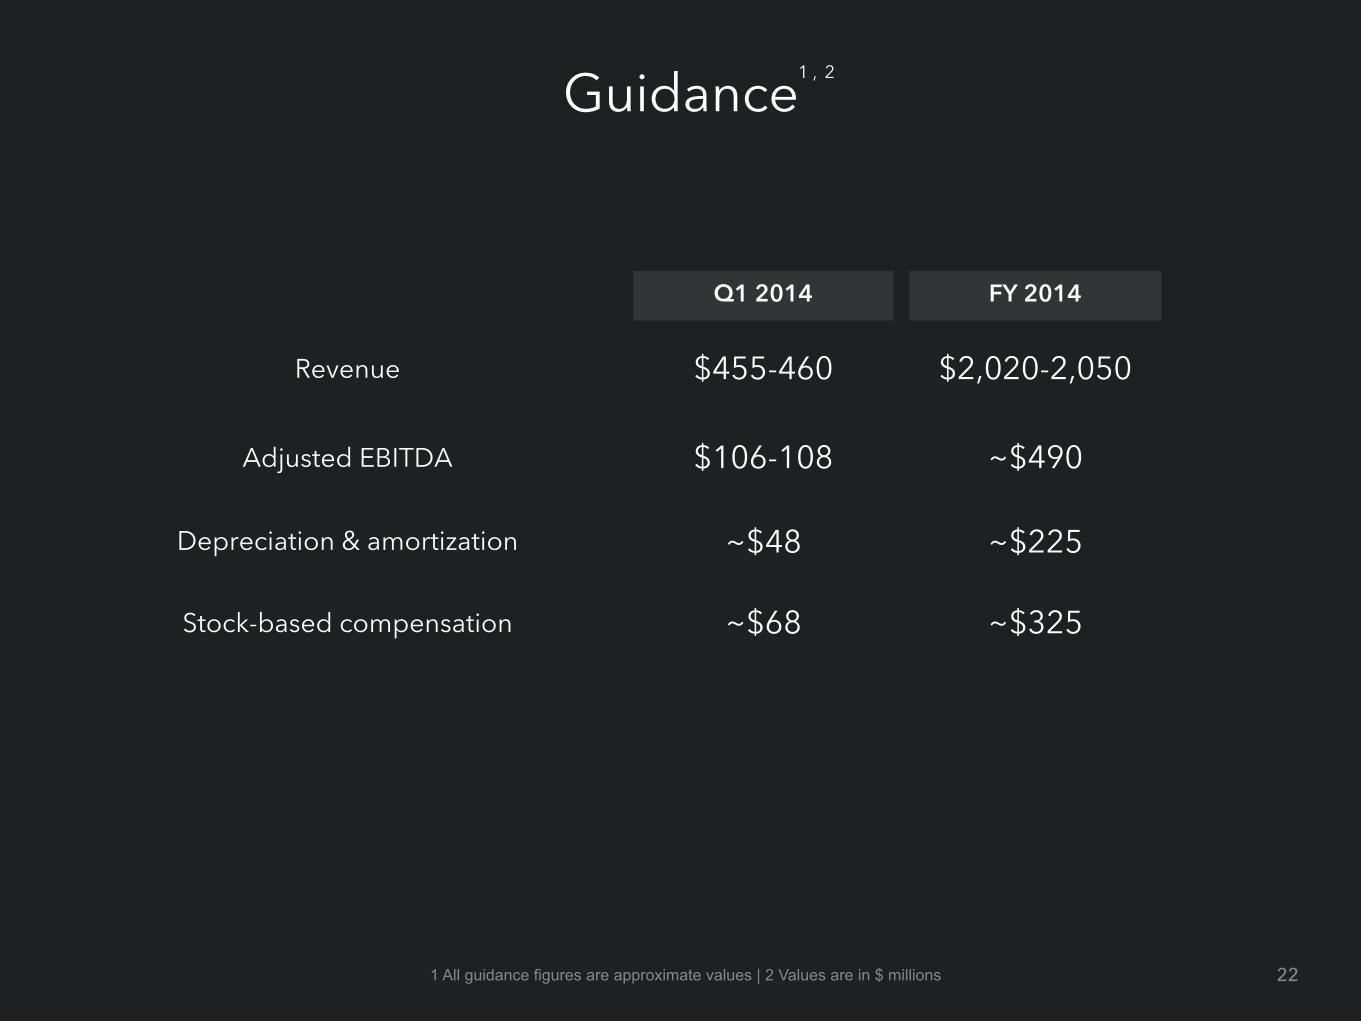
Guidance
Q1 2014 FY 2014
Revenue $455-460 $2,020-2,050
Adjusted EBITDA $106-108 ~$490
Depreciation & amortization ~$48 ~$225
Stock-based compensation ~$68 ~$325
22
1
1 All guidance figures are approximate values | 2 Values are in $ millions
, 2

Thank you
23

©2013 LinkedIn Corporation. All Rights Reserved.
Top Related