2020 Q4 Earnings Call
14
© Welbilt, Inc. 2020 Q4 Earnings Call February 25, 2021 1
Transcript of 2020 Q4 Earnings Call

© Welbilt, Inc.
2020 Q4 Earnings Call
February 25, 2021
1

© Welbilt, Inc.Investor Day 2019
Forward-Looking Statements
2
Certain statements in this presentation constitute “forward-looking statements” within the meaning of the U.S. Private Securities Litigation Reform Act of 1995. Statements contained in this presentation that are not historical facts are forward-looking statements and include, for example, the Company’s expectations regarding future results, the impact of COVID-19 on our business, including on customer demand, supply chains and production, ability to meet working capital needs and cash requirements over the next 12 months, ability to realize savings from reductions in force and other cost saving measures, compliance with the financial covenants under our credit facility, ability to obtain financial and tax benefits from the CARES Act, descriptions of our Transformation Program, operating and strategic plans and any assumptions on which those programs, expectations, outlook or plans are based. Such forward-looking statements involve known and unknown risks and uncertainties, and our actual results could differ materially from future results expressed or implied in these forward-looking statements. The forward-looking statements included in this presentation are based on our current beliefs and expectations and speak only as of the date hereof. These statements are not guarantees or indicative of future performance. Important assumptions, risks, uncertainties and factors that could cause actual results to differ materially from those forward-looking statements are described in more detail under the caption "Risk Factors" in our most recent Annual Report on Form 10-K, Quarterly Reports on Form 10-Q and in our other filings with the Securities and Exchange Commission. We do not intend, and, except as required by law, we undertake no obligation, to update any of our forward-looking statements after the date of this presentation to reflect any future events or circumstances. Given these risks and uncertainties, readers are cautioned not to place undue reliance on such forward-looking statements.
Non-GAAP Financial Measures
The Company uses certain non-GAAP financial measures in this presentation. These non-GAAP financial measures should not be considered as an alternative to our financial information presented in accordance with U.S. GAAP as they have important limitations as analytical tools. Reconciliations of these non-GAAP financials measures to the most comparable U.S. GAAP measures can be found in our earnings release for the fourth quarter of 2020, which is available in the Investor Relations section of our website, www.welbilt.com, together with this presentation.
© Welbilt, Inc.Investor Day 2019
Current Market Environment
3
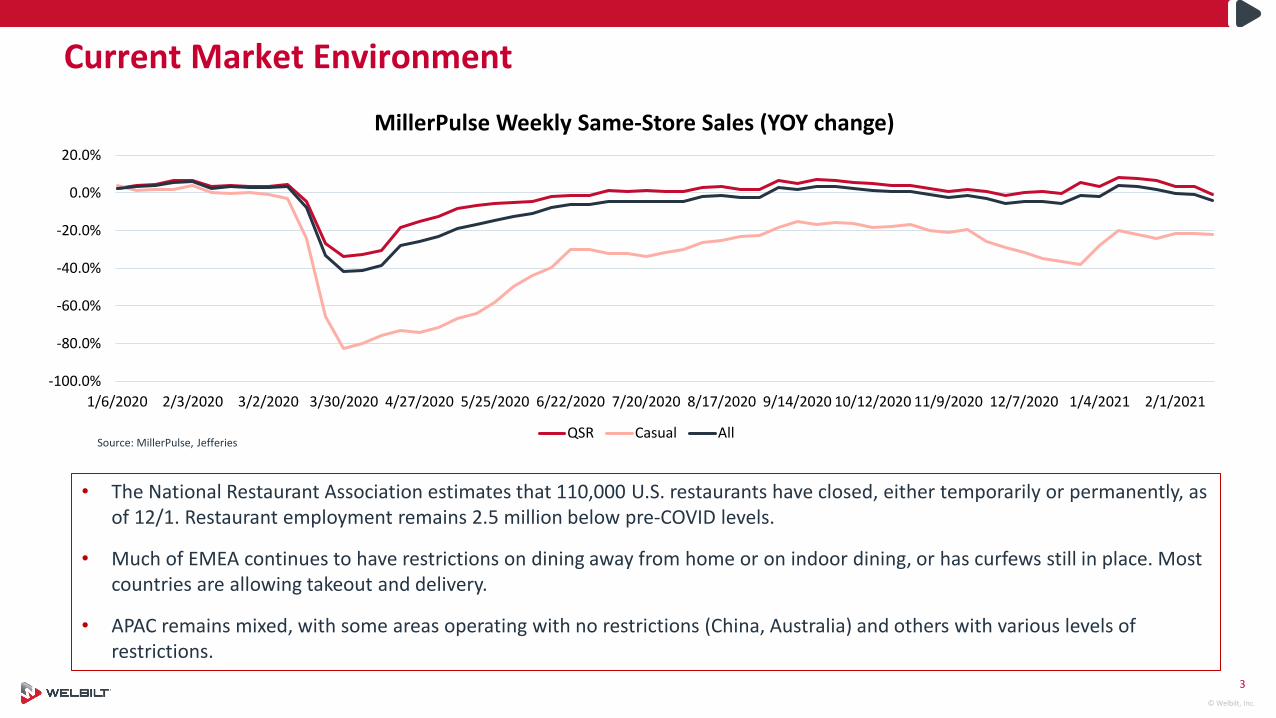
• The National Restaurant Association estimates that 110,000 U.S. restaurants have closed, either temporarily or permanently, as of 12/1. Restaurant employment remains 2.5 million below pre-COVID levels.
• Much of EMEA continues to have restrictions on dining away from home or on indoor dining, or has curfews still in place. Mostcountries are allowing takeout and delivery.
• APAC remains mixed, with some areas operating with no restrictions (China, Australia) and others with various levels of restrictions.
-100.0%
-80.0%
-60.0%
-40.0%
-20.0%
0.0%
20.0%
1/6/2020 2/3/2020 3/2/2020 3/30/2020 4/27/2020 5/25/2020 6/22/2020 7/20/2020 8/17/2020 9/14/2020 10/12/2020 11/9/2020 12/7/2020 1/4/2021 2/1/2021
MillerPulse Weekly Same-Store Sales (YOY change)
QSR Casual AllSource: MillerPulse, Jefferies

© Welbilt, Inc.Investor Day 20194
2020 Q4 Financial Highlights(US$ in millions except per share amounts)
$381.8
$320.0
$0.0
$100.0
$200.0
$300.0
$400.0
$500.0
2019 Q4 2020 Q4
Net Sales (16.2%)
Organic (17.6%); Foreign Currency Translation +1.4% 1
Q4 2019 Q4 2020 ∆
Adjusted Operating EBITDA1 $71.2 $60.0 (15.7%)
Adjusted Operating EBITDA margin1 18.6% 18.8% +20 bps
Adjusted Diluted Net Earnings Per Share1 $0.19 $0.15 (21.1%)
Free Cash Flow1 $34.3 $37.7 +9.9%
1 See Welbilt’s 2020 Q4 earnings release for the reconciliations from GAAP to non-GAAP measures.

© Welbilt, Inc.Investor Day 20195
2020 Q4 Segment Sales - Americas(US$ in millions)
$247.1 $209.8
$0.0
$100.0
$200.0
$300.0
$400.0
2019 Q4 2020 Q4
Third-Party Net Sales (15.1%)
1 See Welbilt’s 2020 Q4 earnings release for the reconciliations from GAAP to non-GAAP measures.
Organic (15.2%); Foreign Currency Translation +0.1%1
Highlights:- General market
+ Large chains
- KitchenCare® aftermarket sales
• Large chain sales benefited from improved rollout activity including higher shipments of Merrychef® high-speed ovens for new global customer that began in Q3
• C-Stores supported a smaller decline in general market with small rollouts of Convotherm® and Merrychef ovens
• KitchenCare aftermarket sales decreased primarily due to non-recurrence of bulk buys from master parts distributors in 2019 Q4

© Welbilt, Inc.Investor Day 20196
2020 Q4 Segment Sales - EMEA(US$ in millions)
1 See Welbilt’s 2020 Q4 earnings release for the reconciliations from GAAP to non-GAAP measures.
$71.0
$59.9
$0.0
$25.0
$50.0
$75.0
$100.0
2019 Q4 2020 Q4
Third-Party Net Sales (15.6%)
Organic (21.1%); Foreign Currency Translation +5.5% 1
Highlights:- General market
- Large chains
- KitchenCare® aftermarket sales
• Large chains were impacted by strong prior year QSR sales
• Similar decline in general market due to local dine-out restrictions
• Crem benefited from small rollout with a local governmental entity that began in Q3, and from the transfer of a customer that was in APAC’s results in 2019

© Welbilt, Inc.Investor Day 20197
2020 Q4 Segment Sales - APAC(US$ in millions)
1 See Welbilt’s 2020 Q4 earnings release for the reconciliations from GAAP to non-GAAP measures.
Highlights:- General market
- Large chains
- KitchenCare® aftermarket sales
• Sales in Australia, Japan and Malaysia increased year-over-year
• China sales decreased primarily due to rollouts in 2019 Q4, and from a Crem customer whose sales were in China in 2019 but transferred to EMEA in 2020
• Other areas in Asia remained weak during the quarter
$63.7
$50.3
$0.0
$25.0
$50.0
$75.0
$100.0
2019 Q4 2020 Q4
Third-Party Net Sales (21.0%)
Organic (23.1%); Foreign Currency Translation +2.1% 1

© Welbilt, Inc.Investor Day 20198
Transformation Program ProgressCategory Progress
Procurement- Most RFQ responses from vendors have been reviewed, product qualification and testing will continue into 2021- Savings continued to ramp with some early benefits still capitalized into inventory, while P/L reflects some transitional costs- Focus on “VAVE” initiatives to drive additional savings
Manufacturing Sites + KitchenCare
- Productivity gains emerging in most sites (some substantial) despite lower volumes and partial shifts; still bringing more automation and process changes to bear into 2021
- Relocation of lines, site redesign expenses and other disruptions raising costs during transition window- Headcount reductions from productivity improvements began in 2019 Q4 and continued through 2020; additional reductions
expected through 2021- Consolidation of 2nd Shreveport manufacturing plant into primary plant expected to be completed during first half of 2021
2020 Savings Targets
- Q4 in-period savings of approximately $5 million (run-rate savings of $20 million)- Pace of savings will be slower than anticipated due to COVID-19; 2020-2021 procurement dollar savings to P/L delayed by
lower volumes and inventory effects; 2020 manufacturing savings were slower due to temporary plant shutdowns and furloughs, along with lower volumes to leverage – likely to continue into 2021 but pace expected to improve through year
Remain confident in savings targets; activities expected to be completed by end of 2021 but it will take longer to achieve full $75 million savings and margin improvement due to COVID-19
Transformation Program Expense
- 2020 Q4: $2.4 million external costs, ($0.2) million Transformation-related restructuring costs, combined $2.2 million- Since inception: $58.6 million external costs, $8.8 million Transformation-related restructuring costs, combined $67.4 million- Pace of external spending has begun ramping down; expect total Transformation Program expense to be in lower half of
expected $75 to $85 million range

© Welbilt, Inc.Investor Day 20199
Integrated Digital Platform: KitchenConnect 3.0 and Common Controller
• KitchenConnect® is our award-winning open cloud digital solution for the foodservice industry that improves efficiency, reduces costs, and enhances food quality. We launched our latest version of KitchenConnect (version 3.0) in Q3 and are working to convert existing customers to the upgraded platform.
• Our common controller provides consistent menu screens, logic and connectivity across all of our equipment. We also launched the common controller in our first brands in Q3. We expect to have the common controller launched in the majority of our remaining brands in 2021 Q1.
• Multiple chains have expressed interest in adopting KitchenConnect into the operations.
• The integration of KitchenConnect 3.0 with our common controller gives Welbilt the easiest and lowest-cost connectivity with industry-leading data capabilities.
Menu
Service
Asset Quality
Report
KitchenConnect 3.0 Sample Dashboard
KitchenConnect Capabilities
© Welbilt, Inc.Investor Day 201910
Ghost Kitchen Growth Will Increase in 2021
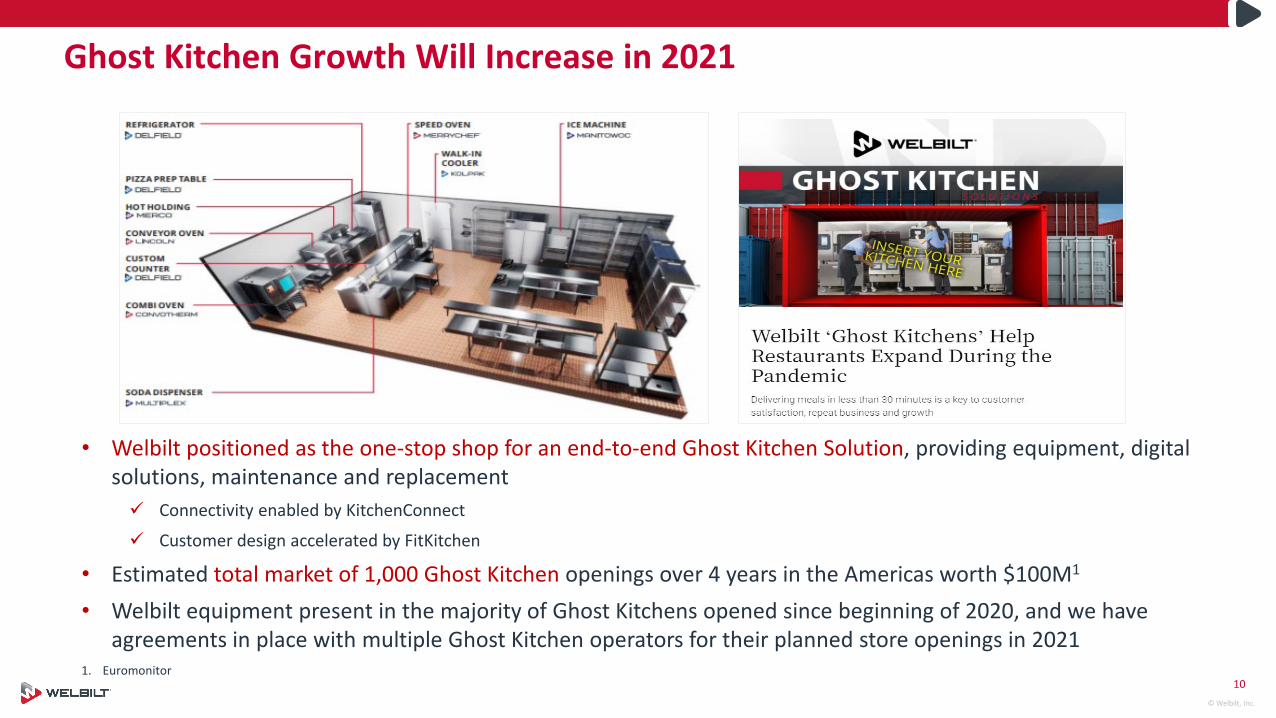
• Welbilt positioned as the one-stop shop for an end-to-end Ghost Kitchen Solution, providing equipment, digital solutions, maintenance and replacement Connectivity enabled by KitchenConnect
Customer design accelerated by FitKitchen
• Estimated total market of 1,000 Ghost Kitchen openings over 4 years in the Americas worth $100M1
• Welbilt equipment present in the majority of Ghost Kitchens opened since beginning of 2020, and we have agreements in place with multiple Ghost Kitchen operators for their planned store openings in 2021
1. Euromonitor

© Welbilt, Inc.Investor Day 201911
2020 Q4 Adjusted Operating EBITDA1 Margin Highlights
1 See Welbilt’s 2020 Q4 earnings release for the reconciliations from GAAP to non-GAAP measures.
Q4 2019 Adjusted Operating EBITDA1 margin 18.6%
- Volume/net pricing (100 bps)
- Material costs and tariffs +30 bps
- Other manufacturing: labor and overhead +20 bps
- SG&A +70 bps
- FX/other --- bps
Q4 2020 Adjusted Operating EBITDA1 margin 18.8%

© Welbilt, Inc.Investor Day 201912
2020 Q4 Free Cash Flow1 and Capital StructureUS$ in millions
$88 $89
$118$131
$149$140
$123 $125
$50
$75
$100
$125
$150
$175
2019 Q1 2019 Q2 2019 Q3 2019 Q4 2020 Q1 2020 Q2 2020 Q3 2020 Q4
Cash & Short-term Investments
Mar 31, 2019
Jun 30, 2019
Sep 30, 2019
Dec 31, 2019
Mar 31, 2020
Jun 30, 2020
Sep 30, 2020
Dec 31, 2020
1 See Welbilt’s 2020 Q4 earnings release for the reconciliations from GAAP to non-GAAP measures.2 Total Liquidity is defined as Cash & Short-term Investments plus availability on the Revolving Credit Facility.
-$69
$54 $54$34
-$78
$3
$32 $38
($100)
($50)
$0
$50
$100
2019 Q1 2019 Q2 2019 Q3 2019 Q4 2020 Q1 2020 Q2 2020 Q3 2020 Q4
Free Cash Flow 1
$1,525$1,471 $1,448 $1,424
$1,527 $1,517$1,465
$1,425
$1,000
$1,200
$1,400
$1,600
2019 Q1 2019 Q2 2019 Q3 2019 Q4 2020 Q1 2020 Q2 2020 Q3 2020 Q4
Total Debt
Mar 31, 2019
Jun 30, 2019
Sep 30, 2019
Dec 31, 2019
Mar 31, 2020
Jun 30, 2020
Sep 30, 2020
Dec 31, 2020
March 31, 2019 impacted by termination of off-balance sheet AR Securitization facility balance of $97M moving to revolver
$242
$297
$349$385
$300 $298$333
$375
$200
$250
$300
$350
$400
$450
2019 Q1 2019 Q2 2019 Q3 2019 Q4 2020 Q1 2020 Q2 2020 Q3 2020 Q4
Total Liquidity 2
Mar 31, 2019
Jun 30, 2019
Sep 30, 2019
Dec 31, 2019
Jun 30, 2020
Sep 30, 2020
Mar 31, 2020
Dec 31, 2020
© Welbilt, Inc.Investor Day 201913
Initial Thoughts on 2021
• Only guidance being provided is for first quarter sales, which we expect to decrease between 11 and 16% compared to 2020 Q1. We will not reinstate additional guidance until conditions have sufficiently stabilized.
• We believe overall demand, while still negatively impacted by the COVID-19 pandemic, will continue to gradually improve over the next several quarters as public health orders and other restrictions are lifted and the rollout of COVID-19 vaccines accelerate, giving both consumers and operators more confidence and driving a gradual recovery in commercial foodservice end markets.
• Performance supports our comfort with our liquidity and covenants over the balance of the year.
• We are balancing our financial resources during the crisis to both:
Advance our Transformation Program to permanently improve our cost structure (long-term labor productivity, material cost reductions, SG&A efficiency),
While also advancing other key strategic initiatives (digital and new product innovation investments).

© Welbilt, Inc.© Welbilt, Inc.
14
Q&A

![Q4& FY16 Earnings Call Presentation [Company Update]](https://static.fdocuments.net/doc/165x107/577c80481a28abe054a805ac/q4-fy16-earnings-call-presentation-company-update.jpg)