


Languages
Pages
Legal


Lessons from the European Union
Linda GreenURI Watershed Watch
November 16, 2007
presented with permission…
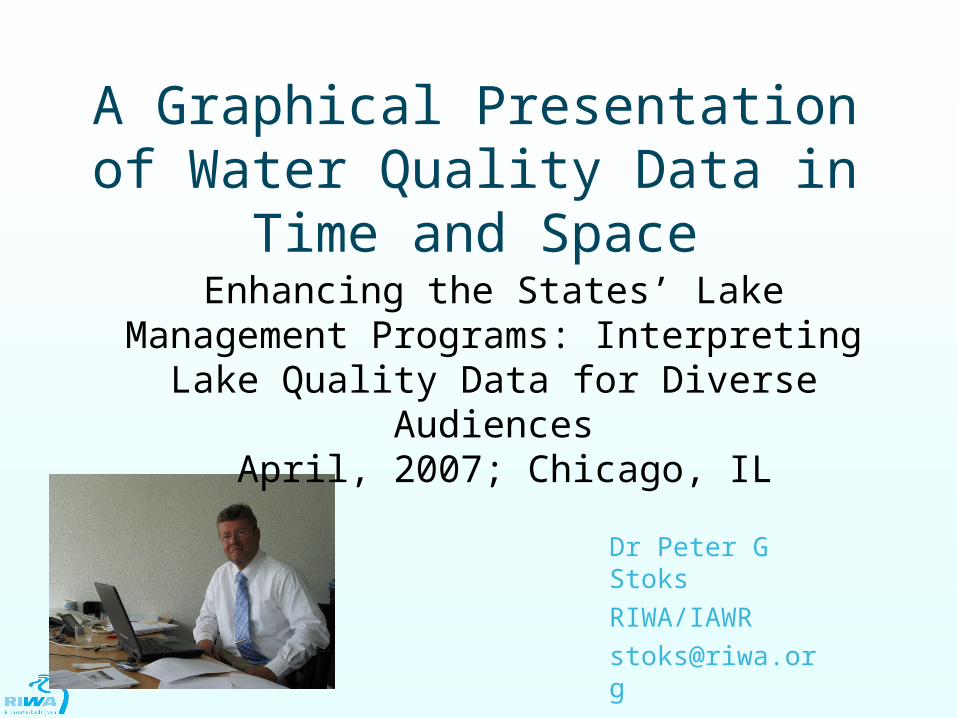
A Graphical Presentation of Water Quality Data in Time and
Space
Dr Peter G Stoks
RIWA/IAWR
Enhancing the States’ Lake Management Programs: Interpreting Lake Quality Data for
Diverse Audiences April, 2007; Chicago, IL

Umbrella organizationof 3 Associations
RIWA: Netherlands
ARW: lower Germany
AWBR: upstream Germany, Switzerland
Mission: Source water quality should allow drinking water production using simple treatment only!
120 utilities30 million consumers

The old way to publish our data
Lobith (860) 0230 Chloride mg/l
0
50
100
150
200
250
300
350
400
450
500
1952
1954
1956
1958
1960
1962
1964
1966
1968
1970
1972
1974
1976
1978
1980
1982
1984
1986
1988
1990
1992
1994
1996
1998
2000
2002
2004
2006
0
50
100
150
200
250
300
350
400
450
500 0230 Chloride mg/l
0
50
100
150
200
250
AUL SHS BAS KAH BIE MAK KOB KOL DFL DBL WIT WES LOB NGN NSL AND
0
50
100
150
200
250
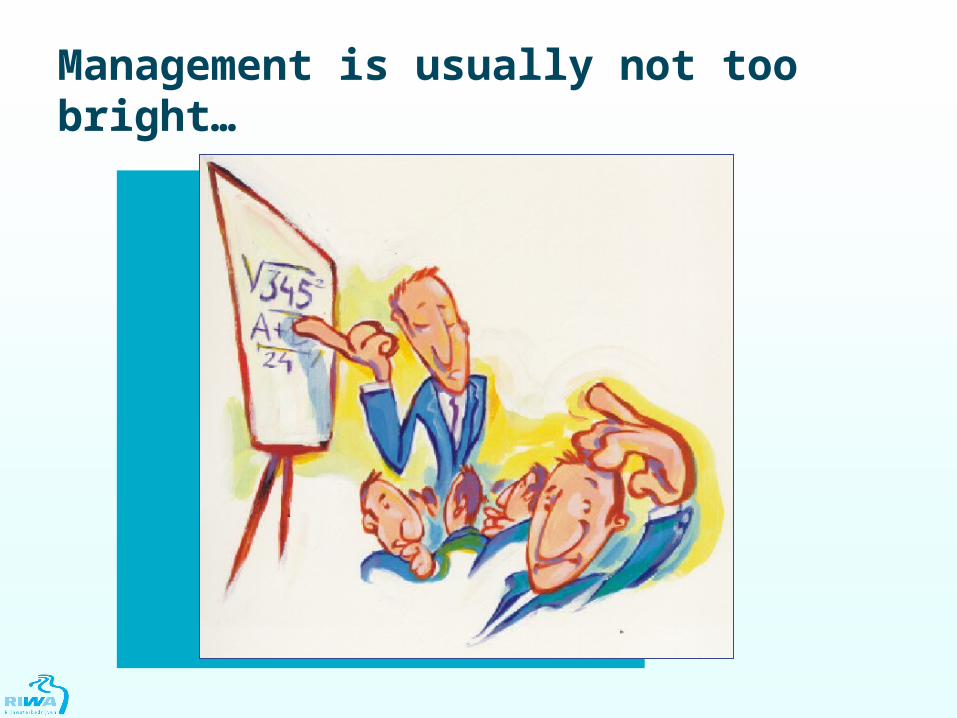
Management is usually not too bright…

…and has the attention span of a hamster

sp par year mean min max p10 p25 p50 p75 p90 n oag pniawr pnamvb pnkrw tr95 tr95w tr80 tr80w fiawr famvb fkrw pal80 pal95AND 0270 1976 0.368138 0.015 1.0871 0.015 0.073725 0.24845 0.629 0.91549 50 0.03 30 30 -9999 false 0 false 0 5.4355 5.4355 0 roneveAND 0270 1977 0.259278 0.015 1.7859 0.015 0.015 0.0776 0.3106 0.83858 51 0.03 19 19 -9999 false 0 false 0 8.9295 8.9295 0 roneveAND 0270 1978 0.164878 0.015 1.0094 0.015 0.0427 0.1009 0.2213 0.396 49 0.03 17 17 -9999 false 0 false 0 5.047 5.047 0 roneveAND 0270 1979 0.216165 0.015 1.2424 0.015 0.0388 0.132 0.229025 0.6981 40 0.03 15 15 -9999 false 0 false 0 6.212 6.212 0 roneveAND 0270 1980 0.170089 0.015 0.9861 0.015 0.0311 0.09705 0.20385 0.47986 46 0.03 12 12 -9999 false -0.02176 false -0.02176 4.9305 4.9305 0 roneveAND 0270 1981 0.10901 0.015 0.8075 0.015 0.015 0.0621 0.1398 0.26947 50 0.03 8 8 -9999 false -0.01926 true -0.01926 4.0375 4.0375 0 roneveAND 0270 1982 0.107253 0.015 0.6678 0.015 0.015 0.0388 0.1398 0.2873 49 0.03 7 7 -9999 true -0.02004 true -0.02004 3.339 3.339 0 rodoveAND 0270 1983 0.115835 0.015 0.6678 0.015 0.015 0.06 0.14 0.36808 51 0.03 8 8 -9999 true -0.0819 true -0.07326 3.339 3.339 0 rodoveAND 0270 1984 0.106415 0.015 0.58 0.015 0.015 0.06 0.14 0.322 53 0.03 8 8 -9999 false -0.01713 false -0.01399 2.9 2.9 0 roneveAND 0270 1985 0.16 0.015 1.2 0.015 0.04 0.1 0.2 0.386 43 0.03 10 10 -9999 false 0.011582 true 0.01175 6 6 0 roneveAND 0270 1986 0.150745 0.015 0.67 0.015 0.03 0.1 0.22 0.39 47 0.03 13 13 -9999 false 0.020775 true 0.024748 3.35 3.35 0 roneveAND 0270 1987 0.182604 0.015 0.66 0.03 0.06 0.13 0.2575 0.474 48 0.03 15 15 -9999 true 0.033502 true 0.033502 3.3 3.3 0 roupveAND 0270 1988 0.134038 0.015 0.57 0.04 0.06 0.105 0.1875 0.271 52 0.03 9 9 -9999 false 0.016987 false 0.016987 2.85 2.85 0 roneveAND 0270 1989 0.136019 0.015 0.5 0.015 0.05 0.1 0.18 0.306 103 0.03 22 22 -9999 false -0.00451 false -0.00451 2.5 2.5 0 roneveAND 0270 1990 0.159757 0.015 0.84 0.015 0.04 0.12 0.25 0.328 103 0.03 33 33 -9999 false -0.01785 false -0.01651 4.2 4.2 0 roneveAND 0270 1991 0.149381 0.015 0.71 0.015 0.03 0.13 0.22 0.336 113 0.03 32 32 -9999 false -0.01476 false -0.01476 3.55 3.55 0 roneveAND 0270 1992 0.118 0.015 0.39 0.015 0.03 0.11 0.16 0.277 100 0.03 12 12 -9999 false -0.005 false -0.005 1.95 1.95 0 roneveAND 0270 1993 0.094703 0.015 0.35 0.015 0.04 0.07 0.14 0.208 101 0.03 10 10 -9999 false -0.0085 false -0.0085 1.75 1.75 0 roneveAND 0270 1994 0.111029 0.015 0.4 0.015 0.03 0.1 0.15 0.227 102 0.03 13 13 -9999 false -0.00875 false -0.00875 2 2 0 roneveAND 0270 1995 0.06597 0.015 0.563 0.015 0.015 0.03 0.083 0.169 100 0.03 4 4 -9999 true -0.01425 true -0.01425 2.815 2.815 0 rodoveAND 0270 1996 0.108431 0.015 0.68 0.015 0.04 0.08 0.16 0.218 51 0.03 6 6 -9999 false -0.0045 false -0.0045 3.4 3.4 0 roneveAND 0270 1997 0.086115 0.015 0.7 0.015 0.01875 0.045 0.1 0.207 52 0.03 5 5 -9999 false -0.0065 false -0.0065 3.5 3.5 0 roneveAND 0270 1998 0.080922 0.015 0.24 0.015 0.03 0.06 0.13 0.178 51 0.03 3 3 -9999 false -0.005 false -0.005 1.2 1.2 0 roneveAND 0270 1999 0.063333 0.015 0.321 0.015 0.015 0.04 0.09 0.147 102 0.03 4 4 -9999 false -0.002 false -0.002 1.605 1.605 0 roneveAND 0270 2000 0.082 0.015 0.26 0.015 0.015 0.0595 0.13375 0.18 64 0.03 4 4 -9999 false -0.00475 false -0.00475 1.3 1.3 0 roneveAND 0270 2001 0.070754 0.015 0.381 0.015 0.015 0.06 0.097 0.1416 65 0.03 2 2 -9999 false -3.1E-08 false -3.1E-08 1.905 1.905 0 roneveAND 0270 2002 0.092812 0.015 0.22 0.015 0.0425 0.096 0.1375 0.1731 16 0.03 1 1 -9999 false 0.0035 false 0.0035 1.1 1.1 0 roneweAND 0270 2003 0.086357 0.015 0.2 0.015 0.02925 0.0685 0.145 0.195 14 0.03 0 0 -9999 false 0.008501 true 0.008501 1 1 0 geneweAND 0270 2004 0.060833 0.01 0.18 0.01 0.01 0.04 0.1075 0.168 12 0.02 0 0 -9999 false -0.00125 false -0.00125 0.9 0.9 0 geneweAND 0270 2005 0.054615 0.01 0.19 0.01 0.01 0.03 0.11 0.17 13 0.02 0 0 -9999 false -0.00498 false -0.00605 0.95 0.95 0 genewe
Need for simple WQ visualization
So, this does not work anymore (if it ever really did…)

Solution:
Color palettes combining locations and variables
• allows for basinwide overview of multiple variables
• color indicates WQ development over time–WQ improvement or deterioration at a glance
• area coverage indicates accuracy of statements–The less data, the less area coverage

Combining compliance ratio and trendyields Status
Good status:
- compliance ratio “good” and trend stable
- compliance ratio “moderate” and trend improving
Bad status:
- compliance ratio “bad” and trend stable
- compliance ratio “moderate” and trend deteriorating
Moderate status:
- all other combinations

above standard
= non-compliance
(except for O2)
between 0.8 x standard between 0.8 x standard and standardand standard
= OK but look out!= OK but look out!
below 0.8 x standard
= compliance
Compliance testing based on maximum values(or other criteria)
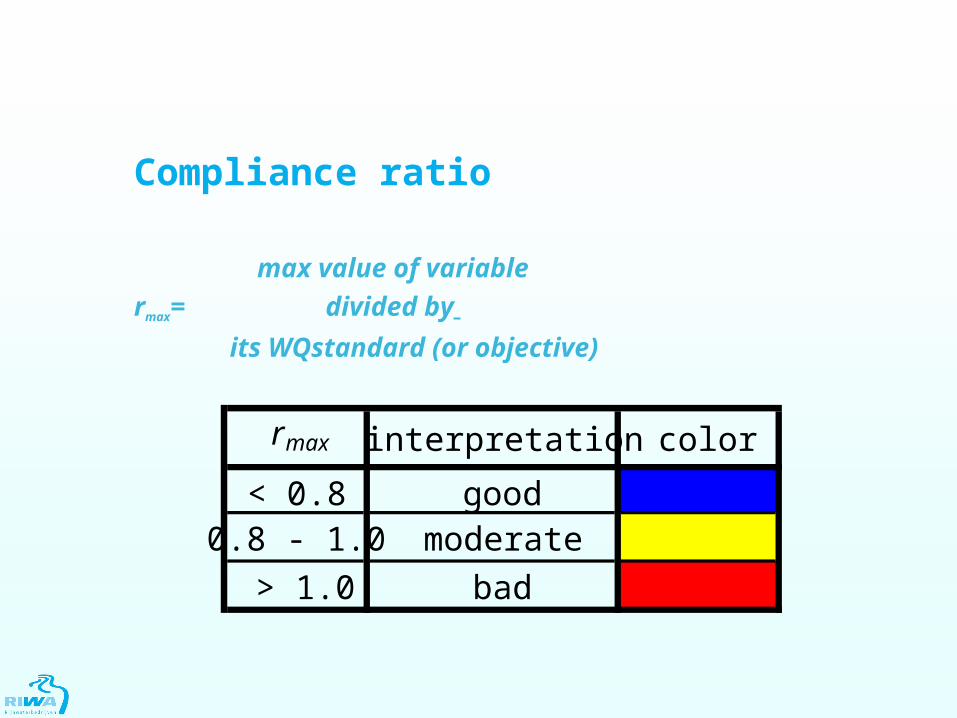
Compliance ratio
max value of variable
rmax= divided by
its WQstandard (or objective)
rmax interpretation color
< 0.8 good0.8 - 1.0 moderate
> 1.0 bad

Combined with trend detection
Trend detection based on 5 year period
- commercially available STAT package
- using parametric as well as non parametric statistics
- 13 data points / year minimum, reduced to quarterly avg

Trend
determined using a STAT-package (modified linear regression model, 95% conf interval)
trend interpretation color
negative improvementnone stable
positive deterioration

Combined with quantity of data
n < 10
n ≥ 20
20 > n ≥ 10
Quantity

Trend detection
Timeseries
advanced linear
regression
normalresiduals
n
y
outputyearly timescale
autocor.residuals
n
y
seasonal
Mann-Kendallseasonal & autocorrelation
n >=20
trend
autocor.
Mann-Kendallseasonal
Mann-Kendall
output
y
y y
y
autocor.
n
y n
n n
n
biggertimescale
parametric
nonparametric

Trend detection
advanced linear regression
intercept trend component seasonal component
autoregressive component model residue
Software: Trendanalist
by ICASTAT
Or Y= a + bx
(quarterly data)+ b1*Q1 + b2*Q2 + b3*Q3( + b4*Q4)

Put simply…create a pictogram
above standard
0.8-1.0 of standard
below 0.8 of standard
Compliance
uptrend
downtrend
no trend or not detectable
Trend
n < 10
n ≥ 20
20 > n ≥ 10
Quantity

Used in annual reports

Also applicable at technical level
• plotting a single WQ variable at different locationsOR
• plotting different (related) WQ variables at same location over time
gives info on reliability of data
→ odd values easily detected

What it looks like
Ammonia in the Rhine 1972 – 2004
Do
wn
stre
am
year

Standard violations and trends can be presented- for a single variable at different locations over time - for several variables at a fixed location over time
Easily understood by non-expert decision makers
Also: triggers WQ analist about curious events( with software built into database management system)
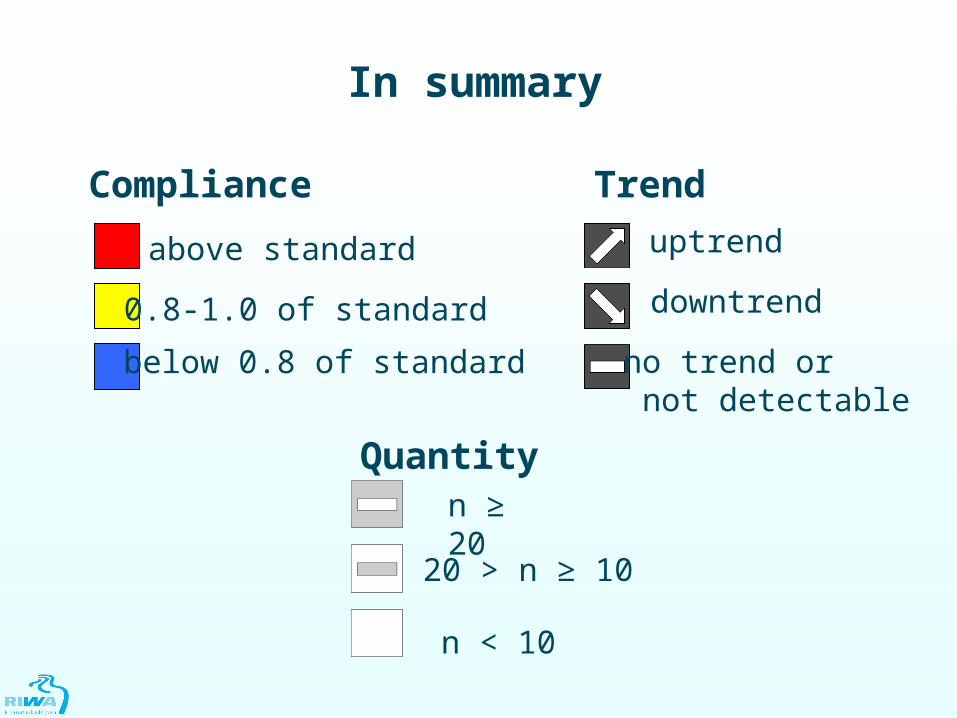
In summary
above standard
0.8-1.0 of standard
below 0.8 of standard
Compliance
uptrend
downtrend
no trend or not detectable
Trend
n < 10
n ≥ 20
20 > n ≥ 10
Quantity

Lessons from the European Union
above standard
0.8-1.0 of standard
below 0.8 of standard
Compliance
uptrend
downtrend
no trend or not detectable
Trend
n < 10
n ≥ 20
20 > n ≥ 10
Quantity
Dr Peter G StoksAssn of Rhine Water
WorksRIWA/[email protected]
Top Related