


Languages
Pages
Legal


Interannual Variability in the Extratropical Ocean Carbon System
Scott Doney (WHOI)
-Ubiquitous!!-Physical climate modes-Mechanisms & climate change-New approaches & experimental designs
Dore et al. (2002)
Hawaii Ocean Time-Series

Interannual Variability in Global Carbon Cycle
Francey
-Ocean sequesters ~30% of fossil fuel CO2
-Variability dominated by land sinks but role for the oceans-Primary global signal associated with ENSO events
2
4
6
8
Global(NOAA)
Cape Grim(CSIRO)
0
30
Fossil Fuel
Pinatubo
1955 1960 1965 1970 1975 1980 1985 1990 1995 2000
-30
CO2 GROWTH RATE
El Nino
La Nina
Mauna Loa(Scripps/NOAA)
(R J Francey, pers. Com)
Atmospheric CO2 growth rate

El Niño : 0.2-0.4 PgC/yNon El Niño : 0.7-0.9 PgC/yAverage: 0.6±0.2 PgC/y
-Dense time/space coverage-Agreement among field data, ocean models & “top-down” atmospheric estimates
Feely et al. (2003)
Equatorial Pacific
Bousquet et al. (2000)
ocean modelatmosphere
data
Le Quere et al. (2000)(also Obata et al. 2003)
1997-2002

Natural Climate Modes
NAO
NAO: North Atlantic OscillationPDO: Pacific Decadal OscillationAAO: Antarctic Oscillation
-Shift of mass from subpolar lows and subtropical highs-Changes in winds, SST, ocean convection, freshwater flux, …-”Intrinsic” atmospheric variability (ocean, stratosphere)-Tropical-extratropical interactions
Wang and Schimel (2003)
Surface Pressure Anomaly

Regional Spatial Patterns
Wang and Schimel (2003)
-Modes expressed on regional (sub-basin) scales with significant cancellation (dipole pattern)-Historical and future climate change appear to project onto natural modes-Spatial patterns may evolve with time
Correlation-0.6 +0.8
NAO Index
20001950 20501900
obs.models

SubtropicalNorth Atlantic
Gruber et al. (2002)
Negative NAO => +WML -SST +entrainment +production +CO2 uptake
Extrapolate to subtropical gyre =>±0.2 PgC/y
whole basin =>±0.3 PgC/y
Mixed Layer
Entrainment
CO2 uptake
Production
Transport

PDO
Pacific Decadal Oscillation ML Anomaly
Wang & Schimel (2003)
Karl et al. (2001)
DepthIntegrated Chlorophyll
Hare & Mantura (2000)
++
Subtropicalnutrient limited prod.+ML => +Chlorophyll + ProductionSubpolar/Polarlight limited prod.-ML => +Productionmultiple impacts on higher trophic levels (e.g. zooplankton, fisheries, mammels)

Climate Change Response
-Regional climate change signals-Surface warming, high latitude freshening, increased stratification, reduced mixed layer depths & sea-ice -Productivity lower in subtropics, higher in subpolar
productivity
Sarmiento et al. (submitted)

Multi-Century Coupled Carbon/Climate Simulations
Net CO2 Flux (Pg C/yr)-1.5
+1.5
-Fully prognostic land/ocn BGC and carbon/radiation-“Stable” carbon cycle and climate over 200y-Projection of climate change on natural modes-Detection & attribution
Surface Temp.13.6
14.1
Fung, Doney, Lindsay & John2000 year

Variability Mechanisms Particle
exportAir-seaflux
1
.3
10
3
.1 Fresh-water
mol C/m^2
Fung, Doney, Lindsay & John
-Regions of high variability in North Atlantic & Pacific, tropics and Southern Ocean-Mechanisms differ across regions

Atmospheric Dust Deposition
-Significant interannual variability, particularly in the North Atlantic-Driven mostly by atmospheric transport, not sources-Largest fraction is synoptic, within month variability
Mahowald et al. (2003)
(standard deviation/mean)

Ironflux
Air-seaCO2 flux
Zonal Anomalies
N2 Fixation
Doney, Dusenberry, Moore & Mahowald

SeaWiFS Ocean Color Data (1997-2003)

April 2000Oct. 1998
Coherent Regional-Scale Patterns
SeaWiFS Monthly Anomaly SeaWiFS Monthly Anomaly

Antarctic Circumpolar Wave
Le Quere et al. (2002)
-Positive/negative physical anomalies propagate around southern ocean with 8-10 year time-scale-Ocean color variability appears coherent across basin-Differential regional biological responses to mixed layer depth changes depending on light versus nutrient limitation
time
space
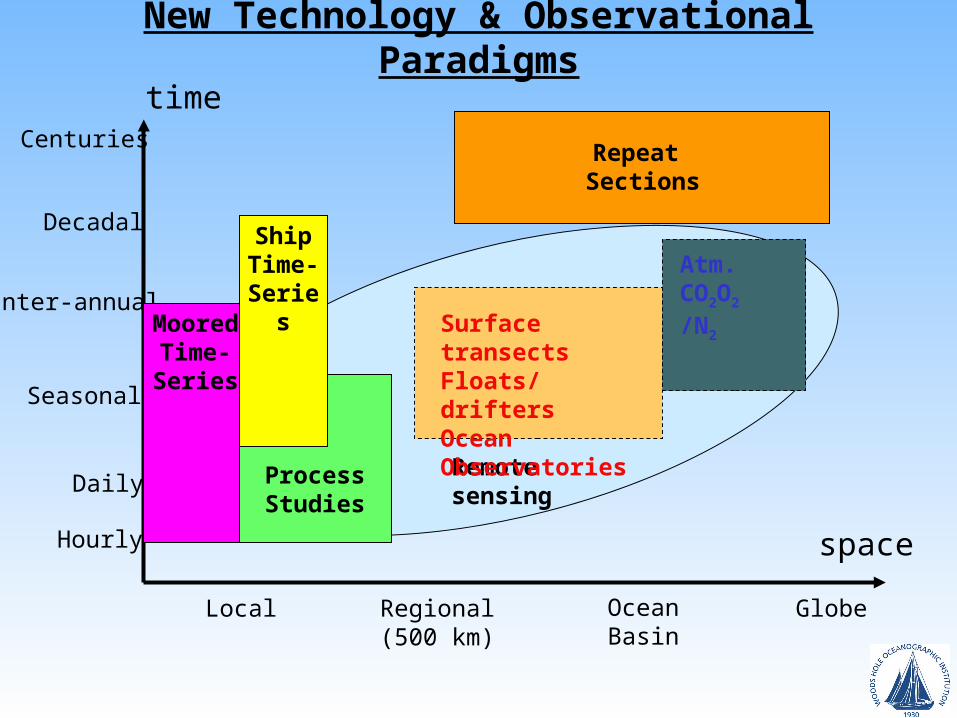
Local GlobeOceanBasin
Regional(500 km)
Centuries
Decadal
Inter-annual
Seasonal
DailyRemotesensing
Hourly
Process Studies
Repeat Sections
Surface transectsFloats/driftersOcean Observatories
ShipTime-Series
MooredTime-Series
Atm. CO2
O2/N2
New Technology & Observational Paradigms

Conclusions
AcknowledgementsJ. Dusenberry & S. McCue WHOI K. Lindsay NCARNSF and NSF/ONR NOPPCCSM & the NCAR CSL
-Common feature of almost all ocean time-series-Regional time-space structured by climate modes & biology-Natural experiments for studying climate change response-Require more spatially “extensive” design for ocean observation

LeQuere et al. (2000)
Obata et al. (2003)
Global & Extratropical Variability
LeQuere: ±0.4 (70% Eq. Pac.)Obata: ±0.23 (>50% Eq. Pac. ~30% Southern)-Only partial reconciliation with atmosphere inversions-Poor data coverage outside of equatorial Pacific
Bousquet et al. (2003)

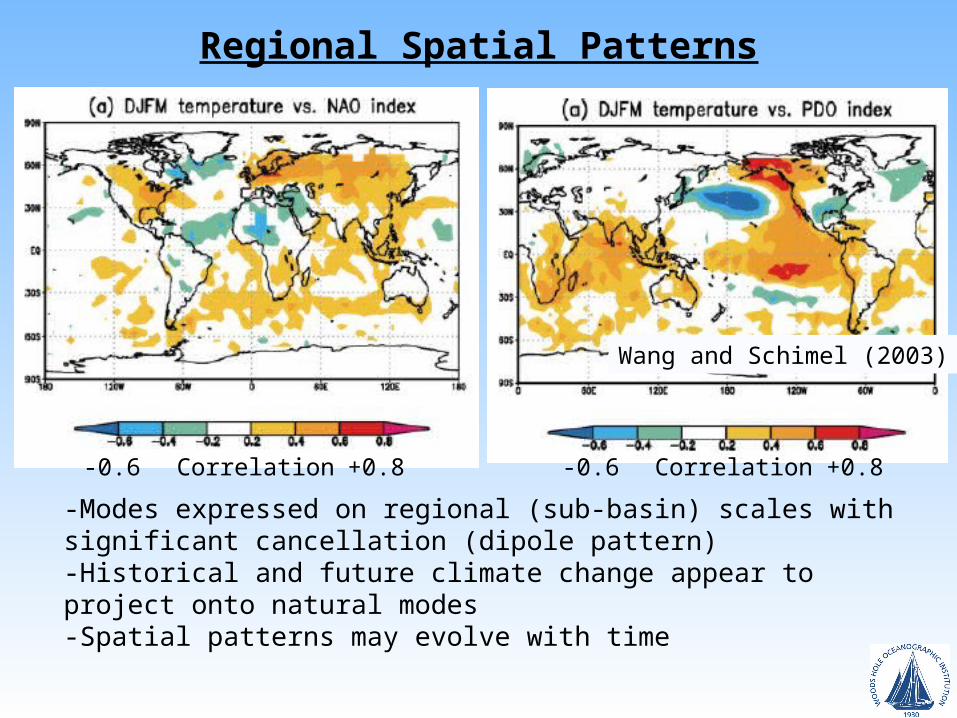
Regional Spatial Patterns
Wang and Schimel (2003)
-Modes expressed on regional (sub-basin) scales with significant cancellation (dipole pattern)-Historical and future climate change appear to project onto natural modes-Spatial patterns may evolve with time
Correlation Correlation-0.6 +0.8 +0.8-0.6

Monthly SeaWiFS Ocean Color Anomalies
standard deviation
standard deviation/mean

-DIC supply (dominant) & export out of phase-General agreement among field data, ocean models & “top-down” atmospheric estimates-But what about the extratropics?
Obata et al. (2003)
Obata et al. (2003)
physicsexport air-sea
flux
Equatorial Pacific
Bousquet et al. (2000)
ocean modelatmosphere
data
Le Quere et al. (2000)

Antarctic Circumpolar Wave
Le Quere et al. (2002)
+0.1
-0.1
Wind Stress& CO2 fluxAnomalies
Obata et al. (2003)
-Ocean response to annular mode in the atmosphere-Different regional biological responses to mixed layer depth changes-Air-sea CO2 flux correlated with wind stress/speed
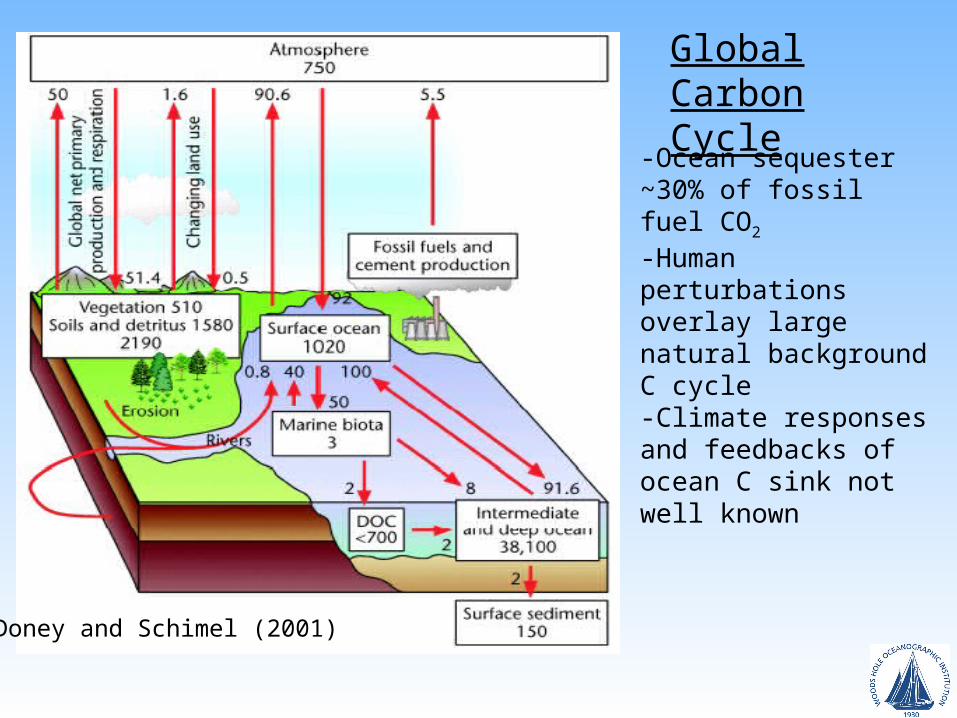
Global Carbon Cycle
Doney and Schimel (2001)
-Ocean sequester ~30% of fossil fuel CO2
-Human perturbations overlay large natural background C cycle-Climate responses and feedbacks of ocean C sink not well known

Physical & Biological Controls
pCO2 = f(Temp., Salinity, DIC, Alkalinity) + (+) + -
Net Community Prod.
Winter mixed layer
Circulation
Light
Nutrient/DIC Supply
Export
Winds, Heat & Freshwater Fluxes Dust/iron CO2 O2
Remineralization
Regenerated Prod.

Greene et al. 2003 Chavez et al. 2003
-Impacts on both biomass and species competition-Multi-decadal “regime shifts” integrating higher frequency climate variability
Community Structure & Higher Tropic Levels
Climate Modes & Change Change

SeaWiFS Ocean Color Data (1997-2003)
Top Related