Indian Ocean dynamics and interannual variability associated with ...
41
Indian Ocean dynamics and interannual variability associated with the tropospheric biennial oscillation (TBO) Gerald Meehl National Center for Atmospheric Research Julie Arblaster, Johannes Loschnigg, Aixue Hu Peter Webster, Gilbert Compo
Transcript of Indian Ocean dynamics and interannual variability associated with ...
Indian Ocean dynamics and interannual variability associated
with the tropospheric biennial oscillation (TBO)
Gerald Meehl
National Center for Atmospheric Research
Julie Arblaster, Johannes Loschnigg, Aixue HuPeter Webster, Gilbert Compo

“biennial tendency” of ENSO and IOZM/IOD = TBO
Fundamental coupled interactions involved with TBO provide dynamical framework for ENSO and IOD that are
encompassed by the TBO
TBO is fundamental interannual process, with ENSO and IOD large amplitude
extremes of TBO (Meehl and Arblaster, J. Climate, 2002; Meehl et al., J. Climate, 2003; Loschnigg et al., J.
Climate, 2003)

Observations and models
• NCEP/NCAR reanalyses, SODA ocean data, CMAP precipitation data
• CSM1 coupled model (100 year period from control run), CCM3 atmosphere T42 18L, 2 degree NCOM ocean, cavitating fluid sea ice, LSM land surface model
• PCM coupled model (300 year period from control run), CCM3 atmosphere, 2/3 degree POP ocean, EVP dynamic and thermodynamic sea ice, LSM land surface model

1979-1999Indian monsoon: 13 out of 21 are
TBO years
about half are ENSO or IOD years
analysis of non-ENSO/IOD years shows similar but lower
amplitude signals
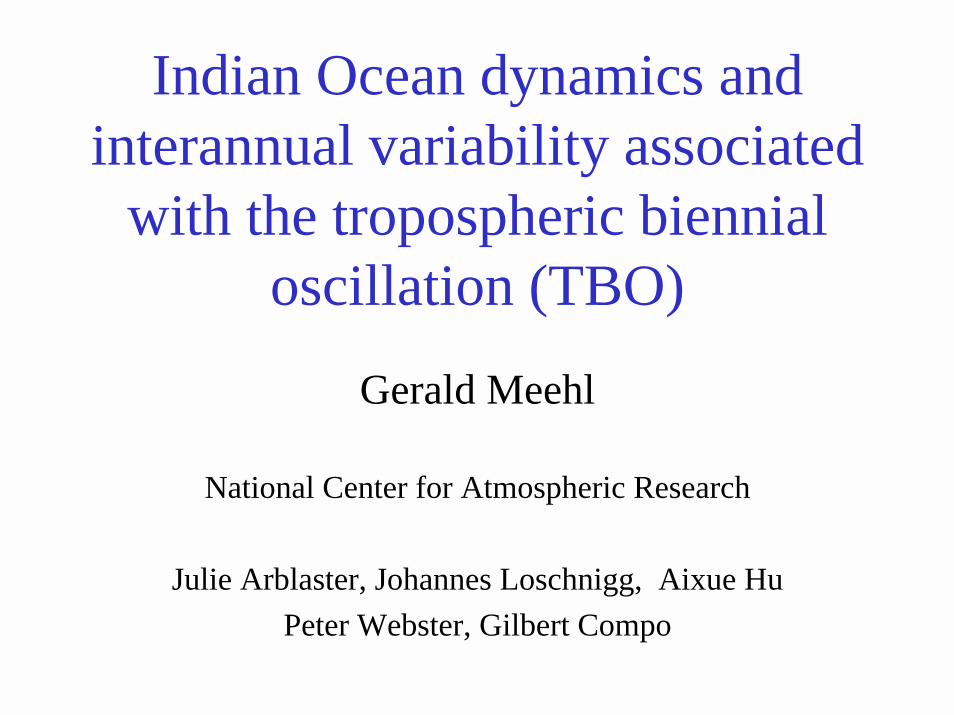
Loschnigg, Meehl, Webster, Arblaster and Compo, 2003, J. Climate, 16, 1617--1642
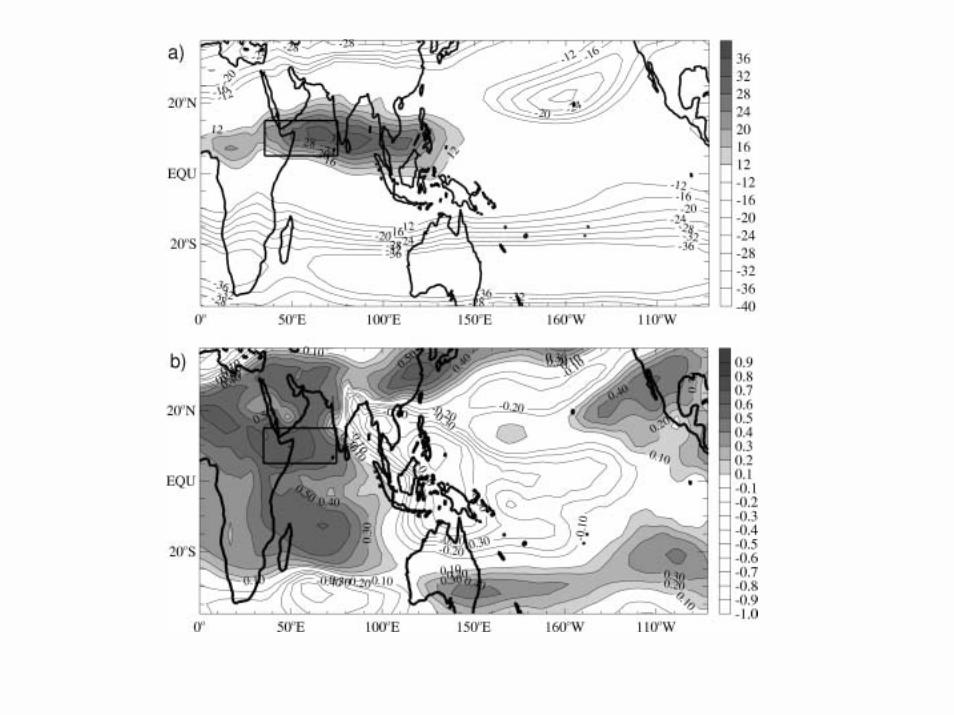
CSM1, 100 years MAM JJA PrecipitationSVD analysis
Indian SST
Pacific SST
500 hPa height
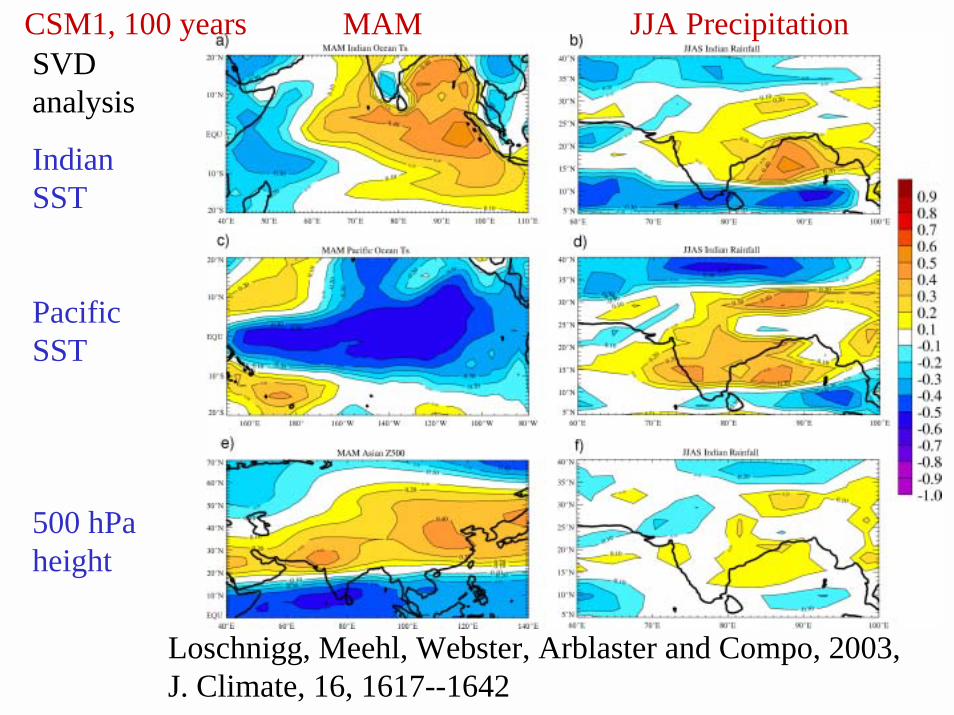
Meehl et al., 2003: J. Climate, 16, 2138-2158


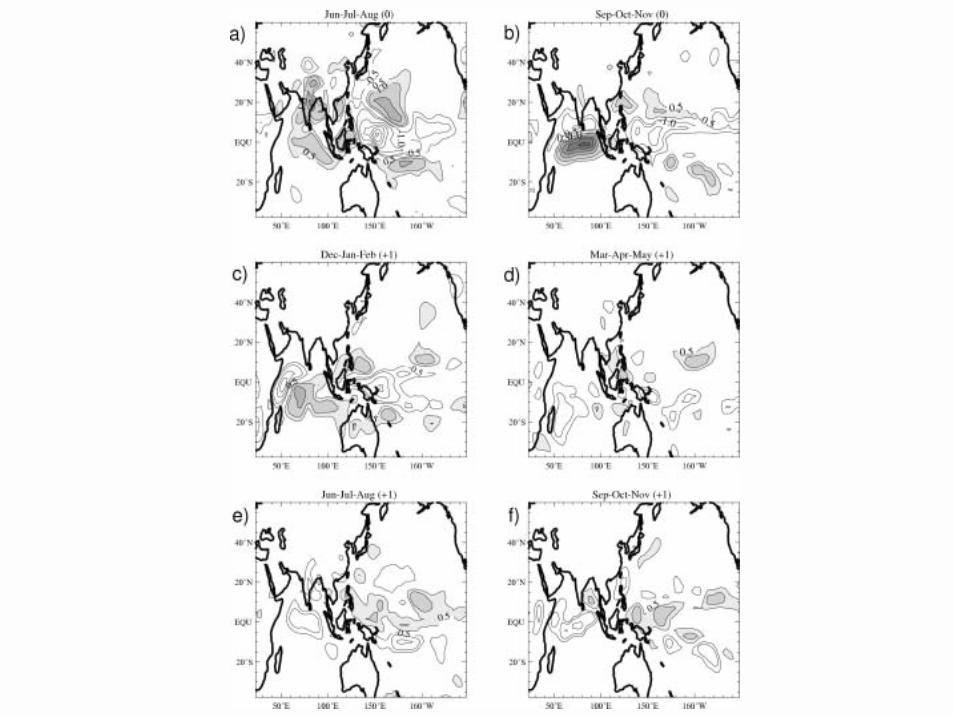
CSM1, 100 years SON DJF Precipitation
SVD
Indian SST
Pacific SST
Precip

Monsoon Rainfall Index CI1: 10-25N, 70-100E (Wang and Fan, 1999)
Westerly Shear Index WSI1: 5-15N, 35-75E, U850 – U200
(Webster and Yang, 1992)

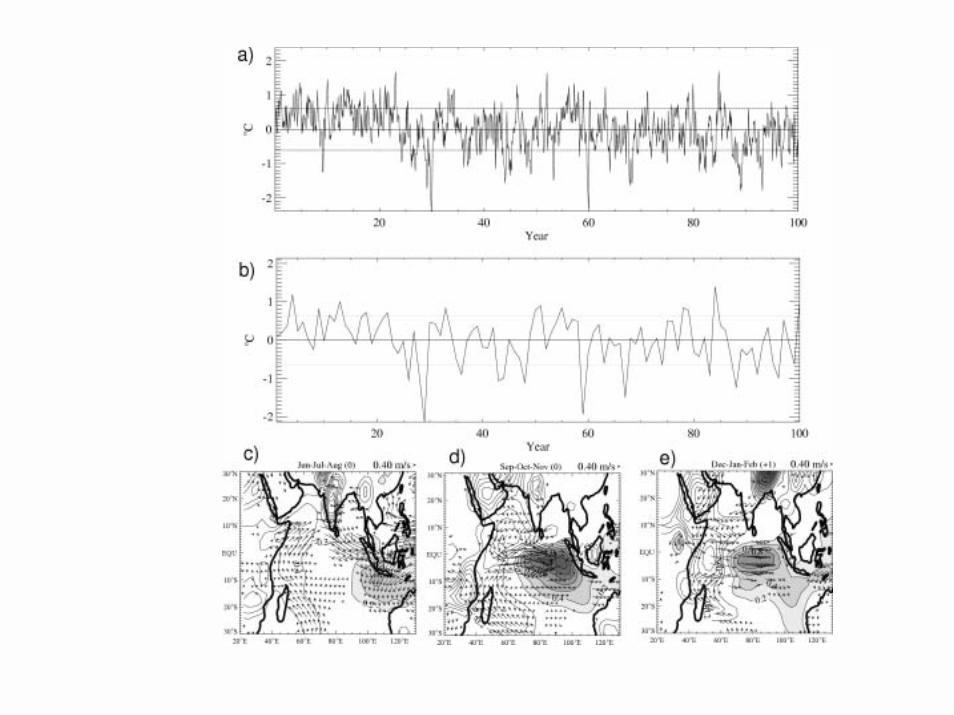
Coupled model upper ocean temperatures, equatorial section, Indian Ocean, TBO strong minus weak monsoon (dark shading = + temperatures)
MAM0 JJA0 strong monsoon
SON0 DJF+1


PCM 300 year control run; Correlation of Indian Ocean STC index (9N minus 9S) with heat transport index (9N minus 9S) = +0.74
Stronger STC = stronger southward heat transport
Pacific correlation = +0.75

PCM 300 years

Period (years)
Cospectrum of JJA Indian monsoon rainfall and Indian Ocean STC index
(PCM, 300 years)
Coherence squared 95%
multi-decadal ENSO TBO

Conclusions• Observations and model results show the Indian
Ocean zonal mode (or IOD) and ENSO are inherent features of the TBO; the TBO is fundamental to the system and provides dynamical framework for ENSO and IOD
• “biennial tendency” of IOD and ENSO = TBO• Ocean heat transport associated with wind-forced
STC strength contributes to heat content changes and thus persistent SST anomalies in the Indian Ocean over multiple seasons, a key factor for the TBO
• Such heat content changes are also likely important for introducing low frequency variability into the system so it is not perfectly biennial
Scale interaction: lower frequency processes set the base state for progressively higher frequency “triggers” to make a transition, and that new base state then affects the higher frequency phenomena
Multi-decadal processes set base state, and an El Nino can then trigger an apparent decadal change (1976-77 El Nino going into a “warm” decadal state; 1998-99 La Nina going into a “cold” decadal state), and then that base state affects subsequent El Nino events
TBO timescale processes set the base state such that an MJO can trigger an onset of IOD or El Nino (MJOs and 1997-98 El Nino), and then the El Nino or IOD conditions affect the manifestation of subsequent MJO’s. Meehl, G.A., R. Lukas, G.N. Kiladis, M. Wheeler, A. Matthews, and K.M. Weickmann, 2001: A conceptual framework for time and space scale interactions in the climate system. Clim. Dyn., 17, 753--775.

Indian Ocean warm
Indian Ocean cool
Loschnigg et al., 2003: J. Climate, 16, 1617-1642

Conclusions• TBO transitions in northern spring affected most
by tropical SST anomalies in the Indian and Pacific, and less from land-sea meridionaltemperature contrasts
• Observations and model results show the Indian Ocean zonal mode (or IOD) and ENSO are inherent features of the TBO; the TBO is fundamental to the system and provides dynamical framework for ENSO and IOD
• “biennial tendency” of IOD and ENSO = TBO• Ocean heat transport contributes to heat content
and persistent SST anomalies in the Indian Ocean over multiple seasons, a key factor for the TBO
Observations and models
• NCEP/NCAR reanalyses, SODA ocean data, CMAP precipitation data
• CSM1 coupled model (100 year period from control run), CCM3 atmosphere T42 18L (5 member ensembles, Jan. to Oct.), 2 degree ocean, dynamic sea ice, LSM land surface model

Indian region TBO monsoon transition conditions:
• 500 hPa height anomalies and associated Asian land temperature anomalies
• Tropical Indian Ocean SST anomalies
Large scale TBO monsoon transition condition:Tropical Pacific Ocean SST anomalies

Dark shading=+precip
+1.7
+0.8
AGCM sensitivity experiments
5 member ensemble means; 5% significance shaded
+3.5
Meehl and Arblaster, 2002, J. Climate, 15, 923--944

The Indian Ocean, the tropospheric biennial oscillation (TBO), and the Asian-Australian
monsoon
Gerald Meehl
National Center for Atmospheric Research
Julie Arblaster, Johannes Loschnigg, Peter Webster, Gilbert Compo

Meehl, Arblaster and Loschnigg, 2003, J. Climate, 16, 2138--2158


1979-199913 out of 21 are TBO years7 relatively strong monsoons(3 La Nina, 2 negative IOD)6 relatively weak monsoons
(4 El Nino, 2 El Nino years are positive IOD)
4 years are neither ENSO or IOD and they have similar signals