


Languages
Pages
Legal

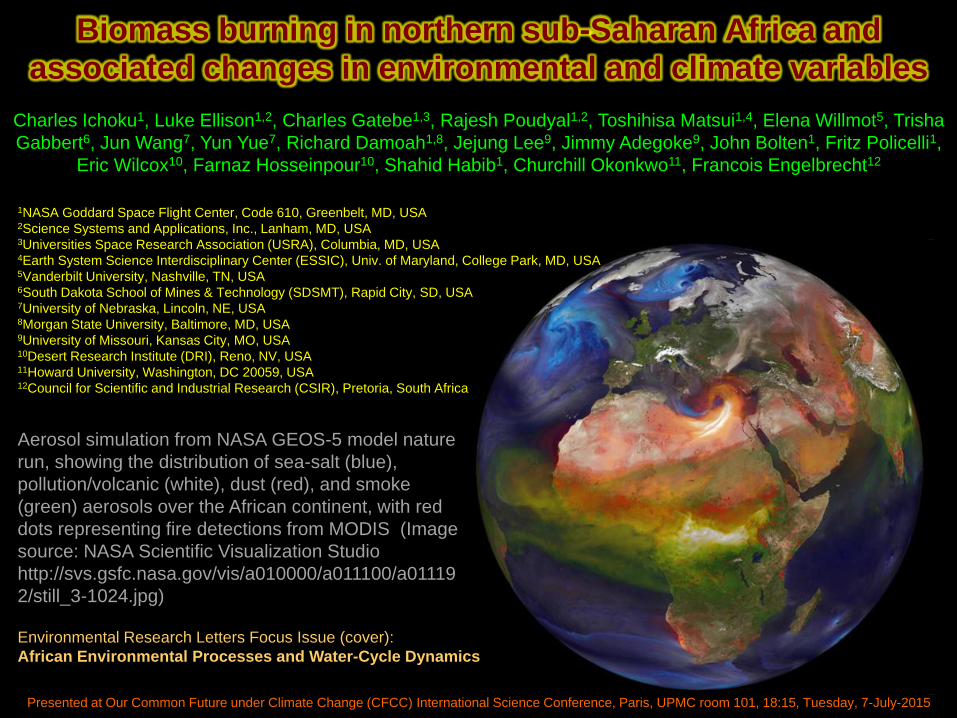
Biomass burning in northern sub-Saharan Africa and
associated changes in environmental and climate variables
Presented at Our Common Future under Climate Change (CFCC) International Science Conference, Paris, UPMC room 101, 18:15, Tuesday, 7-July-2015
Charles Ichoku1, Luke Ellison1,2, Charles Gatebe1,3, Rajesh Poudyal1,2, Toshihisa Matsui1,4, Elena Willmot5, Trisha
Gabbert6, Jun Wang7, Yun Yue7, Richard Damoah1,8, Jejung Lee9, Jimmy Adegoke9, John Bolten1, Fritz Policelli1,
Eric Wilcox10, Farnaz Hosseinpour10, Shahid Habib1, Churchill Okonkwo11, Francois Engelbrecht12
1NASA Goddard Space Flight Center, Code 610, Greenbelt, MD, USA 2Science Systems and Applications, Inc., Lanham, MD, USA 3Universities Space Research Association (USRA), Columbia, MD, USA 4Earth System Science Interdisciplinary Center (ESSIC), Univ. of Maryland, College Park, MD, USA 5Vanderbilt University, Nashville, TN, USA 6South Dakota School of Mines & Technology (SDSMT), Rapid City, SD, USA 7University of Nebraska, Lincoln, NE, USA 8Morgan State University, Baltimore, MD, USA 9University of Missouri, Kansas City, MO, USA 10Desert Research Institute (DRI), Reno, NV, USA 11Howard University, Washington, DC 20059, USA 12Council for Scientific and Industrial Research (CSIR), Pretoria, South Africa
Aerosol simulation from NASA GEOS-5 model nature
run, showing the distribution of sea-salt (blue),
pollution/volcanic (white), dust (red), and smoke
(green) aerosols over the African continent, with red
dots representing fire detections from MODIS (Image
source: NASA Scientific Visualization Studio
http://svs.gsfc.nasa.gov/vis/a010000/a011100/a01119
2/still_3-1024.jpg)
Environmental Research Letters Focus Issue (cover):
African Environmental Processes and Water-Cycle Dynamics

African Droughts (New Scientist: 19:00 12 June 2002)
“Although the droughts have had climate experts scratching their heads, the
impacts have been obvious. During the worst years, between 1972 and 1975,
and 1984 and 1985, up to a million people starved to death.”
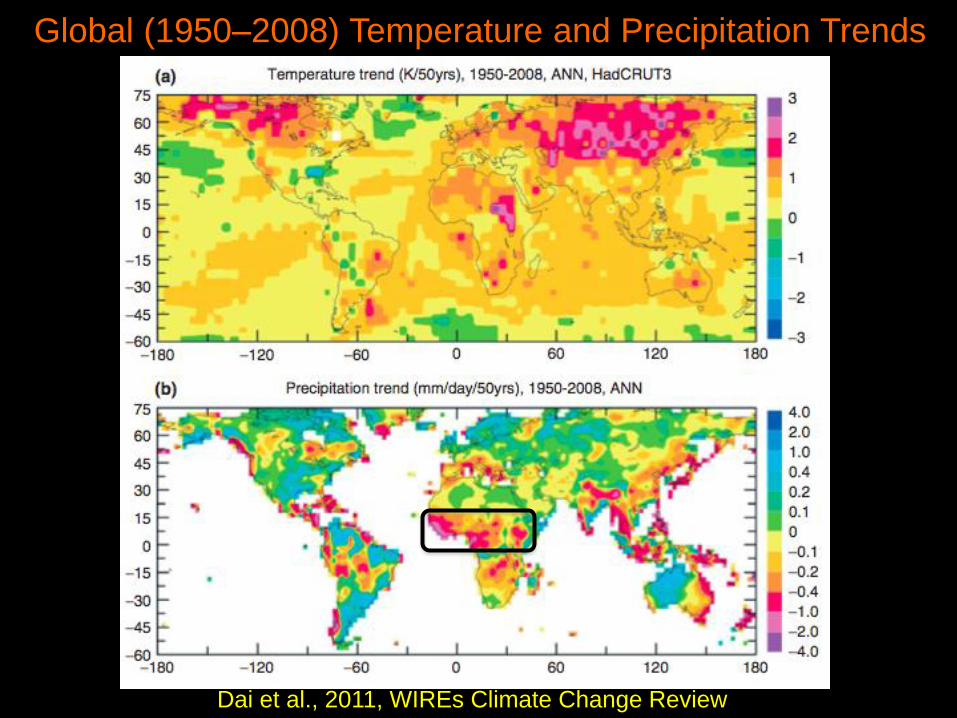
Global (1950–2008) Temperature and Precipitation Trends
Dai et al., 2011, WIREs Climate Change Review
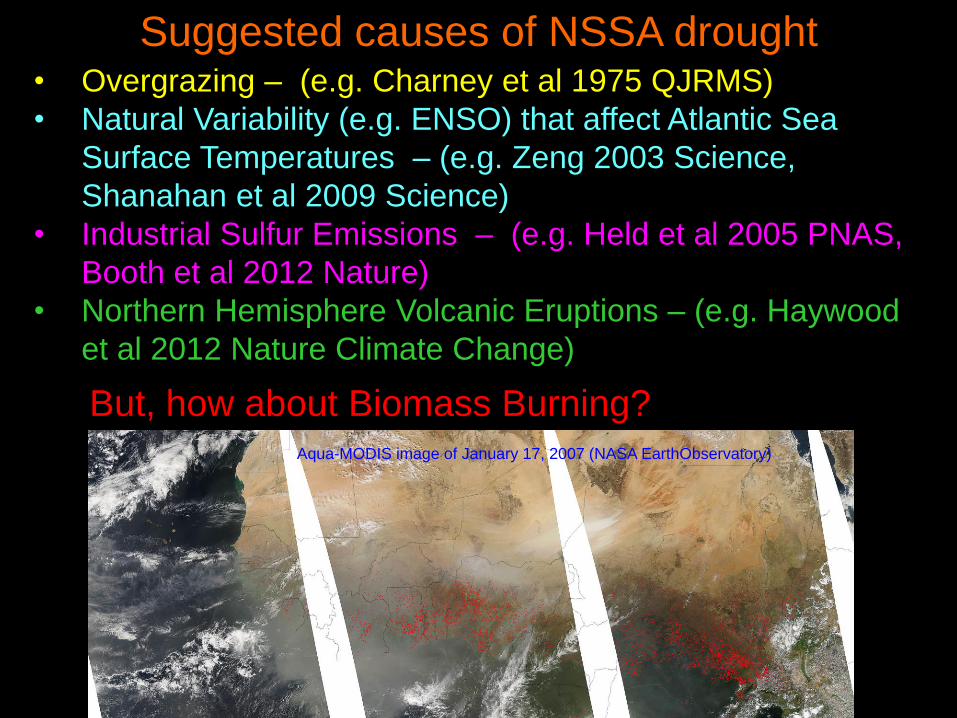
Suggested causes of NSSA drought • Overgrazing – (e.g. Charney et al 1975 QJRMS)
• Natural Variability (e.g. ENSO) that affect Atlantic Sea
Surface Temperatures – (e.g. Zeng 2003 Science,
Shanahan et al 2009 Science)
• Industrial Sulfur Emissions – (e.g. Held et al 2005 PNAS,
Booth et al 2012 Nature)
• Northern Hemisphere Volcanic Eruptions – (e.g. Haywood
et al 2012 Nature Climate Change)
Aqua-MODIS image of January 17, 2007 (NASA EarthObservatory)
But, how about Biomass Burning?

Lake Chad: poster child of African Sahel Droughts
Terra-MODIS image of 7 February 2008 at 12:40 UT
Fires Bare Soil Dust Desertification
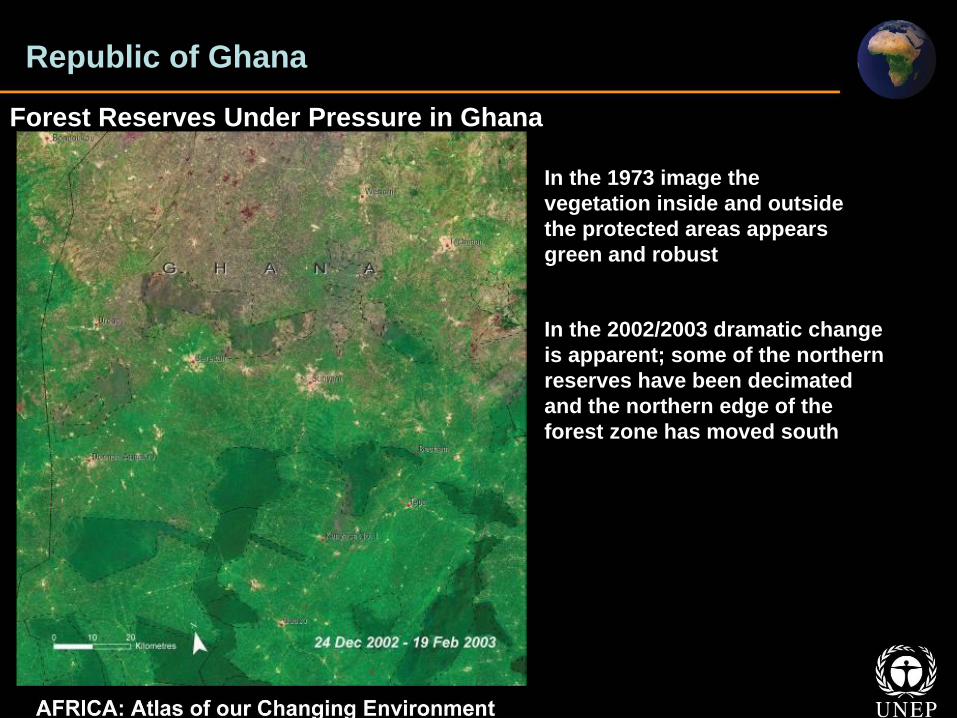
Forest Reserves Under Pressure in Ghana
In the 1973 image the
vegetation inside and outside
the protected areas appears
green and robust
In the 2002/2003 dramatic change
is apparent; some of the northern
reserves have been decimated
and the northern edge of the
forest zone has moved south
Republic of Ghana
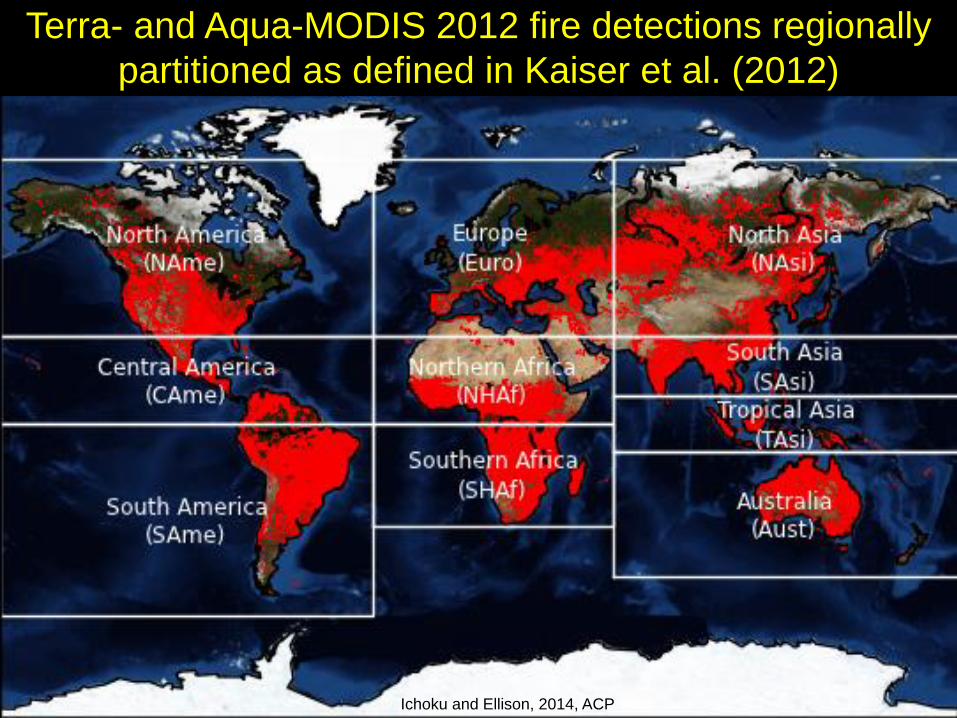
Terra- and Aqua-MODIS 2012 fire detections regionally
partitioned as defined in Kaiser et al. (2012)
Ichoku and Ellison, 2013, ACP, submitted Ichoku and Ellison, 2014, ACP
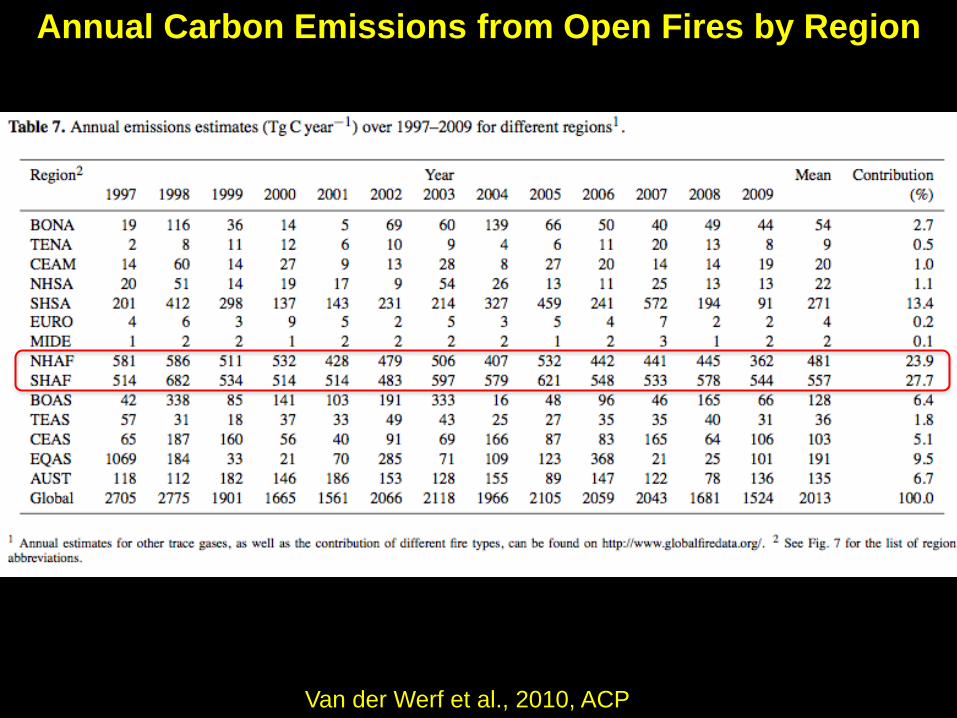
Annual Carbon Emissions from Open Fires by Region
Van der Werf et al., 2010, ACP
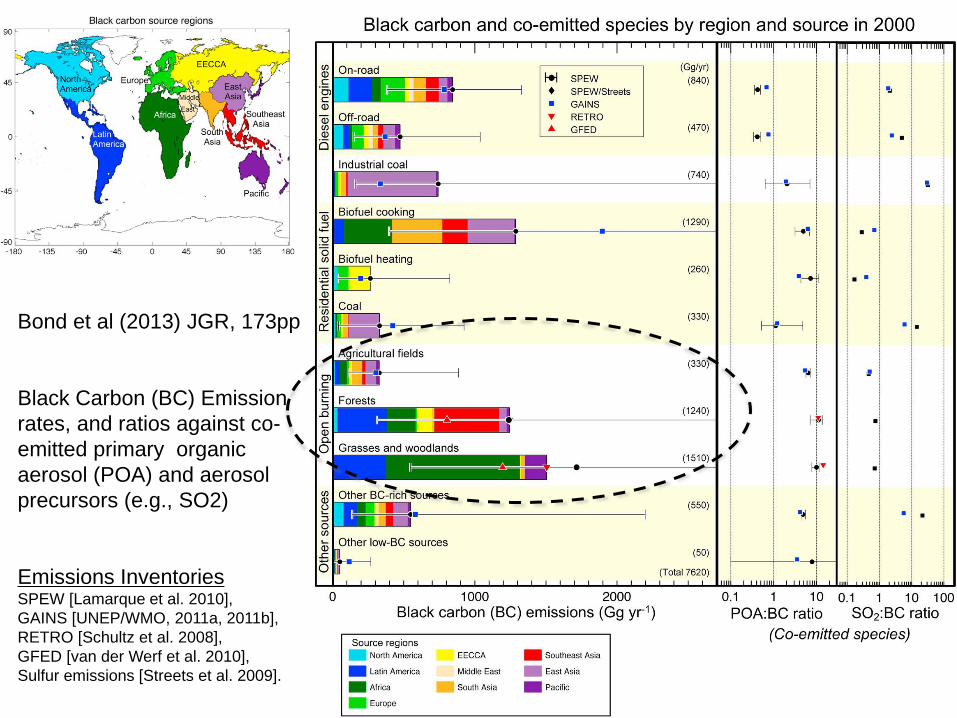
Bond et al (2013) JGR, 173pp
Black Carbon (BC) Emission
rates, and ratios against co-
emitted primary organic
aerosol (POA) and aerosol
precursors (e.g., SO2)
Emissions Inventories SPEW [Lamarque et al. 2010],
GAINS [UNEP/WMO, 2011a, 2011b],
RETRO [Schultz et al. 2008],
GFED [van der Werf et al. 2010],
Sulfur emissions [Streets et al. 2009].
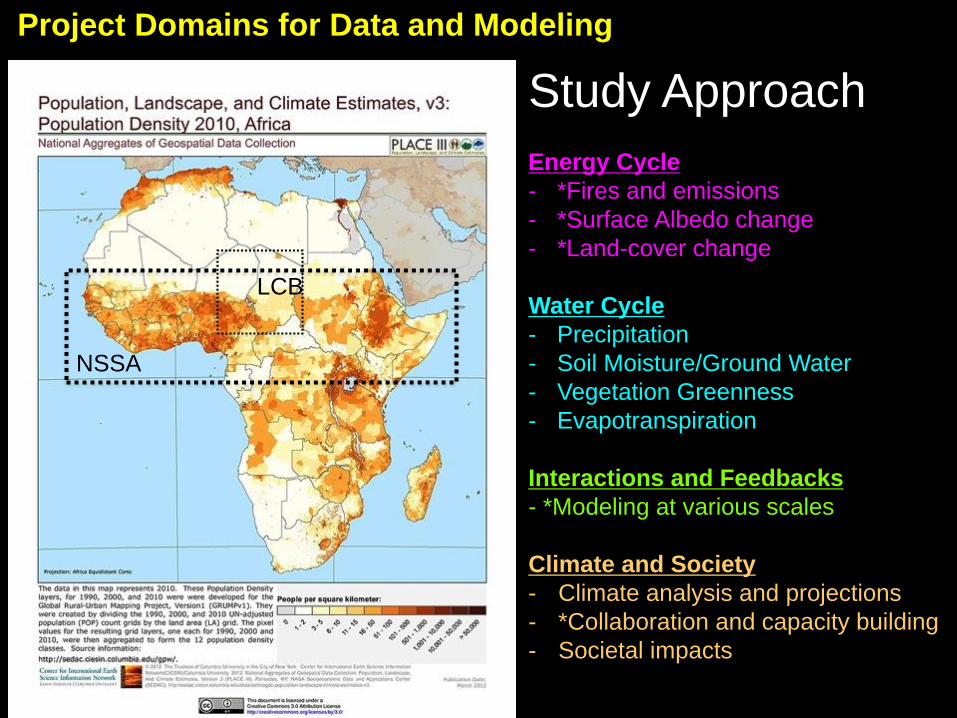
Project Domains for Data and Modeling
Study Approach
Energy Cycle
- *Fires and emissions
- *Surface Albedo change
- *Land-cover change
Water Cycle
- Precipitation
- Soil Moisture/Ground Water
- Vegetation Greenness
- Evapotranspiration
Interactions and Feedbacks
- *Modeling at various scales
Climate and Society
- Climate analysis and projections
- *Collaboration and capacity building
- Societal impacts
NSSA
LCB
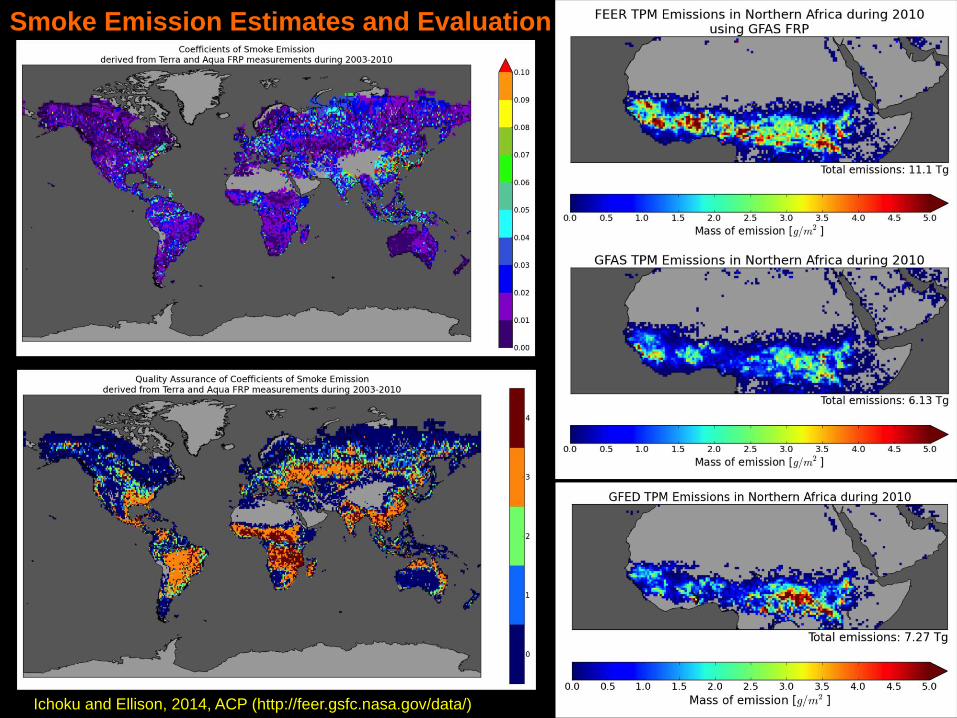
Smoke Emission Estimates and Evaluation
Ichoku and Ellison, 2014, ACP (http://feer.gsfc.nasa.gov/data/)
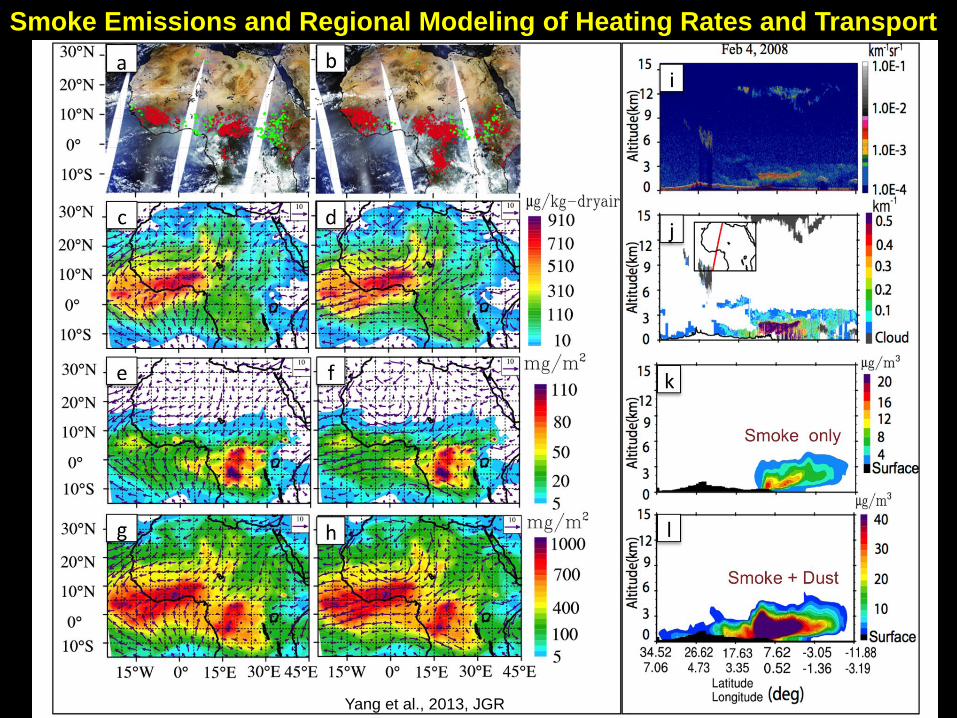
Smoke Emissions and Regional Modeling of Heating Rates and Transport
Yang et al., 2013, JGR
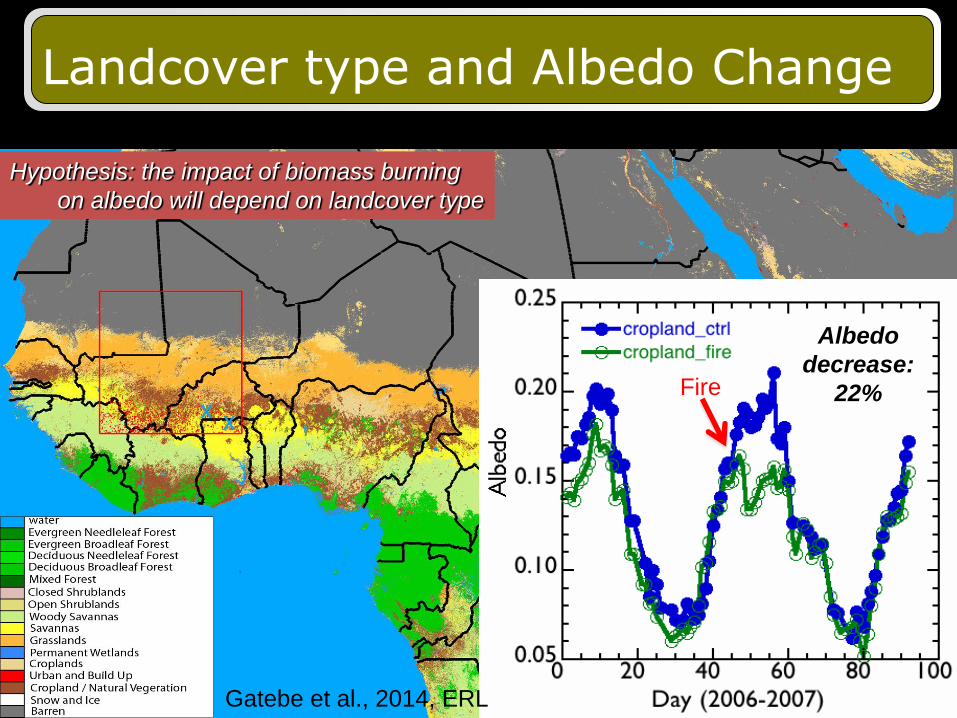
Landcover type and Albedo Change
1
Hypothesis: the impact of biomass burning
on albedo will depend on landcover type
MODIS Landcover types
Albedo
decrease:
22% Fire
Gatebe et al., 2014, ERL

NSSA Surface Albedo Recovery
NSSA Fire-induced Surface Albedo Change during 2001-2011
Gatebe et al., 2014, ERL
Picture from Chad, 25-Feb-2015
NSSA Surface Albedo Change
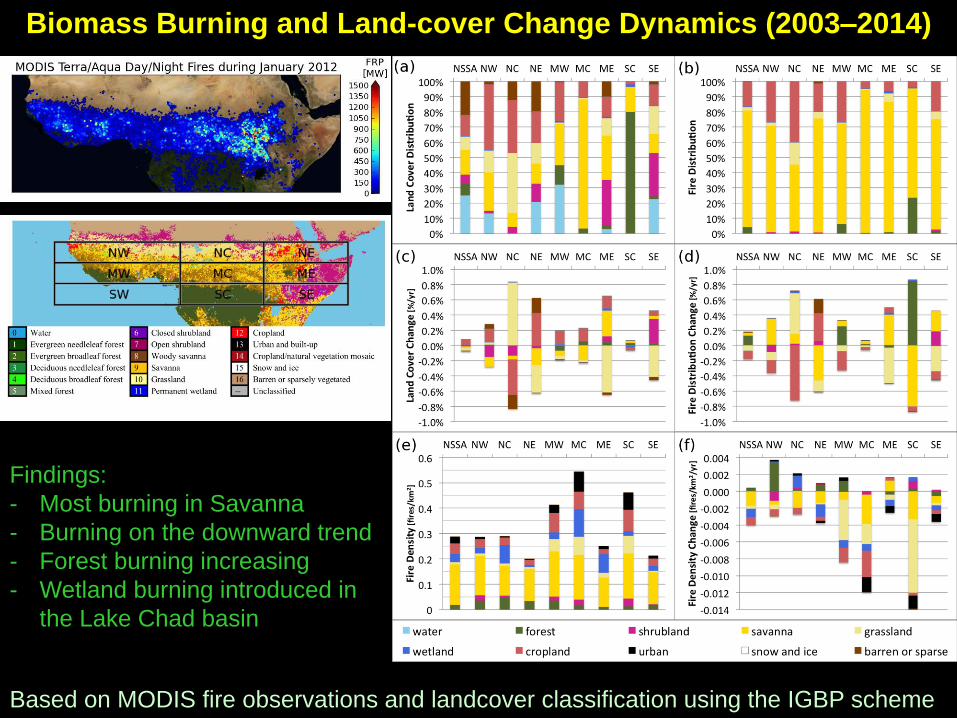
Based on MODIS fire observations and landcover classification using the IGBP scheme
Biomass Burning and Land-cover Change Dynamics (2003–2014)
Findings:
- Most burning in Savanna
- Burning on the downward trend
- Forest burning increasing
- Wetland burning introduced in
the Lake Chad basin

Scales of Interactions for modeling
LOCAL
IMPACT:
BB (albedo,
aerosol, FRP,
Veg dynamics,
soil moisture,
Precipitation,
direct/indirect
effect)
REGIONAL
IMPACT:
West African
Monsoon
(WAM)
GLOBAL
IMPACT:
Ocean &
General
Circulation
Cloud Feedback Heat Balance Atmos. Circulation
Season ~ Decades Monthly ~ Seasonal Hours ~ Days
Summary of NSSA Regional Study Biomass burning smoke emission is significant in NSSA (~25% global) and mixes with dust, potentially enhancing aerosol radiative forcing. Fires in NSSA produce a net decrease in surface albedo, which generally recovers to pre-fire values within 7 years in at least 98% of the cases. There is appreciable change in land cover from savanna to croplands/grasslands that can be linked to biomass burning. Although burning has decreased in the last decade, there is a perceptible increase in the burning of forests and wetlands.
Studies are ongoing to link the various components of fire-induced phenomena in order to comprehensively establish their role in drought and related societal impacts.
Lake Chad Basin Field Study February/March 2015
(Biomass Burning Season ramp-down)
Conducted In Partnership with the:
Lake Chad Basin Commission (LCBC), N’djamena, Chad
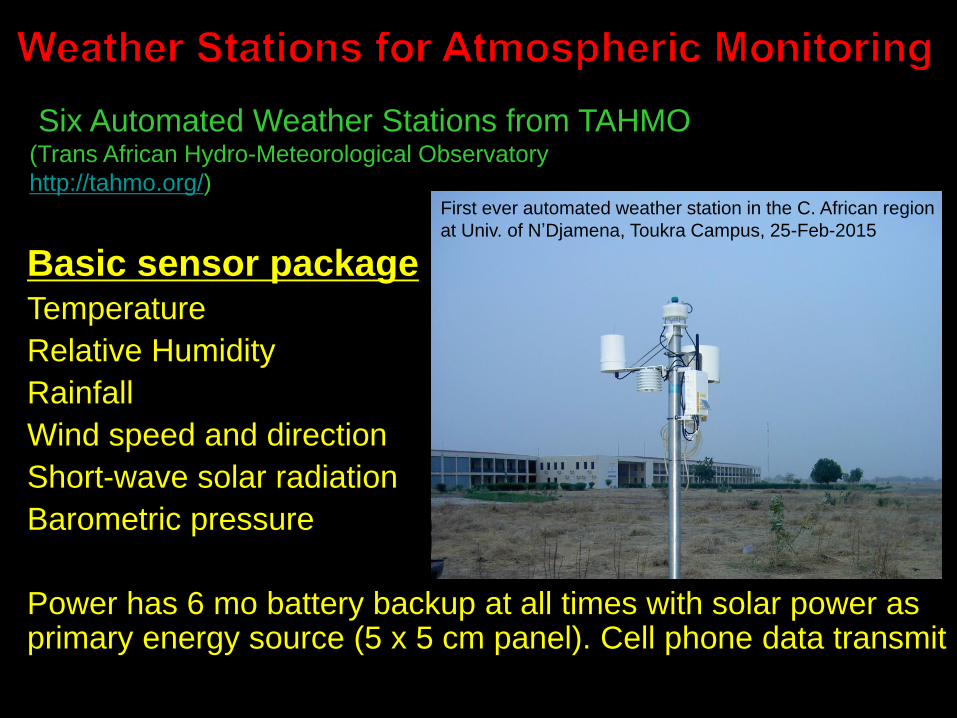
Six Automated Weather Stations from TAHMO (Trans African Hydro-Meteorological Observatory
http://tahmo.org/)
Basic sensor package Temperature
Relative Humidity
Rainfall
Wind speed and direction
Short-wave solar radiation
Barometric pressure
Power has 6 mo battery backup at all times with solar power as primary energy source (5 x 5 cm panel). Cell phone data transmit
First ever automated weather station in the C. African region
at Univ. of N’Djamena, Toukra Campus, 25-Feb-2015

Terrestrial Hydrology Sensor Network
o Date: February/March 2015 (Dry/Burning season ramp-down)
o Monitoring sensors for groundwater level, soil moisture,
seepage, and temperature
Groundwater level
5-10 wells with
divers and
datalogger
Soil moisture
6 stations with 3
sensors in
depth
Seepage rate
10-20 stations with
manometer along
Chari River
Soil moisture
probe at Univ. of
N’Djamena,
Toukra Campus,
25-Feb-2015

Objectives of LCB Field Study • Use the measurements to initialize/parameterize (terrestrial
and atmos.) models focused on the Lake Chad Basin
• Quantify the Lake Chad Basin Water Balance (Precip/Soil
Moisture/Groundwater)
• Understand the LCB Water Cycle Processes and the
Energy/Water Cycle Interactions and feedbacks
• Utilize the understanding of basin scale processes to study
extended regional processes
• Use measurements to validate regional data analysis and
modeling results
Acknowledgements
NASA Earth Science Interdisciplinary Studies (IDS) (c/o Drs. Jack Kaye and Hal Maring) for Funding Support Various NASA and other teams that provide data, as well as analysis and modeling support Various collaborating Agencies in Africa - Lake Chad Basin Commission - South African CSIR - Nigerian Space Agency (NASRDA) - The Nigerian Federal Surveys and Water Resources Ministry - and other agencies and individuals that have supported and/or
expressed their willingness to support the research.
Top Related