


Languages
Pages
Legal

94°30' W.
94°45' W.
94°15' W.
94° W.
44°15' N.
44°22'30" N.
NorthMankato
NicolletCourtland
Lafayette
St. Peter
)
169
14
14
99
)22
111
15
422
169
)
)
)
)
Fort RidgelyState Park
E
F F’
E’
B’
A A’
B
C
D D’
C’
E
F
E’
F’
D’
B’
A A’
B
C
D
C’
Symbols
Part B line of cross section shown on this plateWell used to generate cross section
A A’
Part A line of cross sectionA A’
1 0 1 2 3 4
SCALE 1:300 000
1 0 1 2 4 5 6 7 83 9 KILOMETERS
5 MILES
_j
g1
g2
p_u
_e
st
et
_tc
_tc lower
lh
ttmt
sg2 g1
uh
tt
Op
_m
g2
_w
ss
lh
ups
_sl
st
25
24,000
Nor
th M
anka
to
US
Hw
y 14
Min
neso
ta R
iver
1461.41
Recharge zone
F
1050
1100
1000
950
900
850
800
750
700
650
600
550
500
450
400
350
Ele
vatio
n (fe
et)
300
250
200
1050
1100
1000
950
900
850
800
750
700
650
600
550
500
450
400
300
250
200
350
F’
ups
etg2
sg1
sm
_e
stmt
_tc
_tc lower
st
_j
ups
tt
lh
lh
g1
p_u
tt
_sl
KdKd
st
mt
g1
tt
ups
sb
uh
Ka
mt
sg1
sh
g1
_w
ss
ss bt
sh
sge
_e
uh
g1
tt
sm
sge g2
uh
sg2
sb
lh
Kd
tt
_m
sg1
18
126
31114.3
44.2
1390
18,000
800
825
850
Sev
en M
ile C
reek
US
Hw
y 14
Sw
an L
ake
Nic
olle
t
Cou
rtlan
d
Sw
an L
ake
Out
let
Min
neso
ta R
iver
Min
neso
ta R
iver
<500
E
1050
1100
1000
950
900
850
800
750
700
650
600
550
500
450
400
350
Ele
vatio
n (fe
et)
1050
1100
1000
950
900
850
800
750
700
650
600
550
500
450
400
350
E’
_m
mt
Op
_j
sg1
lh
_m
tt
ss
mt
_w
stsg1
_e
sh
ttg1
lh
sm
tt
_e
lh
sstt
mt
sh
ttbtKa
Ka
mtst
sg1
_sl
uh
p_u
ups
mtsm
g2
Ka
sh
ups
mt st
g1sb
_tc_tc lower
g2
Ka
sm
17.6
25.1
7.81
13.8
189
103010.3
460
790
900
850
775
800
825
775
850875
800
875 900
825
Hey
man
s C
reek
Sw
an L
ake
Mid
dle
Lake
St.
Pet
er
Min
neso
ta R
iver
Min
neso
ta R
iver
Recharge zoneRecharge zone
D
1050
1100
1000
950
900
850
800
750
700
650
600
550
500
450
400
350
Ele
vatio
n (fe
et)
1050
1100
1000
950
900
850
800
750
700
650
600
550
500
450
400
350
D’
ss
stsg2
tt
vt
ups
sm
sg2g2
g1
Kasg1
_m
lh
ups
ss
sm
g1
ups
_tc_tc lower
ups
p_u
tt
Ka
sh
stmt
st
_j
ups
_sl
ups
st
g2
mtsm
ssg2 ups
sh
sg2sg1
_e
sm
mtsttt
g1
tt
g1
sh
Op
g2
_w
sge
g2
uh
5.84
10.6
48.7
8.9
22,000
8000
10017
16522.8
6.4191204
18201670
800
825
775
800 750
Sta
te H
wy
111
Min
neso
ta R
iver
Sta
te H
wy
15
Sta
te H
wy
22
Min
neso
ta R
iver
St.
Pet
er
Eric
kson
Lak
e
Recharge zone
C
1050
1100
1000
950
900
850
800
750
700
650
600
550
500
450
400
350
Ele
vatio
n (fe
et)
1050
1100
1000
950
900
850
800
750
700
650
600
550
500
450
400
350
C’
sh
uh
p_u
st
ss
ss
_m
sm
sv
sg2
ups
ups
sm
vt
_tc
g1
sh
_e
g1sg1sg1
sm
sh
sg2
vt
sge
tt
g2
lhlhlh
Ka
_w
_j
tt
uh
_sl
tt
g2
sm
sge
mtmt
ups
sm
ups
Op
sm
_tc lower
sh
mtsg1
ss
Kd
st
sv
ups
st
ups
5.58
22,00011309.28
19.5216
140
182
54021
860 152
4000
7000 775
800
825
800
Sta
te H
wy
15
Min
neso
ta R
iver
Sta
te H
wy
111
Min
neso
ta R
iver
Sta
te H
wy
22
Eig
ht M
ile C
reek
Recharge zone
B
1050
1100
1000
950
900
850
800
750
700
650
600
550
500
450
400
350
Ele
vatio
n (fe
et)
1050
1100
1000
950
900
850
800
750
700
650
600
550
500
450
400
350
B’
_esge
suug3sge
lh
g2
_tcups
sh
_slg3
sh
g1sg2
lh
g2
ssg2
Ka
sh
sg2
sg1
lh
lhuh uh
uhuh
sm
Kd
svsvvtsv
lh
sg1
tt
mt
mtsuuKd tt smsg1
Kr
Kr st
ups
g1
tt
sssg1
suug1
mt
g1Ka
tt
sg1
vt
Kd sg1mt
ups
_e
st
ups
g1
_w
tttt
_m
ups
p_u
lh
9.9
9.9
3114907
19.3
570
9701150
25.6
875
800
900
775
875
825
850
825
Sta
te H
wy
4M
inne
sota
Riv
er
Cle
ar L
ake
Sta
te H
wy
22
Lafa
yette
Littl
e R
ock
Cre
ek
Min
neso
ta R
iver
_tc lower
A
1050
1100
1000
950
900
850
800
750
700
650
600
550
500
450
400
350
Ele
vatio
n (fe
et)
1050
1100
1000
950
900
850
800
750
700
650
600
550
500
450
400
350
A’
1 0 1 2 3 4 5 MILES
1 0 1 2 4 5 6 7 83 9 KILOMETERS
SCALE 1:100 000VERTICAL EXAGGERATION X 50
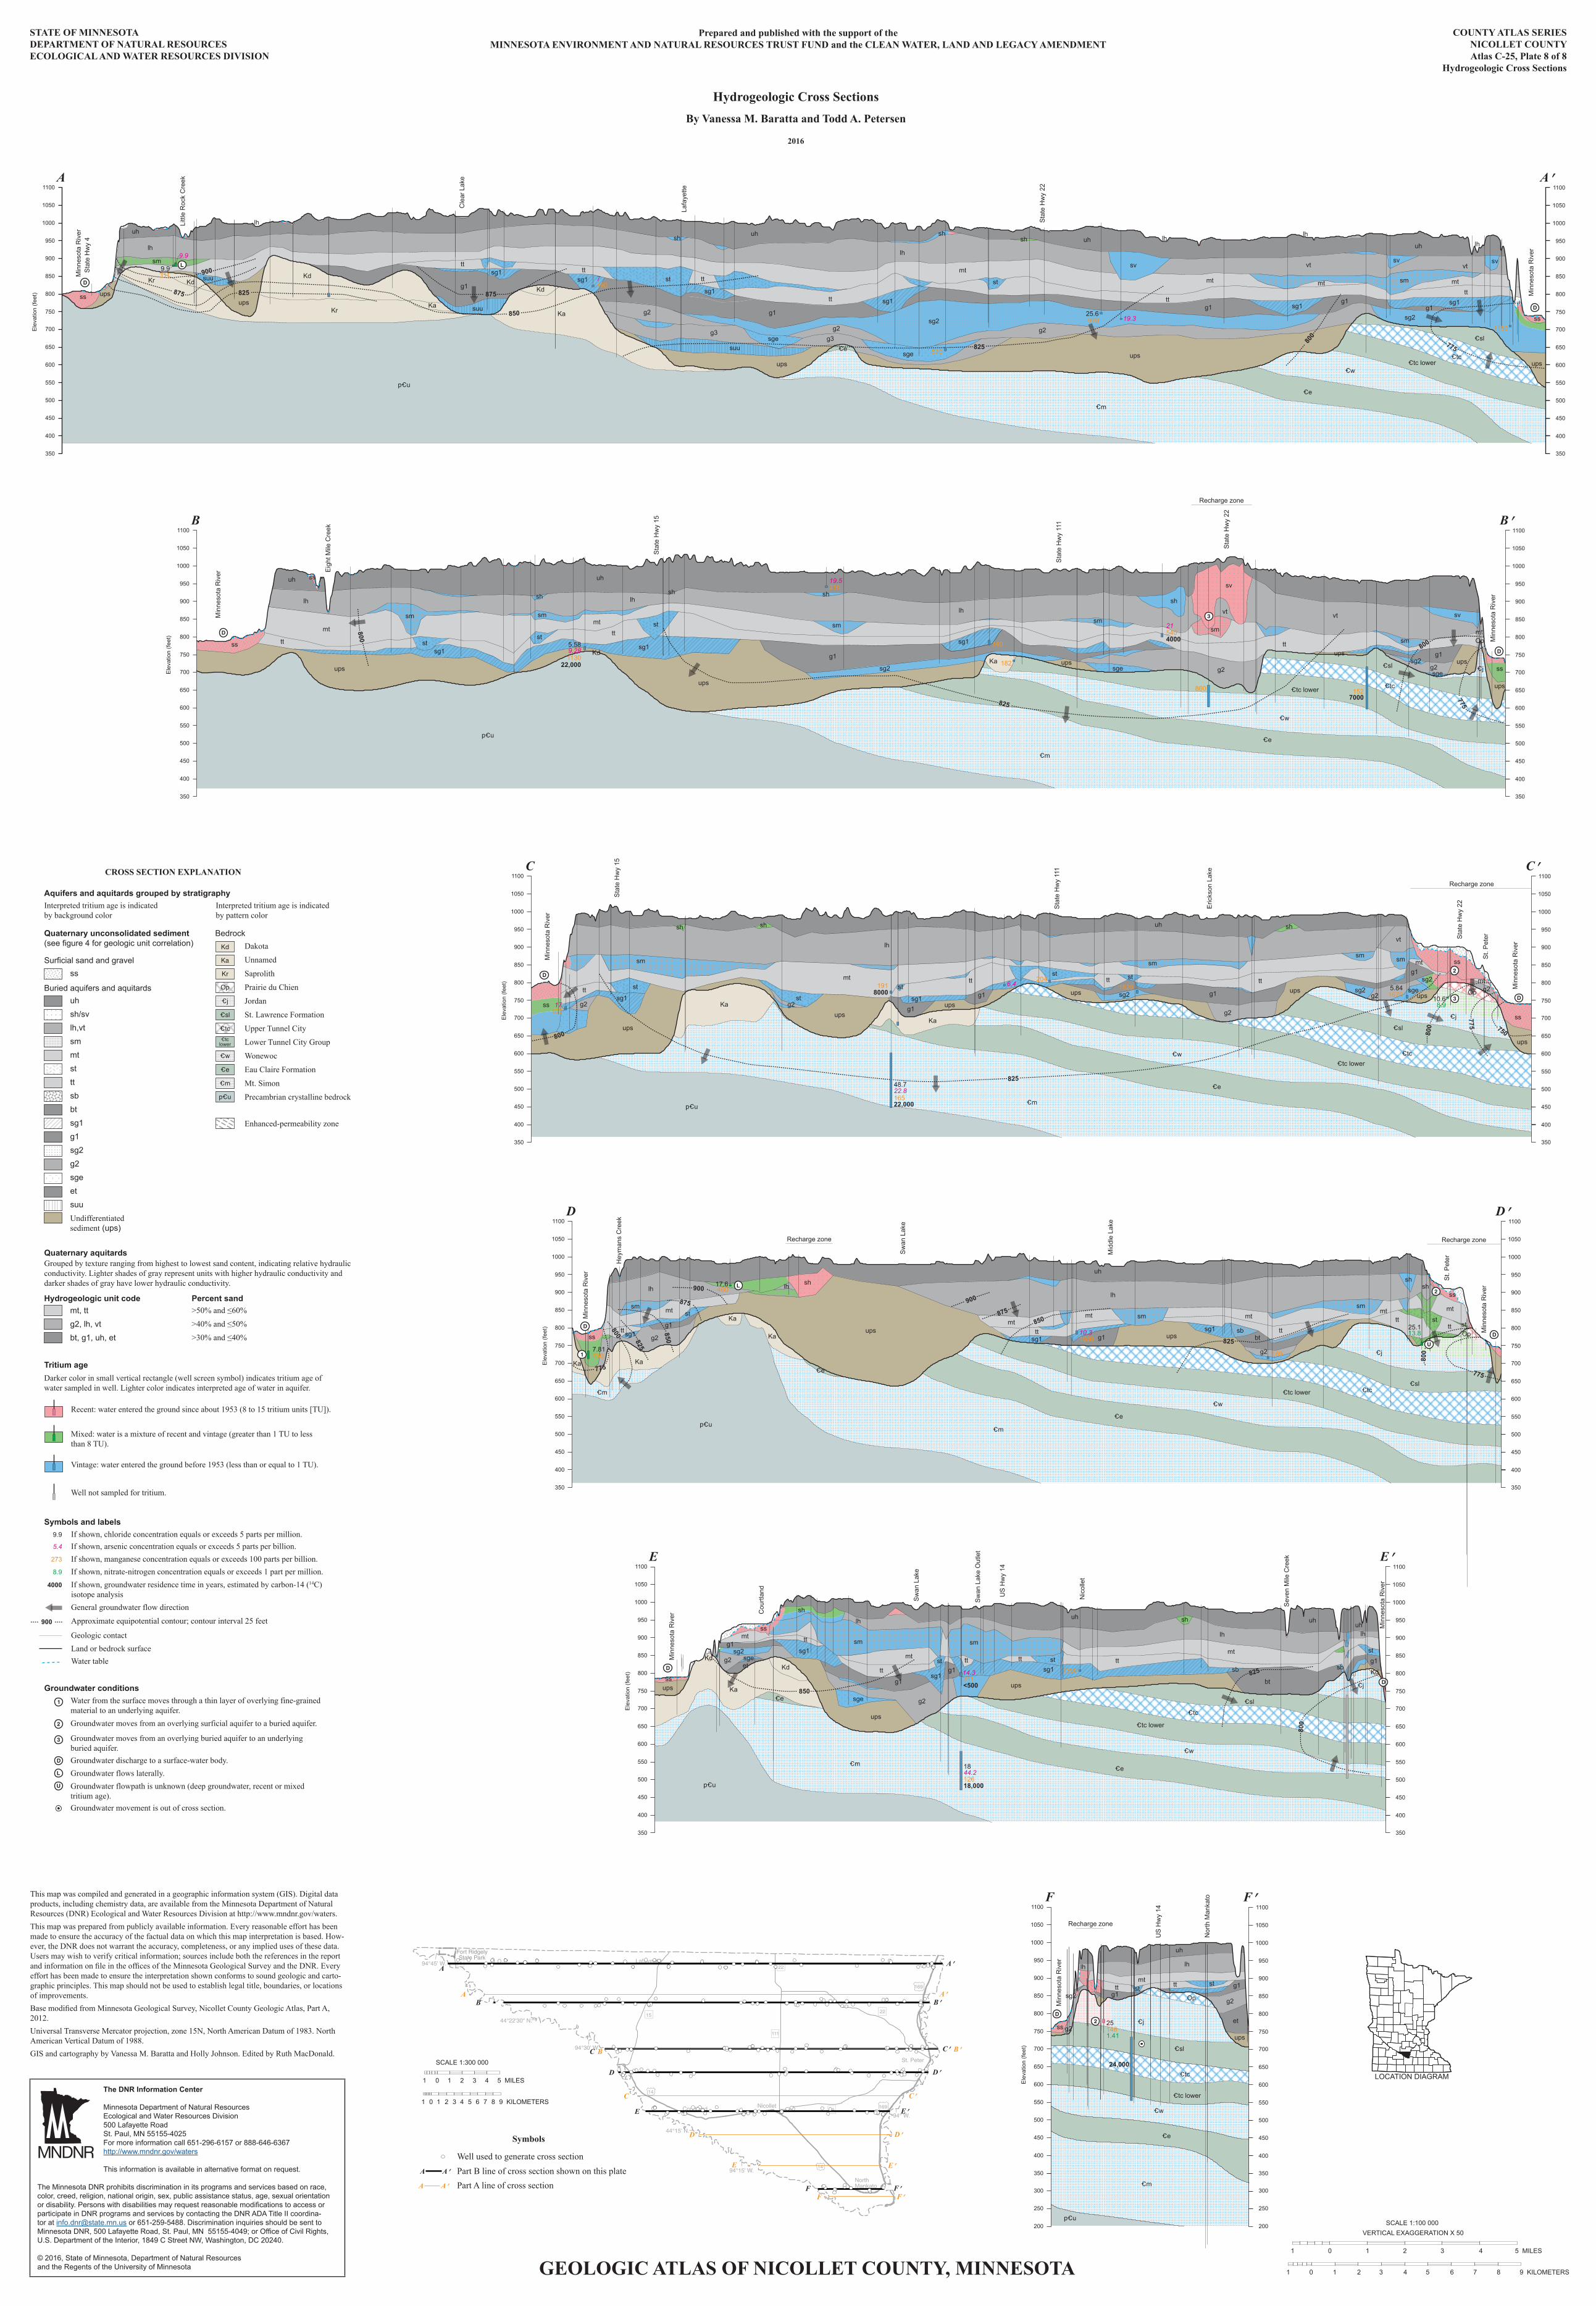
uhsh/svlh,vtsmmtstttsbbtsg1g1sg2g2sgeetsuuUndifferentiated sediment (ups)
ss
Aquifers and aquitards grouped by stratigraphy
Quaternary unconsolidated sediment (see figure 4 for geologic unit correlation)
Quaternary aquitardsGrouped by texture ranging from highest to lowest sand content, indicating relative hydraulic conductivity. Lighter shades of gray represent units with higher hydraulic conductivity and darker shades of gray have lower hydraulic conductivity.
Surficial sand and gravel
Buried aquifers and aquitards
Hydrogeologic unit code Percent sand
Bedrock Dakota
Unnamed
Saprolith
Prairie du Chien
Jordan
St. Lawrence Formation
Upper Tunnel City
Lower Tunnel City Group
Wonewoc
Eau Claire Formation
Mt. Simon
Precambrian crystalline bedrock
_j
Op
_e
_tc lower
_w
_tc
_sl
p_u
Kd
Ka
Kr
_m
mt, ttg2, lh, vtbt, g1, uh, et
>50% and ≤60%
>40% and ≤50%
>30% and ≤40%
Groundwater flowpath is unknown (deep groundwater, recent or mixed tritium age).
Groundwater flows laterally.
Groundwater moves from an overlying buried aquifer to an underlying buried aquifer.
Groundwater conditionsWater from the surface moves through a thin layer of overlying fine-grained material to an underlying aquifer.Groundwater moves from an overlying surficial aquifer to a buried aquifer.
If shown, chloride concentration equals or exceeds 5 parts per million.9.9
If shown, nitrate-nitrogen concentration equals or exceeds 1 part per million.8.9
If shown, groundwater residence time in years, estimated by carbon-14 (14C) isotope analysis
4000
Symbols and labels
Land or bedrock surface
General groundwater flow direction
Geologic contact
Approximate equipotential contour; contour interval 25 feet900
Water table
Tritium ageDarker color in small vertical rectangle (well screen symbol) indicates tritium age of water sampled in well. Lighter color indicates interpreted age of water in aquifer.
Mixed: water is a mixture of recent and vintage (greater than 1 TU to less than 8 TU).
Well not sampled for tritium.
Enhanced-permeability zone
Vintage: water entered the ground before 1953 (less than or equal to 1 TU).
Recent: water entered the ground since about 1953 (8 to 15 tritium units [TU]).
CROSS SECTION EXPLANATION
Interpreted tritium age is indicated by background color
Interpreted tritium age is indicated by pattern color
Groundwater discharge to a surface-water body.
Groundwater movement is out of cross section.
If shown, arsenic concentration equals or exceeds 5 parts per billion.5.4
If shown, manganese concentration equals or exceeds 100 parts per billion.273
LOCATION DIAGRAM
GEOLOGIC ATLAS OF NICOLLET COUNTY, MINNESOTA
The DNR Information Center
Minnesota Department of Natural ResourcesEcological and Water Resources Division500 Lafayette RoadSt. Paul, MN 55155-4025For more information call 651-296-6157 or 888-646-6367http://www.mndnr.gov/waters
This information is available in alternative format on request.
The Minnesota DNR prohibits discrimination in its programs and services based on race, color, creed, religion, national origin, sex, public assistance status, age, sexual orientation or disability. Persons with disabilities may request reasonable modifications to access or participate in DNR programs and services by contacting the DNR ADA Title II coordina-tor at [email protected] or 651-259-5488. Discrimination inquiries should be sent to Minnesota DNR, 500 Lafayette Road, St. Paul, MN 55155-4049; or Office of Civil Rights, U.S. Department of the Interior, 1849 C Street NW, Washington, DC 20240.
© 2016, State of Minnesota, Department of Natural Resourcesand the Regents of the University of Minnesota
This map was compiled and generated in a geographic information system (GIS). Digital data products, including chemistry data, are available from the Minnesota Department of Natural Resources (DNR) Ecological and Water Resources Division at http://www.mndnr.gov/waters.This map was prepared from publicly available information. Every reasonable effort has been made to ensure the accuracy of the factual data on which this map interpretation is based. How-ever, the DNR does not warrant the accuracy, completeness, or any implied uses of these data. Users may wish to verify critical information; sources include both the references in the report and information on file in the offices of the Minnesota Geological Survey and the DNR. Every effort has been made to ensure the interpretation shown conforms to sound geologic and carto-graphic principles. This map should not be used to establish legal title, boundaries, or locations of improvements.Base modified from Minnesota Geological Survey, Nicollet County Geologic Atlas, Part A, 2012.Universal Transverse Mercator projection, zone 15N, North American Datum of 1983. North American Vertical Datum of 1988.GIS and cartography by Vanessa M. Baratta and Holly Johnson. Edited by Ruth MacDonald.
COUNTY ATLAS SERIESNICOLLET COUNTYAtlas C-25, Plate 8 of 8
Hydrogeologic Cross Sections
Prepared and published with the support of the MINNESOTA ENVIRONMENT AND NATURAL RESOURCES TRUST FUND and the CLEAN WATER, LAND AND LEGACY AMENDMENT
STATE OF MINNESOTADEPARTMENT OF NATURAL RESOURCESECOLOGICAL AND WATER RESOURCES DIVISION
Hydrogeologic Cross SectionsBy Vanessa M. Baratta and Todd A. Petersen
2016
Top Related