Swan Lake - SWCD - FatCoweotswcd.fatcow.com/EOT/Documents/Lake Assessments/Swan Lake.pdf · RMB...
28
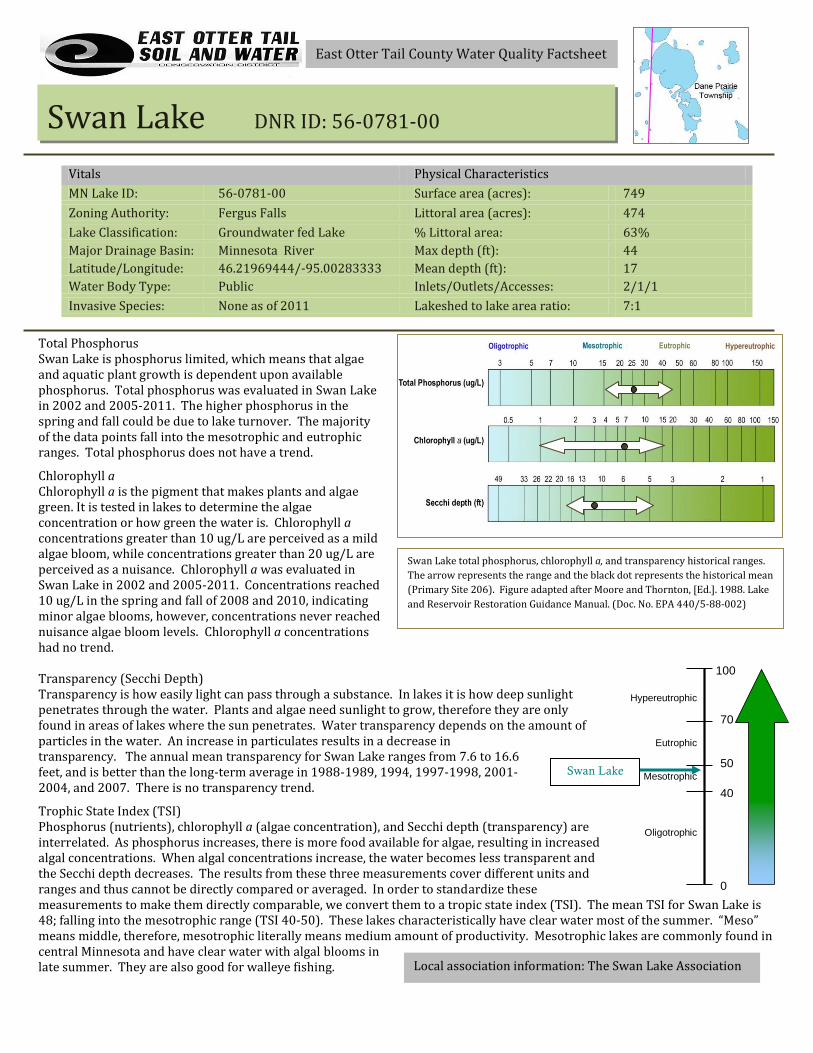
Vitals Physical Characteristics MN Lake ID: 56-0781-00 Surface area (acres): 749 Zoning Authority: Fergus Falls Littoral area (acres): 474 Lake Classification: Groundwater fed Lake % Littoral area: 63% Major Drainage Basin: Minnesota River Max depth (ft): 44 Latitude/Longitude: 46.21969444/-95.00283333 Mean depth (ft): 17 Water Body Type: Public Inlets/Outlets/Accesses: 2/1/1 Invasive Species: None as of 2011 Lakeshed to lake area ratio: 7:1 Total Phosphorus Swan Lake is phosphorus limited, which means that algae and aquatic plant growth is dependent upon available phosphorus. Total phosphorus was evaluated in Swan Lake in 2002 and 2005-2011. The higher phosphorus in the spring and fall could be due to lake turnover. The majority of the data points fall into the mesotrophic and eutrophic ranges. Total phosphorus does not have a trend. Chlorophyll a Chlorophyll a is the pigment that makes plants and algae green. It is tested in lakes to determine the algae concentration or how green the water is. Chlorophyll a concentrations greater than 10 ug/L are perceived as a mild algae bloom, while concentrations greater than 20 ug/L are perceived as a nuisance. Chlorophyll a was evaluated in Swan Lake in 2002 and 2005-2011. Concentrations reached 10 ug/L in the spring and fall of 2008 and 2010, indicating minor algae blooms, however, concentrations never reached nuisance algae bloom levels. Chlorophyll a concentrations had no trend. Transparency (Secchi Depth) Transparency is how easily light can pass through a substance. In lakes it is how deep sunlight penetrates through the water. Plants and algae need sunlight to grow, therefore they are only found in areas of lakes where the sun penetrates. Water transparency depends on the amount of particles in the water. An increase in particulates results in a decrease in transparency. The annual mean transparency for Swan Lake ranges from 7.6 to 16.6 feet, and is better than the long-term average in 1988-1989, 1994, 1997-1998, 2001- 2004, and 2007. There is no transparency trend. Trophic State Index (TSI) Phosphorus (nutrients), chlorophyll a (algae concentration), and Secchi depth (transparency) are interrelated. As phosphorus increases, there is more food available for algae, resulting in increased algal concentrations. When algal concentrations increase, the water becomes less transparent and the Secchi depth decreases. The results from these three measurements cover different units and ranges and thus cannot be directly compared or averaged. In order to standardize these measurements to make them directly comparable, we convert them to a tropic state index (TSI). The mean TSI for Swan Lake is 48; falling into the mesotrophic range (TSI 40-50). These lakes characteristically have clear water most of the summer. “Meso” means middle, therefore, mesotrophic literally means medium amount of productivity. Mesotrophic lakes are commonly found in central Minnesota and have clear water with algal blooms in late summer. They are also good for walleye fishing. East Otter Tail County Water Quality Factsheet Swan Lake DNR ID: 56-0781-00 Swan Lake total phosphorus, chlorophyll a, and transparency historical ranges. The arrow represents the range and the black dot represents the historical mean (Primary Site 206). Figure adapted after Moore and Thornton, [Ed.]. 1988. Lake and Reservoir Restoration Guidance Manual. (Doc. No. EPA 440/5-88-002) Hypereutrophic Eutrophic Mesotrophic Oligotrophic 100 0 50 40 70 Swan Lake Local association information: The Swan Lake Association
Transcript of Swan Lake - SWCD - FatCoweotswcd.fatcow.com/EOT/Documents/Lake Assessments/Swan Lake.pdf · RMB...
Vitals Physical Characteristics
MN Lake ID: 56-0781-00 Surface area (acres): 749
Zoning Authority: Fergus Falls Littoral area (acres): 474
Lake Classification: Groundwater fed Lake % Littoral area: 63%
Major Drainage Basin: Minnesota River Max depth (ft): 44
Latitude/Longitude: 46.21969444/-95.00283333 Mean depth (ft): 17
Water Body Type: Public Inlets/Outlets/Accesses: 2/1/1
Invasive Species: None as of 2011 Lakeshed to lake area ratio: 7:1
Total Phosphorus Swan Lake is phosphorus limited, which means that algae and aquatic plant growth is dependent upon available phosphorus. Total phosphorus was evaluated in Swan Lake in 2002 and 2005-2011. The higher phosphorus in the spring and fall could be due to lake turnover. The majority of the data points fall into the mesotrophic and eutrophic ranges. Total phosphorus does not have a trend.
Chlorophyll a Chlorophyll a is the pigment that makes plants and algae green. It is tested in lakes to determine the algae concentration or how green the water is. Chlorophyll a concentrations greater than 10 ug/L are perceived as a mild algae bloom, while concentrations greater than 20 ug/L are perceived as a nuisance. Chlorophyll a was evaluated in Swan Lake in 2002 and 2005-2011. Concentrations reached 10 ug/L in the spring and fall of 2008 and 2010, indicating minor algae blooms, however, concentrations never reached nuisance algae bloom levels. Chlorophyll a concentrations had no trend. Transparency (Secchi Depth) Transparency is how easily light can pass through a substance. In lakes it is how deep sunlight penetrates through the water. Plants and algae need sunlight to grow, therefore they are only found in areas of lakes where the sun penetrates. Water transparency depends on the amount of particles in the water. An increase in particulates results in a decrease in transparency. The annual mean transparency for Swan Lake ranges from 7.6 to 16.6 feet, and is better than the long-term average in 1988-1989, 1994, 1997-1998, 2001-2004, and 2007. There is no transparency trend.
Trophic State Index (TSI) Phosphorus (nutrients), chlorophyll a (algae concentration), and Secchi depth (transparency) are interrelated. As phosphorus increases, there is more food available for algae, resulting in increased algal concentrations. When algal concentrations increase, the water becomes less transparent and the Secchi depth decreases. The results from these three measurements cover different units and ranges and thus cannot be directly compared or averaged. In order to standardize these measurements to make them directly comparable, we convert them to a tropic state index (TSI). The mean TSI for Swan Lake is 48; falling into the mesotrophic range (TSI 40-50). These lakes characteristically have clear water most of the summer. “Meso” means middle, therefore, mesotrophic literally means medium amount of productivity. Mesotrophic lakes are commonly found in central Minnesota and have clear water with algal blooms in late summer. They are also good for walleye fishing.
East Otter Tail County Water Quality Factsheet
Series
Swan Lake DNR ID: 56-0781-00
Swan Lake total phosphorus, chlorophyll a, and transparency historical ranges.
The arrow represents the range and the black dot represents the historical mean
(Primary Site 206). Figure adapted after Moore and Thornton, [Ed.]. 1988. Lake
and Reservoir Restoration Guidance Manual. (Doc. No. EPA 440/5-88-002)
Hypereutrophic
Eutrophic
Mesotrophic
Oligotrophic
100
0
50
40
70
Swan Lake
Local association information: The Swan Lake Association
RMB Environmental Laboratories, Inc. 1 of 19 2012 Swan Lake
Swan Lake 56-0781-00 OTTER TAIL COUNTY
Lake Water Quality
Summary
Swan Lake is located 4 miles southeast of Fergus Falls, MN in Otter Tail County. It covers 749 acres (Table 1) and has a larger north basin and a smaller, shallower south basin. Swan Lake has two minor inlets, but is most likely dominantly fed by groundwater. The lake receives water from two inlets on the north end of the lake, and drains to the south through an outlet (Figure 1). The water leaving Swan Lake flows through several shallow lakes before joining the Pomme de Terre River. Water quality data have been collected on Swan Lake from 1986–2011
(Table 2–3). These data show that the lake is mesotrophic, with characteristic of moderately clear water throughout the summer and excellent recreational opportunities (page 9). The Swan Lake Association is involved in many activities such as water quality monitoring and education. They are also a member of the Otter Tail County Coalition of Lake Associations (COLA). Table 1. Swan Lake location and key physical characteristics.
Location Data
MN Lake ID: 56-0781-00
County: Otter Tail
Ecoregion: Central Hardwood Forest
Major Drainage Basin: Minnesota River
Latitude/Longitude: 46.21969444 / -96.00283333
Invasive Species: None as of 2011
Physical Characteristics
Surface area (acres): 749
Littoral area (acres): 474
% Littoral area: 63 %
Max depth (ft), (m): 44, 13.4
Inlets: 2
Outlets: 1
Public Accesses: 1
Table 2. Availability of primary data types for Swan Lake.
Data Availability
Transparency data
Excellent data set from 1987–2011.
Chemical data
Good total phosphorus and chlorophyll a data set from 2002, 2005–2011.
Inlet/Outlet data No inlet or outlet data exist for Swan Lake, but it doesn’t have any major inlets, so monitoring may not be necessary.
Recommendations
For recommendations refer to page 18.
RMB Environmental Laboratories, Inc. 2 of 19 2012 Swan Lake
Lake Map
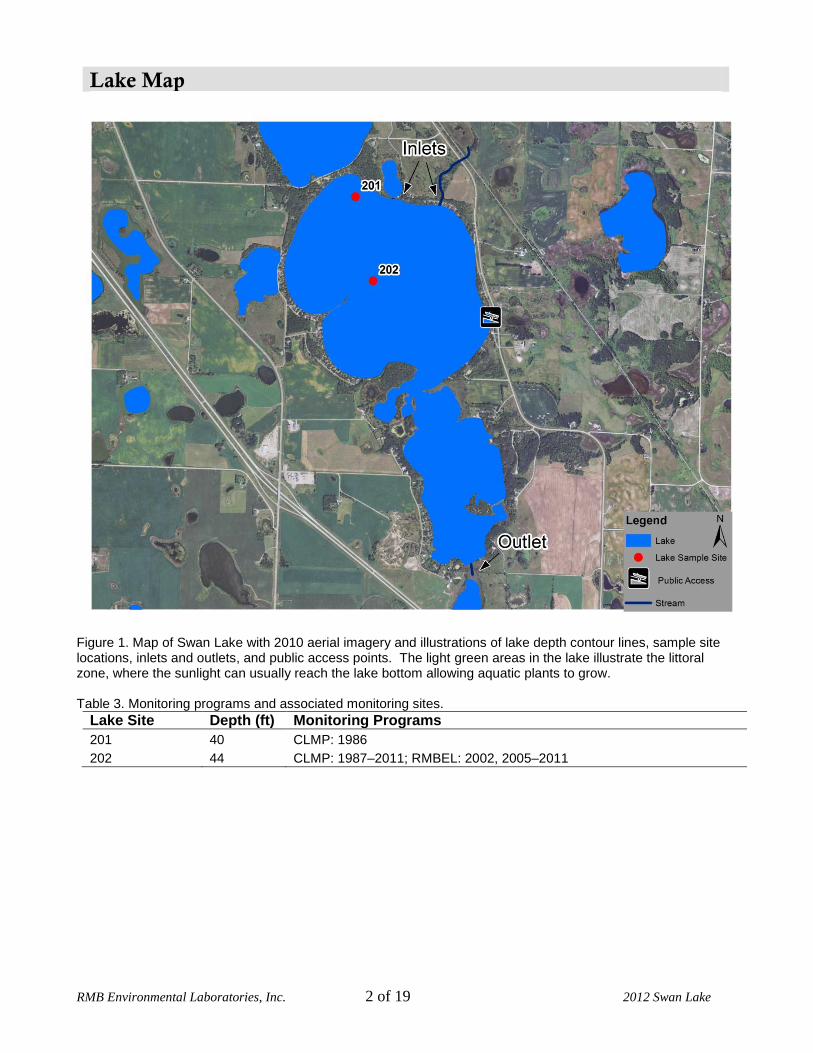
Figure 1. Map of Swan Lake with 2010 aerial imagery and illustrations of lake depth contour lines, sample site locations, inlets and outlets, and public access points. The light green areas in the lake illustrate the littoral zone, where the sunlight can usually reach the lake bottom allowing aquatic plants to grow. Table 3. Monitoring programs and associated monitoring sites.
Lake Site Depth (ft) Monitoring Programs
201 40 CLMP: 1986
202 44 CLMP: 1987–2011; RMBEL: 2002, 2005–2011
RMB Environmental Laboratories, Inc. 3 of 19 2012 Swan Lake
Water Quality Characteristics - Historical Means and Ranges
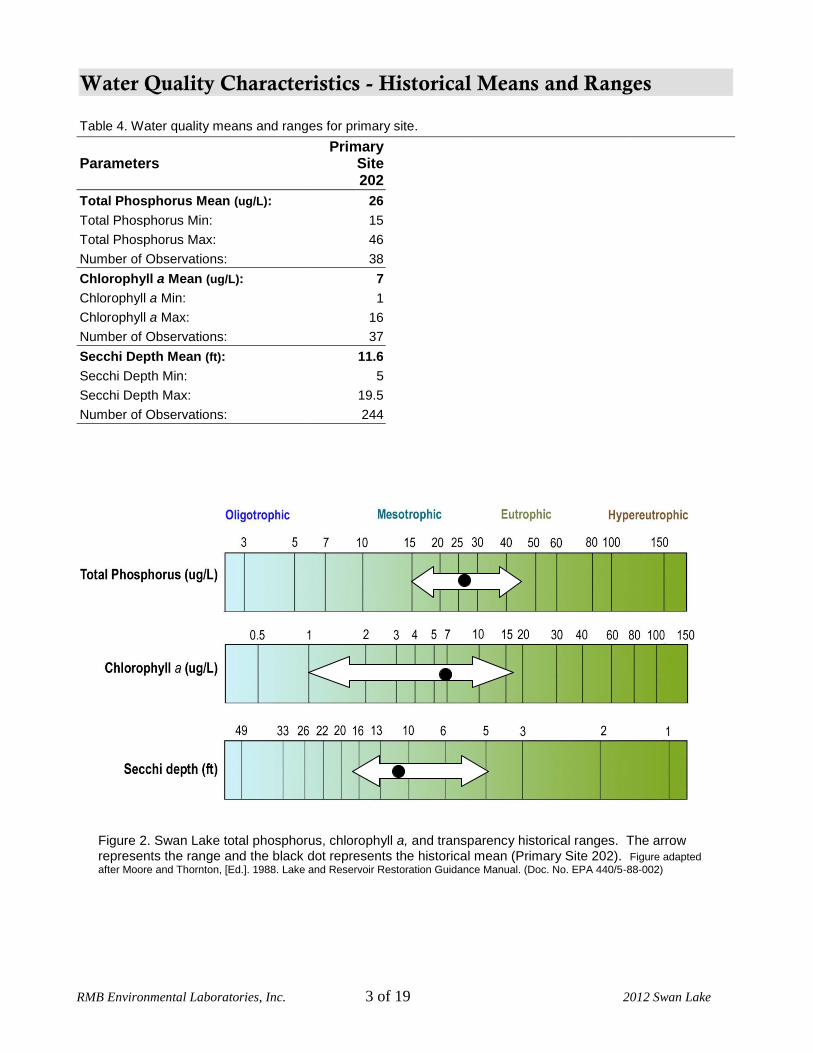
Table 4. Water quality means and ranges for primary site.
Parameters Primary
Site 202
Total Phosphorus Mean (ug/L): 26
Total Phosphorus Min: 15
Total Phosphorus Max: 46
Number of Observations: 38
Chlorophyll a Mean (ug/L): 7
Chlorophyll a Min: 1
Chlorophyll a Max: 16
Number of Observations: 37
Secchi Depth Mean (ft): 11.6
Secchi Depth Min: 5
Secchi Depth Max: 19.5
Number of Observations: 244
Figure 2. Swan Lake total phosphorus, chlorophyll a, and transparency historical ranges. The arrow represents the range and the black dot represents the historical mean (Primary Site 202). Figure adapted
after Moore and Thornton, [Ed.]. 1988. Lake and Reservoir Restoration Guidance Manual. (Doc. No. EPA 440/5-88-002)
RMB Environmental Laboratories, Inc. 4 of 19 2012 Swan Lake
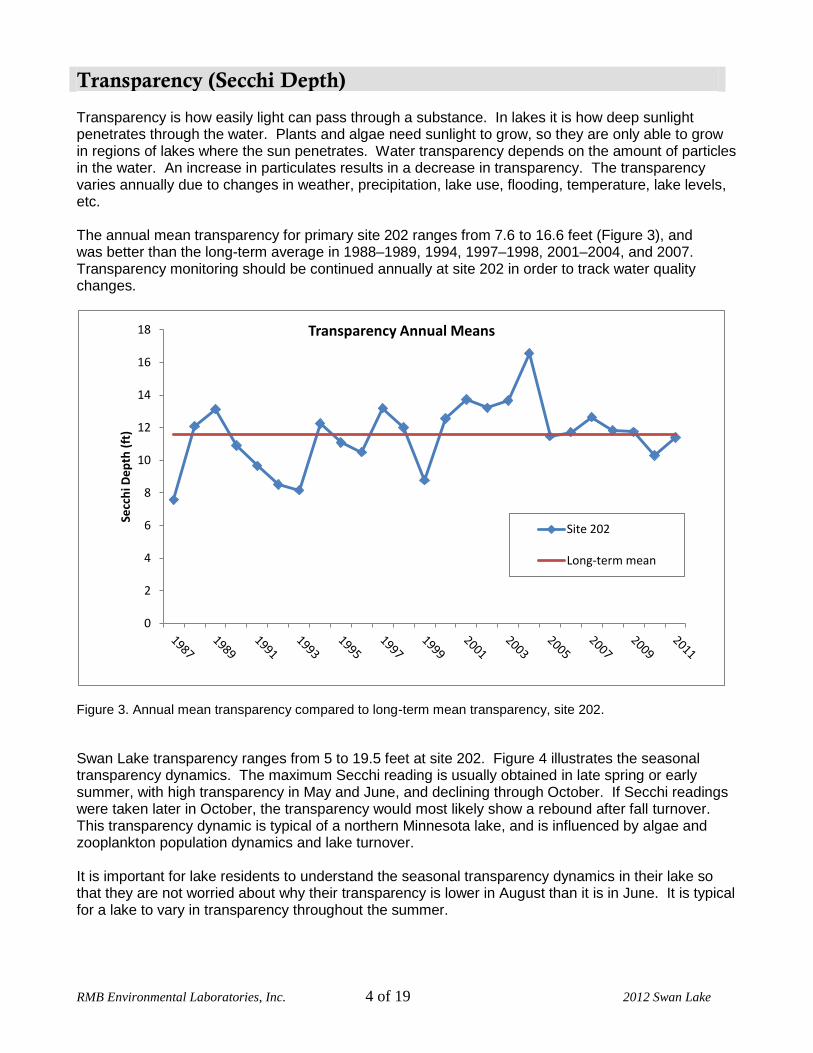
Transparency (Secchi Depth) Transparency is how easily light can pass through a substance. In lakes it is how deep sunlight penetrates through the water. Plants and algae need sunlight to grow, so they are only able to grow in regions of lakes where the sun penetrates. Water transparency depends on the amount of particles in the water. An increase in particulates results in a decrease in transparency. The transparency varies annually due to changes in weather, precipitation, lake use, flooding, temperature, lake levels, etc. The annual mean transparency for primary site 202 ranges from 7.6 to 16.6 feet (Figure 3), and was better than the long-term average in 1988–1989, 1994, 1997–1998, 2001–2004, and 2007. Transparency monitoring should be continued annually at site 202 in order to track water quality changes.
Figure 3. Annual mean transparency compared to long-term mean transparency, site 202.
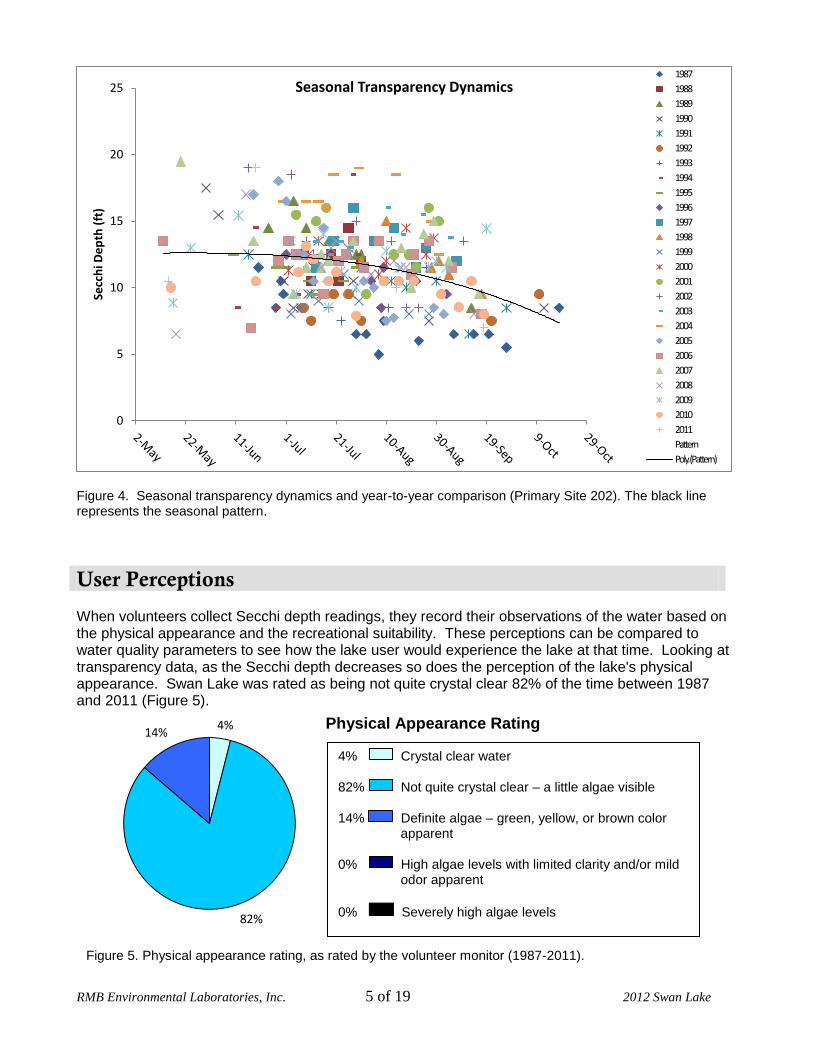
Swan Lake transparency ranges from 5 to 19.5 feet at site 202. Figure 4 illustrates the seasonal transparency dynamics. The maximum Secchi reading is usually obtained in late spring or early summer, with high transparency in May and June, and declining through October. If Secchi readings were taken later in October, the transparency would most likely show a rebound after fall turnover. This transparency dynamic is typical of a northern Minnesota lake, and is influenced by algae and zooplankton population dynamics and lake turnover. It is important for lake residents to understand the seasonal transparency dynamics in their lake so that they are not worried about why their transparency is lower in August than it is in June. It is typical for a lake to vary in transparency throughout the summer.
0
2
4
6
8
10
12
14
16
18
Secc
hi D
ep
th (
ft)
Transparency Annual Means
Site 202
Long-term mean
RMB Environmental Laboratories, Inc. 5 of 19 2012 Swan Lake
Figure 4. Seasonal transparency dynamics and year-to-year comparison (Primary Site 202). The black line represents the seasonal pattern.
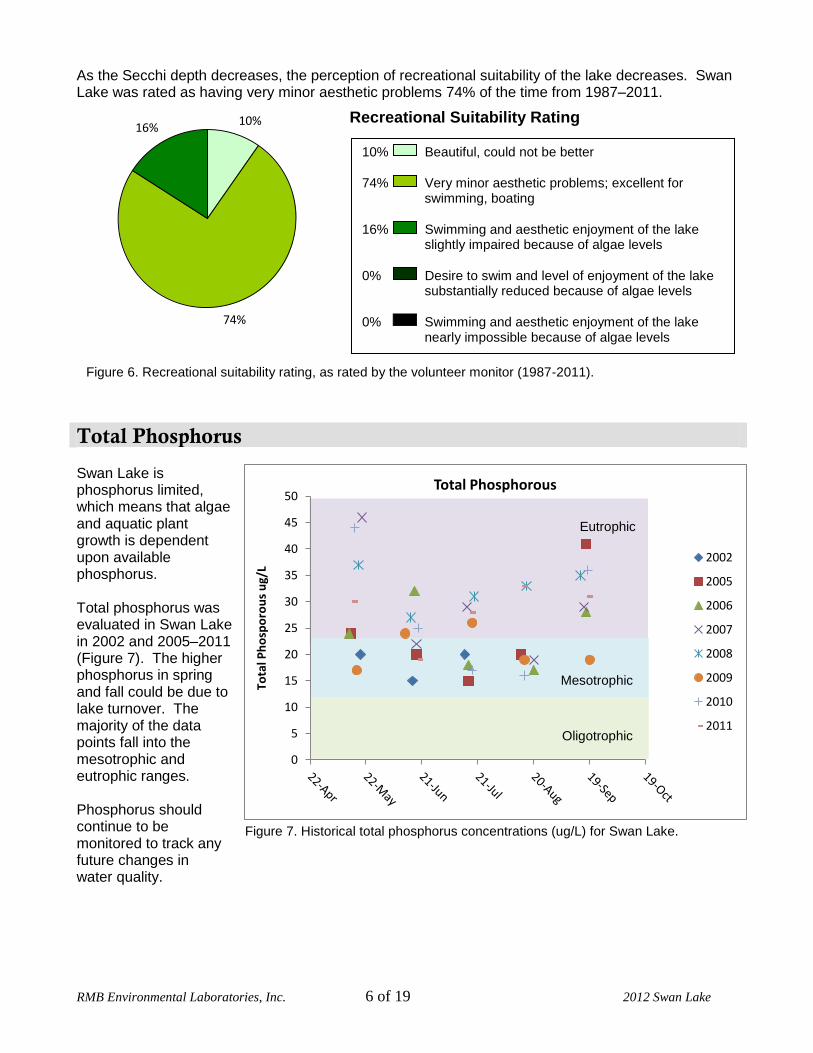
User Perceptions When volunteers collect Secchi depth readings, they record their observations of the water based on the physical appearance and the recreational suitability. These perceptions can be compared to water quality parameters to see how the lake user would experience the lake at that time. Looking at transparency data, as the Secchi depth decreases so does the perception of the lake's physical appearance. Swan Lake was rated as being not quite crystal clear 82% of the time between 1987 and 2011 (Figure 5).
0
5
10
15
20
25 Se
cch
i De
pth
(ft
) Seasonal Transparency Dynamics
1987
1988
1989
1990
1991
1992
1993
1994
1995
1996
1997
1998
1999
2000
2001
2002
2003
2004
2005
2006
2007
2008
2009
2010
2011
Pattern
Poly. (Pattern)
4%
82%
14%
Figure 5. Physical appearance rating, as rated by the volunteer monitor (1987-2011).
4% Crystal clear water
82% Not quite crystal clear – a little algae visible
14% Definite algae – green, yellow, or brown color apparent
0% High algae levels with limited clarity and/or mild odor apparent
0% Severely high algae levels
Physical Appearance Rating
RMB Environmental Laboratories, Inc. 6 of 19 2012 Swan Lake
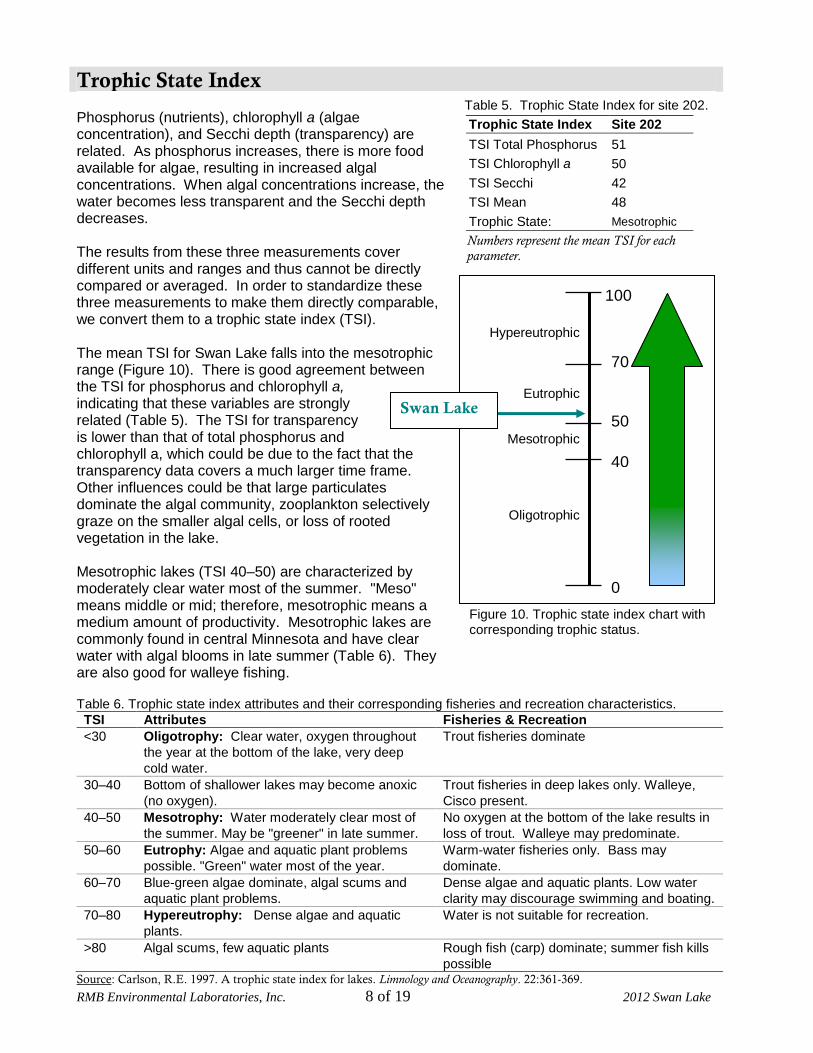
Figure 7. Historical total phosphorus concentrations (ug/L) for Swan Lake.
0
5
10
15
20
25
30
35
40
45
50
Tota
l Ph
osp
oro
us
ug/
L
Total Phosphorous
2002
2005
2006
2007
2008
2009
2010
2011
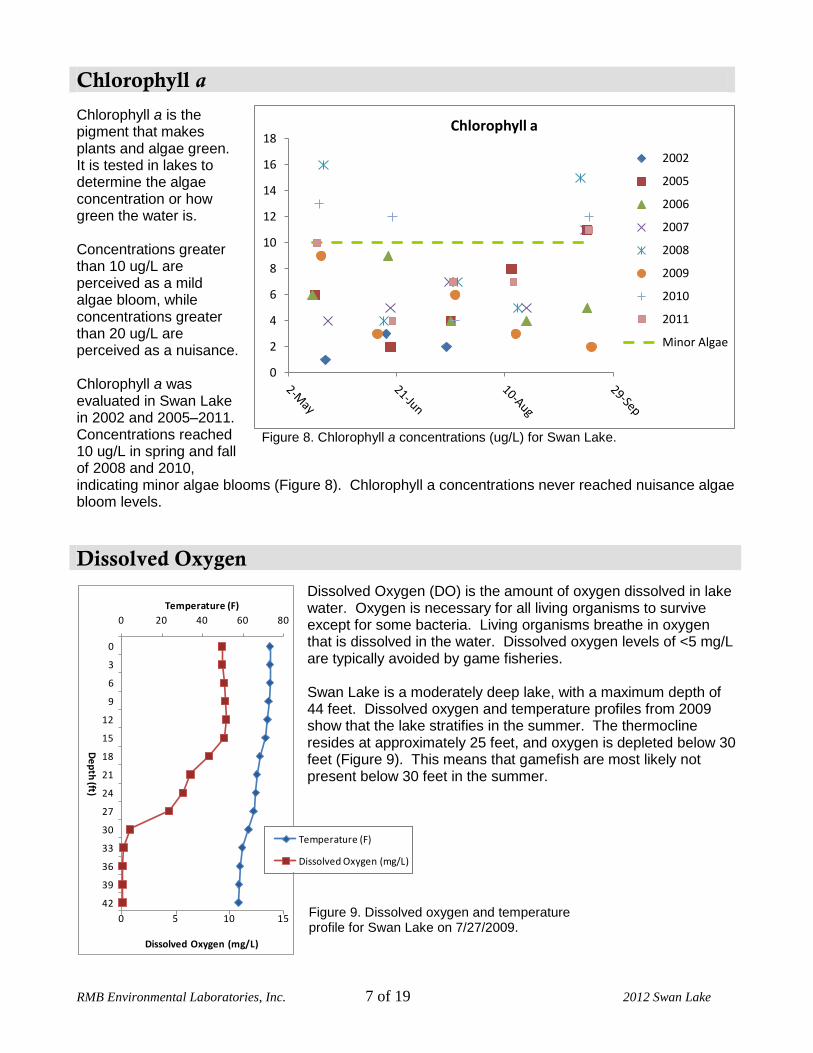
As the Secchi depth decreases, the perception of recreational suitability of the lake decreases. Swan Lake was rated as having very minor aesthetic problems 74% of the time from 1987–2011.
Total Phosphorus Swan Lake is phosphorus limited, which means that algae and aquatic plant growth is dependent upon available phosphorus. Total phosphorus was evaluated in Swan Lake in 2002 and 2005–2011 (Figure 7). The higher phosphorus in spring and fall could be due to lake turnover. The majority of the data points fall into the mesotrophic and eutrophic ranges. Phosphorus should continue to be monitored to track any future changes in water quality.
10%
74%
16%
Figure 6. Recreational suitability rating, as rated by the volunteer monitor (1987-2011).
10% Beautiful, could not be better
74% Very minor aesthetic problems; excellent for swimming, boating
16% Swimming and aesthetic enjoyment of the lake slightly impaired because of algae levels
0% Desire to swim and level of enjoyment of the lake substantially reduced because of algae levels
0% Swimming and aesthetic enjoyment of the lake nearly impossible because of algae levels
Recreational Suitability Rating
Oligotrophic
Mesotrophic
Eutrophic
RMB Environmental Laboratories, Inc. 7 of 19 2012 Swan Lake
0
2
4
6
8
10
12
14
16
18 Chlorophyll a
2002
2005
2006
2007
2008
2009
2010
2011
Minor Algae
0 5 10 15
0 20 40 60 80
0
3
6
9
12
15
18
21
24
27
30
33
36
39
42
Dissolved Oxygen (mg/L)
Temperature (F)
De
pth
(ft)
Chlorophyll a
Chlorophyll a is the pigment that makes plants and algae green. It is tested in lakes to determine the algae concentration or how green the water is. Concentrations greater than 10 ug/L are perceived as a mild algae bloom, while concentrations greater than 20 ug/L are perceived as a nuisance. Chlorophyll a was evaluated in Swan Lake in 2002 and 2005–2011. Concentrations reached 10 ug/L in spring and fall of 2008 and 2010, indicating minor algae blooms (Figure 8). Chlorophyll a concentrations never reached nuisance algae bloom levels.
Dissolved Oxygen
Dissolved Oxygen (DO) is the amount of oxygen dissolved in lake water. Oxygen is necessary for all living organisms to survive except for some bacteria. Living organisms breathe in oxygen that is dissolved in the water. Dissolved oxygen levels of <5 mg/L are typically avoided by game fisheries. Swan Lake is a moderately deep lake, with a maximum depth of 44 feet. Dissolved oxygen and temperature profiles from 2009 show that the lake stratifies in the summer. The thermocline resides at approximately 25 feet, and oxygen is depleted below 30 feet (Figure 9). This means that gamefish are most likely not present below 30 feet in the summer.
Figure 8. Chlorophyll a concentrations (ug/L) for Swan Lake.
0
2
4
6
8
10
12
0
10
20
30
40
50
60
70
80
0 6 12 18 24 30 36 42
Dis
solv
ed
Oxy
gen
(m
g/L)
Tem
pe
ratu
re (F
)
Depth (ft)
Temperature (F)
Dissolved Oxygen (mg/L)
Figure 9. Dissolved oxygen and temperature profile for Swan Lake on 7/27/2009.
RMB Environmental Laboratories, Inc. 8 of 19 2012 Swan Lake
Hypereutrophic
Eutrophic
Mesotrophic
Oligotrophic
100
0
50
40
70
Trophic State Index Phosphorus (nutrients), chlorophyll a (algae concentration), and Secchi depth (transparency) are related. As phosphorus increases, there is more food available for algae, resulting in increased algal concentrations. When algal concentrations increase, the water becomes less transparent and the Secchi depth decreases. The results from these three measurements cover different units and ranges and thus cannot be directly compared or averaged. In order to standardize these three measurements to make them directly comparable, we convert them to a trophic state index (TSI). The mean TSI for Swan Lake falls into the mesotrophic range (Figure 10). There is good agreement between the TSI for phosphorus and chlorophyll a, indicating that these variables are strongly related (Table 5). The TSI for transparency is lower than that of total phosphorus and chlorophyll a, which could be due to the fact that the transparency data covers a much larger time frame. Other influences could be that large particulates dominate the algal community, zooplankton selectively graze on the smaller algal cells, or loss of rooted vegetation in the lake. Mesotrophic lakes (TSI 40–50) are characterized by moderately clear water most of the summer. "Meso" means middle or mid; therefore, mesotrophic means a medium amount of productivity. Mesotrophic lakes are commonly found in central Minnesota and have clear water with algal blooms in late summer (Table 6). They are also good for walleye fishing. Table 6. Trophic state index attributes and their corresponding fisheries and recreation characteristics. TSI Attributes Fisheries & Recreation
<30 Oligotrophy: Clear water, oxygen throughout
the year at the bottom of the lake, very deep
cold water.
Trout fisheries dominate
30–40 Bottom of shallower lakes may become anoxic
(no oxygen).
Trout fisheries in deep lakes only. Walleye,
Cisco present.
40–50 Mesotrophy: Water moderately clear most of
the summer. May be "greener" in late summer.
No oxygen at the bottom of the lake results in
loss of trout. Walleye may predominate.
50–60 Eutrophy: Algae and aquatic plant problems
possible. "Green" water most of the year.
Warm-water fisheries only. Bass may
dominate.
60–70 Blue-green algae dominate, algal scums and
aquatic plant problems.
Dense algae and aquatic plants. Low water
clarity may discourage swimming and boating.
70–80 Hypereutrophy: Dense algae and aquatic
plants.
Water is not suitable for recreation.
>80 Algal scums, few aquatic plants Rough fish (carp) dominate; summer fish kills
possible Source: Carlson, R.E. 1997. A trophic state index for lakes. Limnology and Oceanography. 22:361-369.
Trophic State Index Site 202
TSI Total Phosphorus 51
TSI Chlorophyll a 50
TSI Secchi 42
TSI Mean 48
Trophic State: Mesotrophic
Numbers represent the mean TSI for each
parameter.
Swan Lake
Table 5. Trophic State Index for site 202.
Figure 10. Trophic state index chart with corresponding trophic status.
RMB Environmental Laboratories, Inc. 9 of 19 2012 Swan Lake
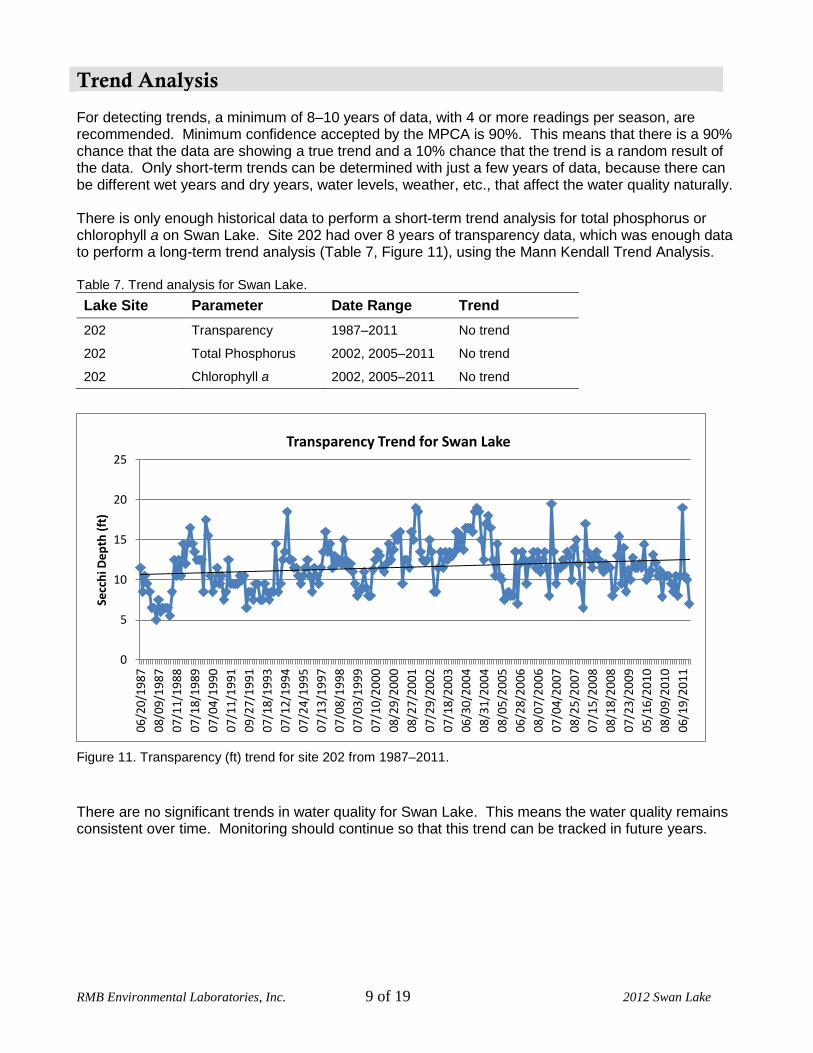
Trend Analysis For detecting trends, a minimum of 8–10 years of data, with 4 or more readings per season, are recommended. Minimum confidence accepted by the MPCA is 90%. This means that there is a 90% chance that the data are showing a true trend and a 10% chance that the trend is a random result of the data. Only short-term trends can be determined with just a few years of data, because there can be different wet years and dry years, water levels, weather, etc., that affect the water quality naturally. There is only enough historical data to perform a short-term trend analysis for total phosphorus or chlorophyll a on Swan Lake. Site 202 had over 8 years of transparency data, which was enough data to perform a long-term trend analysis (Table 7, Figure 11), using the Mann Kendall Trend Analysis. Table 7. Trend analysis for Swan Lake.
Lake Site Parameter Date Range Trend
202 Transparency 1987–2011 No trend
202 Total Phosphorus 2002, 2005–2011 No trend
202 Chlorophyll a 2002, 2005–2011 No trend
Figure 11. Transparency (ft) trend for site 202 from 1987–2011.
There are no significant trends in water quality for Swan Lake. This means the water quality remains consistent over time. Monitoring should continue so that this trend can be tracked in future years.
0
5
10
15
20
25
06
/20
/19
87
08
/09
/19
87
07
/11
/19
88
07
/18
/19
89
07
/04
/19
90
07
/11
/19
91
09
/27
/19
91
07
/18
/19
93
07
/12
/19
94
07
/24
/19
95
07
/13
/19
97
07
/08
/19
98
07
/03
/19
99
07
/10
/20
00
08
/29
/20
00
08
/27
/20
01
07
/29
/20
02
07
/18
/20
03
06
/30
/20
04
08
/31
/20
04
08
/05
/20
05
06
/28
/20
06
08
/07
/20
06
07
/04
/20
07
08
/25
/20
07
07
/15
/20
08
08
/18
/20
08
07
/23
/20
09
05
/16
/20
10
08
/09
/20
10
06
/19
/20
11
Secc
hi D
ep
th (
ft)
Transparency Trend for Swan Lake

RMB Environmental Laboratories, Inc. 10 of 19 2012 Swan Lake
increased algae
Ecoregion Comparisons Minnesota is divided into 7 ecoregions based on land use, vegetation, precipitation, and geology (Figure 12). The MPCA has developed a way to determine the average range of water quality expected for lakes in each ecoregion. From 1985–1988, the MPCA evaluated the lake water quality for reference lakes. These lakes are not considered pristine, but have little human impact and therefore are representative of the typical lakes within the ecoregion. The average range refers to the 25th – 75th percentile range for data within each ecoregion. For the purpose of this graphical representation, the means of the reference lake data sets were used. Swan Lake is in the Central Hardwood Forests Ecoregion. The mean total phosphorus, chlorophyll a, and transparency (Secchi depth) for Swan are all within the expected ecoregion ranges (Figure 13).
Figures 13a-c. Swan Lake ranges compared to Central Hardwood Forest Ecoregion ranges. The Swan Lake total phosphorus and chlorophyll a ranges are from 38 data points collected in May-September of 2002, 2005–2011. The Swan Lake Secchi depth range is from 244 data points collected in May-September from 1987–2011.
crystal
clear
Figure 12. Minnesota Ecoregions.
CHF
Ecoregion Swan
RMB Environmental Laboratories, Inc. 11 of 19 2012 Swan Lake
Lakeshed Data and Interpretations
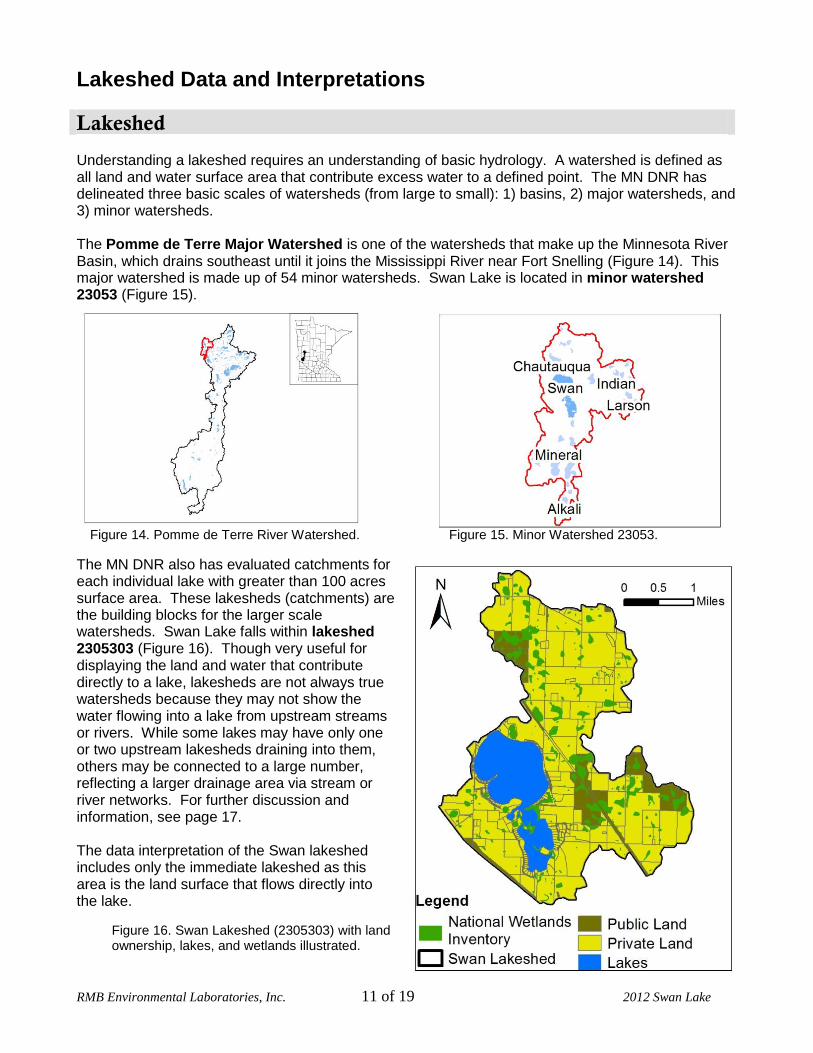
Lakeshed Understanding a lakeshed requires an understanding of basic hydrology. A watershed is defined as all land and water surface area that contribute excess water to a defined point. The MN DNR has delineated three basic scales of watersheds (from large to small): 1) basins, 2) major watersheds, and 3) minor watersheds. The Pomme de Terre Major Watershed is one of the watersheds that make up the Minnesota River Basin, which drains southeast until it joins the Mississippi River near Fort Snelling (Figure 14). This major watershed is made up of 54 minor watersheds. Swan Lake is located in minor watershed 23053 (Figure 15).
The MN DNR also has evaluated catchments for each individual lake with greater than 100 acres surface area. These lakesheds (catchments) are the building blocks for the larger scale watersheds. Swan Lake falls within lakeshed 2305303 (Figure 16). Though very useful for displaying the land and water that contribute directly to a lake, lakesheds are not always true watersheds because they may not show the water flowing into a lake from upstream streams or rivers. While some lakes may have only one or two upstream lakesheds draining into them, others may be connected to a large number, reflecting a larger drainage area via stream or river networks. For further discussion and information, see page 17. The data interpretation of the Swan lakeshed includes only the immediate lakeshed as this area is the land surface that flows directly into the lake.
Figure 14. Pomme de Terre River Watershed. Figure 15. Minor Watershed 23053.
Figure 16. Swan Lakeshed (2305303) with land ownership, lakes, and wetlands illustrated.
RMB Environmental Laboratories, Inc. 12 of 19 2012 Swan Lake
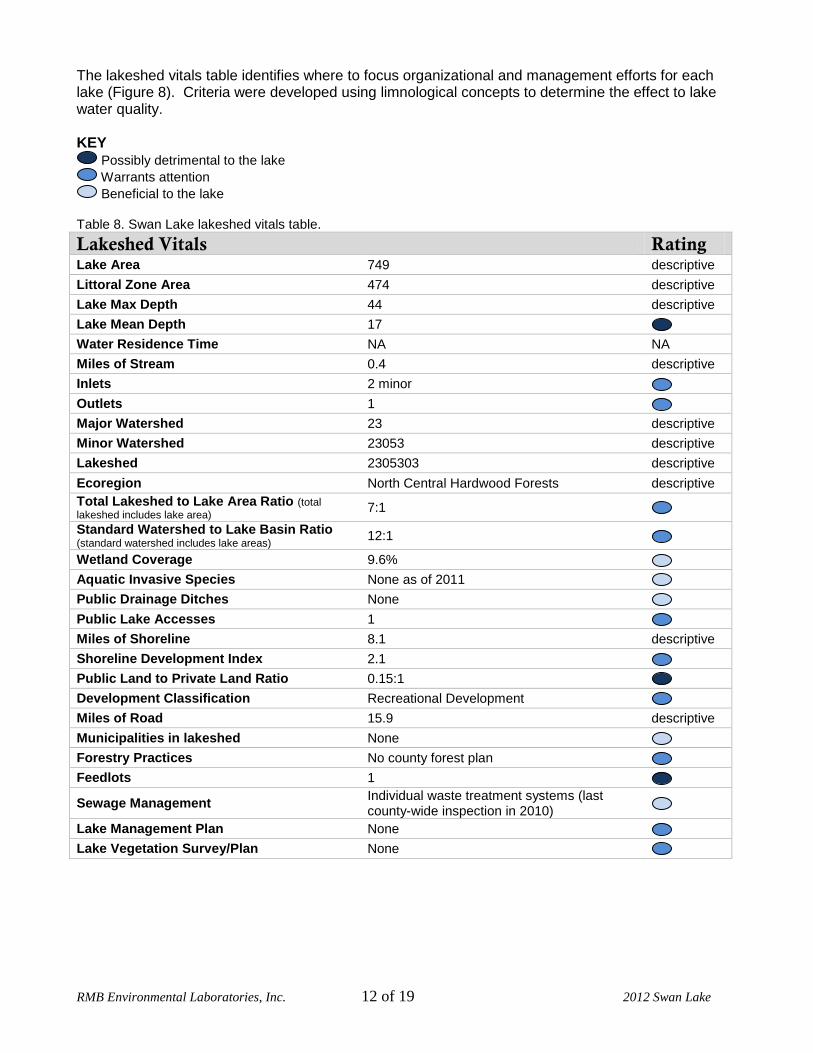
The lakeshed vitals table identifies where to focus organizational and management efforts for each lake (Figure 8). Criteria were developed using limnological concepts to determine the effect to lake water quality. KEY
Possibly detrimental to the lake Warrants attention
Beneficial to the lake Table 8. Swan Lake lakeshed vitals table.
Lakeshed Vitals Rating Lake Area 749 descriptive
Littoral Zone Area 474 descriptive
Lake Max Depth 44 descriptive
Lake Mean Depth 17
Water Residence Time NA NA
Miles of Stream 0.4 descriptive
Inlets 2 minor
Outlets 1
Major Watershed 23 descriptive
Minor Watershed 23053 descriptive
Lakeshed 2305303 descriptive
Ecoregion North Central Hardwood Forests descriptive
Total Lakeshed to Lake Area Ratio (total
lakeshed includes lake area) 7:1
Standard Watershed to Lake Basin Ratio (standard watershed includes lake areas)
12:1
Wetland Coverage 9.6%
Aquatic Invasive Species None as of 2011
Public Drainage Ditches None
Public Lake Accesses 1
Miles of Shoreline 8.1 descriptive
Shoreline Development Index 2.1
Public Land to Private Land Ratio 0.15:1
Development Classification Recreational Development
Miles of Road 15.9 descriptive
Municipalities in lakeshed None
Forestry Practices No county forest plan
Feedlots 1
Sewage Management Individual waste treatment systems (last county-wide inspection in 2010)
Lake Management Plan None
Lake Vegetation Survey/Plan None
RMB Environmental Laboratories, Inc. 13 of 19 2012 Swan Lake
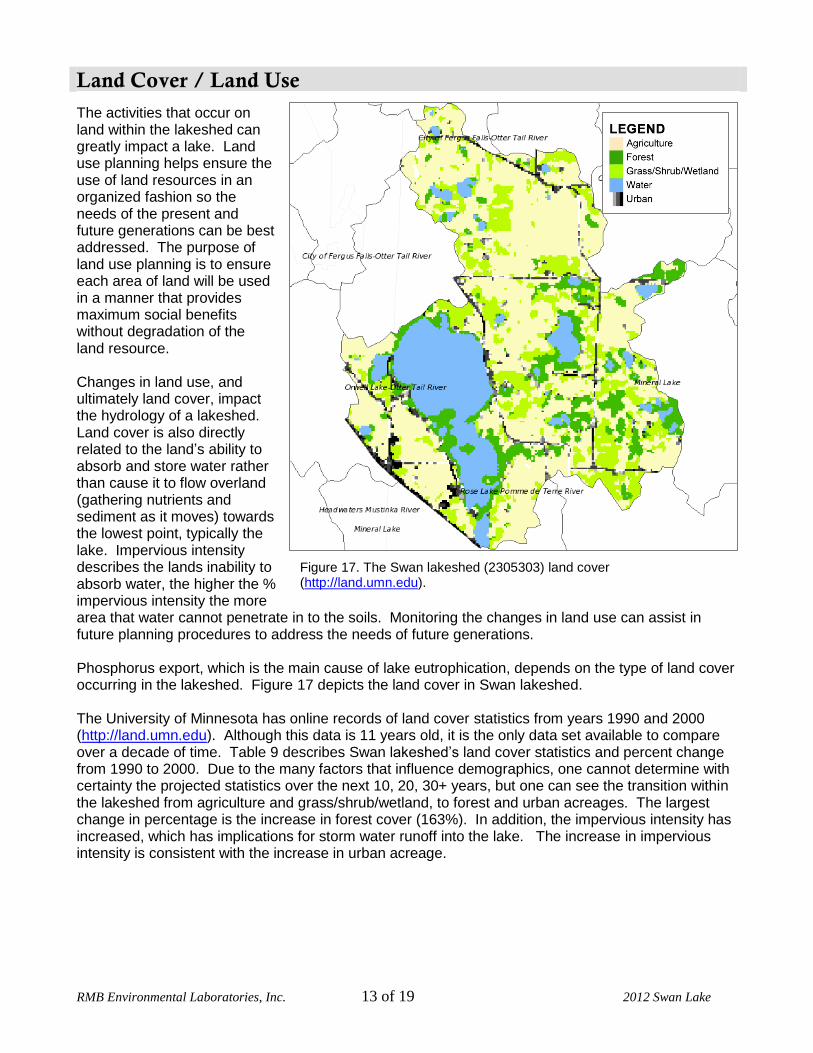
Figure 17. The Swan lakeshed (2305303) land cover (http://land.umn.edu).
Land Cover / Land Use
The activities that occur on land within the lakeshed can greatly impact a lake. Land use planning helps ensure the use of land resources in an organized fashion so the needs of the present and future generations can be best addressed. The purpose of land use planning is to ensure each area of land will be used in a manner that provides maximum social benefits without degradation of the land resource. Changes in land use, and ultimately land cover, impact the hydrology of a lakeshed. Land cover is also directly related to the land’s ability to absorb and store water rather than cause it to flow overland (gathering nutrients and sediment as it moves) towards the lowest point, typically the lake. Impervious intensity describes the lands inability to absorb water, the higher the % impervious intensity the more area that water cannot penetrate in to the soils. Monitoring the changes in land use can assist in future planning procedures to address the needs of future generations. Phosphorus export, which is the main cause of lake eutrophication, depends on the type of land cover occurring in the lakeshed. Figure 17 depicts the land cover in Swan lakeshed. The University of Minnesota has online records of land cover statistics from years 1990 and 2000 (http://land.umn.edu). Although this data is 11 years old, it is the only data set available to compare over a decade of time. Table 9 describes Swan lakeshed’s land cover statistics and percent change from 1990 to 2000. Due to the many factors that influence demographics, one cannot determine with certainty the projected statistics over the next 10, 20, 30+ years, but one can see the transition within the lakeshed from agriculture and grass/shrub/wetland, to forest and urban acreages. The largest change in percentage is the increase in forest cover (163%). In addition, the impervious intensity has increased, which has implications for storm water runoff into the lake. The increase in impervious intensity is consistent with the increase in urban acreage.
RMB Environmental Laboratories, Inc. 14 of 19 2012 Swan Lake
Table 9. Swan lakeshed land cover statistics and % change from 1990 to 2000 (http://land.umn.edu). 1990 2000 % Change
1990 to 2000 Land Cover Acres Percent Acres Percent
Agriculture 3613 56.19 3139 48.82 13.1% Decrease Grass/Shrub/Wetland 1258 19.56 1095 17.03 13% Decrease Forest 270 4.2 710 11.04 163% Increase Water 1033 16.07 999 15.54 3.3% Decrease Urban 258 4.01 489 7.6 89.5% Increase Impervious Intensity %
0 6209 96.55 6036 93.86 2.8% Decrease 1–10 26 0.4 48 0.75 84.6% Increase 11–25 46 0.72 77 1.2 67.4% Increase 26–40 53 0.82 84 1.31 58.5% Increase 41–60 54 0.84 109 1.69 101.9% Increase 61–80 33 0.51 56 0.87 69.7% Increase 81–100 9 0.14 20 0.31 122.2% Increase Total Area 6430 6430 Total Impervious Area (Percent Impervious Area
Excludes Water Area)
85 1.57 155 2.85 82.4% Increase
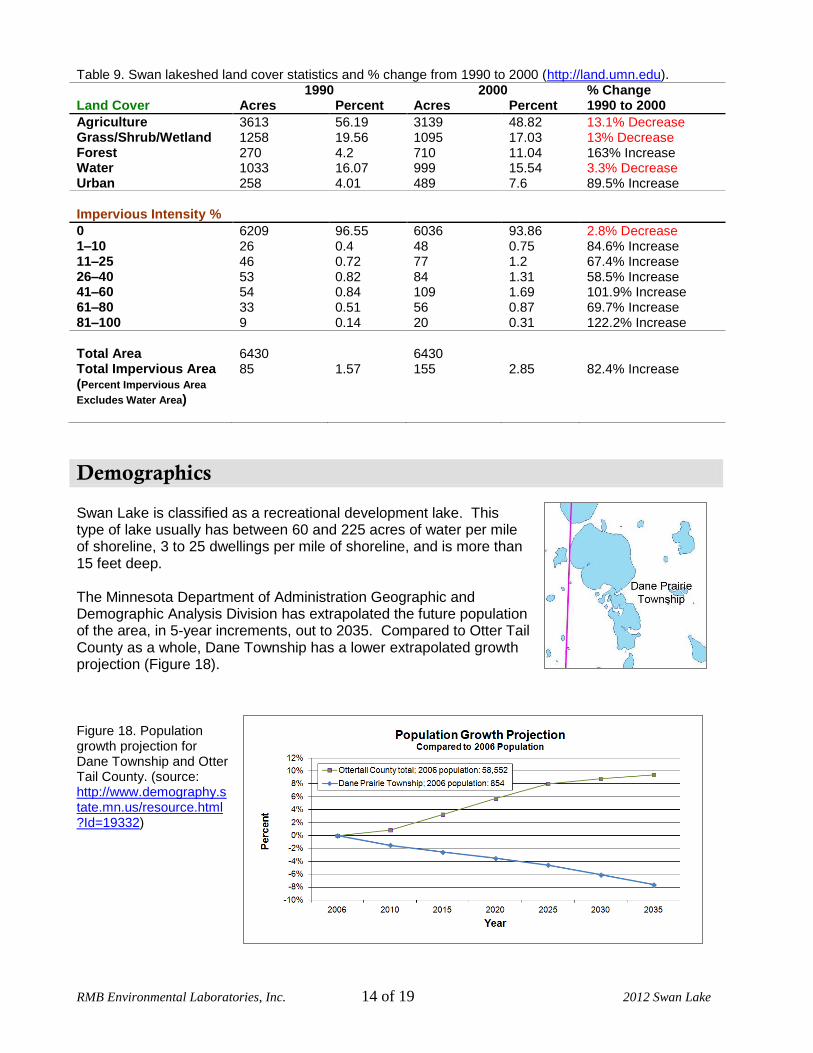
Demographics Swan Lake is classified as a recreational development lake. This type of lake usually has between 60 and 225 acres of water per mile of shoreline, 3 to 25 dwellings per mile of shoreline, and is more than 15 feet deep. The Minnesota Department of Administration Geographic and Demographic Analysis Division has extrapolated the future population of the area, in 5-year increments, out to 2035. Compared to Otter Tail County as a whole, Dane Township has a lower extrapolated growth projection (Figure 18). Figure 18. Population growth projection for Dane Township and Otter Tail County. (source: http://www.demography.state.mn.us/resource.html?Id=19332)
RMB Environmental Laboratories, Inc. 15 of 19 2012 Swan Lake
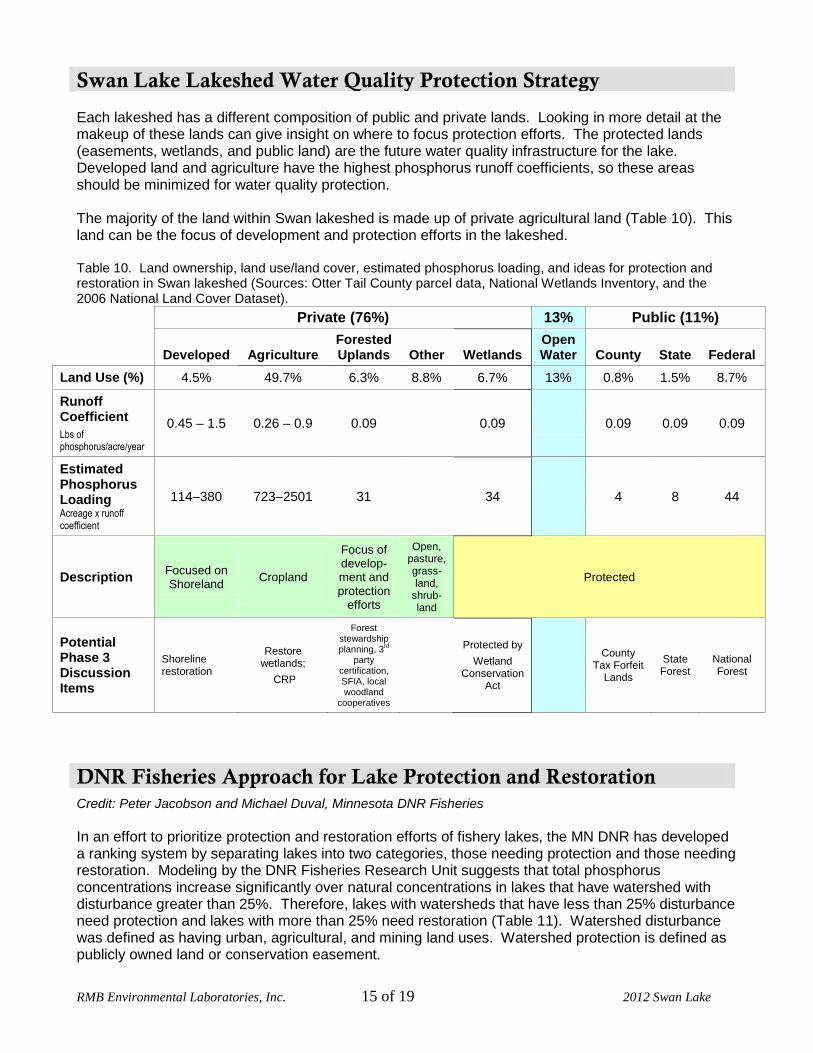
Swan Lake Lakeshed Water Quality Protection Strategy Each lakeshed has a different composition of public and private lands. Looking in more detail at the makeup of these lands can give insight on where to focus protection efforts. The protected lands (easements, wetlands, and public land) are the future water quality infrastructure for the lake. Developed land and agriculture have the highest phosphorus runoff coefficients, so these areas should be minimized for water quality protection. The majority of the land within Swan lakeshed is made up of private agricultural land (Table 10). This land can be the focus of development and protection efforts in the lakeshed. Table 10. Land ownership, land use/land cover, estimated phosphorus loading, and ideas for protection and restoration in Swan lakeshed (Sources: Otter Tail County parcel data, National Wetlands Inventory, and the 2006 National Land Cover Dataset).
Private (76%) 13% Public (11%)
Developed Agriculture
Forested Uplands Other Wetlands
Open Water County State Federal
Land Use (%) 4.5% 49.7% 6.3% 8.8% 6.7% 13% 0.8% 1.5% 8.7%
Runoff Coefficient
Lbs of phosphorus/acre/year
0.45 – 1.5 0.26 – 0.9 0.09 0.09 0.09 0.09 0.09
Estimated Phosphorus Loading Acreage x runoff coefficient
114–380 723–2501 31 34 4 8 44
Description Focused on Shoreland
Cropland
Focus of develop-ment and protection
efforts
Open, pasture, grass-land,
shrub-land
Protected
Potential Phase 3 Discussion Items
Shoreline restoration
Restore wetlands;
CRP
Forest stewardship planning, 3
rd
party certification, SFIA, local woodland
cooperatives
Protected by
Wetland Conservation
Act
County
Tax Forfeit Lands
State Forest
National Forest
DNR Fisheries Approach for Lake Protection and Restoration
Credit: Peter Jacobson and Michael Duval, Minnesota DNR Fisheries
In an effort to prioritize protection and restoration efforts of fishery lakes, the MN DNR has developed a ranking system by separating lakes into two categories, those needing protection and those needing restoration. Modeling by the DNR Fisheries Research Unit suggests that total phosphorus concentrations increase significantly over natural concentrations in lakes that have watershed with disturbance greater than 25%. Therefore, lakes with watersheds that have less than 25% disturbance need protection and lakes with more than 25% need restoration (Table 11). Watershed disturbance was defined as having urban, agricultural, and mining land uses. Watershed protection is defined as publicly owned land or conservation easement.
RMB Environmental Laboratories, Inc. 16 of 19 2012 Swan Lake
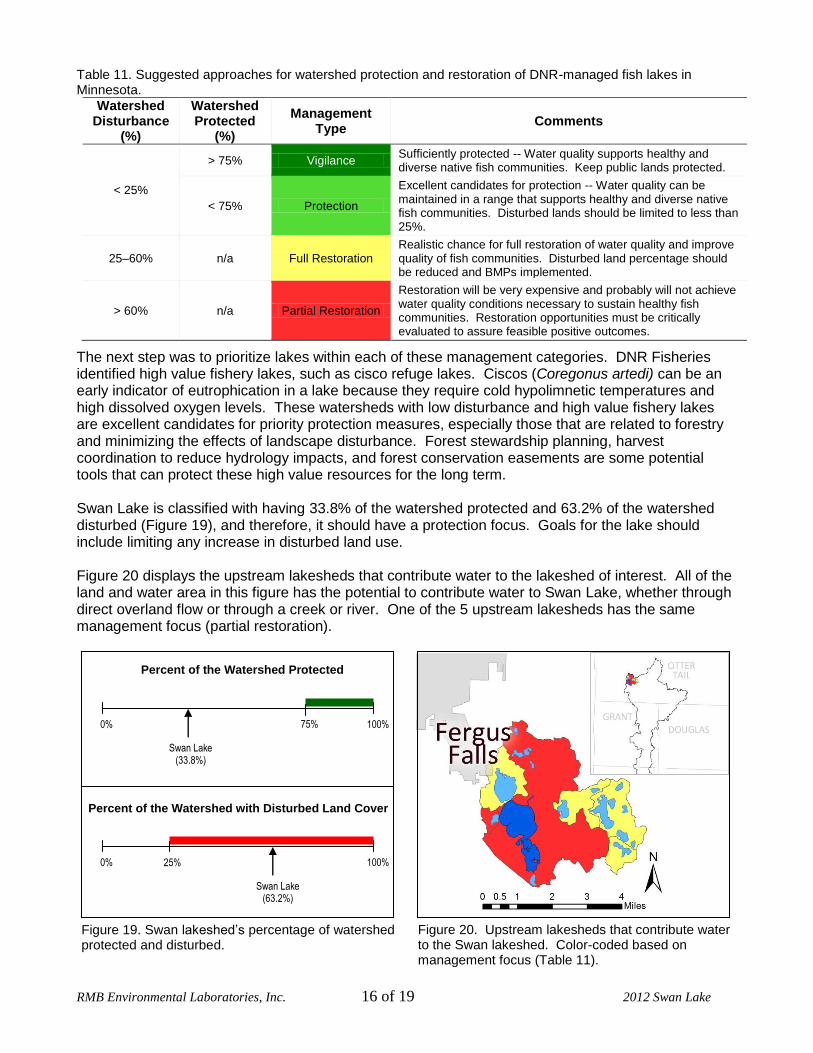
Table 11. Suggested approaches for watershed protection and restoration of DNR-managed fish lakes in Minnesota.
Watershed Disturbance
(%)
Watershed Protected
(%)
Management Type
Comments
< 25%
> 75% Vigilance Sufficiently protected -- Water quality supports healthy and diverse native fish communities. Keep public lands protected.
< 75% Protection
Excellent candidates for protection -- Water quality can be maintained in a range that supports healthy and diverse native fish communities. Disturbed lands should be limited to less than 25%.
25–60% n/a Full Restoration Realistic chance for full restoration of water quality and improve quality of fish communities. Disturbed land percentage should be reduced and BMPs implemented.
> 60% n/a Partial Restoration
Restoration will be very expensive and probably will not achieve water quality conditions necessary to sustain healthy fish communities. Restoration opportunities must be critically evaluated to assure feasible positive outcomes.
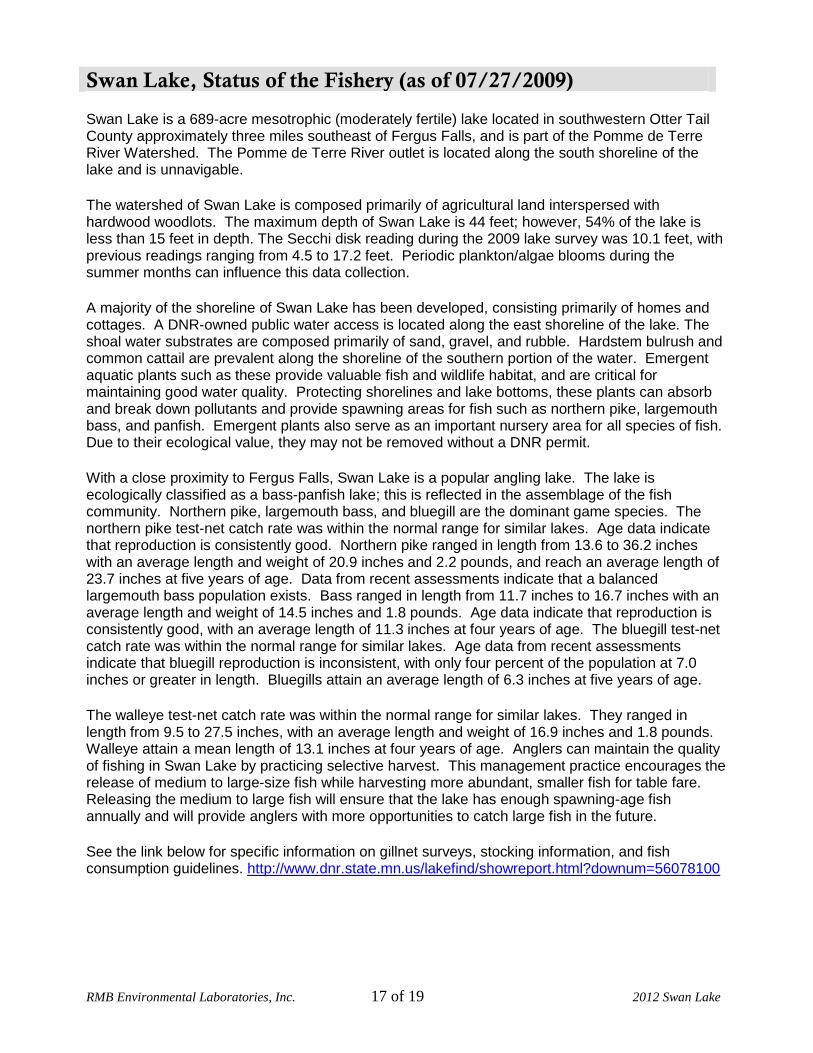
The next step was to prioritize lakes within each of these management categories. DNR Fisheries identified high value fishery lakes, such as cisco refuge lakes. Ciscos (Coregonus artedi) can be an early indicator of eutrophication in a lake because they require cold hypolimnetic temperatures and high dissolved oxygen levels. These watersheds with low disturbance and high value fishery lakes are excellent candidates for priority protection measures, especially those that are related to forestry and minimizing the effects of landscape disturbance. Forest stewardship planning, harvest coordination to reduce hydrology impacts, and forest conservation easements are some potential tools that can protect these high value resources for the long term. Swan Lake is classified with having 33.8% of the watershed protected and 63.2% of the watershed disturbed (Figure 19), and therefore, it should have a protection focus. Goals for the lake should include limiting any increase in disturbed land use. Figure 20 displays the upstream lakesheds that contribute water to the lakeshed of interest. All of the land and water area in this figure has the potential to contribute water to Swan Lake, whether through direct overland flow or through a creek or river. One of the 5 upstream lakesheds has the same management focus (partial restoration).
Percent of the Watershed Protected
Percent of the Watershed with Disturbed Land Cover
0% 100% 75%
Swan Lake (33.8%)
0% 100% 25%
Swan Lake (63.2%)
Figure 19. Swan lakeshed’s percentage of watershed protected and disturbed.
Figure 20. Upstream lakesheds that contribute water to the Swan lakeshed. Color-coded based on management focus (Table 11).
RMB Environmental Laboratories, Inc. 17 of 19 2012 Swan Lake
Swan Lake, Status of the Fishery (as of 07/27/2009)
Swan Lake is a 689-acre mesotrophic (moderately fertile) lake located in southwestern Otter Tail County approximately three miles southeast of Fergus Falls, and is part of the Pomme de Terre River Watershed. The Pomme de Terre River outlet is located along the south shoreline of the lake and is unnavigable.
The watershed of Swan Lake is composed primarily of agricultural land interspersed with hardwood woodlots. The maximum depth of Swan Lake is 44 feet; however, 54% of the lake is less than 15 feet in depth. The Secchi disk reading during the 2009 lake survey was 10.1 feet, with previous readings ranging from 4.5 to 17.2 feet. Periodic plankton/algae blooms during the summer months can influence this data collection.
A majority of the shoreline of Swan Lake has been developed, consisting primarily of homes and cottages. A DNR-owned public water access is located along the east shoreline of the lake. The shoal water substrates are composed primarily of sand, gravel, and rubble. Hardstem bulrush and common cattail are prevalent along the shoreline of the southern portion of the water. Emergent aquatic plants such as these provide valuable fish and wildlife habitat, and are critical for maintaining good water quality. Protecting shorelines and lake bottoms, these plants can absorb and break down pollutants and provide spawning areas for fish such as northern pike, largemouth bass, and panfish. Emergent plants also serve as an important nursery area for all species of fish. Due to their ecological value, they may not be removed without a DNR permit.
With a close proximity to Fergus Falls, Swan Lake is a popular angling lake. The lake is ecologically classified as a bass-panfish lake; this is reflected in the assemblage of the fish community. Northern pike, largemouth bass, and bluegill are the dominant game species. The northern pike test-net catch rate was within the normal range for similar lakes. Age data indicate that reproduction is consistently good. Northern pike ranged in length from 13.6 to 36.2 inches with an average length and weight of 20.9 inches and 2.2 pounds, and reach an average length of 23.7 inches at five years of age. Data from recent assessments indicate that a balanced largemouth bass population exists. Bass ranged in length from 11.7 inches to 16.7 inches with an average length and weight of 14.5 inches and 1.8 pounds. Age data indicate that reproduction is consistently good, with an average length of 11.3 inches at four years of age. The bluegill test-net catch rate was within the normal range for similar lakes. Age data from recent assessments indicate that bluegill reproduction is inconsistent, with only four percent of the population at 7.0 inches or greater in length. Bluegills attain an average length of 6.3 inches at five years of age.
The walleye test-net catch rate was within the normal range for similar lakes. They ranged in length from 9.5 to 27.5 inches, with an average length and weight of 16.9 inches and 1.8 pounds. Walleye attain a mean length of 13.1 inches at four years of age. Anglers can maintain the quality of fishing in Swan Lake by practicing selective harvest. This management practice encourages the release of medium to large-size fish while harvesting more abundant, smaller fish for table fare. Releasing the medium to large fish will ensure that the lake has enough spawning-age fish annually and will provide anglers with more opportunities to catch large fish in the future.
See the link below for specific information on gillnet surveys, stocking information, and fish consumption guidelines. http://www.dnr.state.mn.us/lakefind/showreport.html?downum=56078100
RMB Environmental Laboratories, Inc. 18 of 19 2012 Swan Lake
Key Findings / Recommendations
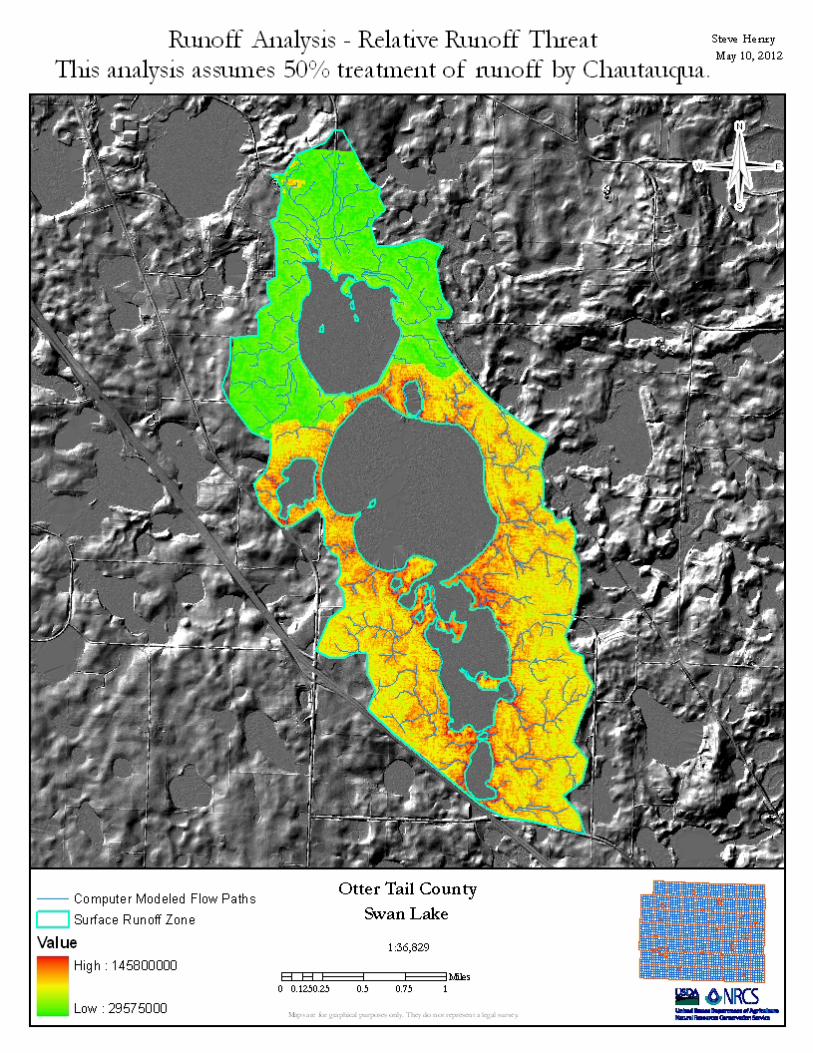
Monitoring Recommendations Transparency monitoring at site 202 should be continued annually. It is important to continue monitoring weekly, or at least bimonthly, every year to enable annual comparisons and trend analyses. In order to track future water quality trends, phosphorus and chlorophyll a monitoring should continue as the budget allows. Overall Conclusions Swan Lake is currently in good shape regarding water quality, but the lakeshed needs restoration from disturbed land uses. Swan Lake is a mestrophic lake (TSI=48) with no significant water quality trends. Eleven percent (11%) of the lakeshed is in public ownership, and 34% of it is protected, while 63% is disturbed (Figure 19). Swan Lake is benefitted by a fairly small watershed, as the watershed to lake area ratio is 12:1 (Table 8). In addition, there are no major rivers flowing into the lake, which can deposit nutrients directly. This means that the majority of the nutrients that enter the lake are from runoff around the lake including septic systems, lawns, and agriculture. However, Otter Tail County did a lake-wide septic system update of old systems in 2010, so they should be working properly. The main sources of phosphorus are lawns (unnatural shorelines) and agriculture. There are also a high number of roads in the lakeshed, which contribute to impervious surface area. Surface runoff mapping in the following pages shows the areas of greatest runoff potential. The areas in red have the highest potential impact on the lake. Most of these red areas are located directly around the shoreline, and can be targeted for restoration and/or rain garden installation projects. Priority Impacts to the Lake Agricultural land use in the lakeshed is high (50%), classifying it as a partial restoration (Table 10, Figure 20). There are no stream inlets that flow through the agricultural land into the lake, so the agricultural impact is limited to just overland runoff. Shoreline buffers are thin in many farmed sections (especially the east side), so nutrient and sediment runoff from agricultural lands could reach the lake. The agricultural uses include pasture/hay, cultivated crops and animal feedlots. Located closely to Fergus Falls, there is a high degree of development pressure on Swan Lake. From 1990-2000, the urban area in the lakeshed increased by 90% (231 acres) and the impervious area increased by 82% (70 acres) (Table 9). Conversion of previously farmed land to housing and 2nd tier development along the lakeshore is concerns for Swan Lake. Stormwater runoff from impervious surface from developed shoreline properties and roads can add nutrients and chloride (salt) to the lake. Best Management Practices Recommendations The management focus for Swan Lake should protect the current water quality, and restore and protect more of the lakeshed. Partnering with farmers to implement conservation farming practices, restore wetlands, increase lake shoreline buffers, and/or place priority parcels into land retirement programs can decrease the impacts of agriculture in the lakeshed. Since there are no direct stream inlets connecting the surrounding agriculture to the lake, a forested buffer around the lake would provide good protection from agricultural runoff. Protection efforts should be also focused on managing and/or decreasing the impact caused by additional development, including the second tier, and impervious surface area. Project ideas include protecting land with conservation easements, enforcing county shoreline ordinances, smart development, shoreline restoration, rain gardens, and septic system maintenance.
RMB Environmental Laboratories, Inc. 19 of 19 2012 Swan Lake
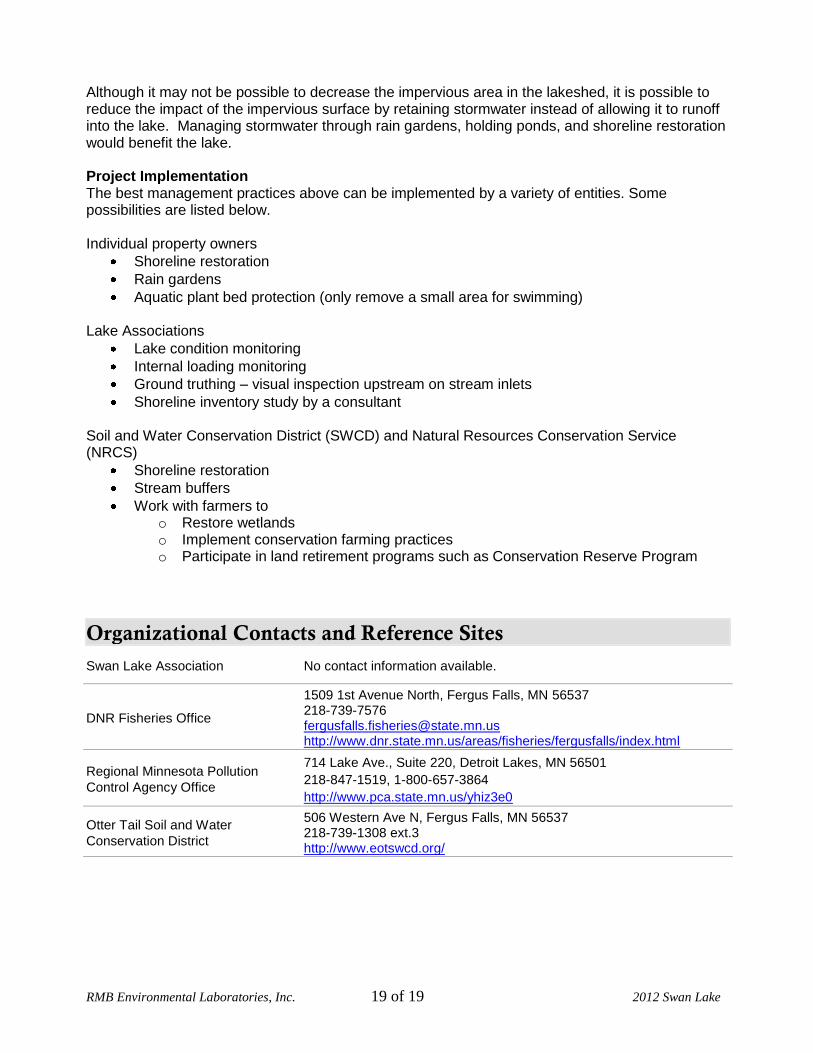
Although it may not be possible to decrease the impervious area in the lakeshed, it is possible to reduce the impact of the impervious surface by retaining stormwater instead of allowing it to runoff into the lake. Managing stormwater through rain gardens, holding ponds, and shoreline restoration would benefit the lake.
Project Implementation The best management practices above can be implemented by a variety of entities. Some possibilities are listed below. Individual property owners
Shoreline restoration
Rain gardens
Aquatic plant bed protection (only remove a small area for swimming) Lake Associations
Lake condition monitoring
Internal loading monitoring
Ground truthing – visual inspection upstream on stream inlets
Shoreline inventory study by a consultant Soil and Water Conservation District (SWCD) and Natural Resources Conservation Service (NRCS)
Shoreline restoration
Stream buffers
Work with farmers to o Restore wetlands o Implement conservation farming practices o Participate in land retirement programs such as Conservation Reserve Program
Organizational Contacts and Reference Sites
Swan Lake Association No contact information available.
DNR Fisheries Office
1509 1st Avenue North, Fergus Falls, MN 56537 218-739-7576 [email protected] http://www.dnr.state.mn.us/areas/fisheries/fergusfalls/index.html
Regional Minnesota Pollution
Control Agency Office
714 Lake Ave., Suite 220, Detroit Lakes, MN 56501
218-847-1519, 1-800-657-3864
http://www.pca.state.mn.us/yhiz3e0
Otter Tail Soil and Water
Conservation District
506 Western Ave N, Fergus Falls, MN 56537 218-739-1308 ext.3 http://www.eotswcd.org/
Swan Lake
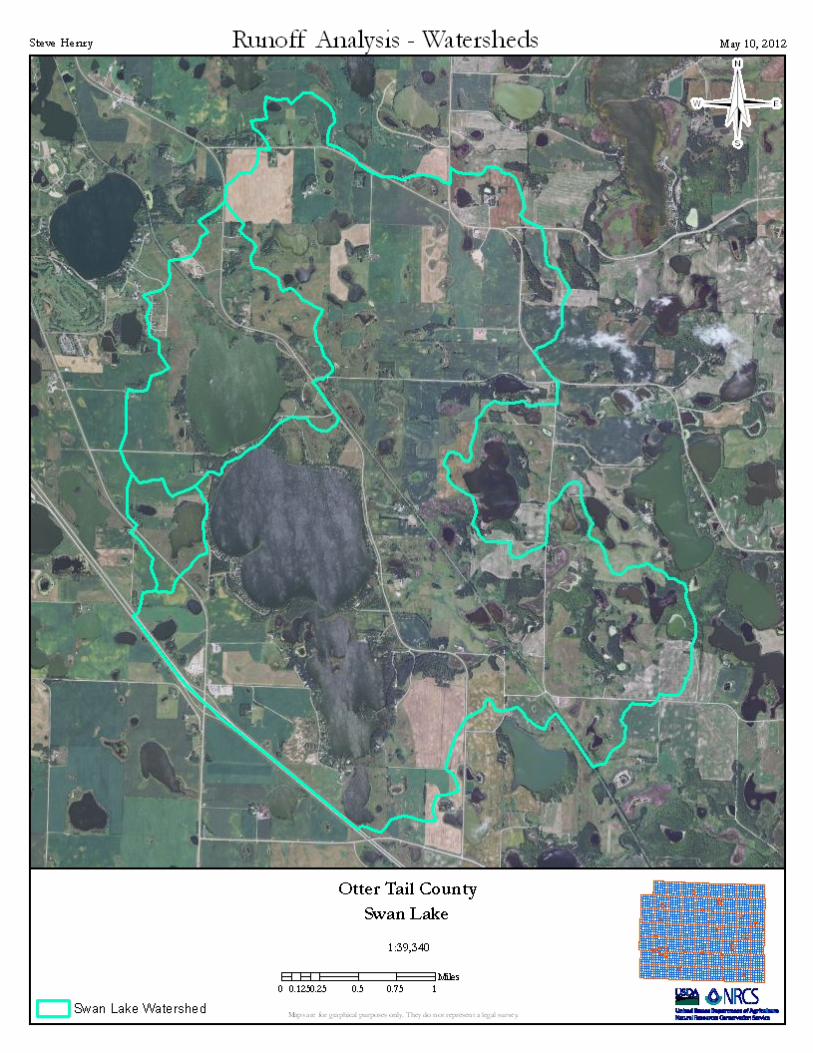
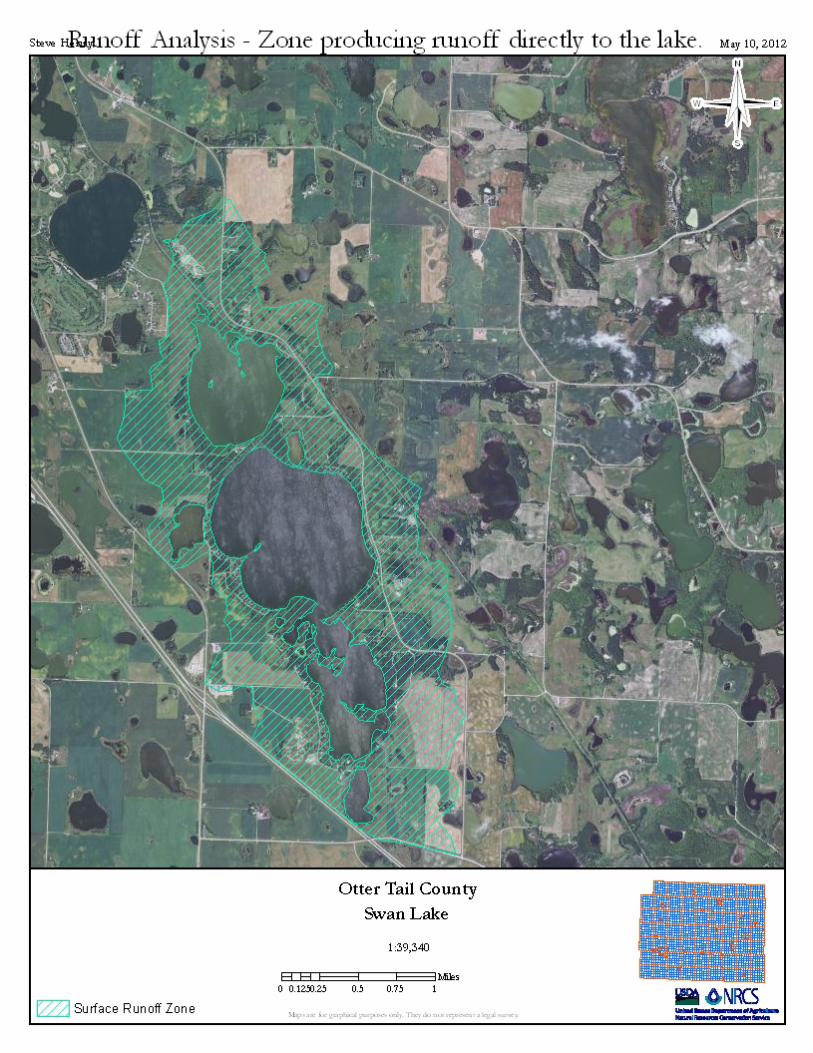
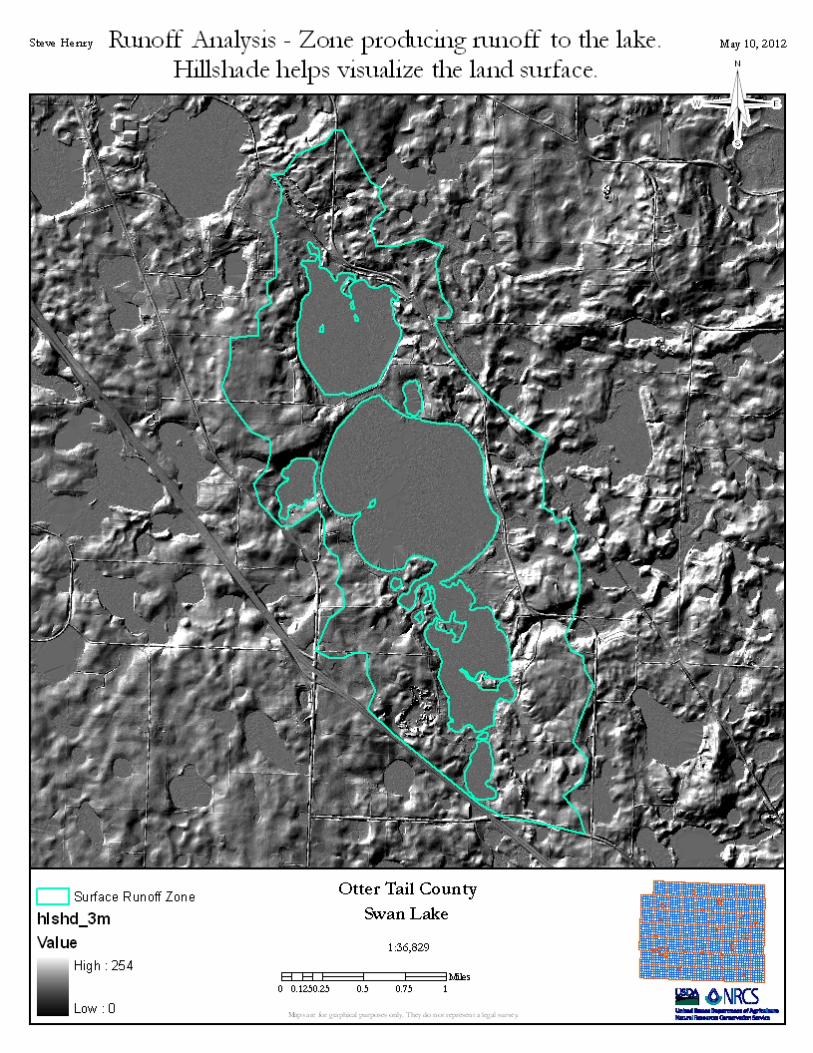
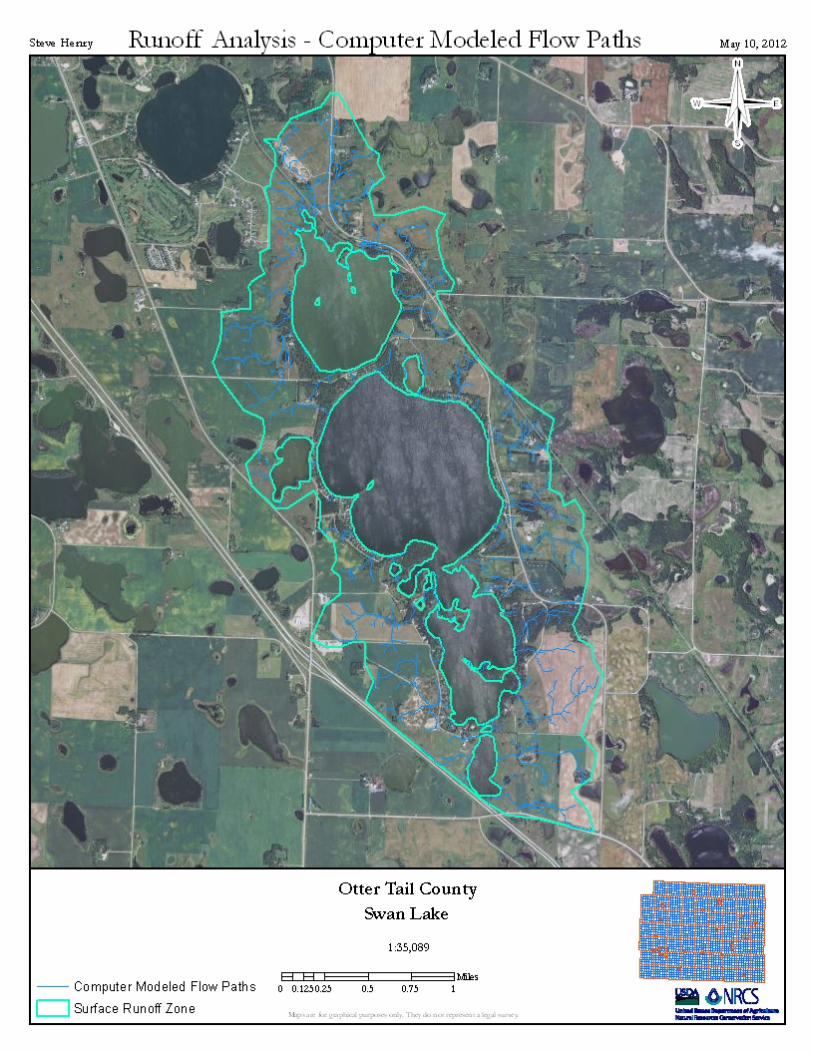
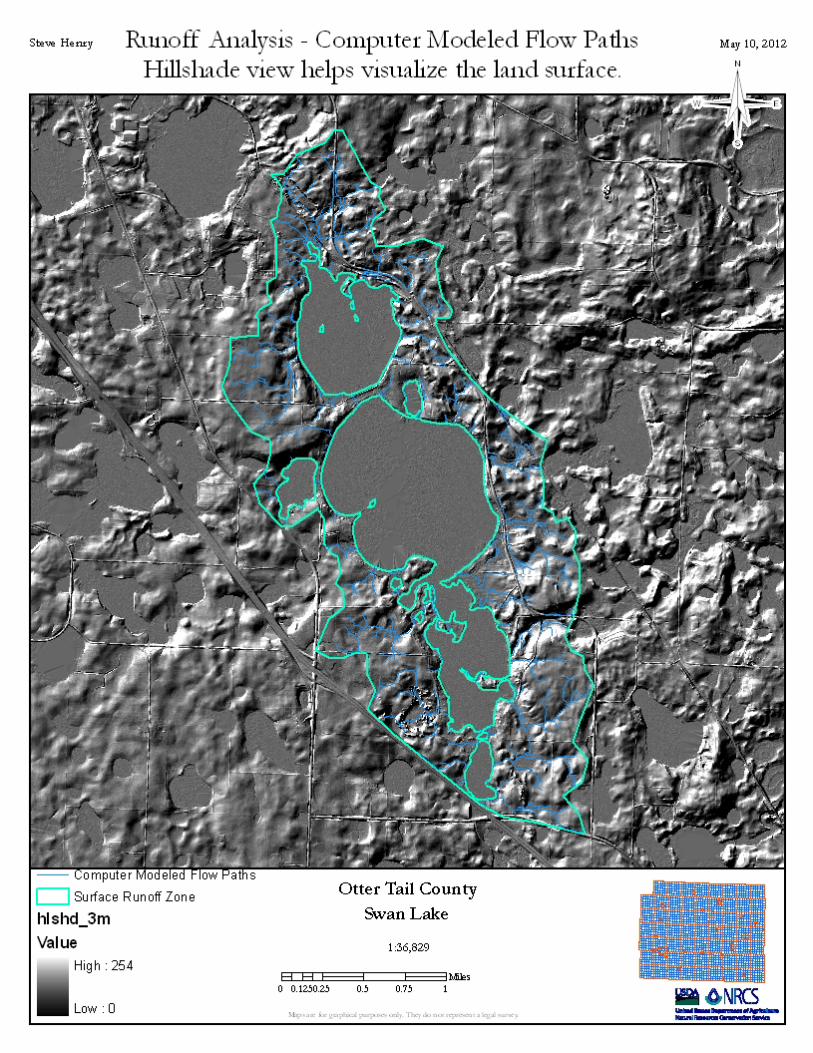
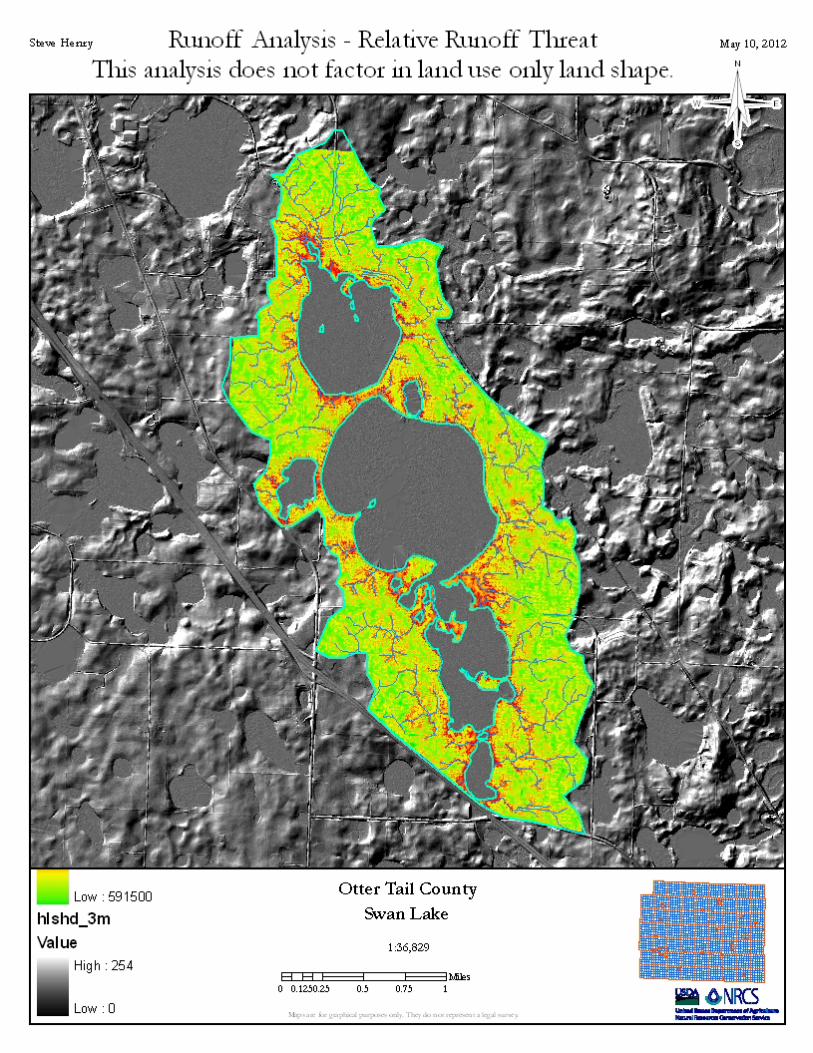
Watershed Analysis for Non-Point Water Quality Projects
This project used computer analysis of new LiDAR elevation data to determine which areas of the watershed have the
potential to deliver nutrients to Swan Lake by surface water runoff. This analysis does not account for how the land is currently being used but instead highlights areas where
pollution reducing practices will have a direct benefit to the lake.
Prepared By: Steve Henry Otter Tail County Shoreland Specialist
5-11-2012