


Languages
Pages
Legal


Demand and Appraisal Report HS2 London - West Midlands
Report for HS2 Ltd
MVA Consultancy, In Association With Mott MacDonald and Atkins
April 2012
This report, and information or advice which it contains, is provided by MVA Consultancy Ltd solely for internal use and reliance by its Client in performance of MVA Consultancy Ltd’s duties and liabilities under its contract with the Client. Any advice, opinions, or recommendations within this report should be read and relied upon only in the context of the report as a whole. The advice and opinions in this report are based upon the information made available to MVA Consultancy Ltd at the date of this report and on current UK standards, codes, technology and construction practices as at the date of this report. Following final delivery of this report to the Client, MVA Consultancy Ltd will have no further obligations or duty to advise the Client on any matters, including development affecting the information or advice provided in this report. This report has been prepared by MVA Consultancy Ltd in their professional capacity as Consultants. The contents of the report do not, in any way, purport to include any manner of legal advice or opinion. This report is prepared in accordance with the terms and conditions of MVA Consultancy Ltd’s contract with the Client. Regard should be had to those terms and conditions when considering and/or placing any reliance on this report. Should the Client wish to release this report to a Third Party for that party's reliance, MVA Consultancy Ltd may, at its discretion, agree to such release provided that: (a) MVA Consultancy Ltd's written agreement is obtained prior to such release, and (b) by release of the report to the Third Party, that Third Party does not acquire any rights, contractual or otherwise, whatsoever against MVA Consultancy Ltd and MVA Consultancy Ltd, accordingly, assume no duties, liabilities or obligations to that Third Party, and (c) MVA Consultancy Ltd accepts no responsibility for any loss or damage incurred by the Client or for any conflict of MVA Consultancy Ltd's interests arising out of the Client's release of this report to the Third Party.
Document Control
Project Title: HS2 London - West Midlands
MVA Project Number: C3A673
Document Type: Report
Directory & File Name: C:\Aemails\20120329 HS2 PLD Update Demand And Appraisal Report
V1.11.Doc
Document Approval
Primary Author: Tony Millward
Other Author(s): Dan Fox, Chris Pownall
Reviewer(s): John Segal, Frank Shorter
Formatted by: JS
HS2 London - West Midlands i
Contents
1 Introduction 1.1 1.1 Background 1.1 1.2 Purpose of Report 1.1 1.3 Structure of Report 1.2
2 Modelling and Assumptions 2.1 2.1 Introduction 2.1 2.2 The HS2 Modelling Framework 2.1 2.3 Updates to the Model 2.2 2.4 Applying the HS2 Service Specification 2.2 2.5 Released Capacity 2.6
3 The Demand for Transport and Context for HS2 3.1 3.1 Introduction 3.1 3.2 Demand for Transport 3.1
4 Station Usage 4.1 4.1 Introduction 4.1 4.2 London to West Midlands (Phase 1) 4.1 4.3 Extension to Manchester to Leeds (Y Network) 4.6
5 Analysis of Economic Case for HS2 London to West
Midlands (Phase 1) 5.1 5.1 Introduction 5.1 5.2 Passenger Demand for HS2 (London – West Midlands) 5.1 5.3 HS2 Appraisal Costs 5.5 5.4 Appraisal of Transport User Benefits from HS2 5.6 5.5 Wider Economic Impacts of HS2 5.10 5.6 HS2 Benefit Cost Ratio 5.12
6 Analysis of the Economic Case for HS2 London to
Manchester, Leeds and Heathrow (Y Network) 6.1 6.1 Introduction 6.1 6.2 Passenger Demand for HS2 6.2 6.3 HS2 Appraisal Cost Summary 6.7 6.4 Appraisal of Benefits from HS2 6.8 6.5 HS2 Benefit Cost Ratio 6.13
7 Sensitivity Tests 7.1 7.1 Introduction 7.1

Summary
HS2 London - West Midlands ii
7.2 Future growth 7.1 7.3 Assumption Changes 7.3 7.4 Business Value of Time 7.5 7.5 Conclusions 7.6
Appendix A HS2 and Released Capacity Service
Specification A1
HS2 London - West Midlands 1.1
1 Introduction
1.1 Background
1.1.1 This document provides further analysis of the demand and benefits of HS2 consistent with
the updated economic case presented in Economic Case for HS2: Updated Appraisal of
Transport User Benefits and Wider Economic Benefits, January 2012. It should be read
alongside the updated Model Development and Baseline Report, April 2012 and the updated
Economic Case document. It is an update to the analysis conducted for the consultation in
February 2011 and the London to West Midlands Demand and Appraisal Report published in
July 2011.
1.2 Purpose of Report
1.2.1 This report provides details of the revised demand forecasts and appraisal for the high speed
rail line connecting London to the West Midlands in 2026 and then Leeds and Manchester in
2033, taking on board the updates to the modelling framework, revised base year data and
revised economic forecasts. It provides revised details of the demand and the business case
for HS2 between London and the West Midlands and a network beyond.
1.2.2 The changes to the modelling framework made since February 2011 focussed on a number of
areas:
� updating base demand figures to 2010/111 for rail and the most recently available for
car and air;
� updates to rail fares, air fares and car vehicle costs in the base year;
� changes to economic forecasts and their impact on the demand for travel;
� changes to underlying assumptions on supply of transport in the absence of HS2;
� improved cost estimates for building and operating HS2 and the revised classic line
timetable.
1.2.3 In this updated appraisal the timetable specification of HS2 remains similar to the previous
work for the Phase 1 scheme, although there are some changes to assumptions regarding
peak HS2 services, capacities to some locations and to the released capacity specification.
Significant changes have been made to the specification for the Y network both in terms of
HS2 and released capacity; this reflects the considerable development work that has been
undertaken on this.
1 Modelling described in this report is based on fiscal years. For brevity, from here onward they are referred to by the calendar year in
which they start, eg 2010/11 is referred to as 2010.

1 Introduction
HS2 London - West Midlands 1.2
1.3 Structure of Report
1.3.1 The rest of the report has the following structure:
� Chapter 2 provides an overview of the demand model structure and its development,
and details of any changes in assumptions and approach;
� Chapter 3 outlines the demand for transport and the context for HS2;
� Chapter 4 presents a summary of station usage;
� Chapter 5 presents the revised overall Business Case for HS2 (Phase 1);
� Chapter 6 presents the revised Business Case for extension to Manchester and Leeds
– (Y network); and
� Chapter 7 provides details of the sensitivity tests carried out.
HS2 London - West Midlands 2.1
2 Modelling and Assumptions
2.1 Introduction
2.1.1 The HS2 demand model provides a framework for analysing the potential impacts of HS2.
The structure of the modelling framework used to assess the scheme remains fundamentally
the same as earlier work, although there have been some refinements to the framework and
appraisal procedures. This chapter provides a summary of the modelling framework and
recent changes; more detail on the modelling approach can be found on the HS2 Ltd
Website2.
2.1.2 The assumptions underpinning the modelling of HS2 are key to the overall conclusions and
the strength of the overall HS2 Economic Case. This chapter sets out these assumptions,
and their basis. More detail on some of these assumptions is provided in the supporting
technical documentation produced by MVA, Mott MacDonald and Atkins3.
2.2 The HS2 Modelling Framework
2.2.1 HS2 proposals have been assessed using a modelling framework known as the PLANET Long
Distance Framework. The Framework was specifically developed to assess high speed rail
options across the UK, including the location of stations.
2.2.2 The framework consists of three PLANET passenger demand models together with a
Heathrow Airport demand model integrated into a single framework. These models are:
� PLANET Long Distance Model (PLD);
� PLANET Midlands Model (PM);
� PLANET South Model (PS); and
� Heathrow Airport Demand Model (ADM).
2.2.3 This integrated framework takes into account the interaction between long distance and local
demand. It models a wide range of impacts on travel behaviour including journey time, train
service frequency, interchange (both between modes and within modes), crowding and
station access/egress times.
2.2.4 Further details regarding the model structure can be found in the Model Development and
Baseline Report, April 2012.
2 http://www.hs2.org.uk/supporting-documents-temp
3 http://www.hs2.org.uk/assets/x/77828
2 Modelling and Assumptions
HS2 London - West Midlands 2.2
2.3 Updates to the Model
2.3.1 Following on from the earlier work, a programme of additional work was undertaken to
improve the robustness of the modelling and appraisal, and update assumptions underlying
the forecasts to reflect political and economic changes. This additional work was focussed on
a number of areas:
� update of base year model to 2010;
� update of values of time and demand forecasts in light of revised economic forecasts;
� updated assumptions on forecast rail services without HS2 as a result of increased
information and Government commitment to additional rail enhancement schemes;
� changes to underlying assumptions on supply and costs of transport in future years;
� enhancements to the modelling framework to improve the interaction between models
and better represent connectivity between stations in Birmingham and Manchester;
� scheme changes - the Phase 1 HS2 network is similar to previous work. There has
been more significant development of the Y network specification, including a released
capacity specification;
� construction and operating costs – HS2 Ltd has updated costs for the Y network, on
the basis of further development of Y network station and route options, and
separately reviewed costs for London to West Midlands.
2.3.2 The model updates are detailed in the Model Development and Baseline Report, April 2012,
including comparisons with the earlier 2008 base.
2.4 Applying the HS2 Service Specification
2.4.1 The modelled HS2 service pattern is included in the HS2 report4 and shown in Figure 2.1.
4 http://highspeedrail.dft.gov.uk/library/documents/economic-case

2 Modelling and Assumptions
HS2 London - West Midlands 2.3
Figure 2.1 Phase 1 London to West Midlands HS2 Service Specification – each
line represents one train per hour
2.4.2 This is an indicative outline of the possible service specification for the purposes of the
demand model, to allow the development of the business case. It is a credible service plan
tested against the capacity of HS2 and the West Coast Mainline (WCML) on which some
classic compatible trains would run. It also includes an assessment of the potential for
released capacity. However, it has not been subject to any degree of timetable validation or
optimisation, and there is the potential for further iterations as the project develops. In
addition it should be noted that this specification has been developed specifically for
modelling purposes and any actual service specification introduced following the opening of
HS2 would be a matter for the operator and would need to respond to prevailing patterns of
demand at the time; as such, this should not be used to infer any final service specification.
2.4.3 The service specification as modelled does not reflect potential variations in service
frequency across the operating day due to the nature of the PLD model, which is an all day
model, working on average capacity and demand across the whole weekday. However, the
crowding function takes account of the variation of demand across the day. For example, an
average load factor of 60% across the day would imply crowding during the peaks. The
model therefore applies some crowding penalty even though on average trains are not
crowded.
2.4.4 The service specification for both Phase 1 and the Y network is for 400m trains to run to all
locations on the HS2 network during the peak hours, with 200m trains at other times. For
practical modelling purposes all trains on dedicated HS2 track are coded as 400m trains, as
coding a mixture of 200m and 400m trains would potentially over-state the level of crowding
across the day.

2 Modelling and Assumptions
HS2 London - West Midlands 2.4
2.4.5 This will mean that average load factors for dedicated HS2 services will be slightly
understated, but this is likely to provide a more representative picture of the crowding
impacts on HS2, with capacity targeted over the most crowded times. Yield management
may also help to spread demand and reduce crowding.
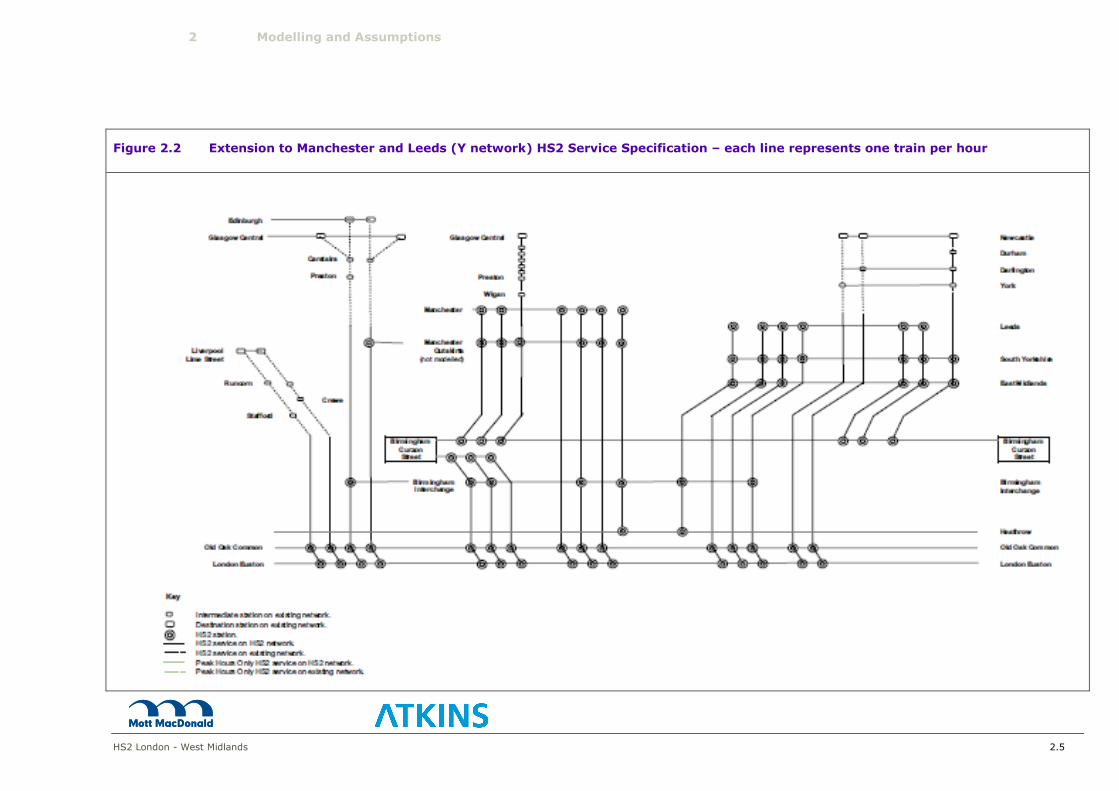
2.4.6 Figure 2.2 shows the corresponding indicative HS2 service specification for the Extension to
Manchester and Leeds (Y Network).
2 Modelling and Assumptions
HS2 London - West Midlands 2.5
Figure 2.2 Extension to Manchester and Leeds (Y network) HS2 Service Specification – each line represents one train per hour
2 Modelling and Assumptions
HS2 London - West Midlands 2.6
2.5 Released Capacity
2.5.1 The Phase 1 released capacity specification has previously been reported in the HS2
Technical Appendix 5 and provides one view of a possible use of the capacity freed up by
HS2. However this specification was designed on the basis of assumptions about future
service patterns that were consistent with modelling undertaken in February 2011. The
update of these assumptions has required some minor amendments to the released capacity
specification to ensure it remains consistent with the new assumptions. Further details are
contained in Appendix A.
2.5.2 For the Y network, an initial view was developed on the possible changes to services across
the WCML, MML and ECML (see Annex A). This view was the best available at the time when
assumptions on modelling had to be finalised. However substantial further work has been
conducted in parallel to the work reported in this document. This parallel work has indicated
there are several opportunities to improve the service specification modelled here, offering
further benefits and improving connectivity between different locations, particularly for
shorter distance trips. Work will continue on refining the service pattern for both released
capacity and HS2 services for HS2 Ltd’s as part of the continuing development of proposals
for the Y network.
5
http://webarchive.nationalarchives.gov.uk/20110131042819/http:/www.dft.gov.uk/pgr/rail/pi/highspeedrail/hs2ltd/technicalappendix/
pdf/report.pdf
HS2 London - West Midlands 3.1
3 The Demand for Transport and Context for HS2
3.1 Introduction
3.1.1 This chapter describes how the demand for transport has changed over time and sets the
context for HS2 by describing what the demand for rail travel may look like in 2037.
3.2 Demand for Transport
3.2.1 The demand for transport has grown substantially over time. As people become richer they
tend to travel further and more often, and as the transport network has grown, so it has
become easier to travel. The total distance travelled by passengers on all modes has grown
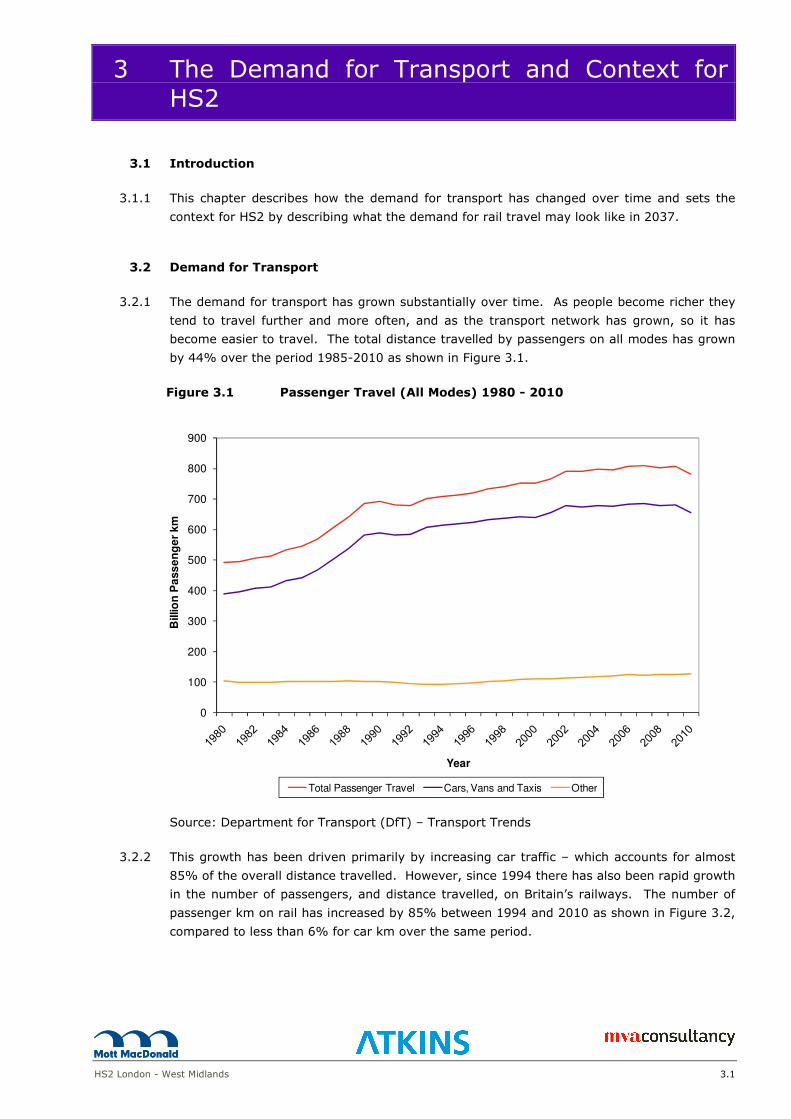
by 44% over the period 1985-2010 as shown in Figure 3.1.
Figure 3.1 Passenger Travel (All Modes) 1980 - 2010
0
100
200
300
400
500
600
700
800
900
Billio
n P
ass
en
ge
r km
Year
Total Passenger Travel Cars, Vans and Taxis Other
Source: Department for Transport (DfT) – Transport Trends
3.2.2 This growth has been driven primarily by increasing car traffic – which accounts for almost
85% of the overall distance travelled. However, since 1994 there has also been rapid growth
in the number of passengers, and distance travelled, on Britain’s railways. The number of
passenger km on rail has increased by 85% between 1994 and 2010 as shown in Figure 3.2,
compared to less than 6% for car km over the same period.

3 The Demand for Transport and Context for HS2
HS2 London - West Midlands 3.2
Figure 3.2 Total Passenger Travel by Rail 1980 - 2010
0
10
20
30
40
50
60
1980
1985
1990
1995
2000
2005
2010
Year
Billio
n P
assen
ger
km
Source: Office of the Rail Regulator (ORR) – National Rail Trends
3.2.3 Similarly, long distance rail trips have been growing in line with recent trends, with an
increase of more than 30% since 2002. This rapid growth is forecast to continue, with rail
trips into and out of London having particularly strong growth.
3.2.4 Table 3.1 shows the growth in total rail trips from 2010 after assignment of demand to the
networks in the forecasting model. These form the basis of the forecasts used in
determining demand for high speed rail summarised within this report.
Table 3.1 PLANET Long Distance: Average weekday rail trips and growth,
between London and city council areas without HS2
Key HS2 zone to zone
movements
2010
demand
2026
demand
% Growth
2010 -
2026
2037
demand
% Growth
2010 -
2037
Birmingham - Central London 7,500 11,700 55% 16,000 113%
Manchester – Central London 7,000 12,100 74% 16,700 140%
Leeds - Central London 4,300 7,200 66% 10,300 136%
Glasgow - Central London 1,300 2,100 62% 2,900 125%
Liverpool - Central London 2,900 4,500 55% 6,100 107%
Newcastle – Central London 2,300 3,900 66% 5,500 138%
Edinburgh – Central London 2,200 3,800 68% 5,400 141%
Source: PLD Framework Model
3 The Demand for Transport and Context for HS2
HS2 London - West Midlands 3.3
3.2.5 Analysis of the movements shown in Table 3.1 indicate that the number of daily rail trips
between London and key cities is forecast to grow by over 50% by 2026 and over 100% by
2037. Highest percentage growth is forecast between London and Leeds, Newcastle and
Edinburgh. The largest demand levels are between Birmingham and London, and Manchester
and London.
3.2.6 There is no evidence to suggest that long term growth in the demand for rail is slowing;
however, it would be expected that this must occur at some point. To address this, the
concept of a cap year is introduced after which there is no growth in the demand for rail or
any other mode. In the Consultation forecasts this was set at 2043 on the basis that
demand in this year on the WCML between Rugby and Coventry was equal to the level
forecast in March 2010 in 2033; this represented an approximate doubling of demand on this
section of the line. For the purpose of the current update, the cap year was set at the year
which had approximately the same level of rail demand greater than 100 miles. This issue is
discussed more fully in the Model Development and Baseline Report, April 2012.
3.2.7 Compared to February 2011, forecast growth rates to the cap year are lower than previously
reported as the base year demand is now much greater than before. Overall, as expected,
absolute demand levels for trips greater than 100 miles for the model as a whole are broadly
consistent with forecasts produced in February 2011.
3.2.8 The levels of demand in the base year are higher than those previously presented, but
growth has differed across the country. The demand for long distance rail travel on the
WCML has increased significantly, in part due to the completion of the WCML upgrade and
timetable changes. As a result the levels of demand forecast in 2037 on the WCML are higher
than those previously forecast in 2043, with demand to other locations generally slightly
lower than the previous forecasts.
3.2.9 Further explanation of the changes in demand is provided in the Model Development and
Baseline Report, April 2012.
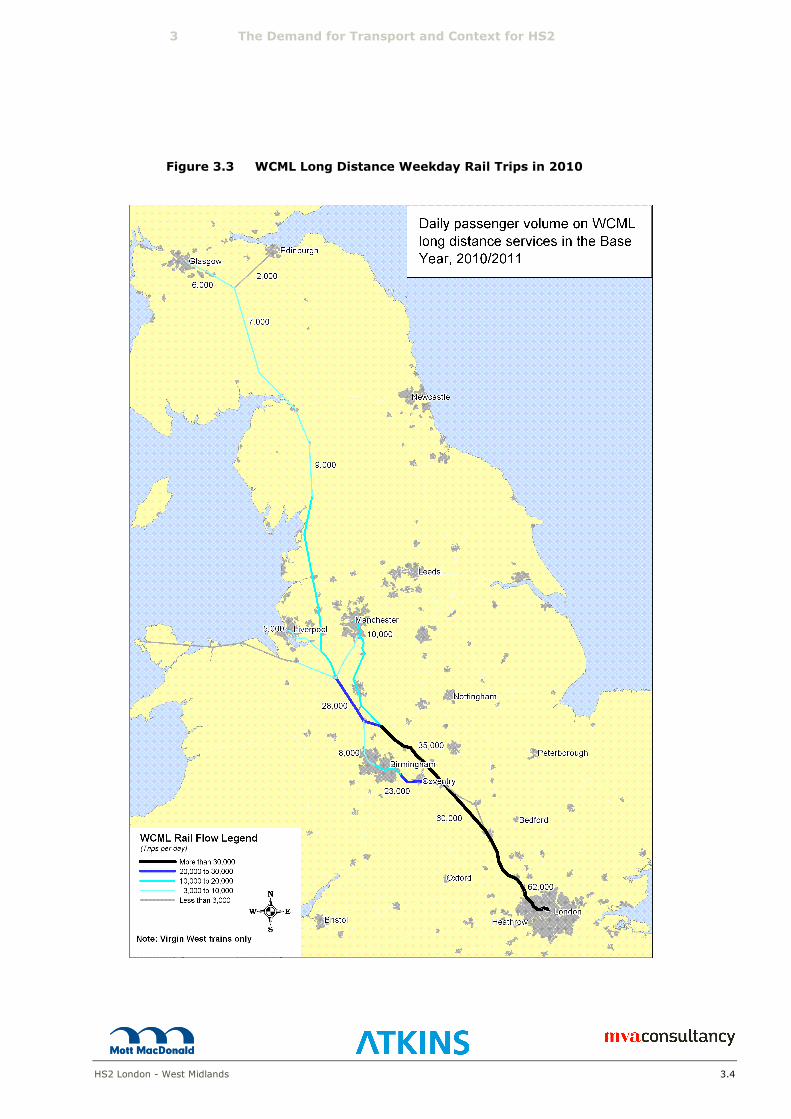
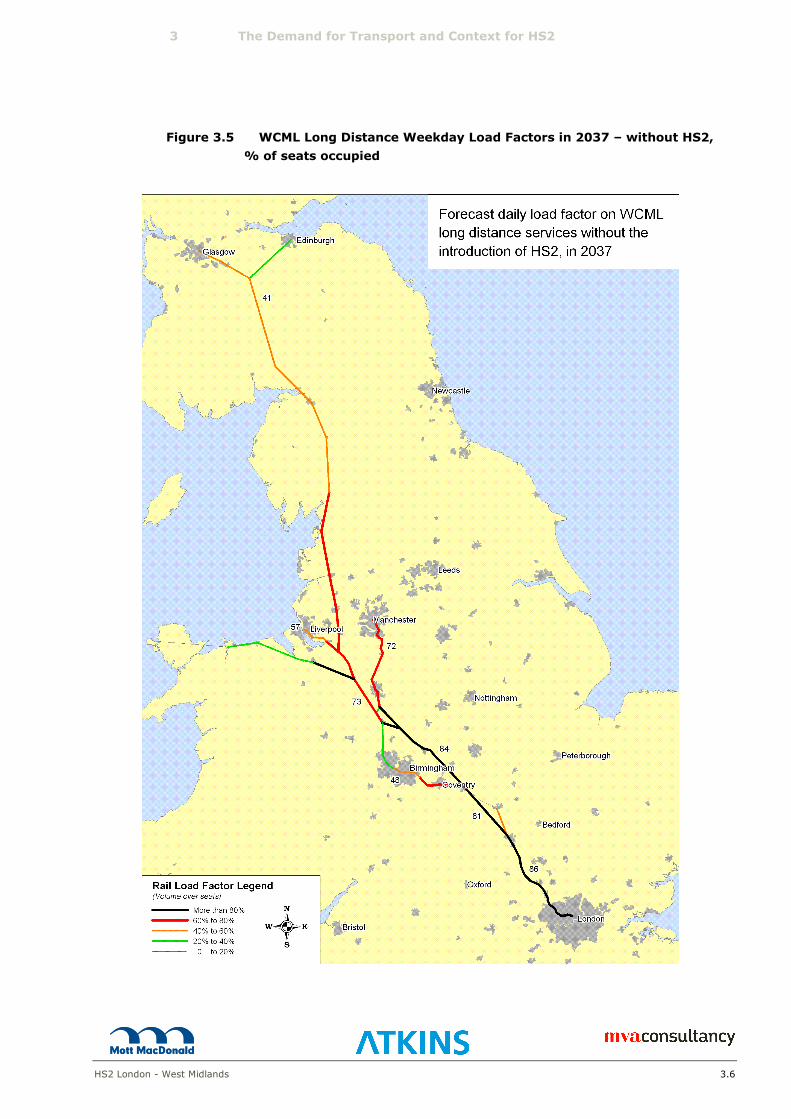
3.2.10 These increases in demand increase passenger flows and crowding on the WCML. The
following maps show the number of long distance trips on the WCML in 2010 (Figure 3.3)
and the increase in those volumes by 2037 (Figure 3.4). Figure 3.5 shows the load factor on
long distance journeys on the WCML by 2037 based on assumptions about what would
happen in the future without HS2.
3.2.11 In 2010 there were approximately 62,000 long distance passengers per day using inter-city
trains on the southern section of the WCML. By 2037 long distance demand on the WCML is
expected to approximately double. Although approximately 70% of Pendolino trains
currently running on the WCML will have been lengthened to 11 cars, the average train
loading6 at arrival/departure at London would have increased from 54% in 2010 to around
86%. This is an average figure, with trains during the peak times likely to have even higher
loadings, many greater than 100%. These are higher than those previously presented
reflecting the higher current and forecast levels of demand on the WCML.
6 Average train loading is the average all day load factor (number of passengers as a percentage or available seats) of services
modelled within PLD. This includes all long distance services but excludes local and suburban services.
3 The Demand for Transport and Context for HS2
HS2 London - West Midlands 3.4
Figure 3.3 WCML Long Distance Weekday Rail Trips in 2010

3 The Demand for Transport and Context for HS2
HS2 London - West Midlands 3.5
Figure 3.4 WCML Long Distance Weekday Rail Trips in 2037 – without HS2
3 The Demand for Transport and Context for HS2
HS2 London - West Midlands 3.6
Figure 3.5 WCML Long Distance Weekday Load Factors in 2037 – without HS2,
% of seats occupied
3 The Demand for Transport and Context for HS2
HS2 London - West Midlands 3.7
3.2.12 HS2 offers the opportunity not only to speed up journeys for passengers along the line of the
WCML, but also to provide substantial additional capacity to Birmingham and long distance
trains north of Birmingham. In addition, the capacity released by HS2 can be reused to
reduce crowding on short distance services into London.

HS2 London - West Midlands 4.1
4 Station Usage
4.1 Introduction
4.1.1 The earlier work defined the preferred option for the HS2 line between London and the West
Midlands. A key element of that work was determining the location of stations serving HS2.
This involved analysis to identify preferred station locations for:
� Central London;
� London Interchange;
� Central Birmingham;
� Birmingham Interchange; and
� Intermediate Stations (it was decided not to have any such stations).
4.1.2 In producing updated forecasts the station locations identified in the earlier work have been
accepted and the analysis has focussed on determining usage of the proposed stations.
4.2 London to West Midlands (Phase 1)
Impact at London Euston
4.2.1 The impact of HS2 at Euston is described in Table 4.1 below.
Table 4.1 Summary of average AM peak period weekday rail trips at Euston -
London to West Midlands (Phase 1)
Daily Demand
2010
Base
Year
2037
Without
HS2
2037
With
HS2 with
OOC
Impact
of HS2
Impact
of HS2
AM Peak 3 hours: National Rail Passengers using Euston mainline
26,900 38,500 46,900 8,400 22%
AM Peak 3 hours: National Rail Passengers using Euston LUL
16,700 23,900 29,100 5,200 22%
Numbers may not add up due to rounding.
Source:
i) AM peak 3 hours demand from PLANET South. This includes all rail trips (both long and short distance)
made on all services (both long and short distance).
ii) LUL demand is based on survey data which show that in the morning peak 62% of Euston National
Rail passengers use the Euston Underground station, the daily average figure is 50% use Euston
Underground.
4.2.2 There are a number of changes in the demand at Euston compared to the February 2011
report. Firstly, the 2010 base data is much greater due to a new base year and significant
growth in the WCML corridor. In Table 4.1 the Do Minimum 2037 AM peak period demand at
Euston is higher than reported in February 2011 due to higher base demand and changes in
exogenous growth, which although they result in broadly the same level of overall growth as
4 Station Usage
HS2 London - West Midlands 4.2
before, result in higher growth on the WCML corridor. The 2037 Euston demand with HS2 is
slightly higher than previously reported, although the impact of HS2 is slightly lower.
4.2.3 The PLANET models (the PLD model reports all-day flows) indicate that in 2010 82,800
national rail passengers arrived or departed Euston Main Line Station each weekday on long
distance services. In the 3 hour AM peak period from 0700 to 1000 around 26,900
passengers arrived or departed on both long distance and short distance services in 2010.
Survey data demonstrates that in the peak period 62% of Euston mainline passengers use
the Underground, which would correspond to around 16,700 passengers.
4.2.4 While Euston Underground station is not currently the most heavily used London
Underground station, many trains passing through the station are still very crowded during
the 3 hour AM peak period. The HS2 demand model (PLANET South) has been used to look
at the impact of HS2 on the Underground. This model tends to overestimate the number of
passengers using the Underground, in part because it does not include taxis as a mode of
dispersal.
4.2.5 PLANET South suggests the most heavily crowded trains in the AM peak are southbound on
Northern and Victoria lines where even now there are currently more than 2 passengers for
every seat. The average loading on all London Underground services going through Euston
in the 3 hour AM peak period is 143% which increases to 185% in 2037 without HS2 and
187% with HS2 if no enhancement is made to LUL services.
4.2.6 Capacity on the Northern and Victoria lines is expected to increase by around 20% (an extra
40,000 seats at Euston during the 3 hour AM peak period) by 2018, but this will not be
sufficient to cater for all the growth that is forecast.
4.2.7 This increase is driven by several factors, many of which are related to growth in London’s
economy (which drives growth in use of the Underground network by London passengers).
However, one further element is that more people will want to travel to and from national
rail stations due to the high growth in national rail demand. At Euston, the number of
passengers arriving or departing the station – even without HS2 – is forecast to grow by
nearly 90% by 2037. This means that by 2037, even without HS2 there will be around
34,700 additional national rail passengers using the Underground network at Euston.
4.2.8 HS2 will add further demand. The central case – which includes an interchange at Old Oak
Common - would result in around 46,900 passengers arriving at or departing from Euston on
all services in 2037 during the important AM peak period – an increase of 8,400 passengers
compared to the case without HS2, of whom 62% are likely to use the Underground network.
4.2.9 Overall analysis suggests that despite the major investment provided on LUL, by 2037 there
will be increased crowding on Underground services through Euston – and further investment
may be needed to manage this. The addition of HS2 will put some further pressure on the
Underground network but the impact is small (around 1%) compared to the total numbers of
other Underground passengers travelling through Euston.
4 Station Usage
HS2 London - West Midlands 4.3
Usage of London Stations
4.2.10 The pressures on the Underground network at Euston have been outlined above. It also
outlines the impact of HS2 at Euston in the central case – including Old Oak Common. The
Old Oak Common interchange helps to relieve pressure at Euston, and provides wider
accessibility benefits for passengers travelling to London.
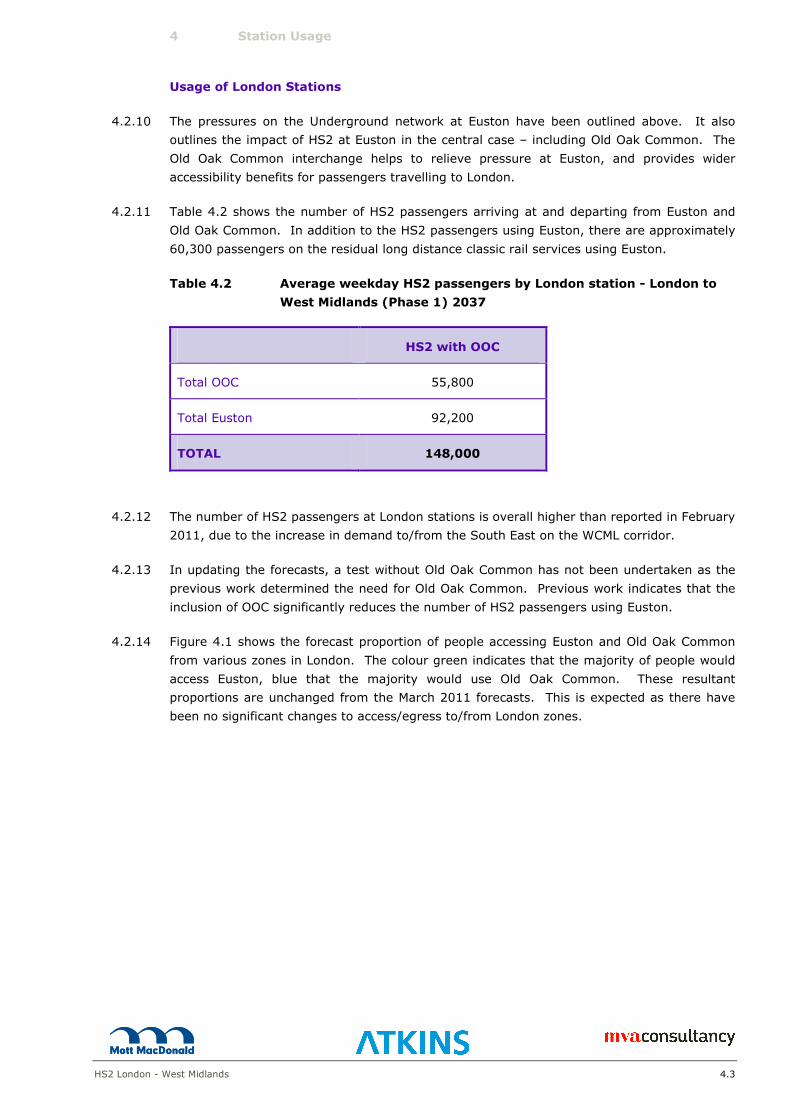
4.2.11 Table 4.2 shows the number of HS2 passengers arriving at and departing from Euston and
Old Oak Common. In addition to the HS2 passengers using Euston, there are approximately
60,300 passengers on the residual long distance classic rail services using Euston.
Table 4.2 Average weekday HS2 passengers by London station - London to
West Midlands (Phase 1) 2037
HS2 with OOC
Total OOC 55,800
Total Euston 92,200
TOTAL 148,000
4.2.12 The number of HS2 passengers at London stations is overall higher than reported in February
2011, due to the increase in demand to/from the South East on the WCML corridor.
4.2.13 In updating the forecasts, a test without Old Oak Common has not been undertaken as the
previous work determined the need for Old Oak Common. Previous work indicates that the
inclusion of OOC significantly reduces the number of HS2 passengers using Euston.
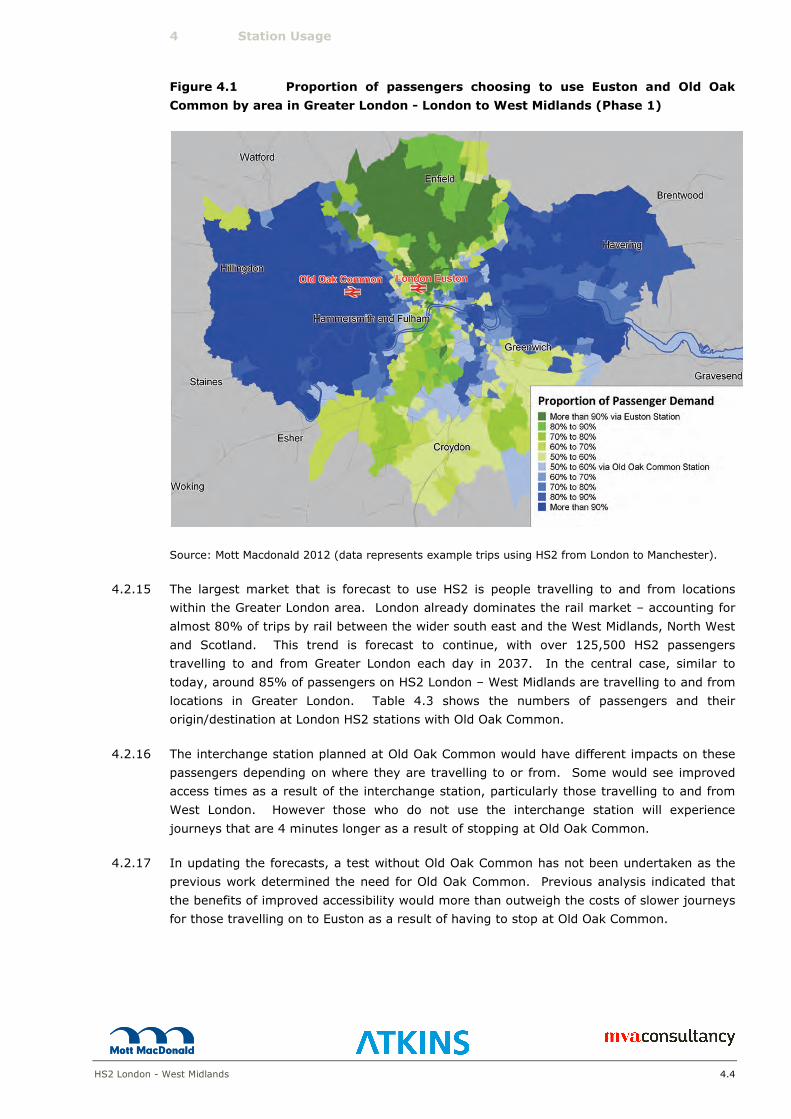
4.2.14 Figure 4.1 shows the forecast proportion of people accessing Euston and Old Oak Common
from various zones in London. The colour green indicates that the majority of people would
access Euston, blue that the majority would use Old Oak Common. These resultant
proportions are unchanged from the March 2011 forecasts. This is expected as there have
been no significant changes to access/egress to/from London zones.
4 Station Usage
HS2 London - West Midlands 4.4
Figure 4.1 Proportion of passengers choosing to use Euston and Old Oak
Common by area in Greater London - London to West Midlands (Phase 1)
Source: Mott Macdonald 2012 (data represents example trips using HS2 from London to Manchester).
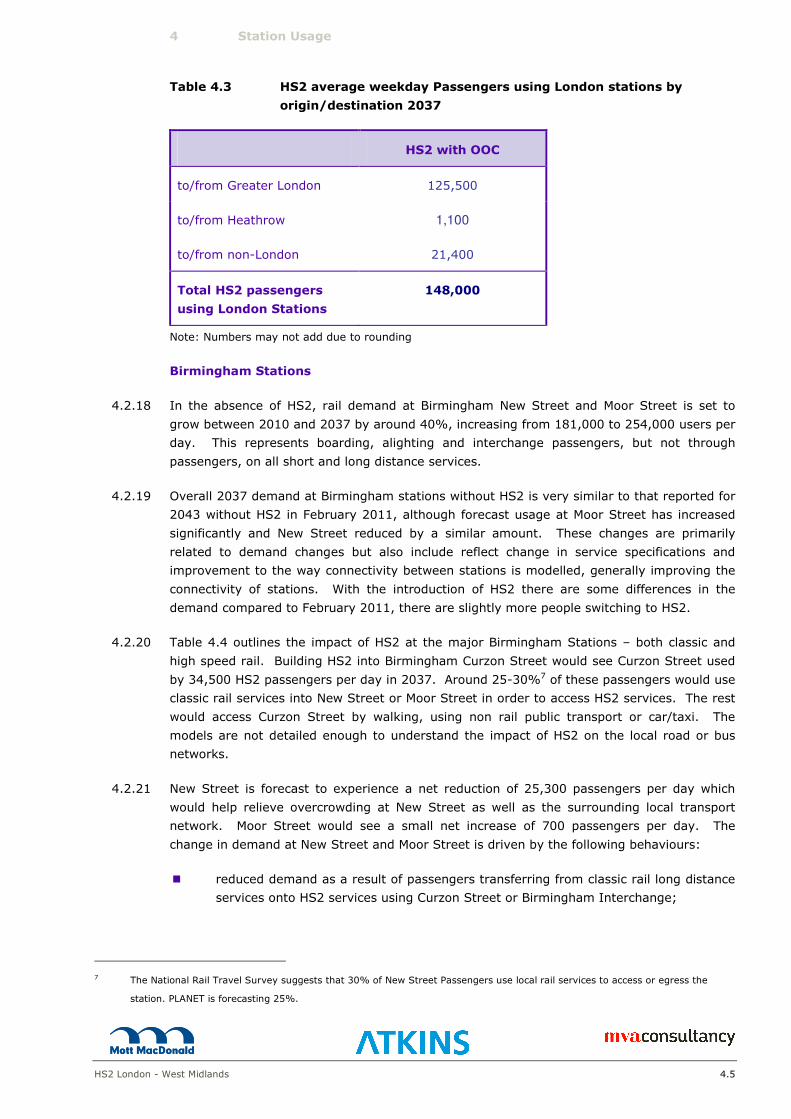
4.2.15 The largest market that is forecast to use HS2 is people travelling to and from locations
within the Greater London area. London already dominates the rail market – accounting for
almost 80% of trips by rail between the wider south east and the West Midlands, North West
and Scotland. This trend is forecast to continue, with over 125,500 HS2 passengers
travelling to and from Greater London each day in 2037. In the central case, similar to
today, around 85% of passengers on HS2 London – West Midlands are travelling to and from
locations in Greater London. Table 4.3 shows the numbers of passengers and their
origin/destination at London HS2 stations with Old Oak Common.
4.2.16 The interchange station planned at Old Oak Common would have different impacts on these
passengers depending on where they are travelling to or from. Some would see improved
access times as a result of the interchange station, particularly those travelling to and from
West London. However those who do not use the interchange station will experience
journeys that are 4 minutes longer as a result of stopping at Old Oak Common.
4.2.17 In updating the forecasts, a test without Old Oak Common has not been undertaken as the
previous work determined the need for Old Oak Common. Previous analysis indicated that
the benefits of improved accessibility would more than outweigh the costs of slower journeys
for those travelling on to Euston as a result of having to stop at Old Oak Common.
4 Station Usage
HS2 London - West Midlands 4.5
Table 4.3 HS2 average weekday Passengers using London stations by
origin/destination 2037
HS2 with OOC
to/from Greater London 125,500
to/from Heathrow 1,100
to/from non-London 21,400
Total HS2 passengers
using London Stations
148,000
Note: Numbers may not add due to rounding
Birmingham Stations
4.2.18 In the absence of HS2, rail demand at Birmingham New Street and Moor Street is set to
grow between 2010 and 2037 by around 40%, increasing from 181,000 to 254,000 users per
day. This represents boarding, alighting and interchange passengers, but not through
passengers, on all short and long distance services.
4.2.19 Overall 2037 demand at Birmingham stations without HS2 is very similar to that reported for
2043 without HS2 in February 2011, although forecast usage at Moor Street has increased
significantly and New Street reduced by a similar amount. These changes are primarily
related to demand changes but also include reflect change in service specifications and
improvement to the way connectivity between stations is modelled, generally improving the
connectivity of stations. With the introduction of HS2 there are some differences in the
demand compared to February 2011, there are slightly more people switching to HS2.
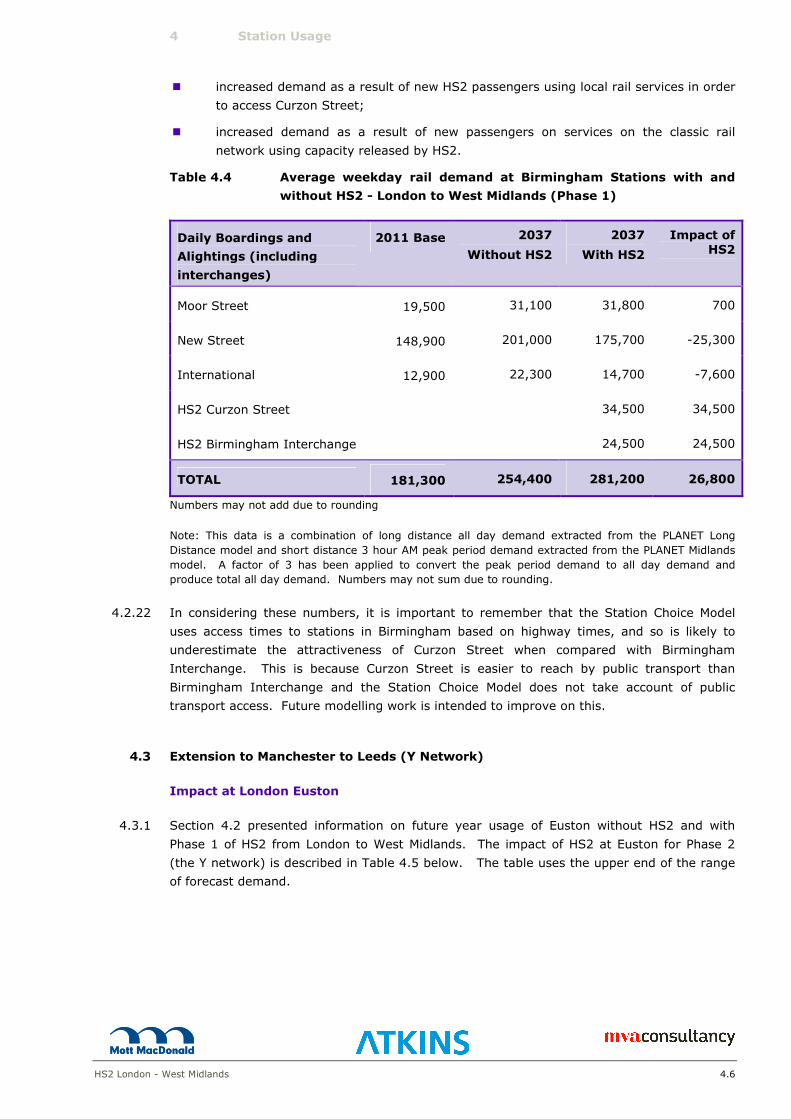
4.2.20 Table 4.4 outlines the impact of HS2 at the major Birmingham Stations – both classic and
high speed rail. Building HS2 into Birmingham Curzon Street would see Curzon Street used
by 34,500 HS2 passengers per day in 2037. Around 25-30%7 of these passengers would use
classic rail services into New Street or Moor Street in order to access HS2 services. The rest
would access Curzon Street by walking, using non rail public transport or car/taxi. The
models are not detailed enough to understand the impact of HS2 on the local road or bus
networks.
4.2.21 New Street is forecast to experience a net reduction of 25,300 passengers per day which
would help relieve overcrowding at New Street as well as the surrounding local transport
network. Moor Street would see a small net increase of 700 passengers per day. The
change in demand at New Street and Moor Street is driven by the following behaviours:
� reduced demand as a result of passengers transferring from classic rail long distance
services onto HS2 services using Curzon Street or Birmingham Interchange;
7 The National Rail Travel Survey suggests that 30% of New Street Passengers use local rail services to access or egress the
station. PLANET is forecasting 25%.
4 Station Usage
HS2 London - West Midlands 4.6
� increased demand as a result of new HS2 passengers using local rail services in order
to access Curzon Street;
� increased demand as a result of new passengers on services on the classic rail
network using capacity released by HS2.
Table 4.4 Average weekday rail demand at Birmingham Stations with and
without HS2 - London to West Midlands (Phase 1)
Daily Boardings and
Alightings (including
interchanges)
2011 Base 2037
Without HS2
2037
With HS2
Impact of
HS2
Moor Street 19,500 31,100 31,800 700
New Street 148,900 201,000 175,700 -25,300
International 12,900 22,300 14,700 -7,600
HS2 Curzon Street 34,500 34,500
HS2 Birmingham Interchange 24,500 24,500
TOTAL 181,300 254,400 281,200 26,800
Numbers may not add due to rounding
Note: This data is a combination of long distance all day demand extracted from the PLANET Long
Distance model and short distance 3 hour AM peak period demand extracted from the PLANET Midlands
model. A factor of 3 has been applied to convert the peak period demand to all day demand and
produce total all day demand. Numbers may not sum due to rounding.
4.2.22 In considering these numbers, it is important to remember that the Station Choice Model
uses access times to stations in Birmingham based on highway times, and so is likely to
underestimate the attractiveness of Curzon Street when compared with Birmingham
Interchange. This is because Curzon Street is easier to reach by public transport than
Birmingham Interchange and the Station Choice Model does not take account of public
transport access. Future modelling work is intended to improve on this.
4.3 Extension to Manchester to Leeds (Y Network)
Impact at London Euston
4.3.1 Section 4.2 presented information on future year usage of Euston without HS2 and with
Phase 1 of HS2 from London to West Midlands. The impact of HS2 at Euston for Phase 2
(the Y network) is described in Table 4.5 below. The table uses the upper end of the range
of forecast demand.

4 Station Usage
HS2 London - West Midlands 4.7
Table 4.5 Summary of average AM peak period weekday rail trips at Euston -
Extension to Manchester to Leeds (Y Network)
Daily Demand
2010
Base
Year
2037
Without
HS2
2037
With
HS2 with
OOC
Impact
of HS2
Impact
of HS2
AM Peak 3 hours: National Rail Passengers using Euston mainline
26,900 38,500 66,700 28,200 73%
AM Peak 3 hours: National Rail Passengers using Euston LUL
16,700 23,900 41,300 17,400 73%
Source:
i) AM peak 3 hours demand from PLANET South. This includes all rail trips (both long and short distance)
made on all services (both long and short distance).
ii) LUL demand is based on survey data which show that in the morning peak 62% of Euston National
Rail passengers use the Euston Underground station, the daily average figure is 50% use Euston
Underground.
4.3.2 The higher range forecasts - would result in almost 226,900 passengers arriving at or
departing from Euston each day on long distance services in 2037 – an increase of 78,300
passengers compared to the case without HS2. Many of these passengers would otherwise
have used London Kings Cross and St Pancras – the net increase in passengers getting on
and off trains across London would be 20,900 or 12%.
4.3.3 These passengers arriving or departing from Euston are made up of almost 168,200
passengers using HS2 and around 58,700 using residual long distance classic rail services.
This is equivalent to around 28,200 extra passengers during the course of the 3 hour AM
peak period, of which 62% are likely to use the Underground network. The average loading
on all London Underground services going through Euston in the 3 hour AM peak period will
increase from 185% without HS2 to 191% with HS2 if no enhancement is made to LUL
services. The addition of HS2 will put some further pressure on the Underground network
but the impact is relatively small (around 3%) compared to the total numbers of other
Underground passengers travelling through Euston without HS2. Much of the increased
demand at Euston is from passengers who would otherwise have used London Kings Cross
and St Pancras and would already be using the Underground.
Usage of London Station in the Y network
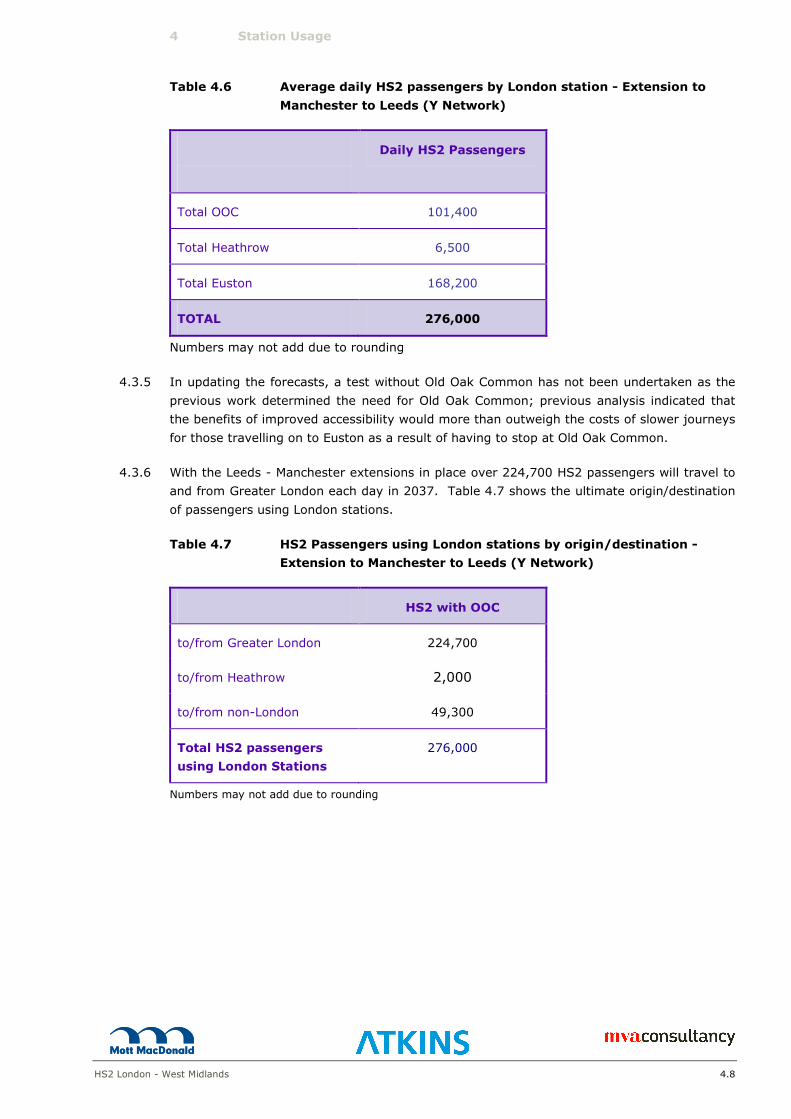
4.3.4 Table 4.6 shows the number of HS2 passengers arriving at and departing from Euston,
Heathrow and Old Oak Common. In addition to the HS2 passengers using Euston, there are
approximately 58,700 passengers on the residual long distance classic rail services using
Euston.
4 Station Usage
HS2 London - West Midlands 4.8
Table 4.6 Average daily HS2 passengers by London station - Extension to
Manchester to Leeds (Y Network)
Daily HS2 Passengers
Total OOC 101,400
Total Heathrow 6,500
Total Euston 168,200
TOTAL 276,000
Numbers may not add due to rounding
4.3.5 In updating the forecasts, a test without Old Oak Common has not been undertaken as the
previous work determined the need for Old Oak Common; previous analysis indicated that
the benefits of improved accessibility would more than outweigh the costs of slower journeys
for those travelling on to Euston as a result of having to stop at Old Oak Common.
4.3.6 With the Leeds - Manchester extensions in place over 224,700 HS2 passengers will travel to
and from Greater London each day in 2037. Table 4.7 shows the ultimate origin/destination
of passengers using London stations.
Table 4.7 HS2 Passengers using London stations by origin/destination -
Extension to Manchester to Leeds (Y Network)
HS2 with OOC
to/from Greater London 224,700
to/from Heathrow 2,000
to/from non-London 49,300
Total HS2 passengers
using London Stations
276,000
Numbers may not add due to rounding
4 Station Usage
HS2 London - West Midlands 4.9
Birmingham Stations
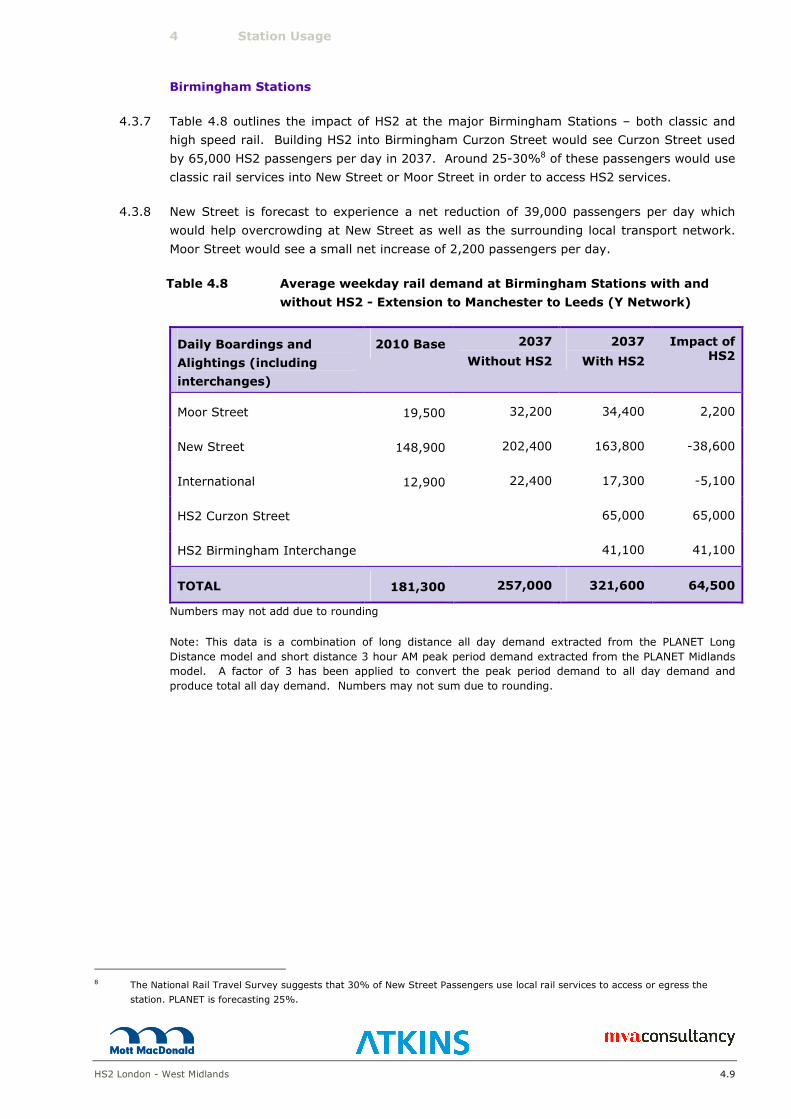
4.3.7 Table 4.8 outlines the impact of HS2 at the major Birmingham Stations – both classic and
high speed rail. Building HS2 into Birmingham Curzon Street would see Curzon Street used
by 65,000 HS2 passengers per day in 2037. Around 25-30%8 of these passengers would use
classic rail services into New Street or Moor Street in order to access HS2 services.
4.3.8 New Street is forecast to experience a net reduction of 39,000 passengers per day which
would help overcrowding at New Street as well as the surrounding local transport network.
Moor Street would see a small net increase of 2,200 passengers per day.
Table 4.8 Average weekday rail demand at Birmingham Stations with and
without HS2 - Extension to Manchester to Leeds (Y Network)
Daily Boardings and
Alightings (including
interchanges)
2010 Base 2037
Without HS2
2037
With HS2
Impact of HS2
Moor Street 19,500 32,200 34,400 2,200
New Street 148,900 202,400 163,800 -38,600
International 12,900 22,400 17,300 -5,100
HS2 Curzon Street 65,000 65,000
HS2 Birmingham Interchange 41,100 41,100
TOTAL 181,300 257,000 321,600 64,500
Numbers may not add due to rounding
Note: This data is a combination of long distance all day demand extracted from the PLANET Long
Distance model and short distance 3 hour AM peak period demand extracted from the PLANET Midlands
model. A factor of 3 has been applied to convert the peak period demand to all day demand and
produce total all day demand. Numbers may not sum due to rounding.
8 The National Rail Travel Survey suggests that 30% of New Street Passengers use local rail services to access or egress the
station. PLANET is forecasting 25%.
HS2 London - West Midlands 5.1
5 Analysis of Economic Case for HS2 London to West Midlands (Phase 1)
5.1 Introduction
5.1.1 This chapter considers the appraisal of transport user benefits, wider economic benefits and
construction and operating costs for the preferred scheme. It begins by setting out forecasts
of demand for HS2 London – West Midlands, before moving on to consider the costs and
benefits of the scheme. It concludes by looking at the overall balance of monetised costs
and benefits.
5.2 Passenger Demand for HS2 (London – West Midlands)
5.2.1 Chapter 3 outlines the forecast levels of the growth in average weekday demand to 2037
without HS2. This shows substantial growth in demand for long distance rail trips. Between
2010 and 2037 demand on the WCML is forecast to double, mainly driven by people’s
propensity to travel further and more frequently as they grow wealthier.
5.2.2 With phase 1 of HS2 (London-West Midlands), journeys between London and Birmingham,
Manchester, Liverpool and Glasgow would be up to 30 minutes faster than current services.
A new high speed line would also allow a more frequent and reliable service, with greater rail
capacity provided.
5.2.3 These improvements in travel time and experience would attract significant numbers of
passengers onto high speed trains. Around 148,000 passengers would use HS2 each week
day on average on the section between Birmingham Interchange and Old Oak Common. A
further 14,000 passengers would use classic compatible trains without travelling on the high
speed line itself. These journeys are between places such as the north of England and
Scotland where HS2 classic compatible services replace the existing classic rail service.
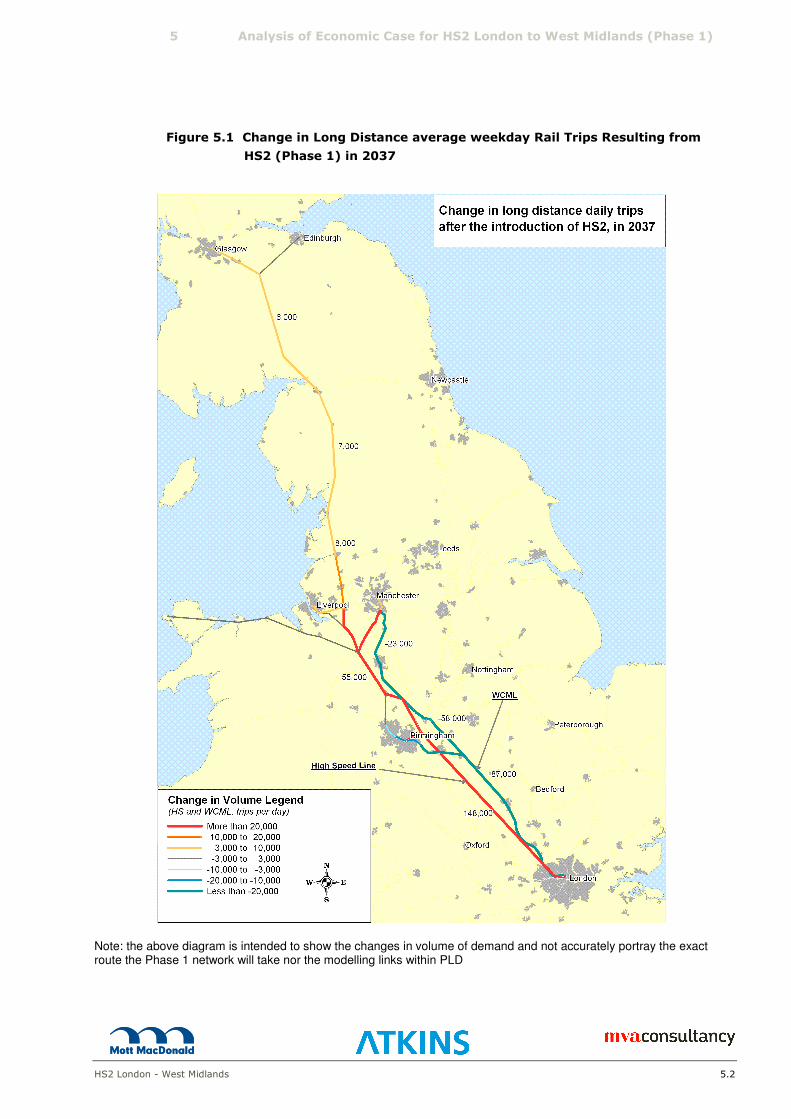
5.2.4 Figures 5.1 and 5.2 show the change in long distance passenger flows when HS2 London
West Midlands is operational and the percentage loading factors on the long distance trains
along the WCML and HS2. Overall, the number of passengers on this corridor would increase
by around 61,000. This is made up of a reduction of some 87,000 trips on the WCML into
London and an increase of 148,000 trips on HS2. The HS2 services would be well used with
average load factors over 60%. North of Birmingham, the demand for WCML and HS2 are
combined – as both will use the same tracks. Here significant increases in passenger flows
along the WCML are evident. There would also be a significant net increase in long distance
flows using the WCML and HS2 south of Birmingham.
5.2.5 The overall change in passengers on this corridor is similar to that reported in February
2011, with a very small increase which can be related to higher overall demand. The
number of people using HS2 is almost 10% higher than previously reported.
5.2.6 Compared to the situation without HS2, load factors are lower across all of the WCML south
of Manchester. On the section south of Birmingham this is because of the additional capacity
of HS2. North of Birmingham the load factor also decreases due an increase in the number
of services operating on the WCML. North of Manchester loads factors remain similar,
although more people travel to Scotland.
5 Analysis of Economic Case for HS2 London to West Midlands (Phase 1)
HS2 London - West Midlands 5.2
Figure 5.1 Change in Long Distance average weekday Rail Trips Resulting from
HS2 (Phase 1) in 2037
Note: the above diagram is intended to show the changes in volume of demand and not accurately portray the exact route the Phase 1 network will take nor the modelling links within PLD

5 Analysis of Economic Case for HS2 London to West Midlands (Phase 1)
HS2 London - West Midlands 5.3
Figure 5.2 Long Distance Weekday Load Factors in 2037 – with HS2 London
to Birmingham (Phase 1), % of seats occupied
Note: the above diagram is intended to show the changes in volume of demand and not accurately portray the exact route the Phase 1 network will take nor the modelling links within PLD

5 Analysis of Economic Case for HS2 London to West Midlands (Phase 1)
HS2 London - West Midlands 5.4
5.2.7 Table 5.1 shows the increase in the number of rail trips per weekday (both HS2 and classic
rail) to London. There is an increase of around 3,000 trips between Scotland and London
(both directions). The majority of these trips (53%) are new trips that are generated by the
journey time savings from HS2, while some 46% would otherwise have used air to travel.
Table 5.1 Increase and Source of Rail Trips (Both High Speed and Classic
rail) to and from London as a Result of HS2
5.2.8 British and international experience shows that when rail journey times reduce to about four
hours, rail starts to compete strongly with air and take market share (between 25% and
30%); once rail times reduce to three hours, rail mode share typically reaches 60% or
more9.
5.2.9 Trip generation becomes more important for journeys over shorter distances, where air is a
less important mode. These new trips account for some 81% of the increase in demand for
rail travel between London and the West Midlands and some 89% of the increase in demand
for travel between London and the North West resulting from the introduction of HS2.
5.2.10 Whilst trip generation is a more significant part of the increase in rail demand, Table 5.3
shows that this represents fewer than 25% of passengers on HS2. Over these distances,
shift from existing classic rail services becomes a more significant factor in HS2 demand. On
average, around two thirds of passengers between London and the West Midlands and the
North West would otherwise have travelled by classic rail.
5.2.11 Between London and the North West and the West Midlands the increases are slightly higher
than the previous forecasts, reflecting the general higher levels of demand without HS2 and
hence much higher load factors. The increase in rail passenger demand to London from
Scotland is lower than previously, which is in part due to reduced transfer from air as a
result of lower air demand forecasts.
9 See Figure 4 in ‘Demand for Long Distance Travel’, http://www.hs2.org.uk/assets/x/77832.
Source of Additional Rail Passengers Average Weekday
Demand To/From
London
Increase in Rail
Passengers (HS
and Classic) Car Air Generation
Scotland 3,000 1% 46% 53%
North West 15,700 6% 4% 89%
West Midlands 14,300 19% 0% 81%

5 Analysis of Economic Case for HS2 London to West Midlands (Phase 1)
HS2 London - West Midlands 5.5
Table 5.2 HS2 Average Weekday Demand to/from London
Source of HS2 Passengers
Daily
Demand Total HSR Classic Rail Road Air Generated
36,200 2,700 0 11,600 West
Midlands
50,500
72% 5% 0% 23%
47,600 1,000 700 14,100 North West 63,400
75% 2% 1% 22%
2,200 40 1,400 1,600 Scotland 5,100
42% 1% 27% 31%
4,400 500 30 1,700 Rest of the
Country
6,700
66% 7% 0% 26%
90,400 4,200 2,100 29,000 Total 125,700
72% 3% 2% 23%
Only trips with an origin or destination in Greater London (excluding London Heathrow).
Numbers have been rounded so may not add
5.2.12 HS2 demand between Scotland and London has reduced compared to previous forecasts.
Although overall rail demand without HS2 is similar to previous forecasts, with the
introduction of HS2, the transfer from classic rail and number of generated trips is reduced.
In addition, the transfer from air is lower due to overall reduced levels of air demand.
5.2.13 People would travel on HS2 for a range of reasons. Faster journeys would attract more
business travel. Modelling suggests almost one third of HS2 passengers would be
undertaking business trips, with a 10% overall increase in the number of long distance
business trips as a result of HS2. The majority of passengers (70%) would be people
travelling for other purposes (leisure and commuting), with leisure trips likely to be
particularly important.
5.3 HS2 Appraisal Costs
5.3.1 The costs that make up the HS2 Business Case are described in the HS2 Economic Case
Report. A summary of capital costs is included in Table 5.3, and a summary of operating
and maintenance costs is included in Table 5.4.

5 Analysis of Economic Case for HS2 London to West Midlands (Phase 1)
HS2 London - West Midlands 5.6
Table 5.3 Undiscounted Capital Cost Estimate for HS2 (London to West
Midlands); £ millions 2011 PV/Prices – Including Risk
Capital Expenditure £ million
Construction (inc risk) 14,670
Rolling Stock (inc risk) 3,120
TOTAL Capital Costs 17,790
Table 5.4 Operating costs for HS2 (London to West Midlands) by category (£
million 2011 PV/prices
Operating & Maintenance £ Million
Infrastructure operations and
maintenance 800
Rolling stock maintenance 2,600
Rolling stock traction power 2,200
Train crew 1,600
Station costs 300
Other HS2 operating costs 600
Classic line cost savings from
released capacity -1,900
Additional Provision for Optimism
Bias 2,600
Total Operating & Maintenance Costs 8,600
Source: HS2 Ltd.
5.4 Appraisal of Transport User Benefits from HS2
5.4.1 The appraisal of benefits is based on, and essentially consistent with, DfT’s WebTAG
appraisal guidance. Estimates of generalised costs from the HS2 demand model are used to
calculate the benefits to transport users, and changes in the number of car vehicle km and
air passenger movements are used to estimate the value of other impacts such as accidents,
highway congestion, air quality and noise for which there are established monetary rates.
5.4.2 A high speed line would offer benefits from faster, more reliable, more frequent and, in many
cases, less crowded services. On this basis it is estimated that HS2 would generate benefits

5 Analysis of Economic Case for HS2 London to West Midlands (Phase 1)
HS2 London - West Midlands 5.7
of some £23.1 billion (PV) (including Wider Economic Impacts) and increase net rail revenues
by almost £13.9 billion over the course of the 60 year appraisal period.
5.4.3 Over 85% (£20.1 billion) of these benefits come to transport users. These benefits are
driven by time savings which make up £19.9 billion. The time savings accrue from a number
of different benefits:
� rail (in vehicle) journey time saving: £10 billion
� improved Reliability: £3.2 billion
� rail reduced crowding: £2.8 billion
� other rail impacts (such as frequency and station access benefits): £3.2 billion
� other impacts (road user time and cost savings): £0.8 billion.
5.4.4 These benefits are spread across much of the UK. The three largest economic centres in the
country – London, Birmingham and Manchester – representing almost a quarter of the UK’s
employment, would benefit directly from the scheme. In particular connectivity between
these cities would be significantly improved. The benefits would not be limited to areas
directly served by HS2. Passengers from a wide catchment area would be likely to access
high speed services, using both road and classic rail to access the high speed stations, and
passengers on the classic rail network benefit from released capacity.
5.4.5 Figure 5.3 below shows the distribution of benefits for long distance passengers according to
where trips start. Of course where a trip starts may not represent where the benefits are
experienced, but it provides some indication of who will gain as a result of HS2. Note that
the benefits are from the PLD model only and exclude benefits from the PS and PM regional
models.

5 Analysis of Economic Case for HS2 London to West Midlands (Phase 1)
HS2 London - West Midlands 5.8
Figure 5.3 Transport User Benefits of HS2 Phase1 London to West Midlands
by Origin of Trip in 2037
Notes: Benefits are for long distance passengers only and exclude short distance passengers modelled in PLANET South and Midlands

5 Analysis of Economic Case for HS2 London to West Midlands (Phase 1)
HS2 London - West Midlands 5.9
5.4.6 Figure 5.3 shows the transport user benefits of HS2 for London – West Midlands (Phase 1)
and indicates that benefits accrue all along the line of the WCML. Trips starting in London,
Birmingham, Manchester, Glasgow and Liverpool drive much of the benefits, reflecting the
major centres of population and economic activity. However, the benefits stretch all along
the WCML, and are particularly clustered around stations which will be served by HS2 classic
compatible trains, including Warrington, Preston and Crewe.
5.4.7 Table 5.5 gives the regional breakdown of transport user benefits to long distance trips
starting in different regions again for HS2 for London – West Midlands (Phase 1). Although
London accounts for the largest single share of benefits, in total well over 50% of benefits
fall outside London and the South East, with significant benefits from trips starting in the
West Midlands and the North West. Around one third of the benefits accrue to trips starting
north of Birmingham with the North West the biggest beneficiary.
5.4.8 Generally the distribution of benefits is similar to those presented in February 2011. There is
a reduction in the proportion of benefits from Scotland.
Table 5.5 Transport User with Benefits of HS2 by Region and Purpose
Regional User
Benefits Business Other Total
London 24% 14% 38%
South East 3% 2% 5%
West Midlands 14% 9% 23%
North West 16% 10% 25%
East Midlands 1% 1% 1%
Yorkshire and
Humber 0% 0% 0%
North East 0% 0% 0%
Scotland 1% 1% 3%
Other 2% 2% 4%
TOTAL 62% 38% 100%
Numbers may not add due to rounding.
5.4.9 Business passengers would gain the most value from HS2, representing over 60% of the
benefits. This is despite representing only around 30% of trips and largely reflects the high
value that business users and their employers attach to having faster journeys. Other users
of HS2 would also gain significantly from improved journey times, reliability, and relieved
crowding delivering benefits worth some £7.8 billion.

5 Analysis of Economic Case for HS2 London to West Midlands (Phase 1)
HS2 London - West Midlands 5.10
Benefits by Transport Mode
5.4.10 As would be expected, the benefits would not be spread evenly across the transport modes.
� HS2 Passengers. These gains are mainly driven by improved journey times, with
reliability and reduced crowding also generating significant benefits.
� Passengers on the Classic Line. Taking long distance journeys onto HS2 would
free up capacity for shorter distance journeys on the WCML. This would reduce
crowding substantially and greater frequency would also be offered on local and
regional services where appropriate. This is expected to deliver benefits of around
£2.9 billion.
� Road Users. Around 10,400 long distance car trips would be likely to transfer to
HS2 every weekday on average in 2037. This would lead to a reduction in congestion
but the net impact of this is relatively small. For example traffic flows on the
southern section of the M1 would fall by around 1%. However, across all road users,
this adds up to some £0.8 billion in benefits.
5.4.11 While the majority of transport users would benefit from the introduction of HS2, some
passengers could experience longer or less frequent services. For example, whilst travellers
on the Great Western Main Line (GWML) would benefit from improved connectivity to HS2 at
Old Oak Common, they would also see a slight increase in journey time to central London
due to the additional stop. Also, depending on how released capacity is used on the WCML,
some stations could see an increased journey time, or even a reduction in services, to
London, and as more passengers use rail and underground services to access HS2 there
could also be localised increases in crowding. These impacts and the disbenefits they
generate have been included in the assessment of the costs and benefits of HS2, but are
significantly outweighed by the larger benefits generated. They also might be minimised
further through detailed development of the classic rail timetable and train service
specification.
5.5 Wider Economic Impacts of HS2
5.5.1 The benefits of HS2 considered so far have mainly been those traditionally estimated in
transport appraisal such as time savings, crowding and reliability. There is an increasing
volume of evidence that transport interventions can generate further benefits, mainly to the
productivity of the economy. These Wider Economic Impacts (WEIs) include the benefits
from improved linkages between different firms and between firms and their workers, which
can lead to economies of scale, and other efficiencies. Further potential impacts may be
realised if HS2 results in changes in the spatial pattern of economic activity in the UK.
5.5.2 The DfT have developed methodologies to assess WEIs. Draft Guidance on these is included
The Wider Impacts Sub-Objective TAG Unit 3.5.14 Draft for Consultation – and as such will
form a requirement for appraisals to assess these impacts.
5.5.3 The largest such benefits relate to what are called agglomeration benefits – where many
firms are closer together in terms of travel time, they operate more efficiently and there are
additional benefits not captured in a traditional transport appraisal. There are also some
benefits due to competition in reality not being perfect (which is an assumption underpinning
traditional transport appraisal). Correcting for this can lead to additional benefits.

5 Analysis of Economic Case for HS2 London to West Midlands (Phase 1)
HS2 London - West Midlands 5.11
5.5.4 Table 5.6 provides a summary of both the traditional appraisal impacts and the additional
Wider Economic Impacts, as estimated using this draft guidance.
Table 5.6 Benefits of High Speed 2 Phase 1 using DfT’s Transport Appraisal
and Wider Economic Impacts Guidance
Benefits
Welfare
(PV 2011 discount year
and prices)
A) Conventional Appraisal
Time Savings (including crowding)
Business user savings £12.3bn
Commuting & Leisure user savings £7.8bn
Other Quantifiable benefits Other User Impacts
(highway accidents, air quality and HS1 link) £0.6bn
Loss to Government of Indirect Taxes -£1.6bn
Total transport user benefits - conventional
appraisal £19.0bn
B) Wider Economic Impacts
Labour Market Impacts £0.01bn
Agglomeration benefits £2.8bn
Imperfect competition £1.2bn
Additional to conventional appraisal £4.1bn
C) Total (excluding financing, social & environmental
costs & benefits) £23.1bn
5.5.5 Section A of Table 5.6 summarises the results of the more conventional appraisal of
transport user benefits outlined in WebTAG. These have been described in more detail in the
section 5.4. Section B outlines each of the components of Wider Economic Impacts that
represent additional benefits, as calculated using the draft guidance from DfT.
5.5.6 Overall Wider Economic Impacts based on DfT’s draft guidance are estimated to add a
further £4.1 billion (18%) to the benefits of HS2.

5 Analysis of Economic Case for HS2 London to West Midlands (Phase 1)
HS2 London - West Midlands 5.12
5.6 HS2 Benefit Cost Ratio
5.6.1 Within preceding sections, the substantial monetised benefits and costs of HS2 have been
outlined. In this section this is drawn together to consider the strength of the overall
monetised impacts and whether the benefits justify the costs. Table 5.7 summarises all of
the key impacts that can easily be quantified and valued in monetary terms.
Table 5.7 Appraisal Summary Table of HS2 Phase 1
Monetised Costs and Benefits of HS2
(PV 2011 discount year and prices)
(1) Transport User Benefits Business
£12.3 bn
Other
£7.8 bn
(2) Other Benefits £0.6 bn
(3) Loss to Government of Indirect Taxes -£1.6 bn
(4) Net Transport Benefits (PVB) = (1) + (2) + (3) £19.0 bn
(5) Wider Economic Impacts (WEIs) £4.1 bn
(6) Net Benefits incl WEIs = (4) + (5) £23.1 bn
(7) Capital Costs £18.8 bn
(8) Operating Costs £8.6 bn
(9) Total Costs = (7) + (8) £27.4 bn
(10) Revenues £13.9 bn
(11) Net Costs to Government (PVC) = (9) – (10) £13.5 bn
(12) BCR without WEIs (ratio) = (4)/(11) 1.4
(13) BCR with WEIs (ratio) = (6)/(11) 1.7
Note: Numbers may not add due to rounding.
5.6.2 Table 5.7 sets out each element of the appraisal. The net transport benefits (item 4) would
be worth almost £19.0 billion. Benefits to business and other transport users make up the
bulk of this (£12.3 billion and £7.8 billion respectively); with small further benefits (£600
million) from reductions in accidents, air quality and carbon emissions from lower road
traffic, as well as the benefits of the HS1 link. From this we have subtracted £1.6 billion
(item 3) – the loss to the Government of indirect tax revenue as a result of fewer people
travelling by car and therefore paying less fuel duty, for example. A further £4.1 billion
could be added through WEIs (item 5). The total benefits of the scheme, net of the loss of
indirect taxes are therefore estimated to be £23.1 billion (item 6).
5 Analysis of Economic Case for HS2 London to West Midlands (Phase 1)
HS2 London - West Midlands 5.13
5.6.3 Against these benefits, the costs of construction and operation of HS2 would be substantial.
Over the 60 years of an appraisal, costs would be £27.4 billion (item 9). The bulk of these
are capital costs (almost £18.8 billion). The remainder (30% of costs) is the net impact on
operating costs, covering both HS2 trains and the classic network. After taking account of
increases in revenue, the net cost to Government would be £13.5 billion (item 11).
5.6.4 The BCR of HS2, including WEIs would be 1.7 (item 13). In other words for every £1 spent
by Government, the scheme would deliver £1.70 in benefits. The BCR excluding WEIs is 1.4.
Since the benefits per £1 spent are higher than £1, this BCR represents a positive appraisal
of transport user benefits and wider economic benefits compared to construction and
operating costs.
HS2 London - West Midlands 6.1
6 Analysis of the Economic Case for HS2 London to Manchester, Leeds and Heathrow (Y Network)
6.1 Introduction
6.1.1 This chapter considers the economic case for a high-level assessment of the Y network for
HS2 to Manchester and Leeds. This is for two separate corridors – one corridor direct to
Manchester and then connecting on to the WCML, and the other to Leeds via the East
Midlands and South Yorkshire, with stations in both areas, before connecting to the East
Coast Mainline (ECML). This is known as the ‘Y network’.
6.1.2 Since the publication of the February 2011 Economic Case, there have been a number of
developments to the modelling of the Y network:
� Updated information on the likely patterns of demand has been used to refine service
patterns on HS2. This has increased capacity to Scotland and expanded services to
include Edinburgh in particular. It has also reduced journey times to some locations in
line with the latest view on the design of the Y network (see Appendix A).
� Further work has been carried out to develop a specification for changes to classic
services and using the capacity freed up – particularly on the East Coast Main Line
(ECML), Midland Main Line (MML) and Cross-Country services (XC)– and this has been
used in the analysis (see Appendix A). It should be noted that further optimisation of
services may be possible and work is continuing in this area.
� Assumptions on the location of stations have been refined as the detailed work on
developing the Y network has progressed.
� Cost estimates have been updated to reflect HS2 Ltd's latest views of the likely cost to
build, maintain and operate the proposed Y network, as well as changes in costs on
the classic network.
6.1.3 The current model has some limitations when assessing released capacity as it does not
consider the potential impacts on shorter distance passengers, for example, commuters, on
rail lines north of the West Midlands. It also has some limitation in its approach to modelling
the accessibility of new stations on the Y network outside London and the West Midlands. A
range of forecasts have been produced to reflect varying assumptions on the modelling of
HS2 stations. The upper end of the range models all HS2 stations as having the same
accessibility as the nearest city centre location regardless of their actual location which may
overstate the benefits of some locations. At the lower end of the range some stations are
modelled with very restrictive accessibility so passengers can effectively only access by car.
6.1.4 The Y network specification has been refined since February 2011, and the network
specification included here represents the current state of analysis. Work on the Y network
is due to report to Government in March 2012, when a more detailed specification will be
available.
6.1.5 This chapter begins by setting out forecasts of demand for the HS2 Y network, before moving
on to consider the costs and benefits of the scheme. It concludes by looking at the overall
balance of monetised costs and benefits.
Analysis of the Economic Case for HS2 London to Manchester, Leeds and Heathrow
(Y Network)
HS2 London - West Midlands 6.2
6.2 Passenger Demand for HS2
6.2.1 We set out in Chapter 3 our view of the growth in demand to 2037 without HS2. Table 3.1
showed substantial growth in demand for long distance rail trips and Figure 3.5 showed a
substantial level of crowding on the WCML.
6.2.2 With the Y network in place, journeys between London and Manchester, Leeds and
Glasgow/Edinburgh would be up to 60 minutes faster than current services. A new high
speed line would also allow a more frequent and reliable service, and provide greater rail
capacity.
6.2.3 These improvements in travel time and experience would attract significant numbers of
passengers onto the high speed trains. It is forecast that around 270,000 passengers per
day would be expected to use the main HS2 line in and out of London in 2037. In addition,
almost 110,000 passengers per day are expected to use HS2 for interregional (non-London)
trips, reflecting the improved connectivity that the Y network offers the regions of the UK.
This is an increase compared to the forecasts presented in February 2011.
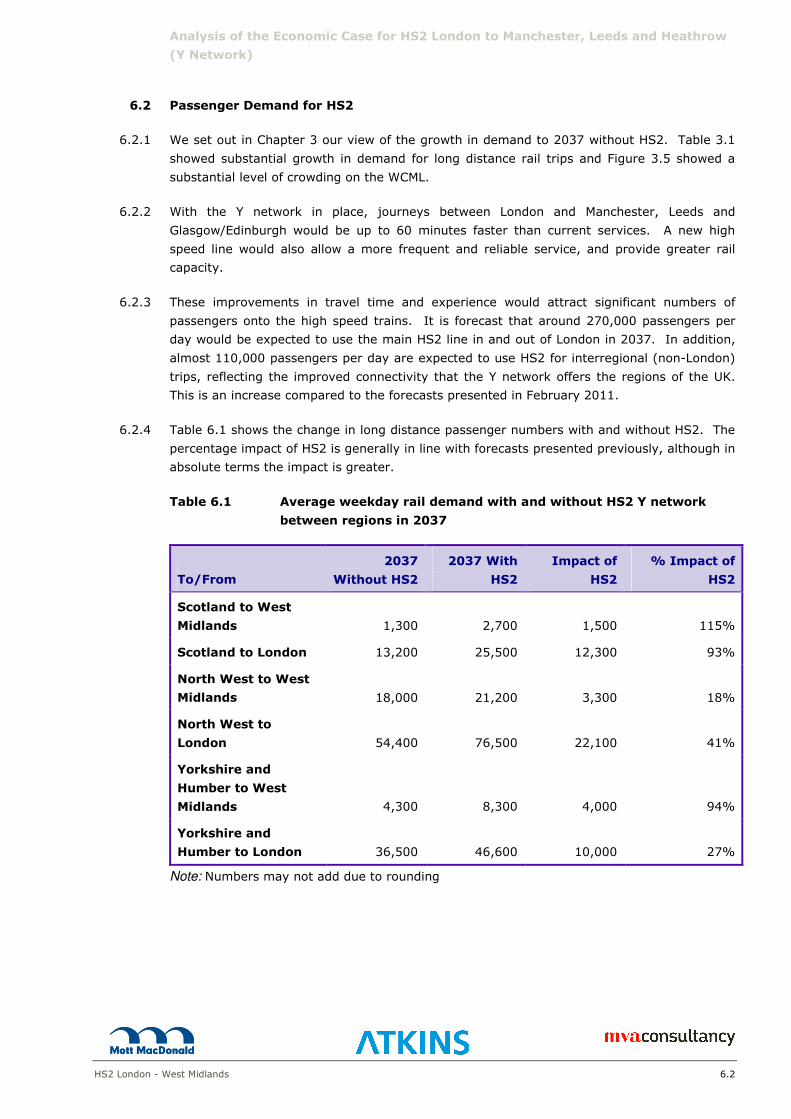
6.2.4 Table 6.1 shows the change in long distance passenger numbers with and without HS2. The
percentage impact of HS2 is generally in line with forecasts presented previously, although in
absolute terms the impact is greater.
Table 6.1 Average weekday rail demand with and without HS2 Y network
between regions in 2037
To/From
2037
Without HS2
2037 With
HS2
Impact of
HS2
% Impact of
HS2
Scotland to West
Midlands 1,300 2,700 1,500 115%
Scotland to London 13,200 25,500 12,300 93%
North West to West
Midlands 18,000 21,200 3,300 18%
North West to
London 54,400 76,500 22,100 41%
Yorkshire and
Humber to West
Midlands 4,300 8,300 4,000 94%
Yorkshire and
Humber to London 36,500 46,600 10,000 27%
Note: Numbers may not add due to rounding
Analysis of the Economic Case for HS2 London to Manchester, Leeds and Heathrow
(Y Network)
HS2 London - West Midlands 6.3
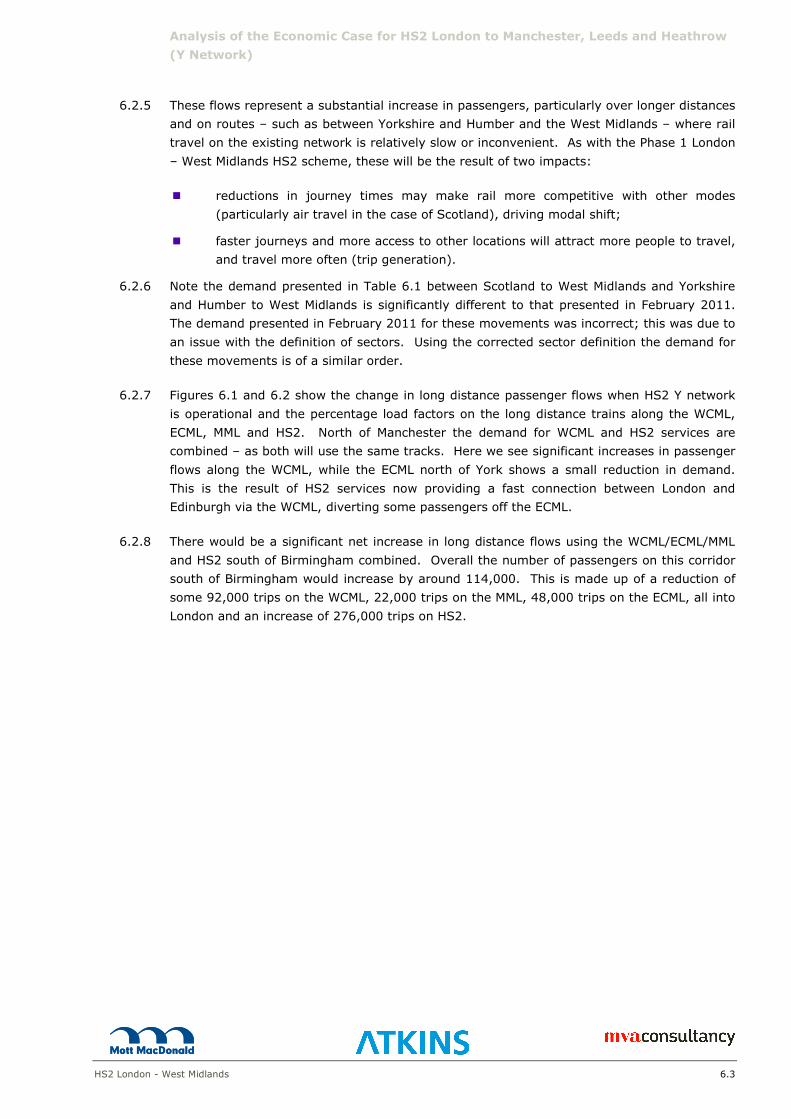
6.2.5 These flows represent a substantial increase in passengers, particularly over longer distances
and on routes – such as between Yorkshire and Humber and the West Midlands – where rail
travel on the existing network is relatively slow or inconvenient. As with the Phase 1 London
– West Midlands HS2 scheme, these will be the result of two impacts:
� reductions in journey times may make rail more competitive with other modes
(particularly air travel in the case of Scotland), driving modal shift;
� faster journeys and more access to other locations will attract more people to travel,
and travel more often (trip generation).
6.2.6 Note the demand presented in Table 6.1 between Scotland to West Midlands and Yorkshire
and Humber to West Midlands is significantly different to that presented in February 2011.
The demand presented in February 2011 for these movements was incorrect; this was due to
an issue with the definition of sectors. Using the corrected sector definition the demand for
these movements is of a similar order.
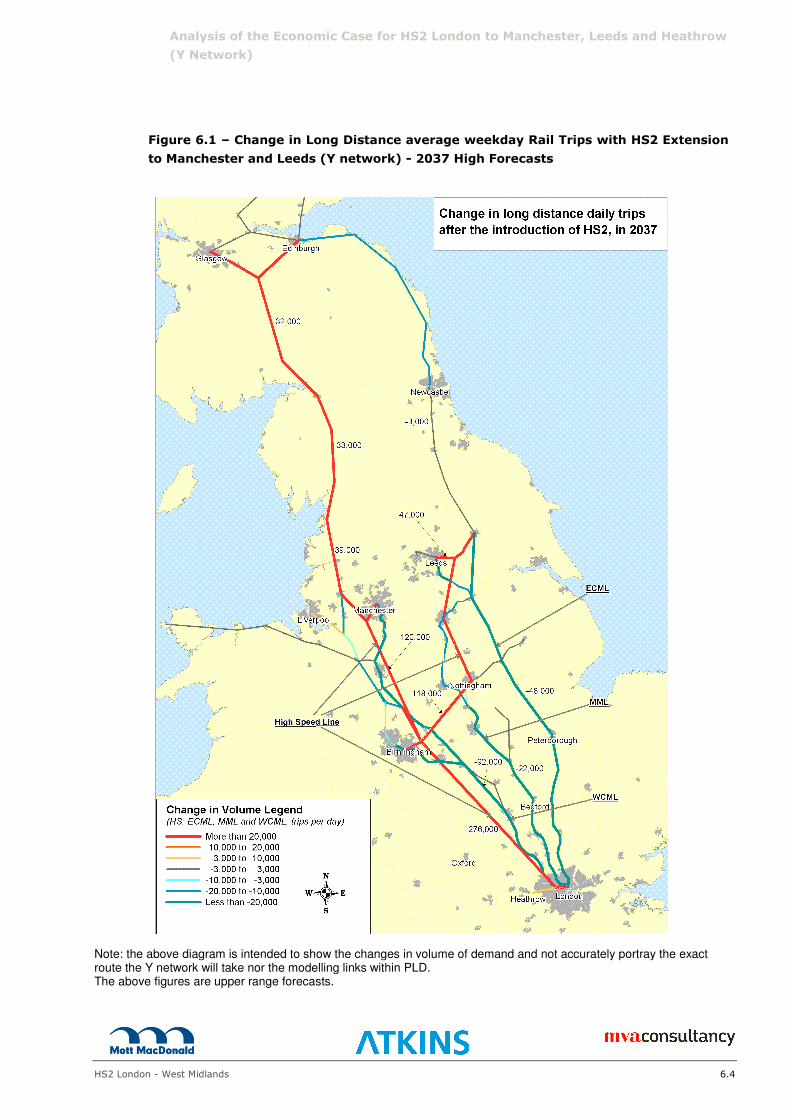
6.2.7 Figures 6.1 and 6.2 show the change in long distance passenger flows when HS2 Y network
is operational and the percentage load factors on the long distance trains along the WCML,
ECML, MML and HS2. North of Manchester the demand for WCML and HS2 services are
combined – as both will use the same tracks. Here we see significant increases in passenger
flows along the WCML, while the ECML north of York shows a small reduction in demand.
This is the result of HS2 services now providing a fast connection between London and
Edinburgh via the WCML, diverting some passengers off the ECML.
6.2.8 There would be a significant net increase in long distance flows using the WCML/ECML/MML
and HS2 south of Birmingham combined. Overall the number of passengers on this corridor
south of Birmingham would increase by around 114,000. This is made up of a reduction of
some 92,000 trips on the WCML, 22,000 trips on the MML, 48,000 trips on the ECML, all into
London and an increase of 276,000 trips on HS2.
Analysis of the Economic Case for HS2 London to Manchester, Leeds and Heathrow
(Y Network)
HS2 London - West Midlands 6.4
Figure 6.1 – Change in Long Distance average weekday Rail Trips with HS2 Extension
to Manchester and Leeds (Y network) - 2037 High Forecasts
Note: the above diagram is intended to show the changes in volume of demand and not accurately portray the exact route the Y network will take nor the modelling links within PLD. The above figures are upper range forecasts.
Analysis of the Economic Case for HS2 London to Manchester, Leeds and Heathrow
(Y Network)
HS2 London - West Midlands 6.5
Figure 6.2 – Long Distance Weekday Load Factors with HS2 Extension to Manchester
and Leeds (Y network), % of seats occupied – 2037 High Forecasts
Note: the above diagram is intended to show the load factors but not accurately portray the
exact route the Y network nor the modelling links within PLD. The above figures represent the high forecasts.

Analysis of the Economic Case for HS2 London to Manchester, Leeds and Heathrow
(Y Network)
HS2 London - West Midlands 6.6
6.2.9 Table 6.2 shows the source of the increase over the do-minimum in the number of rail trips
(both HS2 and Classic rail) to London.
Table 6.2 Source of additional rail trips (Both High Speed and Classic rail) to
and from London as a Result of HS2 Y network compared to the do-
minimum.
Weekday Demand
To/From London Source of Additional Rail Passengers (%)
Total Car Air Generation
Scotland 12,300 1% 41% 58%
North West 22,100 6% 4% 90%
West Midlands 15,000 19% 0% 81%
North East 4,600 4% 7% 89%
Yorkshire 10,000 10% 1% 89%
East Midlands 7,600 19% 0% 81%
6.2.10 The proportions coming from each source are slightly different to those for the London-West
Midlands scheme (Table 5.2), due to the bigger journey time reductions to Scotland and the
North West that the Y network scheme offers, and the different way in which rates of
abstraction and generation are calculated. The level of abstracted demand is a function of
the journey time relative to the other mode, whereas the level of generated demand is a
function of the percentage decrease in journey time of the rail mode.
6.2.11 Compared to previous forecasts the proportion coming from each source is different. The
main change comes from trips to/from Scotland and the North West, where the proportion
transferring from air has fallen significantly. This reflects the large reduction in air demand
in the do minimum forecasts for these movements.
6.2.12 Table 6.3 shows the source of total HS2 daily demand to/from London. This indicates that
for most locations the significant proportion of demand is shift from classic rail, the exception
is Scotland, where air and newly generated trips are also significant contributors.

Analysis of the Economic Case for HS2 London to Manchester, Leeds and Heathrow
(Y Network)
HS2 London - West Midlands 6.7
Table 6.3 HS2 Y network Weekday Demand to/from London
Source of HS2 Passengers
To/From Total HSR Classic Rail Road Air Generated
37,200 2,800 0 12,200 West
Midlands
52,200
71% 5% 0% 23%
47,600 1,400 800 19,900 North West 69,700
68% 2% 1% 29%
13,200 100 5,000 7,200 Scotland 25,500
52% 0% 20% 28%
11,200 200 300 4,100
North East 15,700 71% 1% 2% 26%
28,300 1,000 100 8,900
Yorkshire 38,400 74% 3% 0% 23%
15,200 1,500 0 6,100 East
Midlands 22,800 67% 6% 0% 27%
3,100 100 10 400 Rest of the
Country 3,600 86% 3% 0% 11%
155,800 7,100 6,200 58,700 Total 227,800
68% 3% 3% 26%
Note: Numbers may not add due to rounding
6.2.13 People would travel on HS2 for a range of reasons. Faster journeys would attract more
business travel. Our modelling suggests one third of HS2 passengers would be undertaking
business trips, with a 23% overall increase in the number of long distance business rail trips
as a result of HS2. The majority of passengers (70%) would be people travelling for other
purposes (commuting and leisure), with leisure trips likely to be particularly important.
6.3 HS2 Appraisal Cost Summary
6.3.1 As with any major infrastructure project, HS2 would come with a high capital cost, although
this would be offset, to some extent, by revenues from passengers over time. If the scheme
progresses, a key aim would be to reduce the planned costs of the project in order to
increase its value for money.
6.3.2 Cost summaries are shown below for the full Y network post implementation of phase two
West Midlands to Manchester and Leeds. These include the cost of phase one, which are
based on the London – West Midlands route as amended post-consultation. In order to
derive costs for phase two (the construction of the full Y network – extensions to Manchester
and Leeds) HS2 Ltd have used data available from an interim milestone in their work for
routes to Manchester and Leeds. The phase two work will conclude with HS2 Ltd's report to
Government due at the end of March 2012.
6.3.3 Estimated capital costs are shown in Table 6.4 and operating and maintenance costs in Table
6.5.
Analysis of the Economic Case for HS2 London to Manchester, Leeds and Heathrow
(Y Network)
HS2 London - West Midlands 6.8
Table 6.4 Undiscounted Capital Cost Estimates for the full Y Network; £
millions 2011 PV/Prices – Including Risk
Capital Expenditure £ million
Construction 26,760
Rolling Stock 7,450
TOTAL Capital Costs 34,210
Table 6.5 Operating costs for the full HS2 Y network by category (£ million
2011 PV/prices)
Operating & Maintenance £ million
HS2 Infrastructure operations and maintenance 1,900
Rolling stock maintenance 6,600
Rolling stock traction power 6,100
Train crew 3,900
Station costs 500
Other HS2 operating costs 1,200
Classic line cost savings from released capacity -5,100
Additional provision for optimism bias 6,500
Total Operating & Maintenance Costs 21,700
Source: HS2 Ltd.
6.4 Appraisal of Benefits from HS2
6.4.1 A high level assessment of the Y Network for HS2 has been undertaken to appraise the
benefits. Estimates of generalised costs from the HS2 demand model are used to calculate
the benefits to transport users, and changes in the number of car vehicle km and air
passenger movements are used to estimate the value of other impacts such as accidents,
highway congestion, air quality and noise for which there are established monetary rates.
6.4.2 The Y network would deliver reduced journey times of up to an hour between some of the
UK’s largest cities. This, combined with greater reliability and capacity (reducing crowding
levels on long distance trains across the rail network) leads us to estimate that around

Analysis of the Economic Case for HS2 London to Manchester, Leeds and Heathrow
(Y Network)
HS2 London - West Midlands 6.9
270,000 passengers per day in 2037 (or 82 million passengers per year) would be expected
to use the main high speed line into and out of London, with as many as 4.5 million air trips
and 11 million road trips transferring to HS2. The Y network would generate overall benefits
including Wider Economic Impacts (WEIs) of between £47 billion and £59 billion, mainly from
the time saving offered by high speed rail, compared to classic rail. Wider Economic Impacts
account for between £5.7 billion and £12.3 billion of overall benefits.
6.4.3 The total user benefits are spread across much of the UK. London, Birmingham, Manchester,
Leeds, South Yorkshire and the East Midlands would benefit directly from the scheme. In
particular connectivity between these cities would be significantly improved. The benefits
would not be limited to areas directly served by HS2. Passengers from a wide catchment
area would be likely to access high speed services, using both road and classic rail to access
the high speed stations.
6.4.4 Figure 6.3 below shows the distribution of benefits for long distance passengers according to
where trips start. Of course where a trip starts may not represent where the benefits are
experienced, but it provides some indication of who will gain as a result of HS2. Note that
the benefits are from the PLD model only and exclude benefits from the PS and PM regional
models.

Analysis of the Economic Case for HS2 London to Manchester, Leeds and Heathrow
(Y Network)
HS2 London - West Midlands 6.10
Figure 6.3 - Benefits of HS2 with HS2 Extension to Manchester and Leeds
(Y network) by Origin of Trip in 2037 (High Forecasts)
Notes: Benefits are for long distance passengers only and exclude short distance passengers modelled in PLANET South and Midlands. The above figures are high forecasts.

Analysis of the Economic Case for HS2 London to Manchester, Leeds and Heathrow
(Y Network)
HS2 London - West Midlands 6.11
6.4.5 Figure 6.3 shows that the benefits of HS2 accrue all along the line of the WCML and the
extension to Leeds with the onward connection on to the East Coast Mainline. On the west
coast trips starting in London, Birmingham, Manchester, Glasgow and Liverpool drive much
of the benefits, reflecting the major centres of population and economic activity. To the east
benefits accrue at Leeds, South Yorkshire, East Midlands and Newcastle. These benefits
include the initial indicative benefits of reusing capacity released on the Midland Main Line
and the East Coast Main Line. The work is ongoing and further optimisation may be possible.
6.4.6 Table 6.6 gives the regional breakdown of benefits to long distance trips starting in different
regions (looking at the benefits according to where a trip finishes would give a similar
pattern of benefits). Trips starting in London and the South East account for the largest
share of benefits, although a slightly smaller share than for Phase 1. Well over 50% of
benefits relate to trips starting outside London and the South East, with the most significant
shares seen in the West Midlands, North West and Yorkshire and the Humber. The
geographical distribution of benefits is similar to the results presented previously.
Table 6.6 Benefits of HS2 by Region and Purpose
Regional User Benefits Business Other Total
London 22% 11% 33%
South East 4% 2% 5%
West Midlands 9% 6% 14%
North West 10% 6% 16%
East Midlands 5% 3% 7%
Yorkshire and Humber 6% 4% 10%
North East 2% 1% 3%
Scotland 4% 2% 6%
Other 3% 1% 4%
TOTAL 65% 35% 100%
6.4.7 Section A of Table 6.7 summarises the results of the more conventional appraisal of
transport user benefits outlined in WebTAG. Section B outlines each of the components of
Wider Economic Impacts that represent additional benefits, as calculated using the draft
guidance from DfT.
Analysis of the Economic Case for HS2 London to Manchester, Leeds and Heathrow
(Y Network)
HS2 London - West Midlands 6.12
6.4.8 Business passengers would gain the most value from HS2, representing over 60% of the
benefits. This is despite representing only around 30% of trips and largely reflects the high
value that business users and their employers attach to having faster journeys. Other users
of HS2 would also gain significantly from improved journey times, reliability, and relieved
crowding delivering benefits of between £15bn and £17bn.
6.4.9 The calculation of WEIs using draft guidance from DfT suggests that WEIs could add some
£12 billion (2011 PV and prices) to the benefits of HS2 (almost 30% of the total benefits).
Almost 80% percent of this is due to agglomeration benefits, with the remainder mainly the
result of increased output of imperfectly competitive markets. In theory, this should
represent a conservative estimate of WEIs, since the model does not yet fully reflect the
impact of changes in released capacity for local passengers. However, it is considered that
further investigation of this result is needed to ensure the benefits are justified and not
driven by particular assumptions in the draft guidance.
6.4.10 Therefore a more conservative approach has been adopted and a range defined, with the
lower end of the range assuming no additional agglomeration benefits over and above those
offered by the first phase between London and the West Midlands and the values calculated
using the draft guidance for the extension to Manchester and Leeds representing an upper
bound of the range.
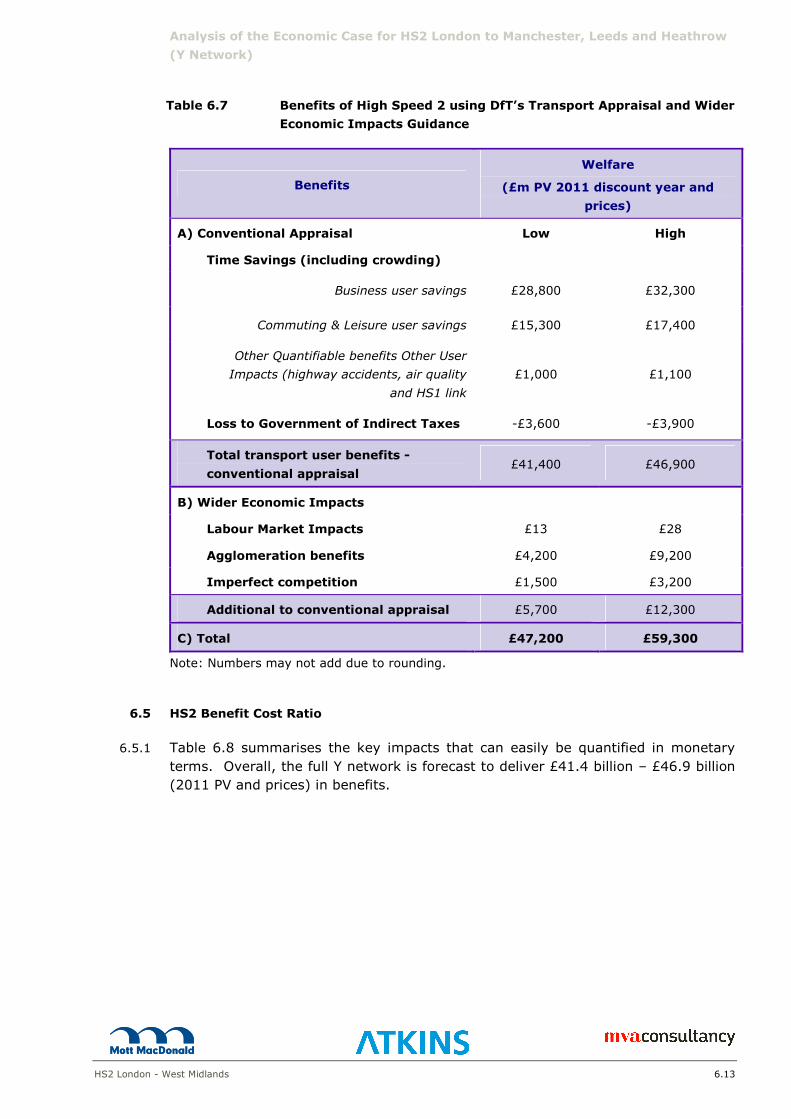
Analysis of the Economic Case for HS2 London to Manchester, Leeds and Heathrow
(Y Network)
HS2 London - West Midlands 6.13
Table 6.7 Benefits of High Speed 2 using DfT’s Transport Appraisal and Wider
Economic Impacts Guidance
Benefits
Welfare
(£m PV 2011 discount year and
prices)
A) Conventional Appraisal Low High
Time Savings (including crowding)
Business user savings £28,800 £32,300
Commuting & Leisure user savings £15,300 £17,400
Other Quantifiable benefits Other User
Impacts (highway accidents, air quality
and HS1 link
£1,000 £1,100
Loss to Government of Indirect Taxes -£3,600 -£3,900
Total transport user benefits -
conventional appraisal £41,400 £46,900
B) Wider Economic Impacts
Labour Market Impacts £13 £28
Agglomeration benefits £4,200 £9,200
Imperfect competition £1,500 £3,200
Additional to conventional appraisal £5,700 £12,300
C) Total £47,200 £59,300
Note: Numbers may not add due to rounding.
6.5 HS2 Benefit Cost Ratio
6.5.1 Table 6.8 summarises the key impacts that can easily be quantified in monetary
terms. Overall, the full Y network is forecast to deliver £41.4 billion – £46.9 billion
(2011 PV and prices) in benefits.

Analysis of the Economic Case for HS2 London to Manchester, Leeds and Heathrow
(Y Network)
HS2 London - West Midlands 6.14
Table 6.8 HS2 Y Network quantified costs and benefits (£ billions) of HS2
(2011 PV/prices) and resulting BCR
Monetised Costs and Benefits of HS2
Low High
(1) Transport User Benefits Business £28.8bn £32.3bn
(2) Transport User Benefits Other– £15.3bn 17.4bn
(3) Other quantifiable benefits £1.0bn £1.1bn
(4) Loss to Government of Indirect Taxes -£3.6bn -£3.9bn
(5) Net Transport Benefits (PVB) = (1) + (2)
+ (3) £41.4bn £46.9bn
(6) Wider Economic Impacts (WEIs) £5.7bn £12.3bn
(7) Net Benefits including WEIs = (4) + (5) £47.2bn £59.3bn
(8) Capital Costs £36.4bn
(9) Operating Costs £21.7bn
(10) Total Costs = (7) + (8) £58.1bn
(11) Revenues £31.8bn £34.0bn
(12) Net Costs to Government (PVC) = (9)
– (10) £26.3bn £24.1bn
(13) BCR without WEIs (ratio) = (4)/(11) 1.6 1.9
(1) BCR with WEIs (ratio) = (6)/(11) 1.8 2.5
Source: HS2 Ltd
N.B. The numbers represent the lower and upper estimates.
6.5.2 DfT considers the value for money of a scheme in terms of the value of benefits per
pound of Government spending. The cost of the scheme is not the same value as
total Government spending on the project; since HS2 would increase revenues on
the rail network, by £31.8 billion – £34.0 billion (item 10), which would partially
offset the overall cost of the scheme. The net cost to Government would therefore
be £24.1 billion – £26.3 billion (item 11) which outweighs the benefits.
6.5.3 The BCR is the net benefit divided by the net cost to Government. On this basis the
BCR of HS2, including WEIs, would be 1.8 – 2.5. In other words, for every £1
spent by Government, the scheme would deliver up to £2.50 in benefits. Similarly,
the BCR excluding WEIs is 1.6 – 1.9.
HS2 London - West Midlands 7.1
7 Sensitivity Tests
7.1 Introduction
7.1.1 This chapter describes some of the sensitivity tests undertaken. Three types of test are
reported:
� the first type examines the impact of changes in growth rates on rail and other
modes, including changing the level at which demand is capped;
� the second type covers specific changes to the assumptions, such as changes in fares
across modes, HS2 service reliability, seating capacity, and PDFH version;
� the third type tests different approaches to valuation of value of time.
7.1.2 All sensitivity tests described in this chapter were undertaken on the London – West Midlands
HS2 (Phase 1) option. These use the service patterns set out in the central case. No attempt
to optimise for changes in demand or assumptions has been made. As such the analysis is
likely to represent a worst case view.
7.2 Future growth
7.2.1 There is clearly uncertainty around future rail demand growth. This can be broadly
attributed to four factors:
� economic growth – will this be different from official Government derived forecasts?
� the relationship (elasticity) with economic growth – has this been estimated
correctly? Will it change in the future (e.g. saturation of the market leading to a
reduction in the elasticity)?
� costs (fares) and times may not change as forecast – e.g. increasing fuel costs are
not offset by increased fuel efficiency;
� population growth – less important than the other factors; note that through
immigration it is linked to economic growth.
7.2.2 If the first and fourth of these are wrong, then the forecasts for all modes are likely to be
wrong in the same direction. If the second, then there is no obvious impact on other modes.
If the third is wrong, then the impact on other modes would be the opposite direction.
7.2.3 The tests undertaken have been of three types:
� demand cap year;
� demand growth;
� GDP growth.
7.2.4 The last two of these interact in that if demand growth changes due to changes in GDP
growth, there will be changes to the value of time, and hence the value of economic benefits,
as well as changes to the demand forecasts. This is taken into account in the relevant
sensitivity tests described below.

Sensitivity Tests
HS2 London - West Midlands 7.2
7.2.5 The following tests have been undertaken. With the exception of the two tests on the
demand cap, it is assumed that the cap year is consistent with the level of demand seen in
the central forecasts:
� 2026 demand cap;
� 2042 demand cap;
� +40% demand growth, demand cap 2029;
� -25% demand growth, demand cap 2044;
� -50% demand growth, demand cap 2059;
� +40% demand growth driven by GDP, demand cap 2029;
� -25% demand growth driven by GDP, demand cap 2044;
� -50% demand growth driven by GDP, demand cap 2059.
7.2.6 These changes do not affect the scheme costs, so results are presented for socio-economic
benefits, revenue and BCR (benefit:cost ratio).
Table 7.1 Summary of future growth sensitivity tests (£m NPV)
Test Socio-
economic
benefits
Revenue BCR
excl WEI
Central case 19,000 13,900 1.41
2026 demand cap 13,900 9,100 0.76
2042 demand cap 21,000 15,600 1.77
+40% demand growth 19,700 14,700 1.54
-25% demand growth 18,600 13,400 1.33
-50% demand growth 17,700 12,400 1.18
+40% demand growth driven by GDP 25,900 14,700 2.02
-25% demand growth driven by GDP 15,700 13,400 1.12
-50% demand growth driven by GDP 12,600 12,400 0.84
7.2.7 The conclusions of the sensitivity tests are:
� capping the demand in 2026 causes a large decrease in the demand, benefits and
BCR levels, and reduces the BCR to below 1. Capping demand in 2042 causes a large
increase in demand and benefits and increases the BCR to 1.8;
� revenue and benefits are relatively insensitive to changes in demand growth, when
the cap year is adjusted to compensate, i.e. the level at which demand is capped is
more important than when capping occurs;
� when an increase in demand growth is driven by GDP growth, the improvement in
the BCR is further enhanced by an increase in the value of each minute saved.

Sensitivity Tests
HS2 London - West Midlands 7.3
7.3 Assumption Changes
7.3.1 The tests undertaken have been of six types:
� reliability of HS2 services;
� PDFH versions;
� change in seating capacity;
� no growth on car and air modes.
� changing the costs of a mode with an estimated impact on rail;
� changing rail fares.
7.3.2 Specifically the following tests have been undertaken (demand cap in 2037 except where
stated otherwise):
� no reliability benefit due to HS2 services;
� PDFH v5 parameters for generalised journey time and fare elasticity. Note that PDFH
4 crowding values continue to be used for this test;
� Reduced seating capacity on 200 metre (450 instead of 550) and 400 metre (900
instead of 1100) trains;
� 300kph maximum speed cap;
� No air or car growth (no impact on rail demand);
� No air growth (no impact on road or rail demand);
� No car growth (no impact on rail or air demand);
� High car fuel duty – (50% increase in fuel duty), with associated higher Do Minimum
rail demand;
� High air fares (14% above base case in 2026, increasing to 19% by 2037) – based
on higher fuel prices, with associated higher Do Minimum rail demand.
7.3.3 Assumptions on rail fares depend on the impact on the demand cap. The way the current
forecasts were developed effectively assumes there is an absolute level of rail demand which
will be achieved – but not exceeded – at some point in the future. If this is the case, then
higher fares will lead to slower growth, but will ultimately deliver the same demand for HS2.
However since fares are higher, this level of demand will lead to higher revenues and so a
stronger economic case. For lower fares, the opposite will be true, with faster growth, but
lower revenues and overall a weaker economic case.
7.3.4 However if lower rail fares lead to mode shift – with additional passengers permanently
switching to rail from other modes as a result of improved comparative affordability – the
ultimate level of rail demand will be higher, leading to higher overall revenues and hence a
stronger BCR.
7.3.5 We have tested both of these scenarios in the following tests:
� Low rail fares (RPI+3% 2012 – 2015, RPI+0% after 2015); demand capped at 2030,
i.e. same level of demand as central case but occurring earlier because growth is
faster;
� High rail fares with mode shift (RPI+3% 2012 – 2015, RPI+2% from 2015, RPI+0%
from 2037);
� High rail fares (RPI+3% 2012 – 2015, RPI+2% after 2015); demand capped at 2043.
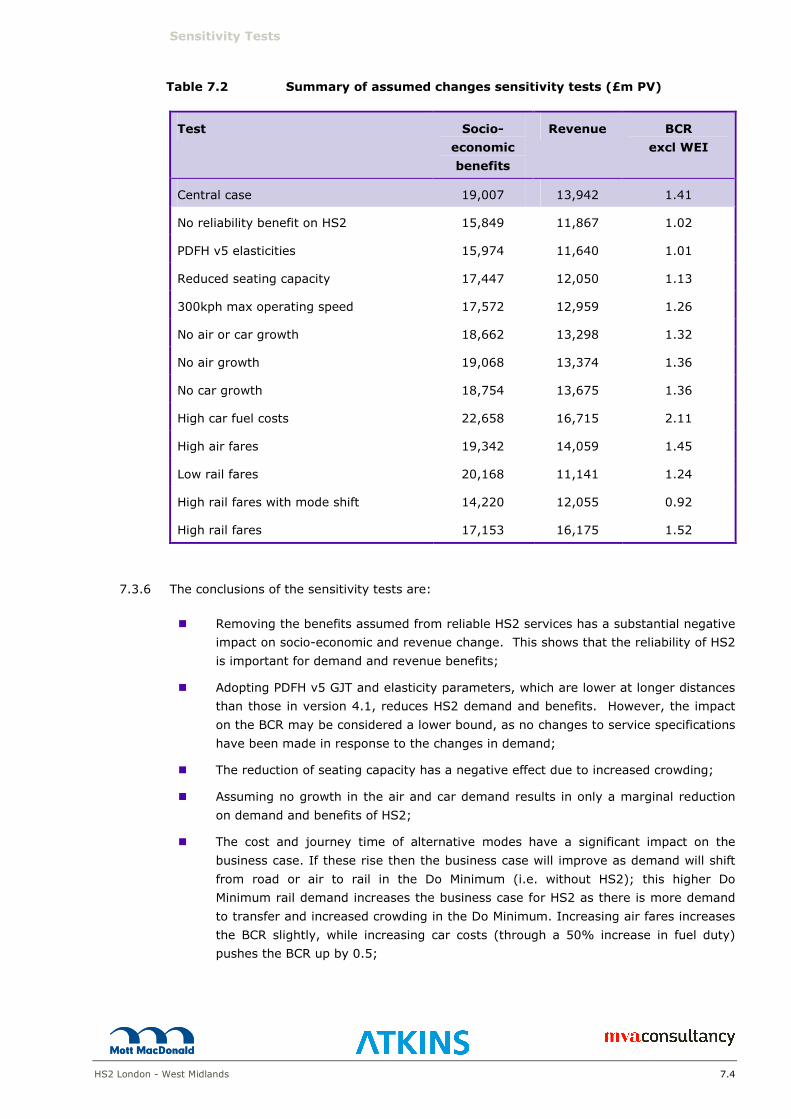
Sensitivity Tests
HS2 London - West Midlands 7.4
Table 7.2 Summary of assumed changes sensitivity tests (£m PV)
Test Socio-
economic
benefits
Revenue BCR
excl WEI
Central case 19,007 13,942 1.41
No reliability benefit on HS2 15,849 11,867 1.02
PDFH v5 elasticities 15,974 11,640 1.01
Reduced seating capacity 17,447 12,050 1.13
300kph max operating speed 17,572 12,959 1.26
No air or car growth 18,662 13,298 1.32
No air growth 19,068 13,374 1.36
No car growth 18,754 13,675 1.36
High car fuel costs 22,658 16,715 2.11
High air fares 19,342 14,059 1.45
Low rail fares 20,168 11,141 1.24
High rail fares with mode shift 14,220 12,055 0.92
High rail fares 17,153 16,175 1.52
7.3.6 The conclusions of the sensitivity tests are:
� Removing the benefits assumed from reliable HS2 services has a substantial negative
impact on socio-economic and revenue change. This shows that the reliability of HS2
is important for demand and revenue benefits;
� Adopting PDFH v5 GJT and elasticity parameters, which are lower at longer distances
than those in version 4.1, reduces HS2 demand and benefits. However, the impact
on the BCR may be considered a lower bound, as no changes to service specifications
have been made in response to the changes in demand;
� The reduction of seating capacity has a negative effect due to increased crowding;
� Assuming no growth in the air and car demand results in only a marginal reduction
on demand and benefits of HS2;
� The cost and journey time of alternative modes have a significant impact on the
business case. If these rise then the business case will improve as demand will shift
from road or air to rail in the Do Minimum (i.e. without HS2); this higher Do
Minimum rail demand increases the business case for HS2 as there is more demand
to transfer and increased crowding in the Do Minimum. Increasing air fares increases
the BCR slightly, while increasing car costs (through a 50% increase in fuel duty)
pushes the BCR up by 0.5;
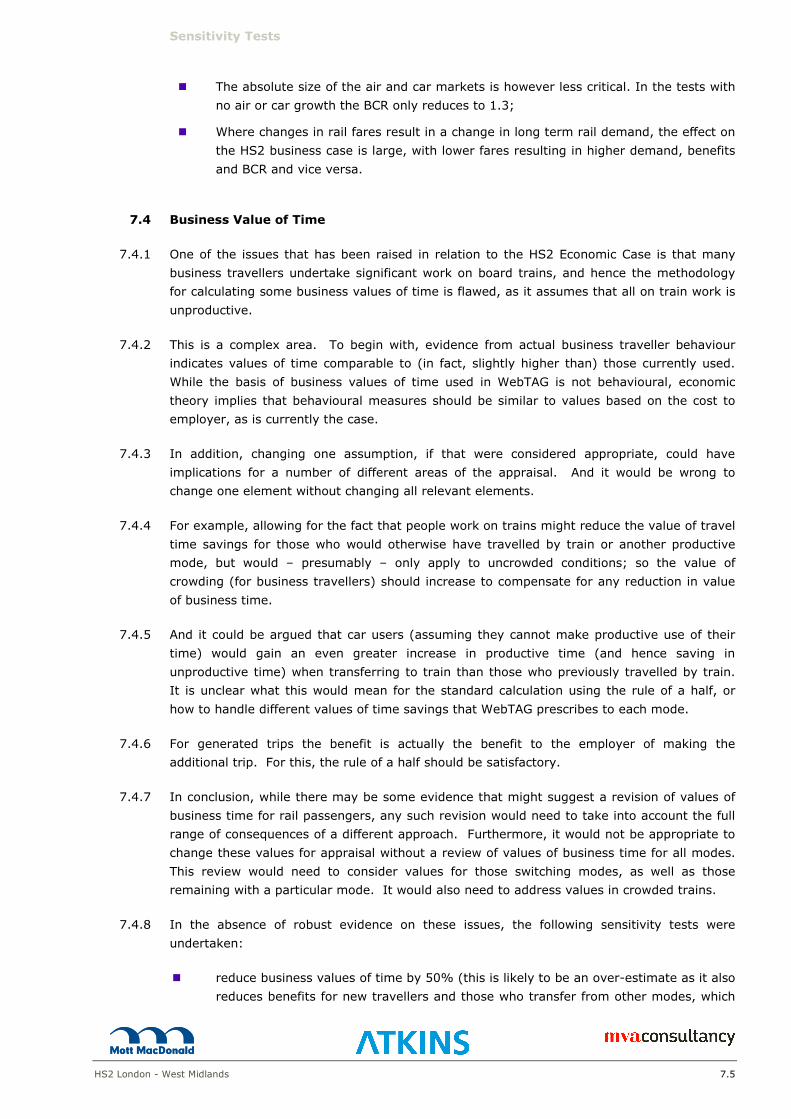
Sensitivity Tests
HS2 London - West Midlands 7.5
� The absolute size of the air and car markets is however less critical. In the tests with
no air or car growth the BCR only reduces to 1.3;
� Where changes in rail fares result in a change in long term rail demand, the effect on
the HS2 business case is large, with lower fares resulting in higher demand, benefits
and BCR and vice versa.
7.4 Business Value of Time
7.4.1 One of the issues that has been raised in relation to the HS2 Economic Case is that many
business travellers undertake significant work on board trains, and hence the methodology
for calculating some business values of time is flawed, as it assumes that all on train work is
unproductive.
7.4.2 This is a complex area. To begin with, evidence from actual business traveller behaviour
indicates values of time comparable to (in fact, slightly higher than) those currently used.
While the basis of business values of time used in WebTAG is not behavioural, economic
theory implies that behavioural measures should be similar to values based on the cost to
employer, as is currently the case.
7.4.3 In addition, changing one assumption, if that were considered appropriate, could have
implications for a number of different areas of the appraisal. And it would be wrong to
change one element without changing all relevant elements.
7.4.4 For example, allowing for the fact that people work on trains might reduce the value of travel
time savings for those who would otherwise have travelled by train or another productive
mode, but would – presumably – only apply to uncrowded conditions; so the value of
crowding (for business travellers) should increase to compensate for any reduction in value
of business time.
7.4.5 And it could be argued that car users (assuming they cannot make productive use of their
time) would gain an even greater increase in productive time (and hence saving in
unproductive time) when transferring to train than those who previously travelled by train.
It is unclear what this would mean for the standard calculation using the rule of a half, or
how to handle different values of time savings that WebTAG prescribes to each mode.
7.4.6 For generated trips the benefit is actually the benefit to the employer of making the
additional trip. For this, the rule of a half should be satisfactory.
7.4.7 In conclusion, while there may be some evidence that might suggest a revision of values of
business time for rail passengers, any such revision would need to take into account the full
range of consequences of a different approach. Furthermore, it would not be appropriate to
change these values for appraisal without a review of values of business time for all modes.
This review would need to consider values for those switching modes, as well as those
remaining with a particular mode. It would also need to address values in crowded trains.
7.4.8 In the absence of robust evidence on these issues, the following sensitivity tests were
undertaken:
� reduce business values of time by 50% (this is likely to be an over-estimate as it also
reduces benefits for new travellers and those who transfer from other modes, which

Sensitivity Tests
HS2 London - West Midlands 7.6
are unlikely to be overstated) and adjust crowding penalties to reflect PDFH values
for business travellers;
� estimate the full value of business time savings from diverting passengers to rail
from other modes (and in addition adjusting crowding penalties, as in the first test).
Table 7.3 Summary of Business Value of Time sensitivity tests
Test Socio-
economic
benefits
Revenue BCR
excl WEI
Central case 19,000 13,900 1.41
Half business VoT 17,700 13,900 1.31
Full effect business VoT 19,200 13,900 1.42
7.4.9 The conclusions of the sensitivity tests are:
� halving business VoT alone would have a significant effect on the benefit levels of
HS2, but this is to a large extent offset when crowding values are also adjusted to
reflect potential impacts on productivity;
� however, when the full effect of diverting passengers onto other modes is also taken
into account, there is little overall impact on BCR.
7.5 Conclusions
7.5.1 In considering the impact of different rates and levels of growth, it is evident that the main
driver of benefits and revenue, and hence the performance of the scheme overall, is the level
at which demand is capped, rather than its rate of growth. This is because unless the rate of
growth is substantially slowed down, demand saturates well before the end of the 60-year
appraisal period, and the benefits and revenue will be unchanged for most of the appraisal
period (albeit during the most heavily-discounted years).
7.5.2 Generally, most other impacts that affect growth rates tend to be secondary. For example, if
one assumes that that lower fares growth leads will lead demand to grow faster, but saturate
at the same level, then the BCR reduces, because the additional benefits are offset by a loss
in revenue. If, however, demand is assumed to saturate at a higher level and in the same
year as the central case, the BCR is considerably improved.
7.5.3 The issues around Business Value of Time are quite complex. Assuming business users’ time
on train is used productively reduces benefits for users who would have travelled by rail
anyway, but it important to consider the benefits to those who previously could not make
productive use of their travel time, such as those travelling in crowded conditions or by other
modes such as car.

HS2 London - West Midlands A1
Appendix A HS2 and Released Capacity Service Specification
The Phase 1 released capacity specification includes changes to London Midland, and West
Coast services. For all other train operating companies (TOCs) services remain as in the Do
Minimum. Future year Do Minimum service summary for those TOCs subject to optimisation
in either the Day1 or Y network scenarios are included in Table A1. Released capacity
changes to the Phase 1 network are shown in Table A2. With the exception of services
between Euston-Chester/ North Wales and between Birmingham New Street – Glasgow /
Edinburgh (and reverse) which are assumed to remain in place with HS2, all West Coast
services are replaced with the specification contained in Table A2. All London Midland
services are replaced with the specification included in Table A2.
The Extension to Manchester and Leeds (Y network) includes additional changes to Midland
Mainline, Cross Country and East Coast Main Line along with further refinements to West
Coast Main Line services. Released capacity on London Midland and Central Trains services
remains as Day1c released capacity. All other TOCs remain as in the Do Minimum. Released
capacity changes for the Y network are shown in Table A3. All Midland Mainline services
have been replaced with the specification included in Table A3, except for services between
St Pancras and Corby / Melton Mowbray. All East Coast services have been replaced with the
specification included in Table A1.3. Cross Country services are truncated at Newcastle due
to the enhanced services to Scotland that run on the WCML.
For the Y network, an initial view was developed on the possible changes to services across
the WCML, MML and ECML. This view was the best available at the time when assumptions
on modelling had to be finalised. However substantial further work has been conducted in
parallel to the work reported in this document. This parallel work has indicated there are
several opportunities to improve the service specification modelled here, offering further
benefits and improving connectivity between different locations, particularly for shorter
distance trips. Work will continue on refining the service pattern for both released capacity
and HS2 services for HS2 Ltd’s as part of the continuing development of proposals for the Y
network.
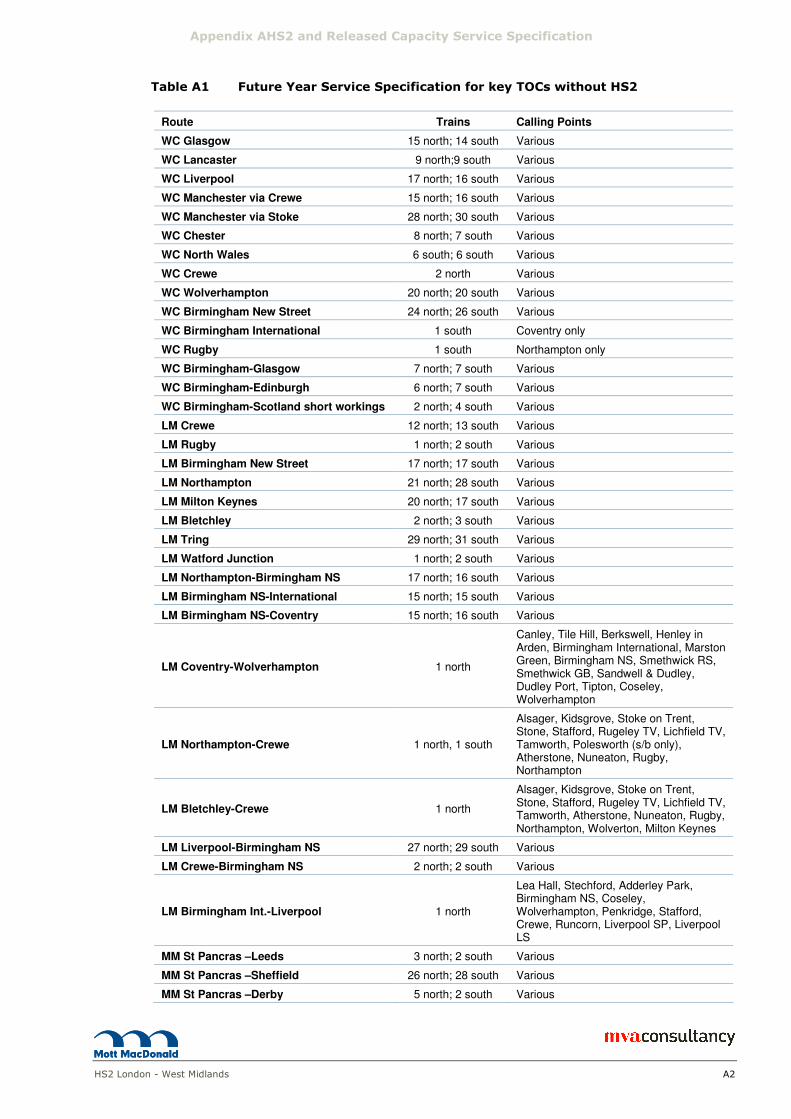
Appendix AHS2 and Released Capacity Service Specification
HS2 London - West Midlands A2
Table A1 Future Year Service Specification for key TOCs without HS2
Route Trains Calling Points
WC Glasgow 15 north; 14 south Various
WC Lancaster 9 north;9 south Various
WC Liverpool 17 north; 16 south Various
WC Manchester via Crewe 15 north; 16 south Various
WC Manchester via Stoke 28 north; 30 south Various
WC Chester 8 north; 7 south Various
WC North Wales 6 south; 6 south Various
WC Crewe 2 north Various
WC Wolverhampton 20 north; 20 south Various
WC Birmingham New Street 24 north; 26 south Various
WC Birmingham International 1 south Coventry only
WC Rugby 1 south Northampton only
WC Birmingham-Glasgow 7 north; 7 south Various
WC Birmingham-Edinburgh 6 north; 7 south Various
WC Birmingham-Scotland short workings 2 north; 4 south Various
LM Crewe 12 north; 13 south Various
LM Rugby 1 north; 2 south Various
LM Birmingham New Street 17 north; 17 south Various
LM Northampton 21 north; 28 south Various
LM Milton Keynes 20 north; 17 south Various
LM Bletchley 2 north; 3 south Various
LM Tring 29 north; 31 south Various
LM Watford Junction 1 north; 2 south Various
LM Northampton-Birmingham NS 17 north; 16 south Various
LM Birmingham NS-International 15 north; 15 south Various
LM Birmingham NS-Coventry 15 north; 16 south Various
LM Coventry-Wolverhampton 1 north
Canley, Tile Hill, Berkswell, Henley in Arden, Birmingham International, Marston Green, Birmingham NS, Smethwick RS, Smethwick GB, Sandwell & Dudley, Dudley Port, Tipton, Coseley, Wolverhampton
LM Northampton-Crewe 1 north, 1 south
Alsager, Kidsgrove, Stoke on Trent, Stone, Stafford, Rugeley TV, Lichfield TV, Tamworth, Polesworth (s/b only), Atherstone, Nuneaton, Rugby, Northampton
LM Bletchley-Crewe 1 north
Alsager, Kidsgrove, Stoke on Trent, Stone, Stafford, Rugeley TV, Lichfield TV, Tamworth, Atherstone, Nuneaton, Rugby, Northampton, Wolverton, Milton Keynes
LM Liverpool-Birmingham NS 27 north; 29 south Various
LM Crewe-Birmingham NS 2 north; 2 south Various
LM Birmingham Int.-Liverpool 1 north
Lea Hall, Stechford, Adderley Park, Birmingham NS, Coseley, Wolverhampton, Penkridge, Stafford, Crewe, Runcorn, Liverpool SP, Liverpool LS
MM St Pancras –Leeds 3 north; 2 south Various
MM St Pancras –Sheffield 26 north; 28 south Various
MM St Pancras –Derby 5 north; 2 south Various

Appendix A HS2 and Released Capacity Service Specification
HS2 London - West Midlands A3
MM St Pancras –Nottingham 27 north; 28 south Various
MM St Pancras – Lincoln 1 north; 1 south Varies by direction
MM St Pancras –Melton Mowbray 1 north Luton, Bedford, Wellingborough, Kettering, Oakham
MM St Pancras –Corby 12 north; 12 south Various
EC Inverness 1 north; 1 south York, Newcastle, Berwick, Edinburgh, Falkirk, Stirling, Perth, Inverness
EC Aberdeen 3 north; 3 south Various
EC Dundee 1 south Kirkcaldy, Edinburgh, Berwick, Newcastle, York, Kings Cross
EC Glasgow 1 north; 1 south Varies by direction
EC Edinburgh 21 north; 20 south Various
EC Berwick upon Tweed 1 south
Alnmouth, Morpeth, Newcastle, Durham, Darlington, Northallerton, York, Doncaster, Retford, Newark, Grantham, Peterborough, Kings Cross
EC Newcastle 16 north; 17 south Various
EC York 1 north Stevenage, Peterborough, Grantham, Newark, Retford, Doncaster, York
EC Skipton 1 south Shipley, Leeds, Wakefield, Doncaster, Peterborough, Stevenage, Kings Cross
EC Harrogate 2 south Leeds, Wakefield, Doncaster, Peterborough, Stevenage, Kings Cross
EC Bradford 1 north; 1 south Shipley, Leeds, Wakefield, Doncaster, Peterborough, Kings Cross
EC Leeds 43 north; 41 south Various
EC Lincoln 1 north; 1 south Newark, Grantham (s/bnd only), Peterborough, Kings Cross
EC Peterborough 1 south Fast to Kings Cross
EC Short Workings 5 north; 1 south Various

Appendix AHS2 and Released Capacity Service Specification
HS2 London - West Midlands A4
Table A2 Future Year Service Specification for TOCs with service changes
with HS2 Day 1 London to West Midlands
Route Trains Calling Points
WC Euston - Liverpool 16 both
directions
Watford Junction, Milton Keynes Central, Rugby, Coventry, Birmingham International, Birmingham New Street, Sandwell and Dudley, Wolverhampton, Stafford, Crewe, Runcorn, Liverpool South Parkway, Liverpool Lime Street
WC Euston – Glasgow 15 north; 14 south;
Milton Keynes Central, Crewe, Wigan North Western, Preston, Lancaster, Oxenholme, Penrith, Carlisle, Glasgow Central
WC Euston – Crewe 19 both
directions Milton Keynes Central, Rugby, Nuneaton, Tamworth, Lichfield Trent Valley, Crewe
WC Euston – Manchester 19 both
directions Milton Keynes Central, Stoke on Trent, Macclesfield, Stockport, Manchester Piccadilly
LM Euston – Tring 26 both
directions
Wembley Central, Harrow and Wealdstone, Bushey, Watford Junction, Kings Langley, Apsley, Hemel Hempstead, Berkhamsted, Tring
LM Euston – Tring 6 both
directions Watford Junction, Kings Langley, Apsley, Hemel Hempstead, Berkhamsted, Tring
LM Euston – Milton Keynes 32 both
directions Watford Junction, Hemel Hempstead, Berkhamsted, Tring, Cheddington, Leighton Buzzard, Bletchley, Milton Keynes Central
LM Euston – Birmingham 32 both
directions
Watford Junction, Leighton Buzzard, Bletchley, Milton Keynes Central, Wolverton, Northampton, Long Buckby, Rugby, Coventry, Birmingham International, Birmingham New Street
LM Euston – Birmingham 16 both
directions
Milton Keynes Central, Rugby, Coventry, Canley, Tile Hill, Berkswell, Hampton in Arden, Birmingham International, Birmingham New Street
LM Euston – Walsall 16 both
directions Watford Junction, Milton Keynes Central, Rugby, Coventry, Birmingham International, Birmingham New Street
LM Euston – Rugby 5 both
directions Watford Junction, Milton Keynes Central, Northampton, Rugby
LM Euston – Crewe 5 both
directions
Watford Junction, Milton Keynes Central, Northampton, Rugby, Nuneaton, Atherstone, Polesworth, Tamworth, Lichfield Trent Valley, Rugeley Trent Valley, Stafford, Stone, Stoke on Trent, Kidsgrove, Alsager, Crewe
LM Birmingham NS – Birmingham International
16 both directions
Adderley Park, Stechford, Lea Hall, Marston Green, Birmingham International
LM Birmingham NS – Birmingham International
16 both directions
Stechford, Lea Hall, Marston Green, Birmingham International
LM Birmingham NS – Coventry
16 both directions
Marston Green, Birmingham International, Hampton in Arden, Berkswell, Tile Hill, Canley, Coventry
LM Birmingham NS – Coventry
16 both directions
Birmingham International, Hampton in Arden, Berkswell, Tile Hill, Canley, Coventry
LM Liverpool – Birmingham NS
16 both directions
Liverpool South Parkway, Runcorn, Acton Bridge, Hartford, Winsford, Crewe, Stafford, Penkridge, Wolverhampton, Smethwick Galton Bridge, Birmingham New Street

Appendix AHS2 and Released Capacity Service Specification
HS2 London - West Midlands A5
Table A3 Future Year Service Specification for TOCs with service changes
with HS2 Extension to Manchester and Leeds
Route Trains Calling Points
WC Euston - Liverpool 16 both
directions
Watford Junction, Milton Keynes Central, Rugby, Coventry, Birmingham International, Birmingham New Street, Sandwell and Dudley, Wolverhampton, Stafford, Crewe, Runcorn, Liverpool South Parkway, Liverpool Lime Street
WC Euston – Glasgow 15 north; 14 south;
Milton Keynes Central, Crewe, Wigan North Western, Preston, Lancaster, Oxenholme, Penrith, Carlisle, Glasgow Central
WC Euston – Crewe 19 both
directions Milton Keynes Central, Rugby, Nuneaton, Tamworth, Lichfield Trent Valley, Crewe
WC Euston – Manchester 19 both
directions Milton Keynes Central, Stoke on Trent, Macclesfield, Stockport, Manchester Piccadilly
LM Euston – Tring 26 both
directions
Wembley Central, Harrow and Wealdstone, Bushey, Watford Junction, Kings Langley, Apsley, Hemel Hempstead, Berkhamsted, Tring
LM Euston – Tring 6 both
directions Watford Junction, Kings Langley, Apsley, Hemel Hempstead, Berkhamsted, Tring
LM Euston – Milton Keynes 32 both
directions Watford Junction, Hemel Hempstead, Berkhamsted, Tring, Cheddington, Leighton Buzzard, Bletchley, Milton Keynes Central
LM Euston – Birmingham 32 both
directions
Watford Junction, Leighton Buzzard, Bletchley, Milton Keynes Central, Wolverton, Northampton, Long Buckby, Rugby, Coventry, Birmingham International, Birmingham New Street
LM Euston – Birmingham 16 both
directions
Milton Keynes Central, Rugby, Coventry, Canley, Tile Hill, Berkswell, Hampton in Arden, Birmingham International, Birmingham New Street
LM Euston – Walsall 16 both
directions Watford Junction, Milton Keynes Central, Rugby, Coventry, Birmingham International, Birmingham New Street
LM Euston – Rugby 5 both
directions Watford Junction, Milton Keynes Central, Northampton, Rugby
LM Euston – Crewe 5 both
directions
Watford Junction, Milton Keynes Central, Northampton, Rugby, Nuneaton, Atherstone, Polesworth, Tamworth, Lichfield Trent Valley, Rugeley Trent Valley, Stafford, Stone, Stoke on Trent, Kidsgrove, Alsager, Crewe
LM Birmingham NS – Birmingham International
16 both directions
Adderley Park, Stechford, Lea Hall, Marston Green, Birmingham International
LM Birmingham NS – Birmingham International
16 both directions
Stechford, Lea Hall, Marston Green, Birmingham International
LM Birmingham NS – Coventry
16 both directions
Marston Green, Birmingham International, Hampton in Arden, Berkswell, Tile Hill, Canley, Coventry
LM Birmingham NS – Coventry
16 both directions
Birmingham International, Hampton in Arden, Berkswell, Tile Hill, Canley, Coventry
LM Liverpool – Birmingham NS
16 both directions
Liverpool South Parkway, Runcorn, Acton Bridge, Hartford, Winsford, Crewe, Stafford, Penkridge, Wolverhampton, Smethwick Galton Bridge, Birmingham New Street
MM St Pancras – Derby 16 both
directions Luton Airport Parkway, Bedford, Wellingborough, Kettering, Market Harborough, Leicester, Loughborough, Derby
MM St Pancras – Nottingham
15 north; 14 south
Market Harborough, Leicester, Loughborough, Beeston, Nottingham
MM St Pancras – Sheffield 13 north; 14 south
Leicester, Loughborough, Long Eaton, Derby, Chesterfield, Sheffield
MM St Pancras – Leeds 3 north; 2 south
Leicester, Loughborough, Long Eaton, Derby, Chesterfield, Sheffield, Doncaster, Wakefield Westgate, Leeds
MM Sheffield – St Pancras 1 south Chesterfield, Alfreton, Langley Mill, Nottingham, Beeston, Loughborough, Leicester, Market Harborough, St Pancras
MM St Pancras – Lincoln 1 both
directions Market Harborough, Leicester, Loughborough, Beeston, Nottingham, Lincoln
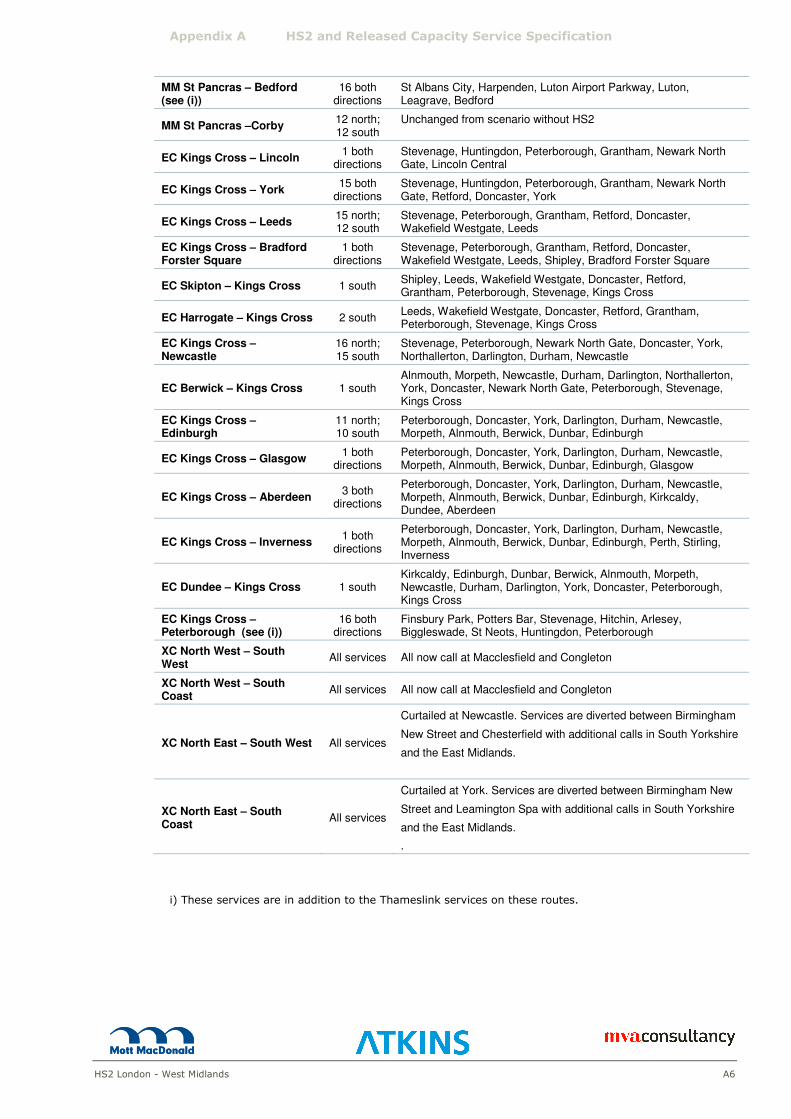
Appendix A HS2 and Released Capacity Service Specification
HS2 London - West Midlands A6
MM St Pancras – Bedford (see (i))
16 both directions
St Albans City, Harpenden, Luton Airport Parkway, Luton, Leagrave, Bedford
MM St Pancras –Corby 12 north; 12 south
Unchanged from scenario without HS2
EC Kings Cross – Lincoln 1 both
directions Stevenage, Huntingdon, Peterborough, Grantham, Newark North Gate, Lincoln Central
EC Kings Cross – York 15 both
directions Stevenage, Huntingdon, Peterborough, Grantham, Newark North Gate, Retford, Doncaster, York
EC Kings Cross – Leeds 15 north; 12 south
Stevenage, Peterborough, Grantham, Retford, Doncaster, Wakefield Westgate, Leeds
EC Kings Cross – Bradford Forster Square
1 both directions
Stevenage, Peterborough, Grantham, Retford, Doncaster, Wakefield Westgate, Leeds, Shipley, Bradford Forster Square
EC Skipton – Kings Cross 1 south Shipley, Leeds, Wakefield Westgate, Doncaster, Retford, Grantham, Peterborough, Stevenage, Kings Cross
EC Harrogate – Kings Cross 2 south Leeds, Wakefield Westgate, Doncaster, Retford, Grantham, Peterborough, Stevenage, Kings Cross
EC Kings Cross – Newcastle
16 north; 15 south
Stevenage, Peterborough, Newark North Gate, Doncaster, York, Northallerton, Darlington, Durham, Newcastle
EC Berwick – Kings Cross 1 south Alnmouth, Morpeth, Newcastle, Durham, Darlington, Northallerton, York, Doncaster, Newark North Gate, Peterborough, Stevenage, Kings Cross
EC Kings Cross – Edinburgh
11 north; 10 south
Peterborough, Doncaster, York, Darlington, Durham, Newcastle, Morpeth, Alnmouth, Berwick, Dunbar, Edinburgh
EC Kings Cross – Glasgow 1 both
directions Peterborough, Doncaster, York, Darlington, Durham, Newcastle, Morpeth, Alnmouth, Berwick, Dunbar, Edinburgh, Glasgow
EC Kings Cross – Aberdeen 3 both
directions
Peterborough, Doncaster, York, Darlington, Durham, Newcastle, Morpeth, Alnmouth, Berwick, Dunbar, Edinburgh, Kirkcaldy, Dundee, Aberdeen
EC Kings Cross – Inverness 1 both
directions
Peterborough, Doncaster, York, Darlington, Durham, Newcastle, Morpeth, Alnmouth, Berwick, Dunbar, Edinburgh, Perth, Stirling, Inverness
EC Dundee – Kings Cross 1 south Kirkcaldy, Edinburgh, Dunbar, Berwick, Alnmouth, Morpeth, Newcastle, Durham, Darlington, York, Doncaster, Peterborough, Kings Cross
EC Kings Cross – Peterborough (see (i))
16 both directions
Finsbury Park, Potters Bar, Stevenage, Hitchin, Arlesey, Biggleswade, St Neots, Huntingdon, Peterborough
XC North West – South West
All services All now call at Macclesfield and Congleton
XC North West – South Coast
All services All now call at Macclesfield and Congleton
XC North East – South West All services
Curtailed at Newcastle. Services are diverted between Birmingham
New Street and Chesterfield with additional calls in South Yorkshire
and the East Midlands.
XC North East – South Coast
All services
Curtailed at York. Services are diverted between Birmingham New
Street and Leamington Spa with additional calls in South Yorkshire
and the East Midlands.
.
i) These services are in addition to the Thameslink services on these routes.

MVA Consultancy provides advice on transport, to central, regional and local
government, agencies, developers, operators and financiers.
A diverse group of results-oriented people, we are part of a strong team of
professionals worldwide. Through client business planning, customer research
and strategy development we create solutions that work for real people in the
real world.
For more information visit www.mvaconsultancy.com
Email: [email protected]
Offices also in
Bangkok, Beijing, Hong Kong, Shenzhen and Singapore
Abu Dhabi
AS Business Centre, Suite 201, Al Ain Road, Umm al
Nar, P.O. Box 129865, Abu Dhabi, UAE
T: +971 2 510 2402 F: +971 2 510 2403
Birmingham
Second Floor, 37a Waterloo Street
Birmingham B2 5TJ United Kingdom
T: +44 (0)121 233 7680 F: +44 (0)121 233 7681
Dublin
First Floor, 12/13 Exchange Place
Custom House Docks, IFSC, Dublin 1, Ireland
T: +353 (0)1 542 6000 F: +353 (0)1 542 6001
Edinburgh
Second Floor, Prospect House, 5 Thistle Street,
Edinburgh EH2 1DF United Kingdom
T: +44 (0)131 220 6966 F: +44 (0)131 220 6087
Glasgow
Seventh Floor, 78 St Vincent Street
Glasgow G2 5UB United Kingdom
T: +44 (0)141 225 4400 F: +44 (0)141 225 4401
London
Seventh Floor, 15 Old Bailey
London EC4M 7EF United Kingdom
T: +44 (0)20 3427 6273 F: +44 (0)20 3427 6274
Lyon
11, rue de la République, 69001 Lyon, France
T: +33 (0)4 72 10 29 29 F: +33 (0)4 72 10 29 28
Manchester
25th Floor, City Tower, Piccadilly Plaza
Manchester M1 4BT United Kingdom
T: +44 (0)161 236 0282 F: +44 (0)161 236 0095
Marseille
76, rue de la République, 13002 Marseille, France
T: +33 (0)4 91 37 35 15 F: +33 (0)4 91 91 90 14
Paris
12-14, rue Jules César, 75012 Paris, France
T: +33 (0)1 53 17 36 00 F: +33 (0)1 53 17 36 01
Woking
Dukes Court, Duke Street, Woking
Surrey GU21 5BH United Kingdom
T: +44 (0)1483 728051 F: +44 (0)1483 755207
Top Related