


Languages
Pages
Legal


High Frequency Price Movement Strategy
Adam, Hujia, Samuel, Jorge

Overview
Deep Learning Strategy
● RNN Overview● Feature and Label Generation● Model Formation● Strategy● Results
Statistical Arbitrage Strategy
● Statistical Arbitrage Overview● Finding Correlated Pairs● Stochastic Control● Parameter Tuning● Results
Conclusion ● Future Work

RNN Strategy
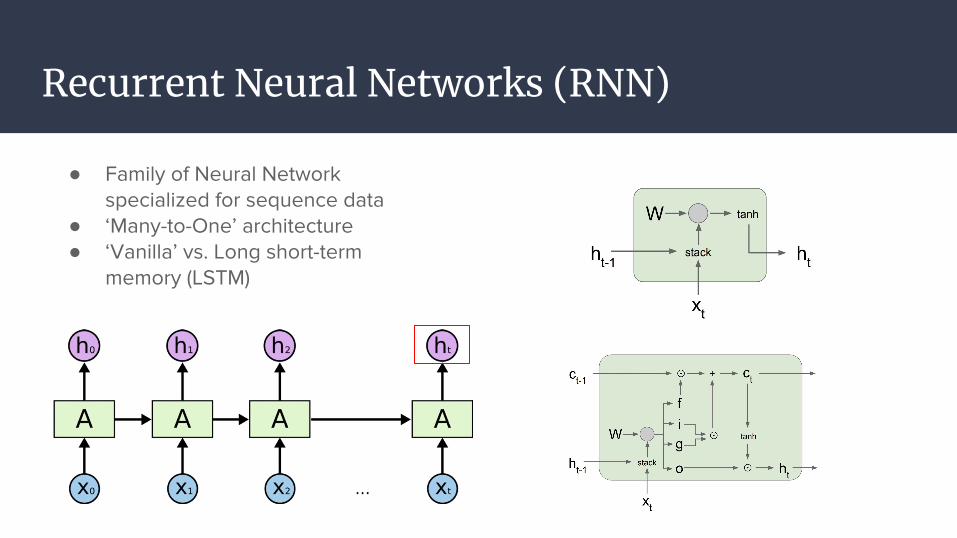
Recurrent Neural Networks (RNN)
● Family of Neural Network specialized for sequence data
● ‘Many-to-One’ architecture ● ‘Vanilla’ vs. Long short-term
memory (LSTM)

RNN: Feature and Label Generation
Features
● Bid/Ask Prices and Spread (10 levels)● Volumes (10 levels)● Mean Prices and Volumes● Accumulated Price and Volume
Differences● Price and Volume Changes● Order Imbalance Changes● VWAP
Labels (Classification & Regression)
● Mid-Price Movement● Volume Weighted Average Price (VWAP)
Movement● Settled on classifying VWAP movement
over the next time ‘window’

RNN: Model Formation
● Cost Function: Weighted Cross Entropy ○ Helps solve challenge of having an
imbalanced dataset● Output: Softmax Layer
○ Outputs a predicted probability for each label
● Unit: LSTM○ Long short-term memory (LSTM) units
to model longer term dependencies
● Hyperparameters:○ Number of Units○ Prediction Window for Label○ Trade Probability Cutoff○ Cross Entropy Weights○ Other (e.g. Learning Rate,
Dropout)

RNN: Strategy

RNN: Results and Next Steps
● The Good:○ Profitable for majority of stocks on the test set○ Generally steady profits throughout day○ Results consistent with baseline
● The Bad:○ Traded at the mid-price! ○ Couldn’t use Thesys backtester○ Scalability
● Next Steps:○ Incorporate magnitude of movement○ Regularization○ Different ML Models
MSFT NVDA TXN CSCO QCOM
47.6% 53.7% 53.9% 51.5% 54.6%
Single Day Chart
Execution Accuracy (Entire Test Set)

Statistical Arbitrage Strategy

Baseline model: Pairs trading with Avellaneda-Lee
● Linearly regress the mid-price returns of a pair of historically correlated stocks
● Fit the residuals to a OU-process (using AR(1) model)
● Mispricing (and execution) if the last observation is far from the equilibrium
|S-score| = |(r_100 - mean(OU))/standard_deviation(OU)| > threshold
:

Example of execution process

What’s New?
● Identifying most correlated pairs to trade
● Stochastic control to incorporate dynamically optimal thresholds
● Hyperparameter tuning (frequency, training size, leverage, etc.)
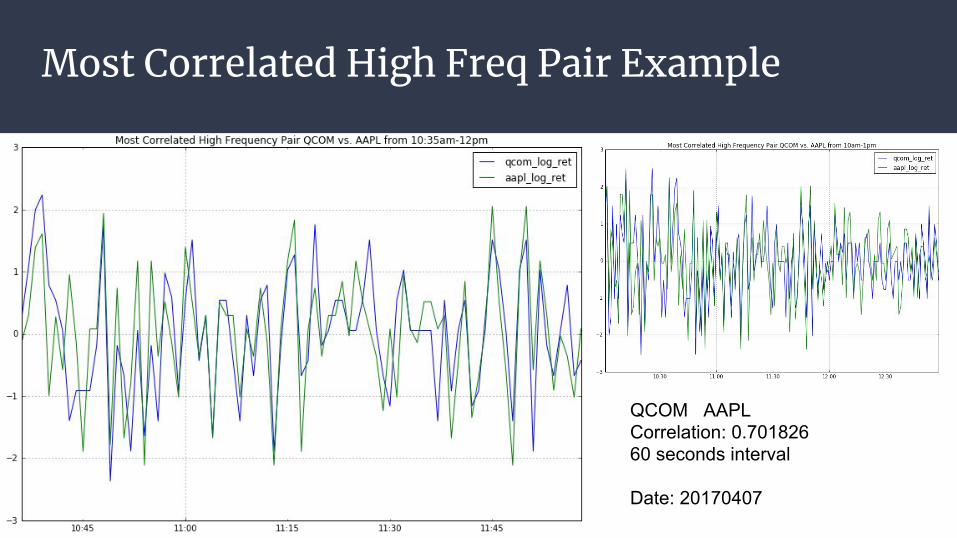
Most Correlated High Freq Pair Example
QCOM AAPLCorrelation: 0.70182660 seconds interval
Date: 20170407

Most Correlated Pair for a 1-day Window.
Table 1. Most Correlated Pair for a 1-day Window for Different Time Intervals.
● Note that the most correlated pair is different for different time intervals.

Stochastic control (Cartea-Jaimungal-Peñalva)
● Motivation: Now fixed, ad-hoc thresholds, requiring calibration
● Idea: choose automatically and dynamically the best thresholds
● Technique: stochastic control (i.e. maximize the expected utility of the strategy)
Criteria for exiting a long/short position
Criteria for entering the position

Stochastic control (2)
● Optimal times are given by thresholds depending on the OU parameters (so dynamic
and automatically computable)
● They are found by solving Hamilton-Jacobi-Bellman variational inequalities

Stochastic control (3)
● Numerically difficult problem, computational issues
● Depends on the calibration method, the utility function, and the numerical methods

Parameter tuning
● Different environment than Avellaneda-Lee● 4 - 5 parameters plus stock picking
○ Thresholds for trading○ Time length for returns○ Training size○ Urgency parameter for stochastic control○ Pairs to trade

Parameter tuning
Two approaches to parameter tuning:
● Grid search○ Systematic exploration○ Enables for sensitivity analysis○ Inefficient
● Random search○ Black-box method○ Explore larger subspace

Parameter tuning
● Highly sensitive to changes in parameter values
Training size of 100 Training size of 150

Validation set
● Evaluation metric - dollar per trade● Evaluated 4 models
a. Fixed thresholds, pairs picked by performanceb. Fixed thresholds, pairs picked by correlationc. Stochastic control thresholds, pairs picked by performanced. Stochastic control thresholds, pairs picked by correlation
● Model a. performed best on validation set

Test set results
Inconclusive results

Pairs Trading - Unstable Correlation for High Freq Pairs
Conclusion:1. Most correlated pairs differ by time intervals.2. Correlation for same pair changes by time intervals.3. No pattern in correlation over different days.
Table 1. Most Correlated Pair for a 1-day Window.
Table 2. Correlation between QCOM AAPL for a 1-day window from different time intervals.
Figure 1. Correlation for same pair for 20-day Window.

Incorporating PCA - Eigenportfolio
Figure 2 (Left). First eigenvector sorted by coefficient size from top 25 market cap tech stocks for 10 seconds interval. (Right) Eigenvalues of this pool of stocks for 10 seconds.

Future Work
● To trade based on factors from PCA eigenportfolio and its eigenvalues:○ take a variable number of eigenvectors, truncate to explain a given percentage
of the total variance of the system
● Implement a more dynamic strategy○ Using the correlation from yesterday to decide which pairs to trade today. ○ Or observe the market for a couple of hours and then start trading based on
earlier correlation

Thank you!Questions?

References
[1] Avellaneda, M., & Lee, J. H. (2010). Statistical Arbitrage in the US Equities Market. Quantitative Finance, 10(7), p.761-782.
[2] Cartea, A., Jaimungal, S., and Peñalva, J. (2015). Algorithmic and high frequency trading. Cambridge University Press, chapter 11.
[3] Kercheval, A. and Zhang, Y. Modeling high-frequency limit order book dynamics with support vector machines. University of Florida, 2013
Top Related