High Frequency Price Movement Strategy Adam, Hujia, …Stochastic control...
27
High Frequency Price Movement Strategy Adam, Hujia, Samuel, Jorge
Transcript of High Frequency Price Movement Strategy Adam, Hujia, …Stochastic control...

High Frequency Price Movement Strategy
Adam, Hujia, Samuel, Jorge

Overview
Deep Learning Strategy
● RNN Overview● Feature and Label Generation● Model Formation● Strategy● Results
Statistical Arbitrage Strategy
● Statistical Arbitrage Overview● Finding Correlated Pairs● Stochastic Control● Parameter Tuning● Results
Conclusion ● Future Work

RNN Strategy
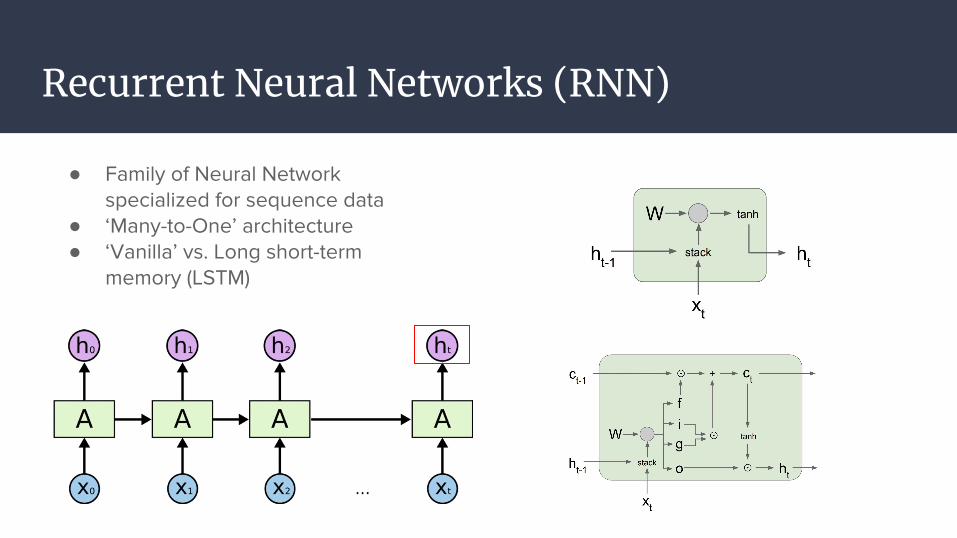
Recurrent Neural Networks (RNN)
● Family of Neural Network specialized for sequence data
● ‘Many-to-One’ architecture ● ‘Vanilla’ vs. Long short-term
memory (LSTM)

RNN: Feature and Label Generation
Features
● Bid/Ask Prices and Spread (10 levels)● Volumes (10 levels)● Mean Prices and Volumes● Accumulated Price and Volume
Differences● Price and Volume Changes● Order Imbalance Changes● VWAP
Labels (Classification & Regression)
● Mid-Price Movement● Volume Weighted Average Price (VWAP)
Movement● Settled on classifying VWAP movement
over the next time ‘window’

RNN: Model Formation
● Cost Function: Weighted Cross Entropy ○ Helps solve challenge of having an
imbalanced dataset● Output: Softmax Layer
○ Outputs a predicted probability for each label
● Unit: LSTM○ Long short-term memory (LSTM) units
to model longer term dependencies
● Hyperparameters:○ Number of Units○ Prediction Window for Label○ Trade Probability Cutoff○ Cross Entropy Weights○ Other (e.g. Learning Rate,
Dropout)

RNN: Strategy

RNN: Results and Next Steps
● The Good:○ Profitable for majority of stocks on the test set○ Generally steady profits throughout day○ Results consistent with baseline
● The Bad:○ Traded at the mid-price! ○ Couldn’t use Thesys backtester○ Scalability
● Next Steps:○ Incorporate magnitude of movement○ Regularization○ Different ML Models
MSFT NVDA TXN CSCO QCOM
47.6% 53.7% 53.9% 51.5% 54.6%
Single Day Chart
Execution Accuracy (Entire Test Set)

Statistical Arbitrage Strategy

Baseline model: Pairs trading with Avellaneda-Lee
● Linearly regress the mid-price returns of a pair of historically correlated stocks
● Fit the residuals to a OU-process (using AR(1) model)
● Mispricing (and execution) if the last observation is far from the equilibrium
|S-score| = |(r_100 - mean(OU))/standard_deviation(OU)| > threshold
:

Example of execution process

What’s New?
● Identifying most correlated pairs to trade
● Stochastic control to incorporate dynamically optimal thresholds
● Hyperparameter tuning (frequency, training size, leverage, etc.)
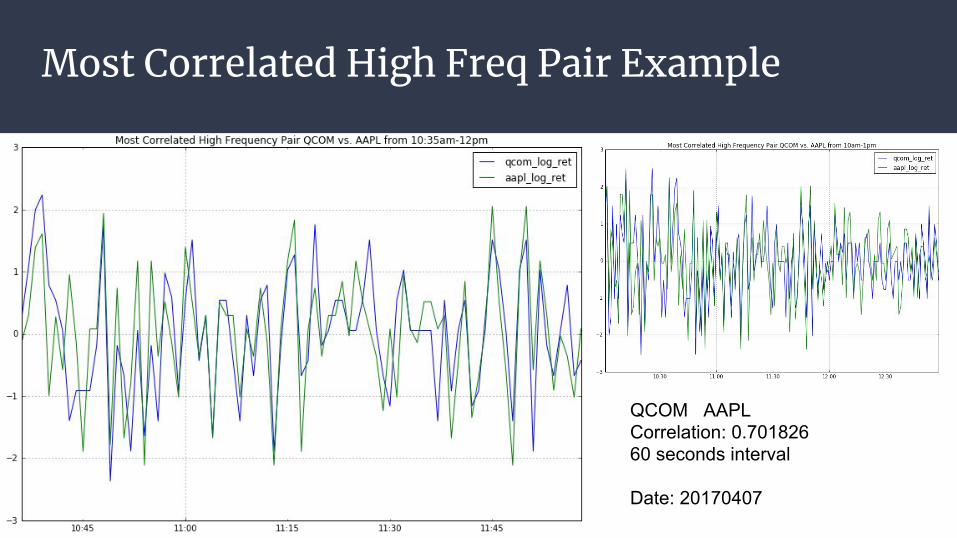
Most Correlated High Freq Pair Example
QCOM AAPLCorrelation: 0.70182660 seconds interval
Date: 20170407

Most Correlated Pair for a 1-day Window.
Table 1. Most Correlated Pair for a 1-day Window for Different Time Intervals.
● Note that the most correlated pair is different for different time intervals.

Stochastic control (Cartea-Jaimungal-Peñalva)
● Motivation: Now fixed, ad-hoc thresholds, requiring calibration
● Idea: choose automatically and dynamically the best thresholds
● Technique: stochastic control (i.e. maximize the expected utility of the strategy)
Criteria for exiting a long/short position
Criteria for entering the position

Stochastic control (2)
● Optimal times are given by thresholds depending on the OU parameters (so dynamic
and automatically computable)
● They are found by solving Hamilton-Jacobi-Bellman variational inequalities

Stochastic control (3)
● Numerically difficult problem, computational issues
● Depends on the calibration method, the utility function, and the numerical methods

Parameter tuning
● Different environment than Avellaneda-Lee● 4 - 5 parameters plus stock picking
○ Thresholds for trading○ Time length for returns○ Training size○ Urgency parameter for stochastic control○ Pairs to trade

Parameter tuning
Two approaches to parameter tuning:
● Grid search○ Systematic exploration○ Enables for sensitivity analysis○ Inefficient
● Random search○ Black-box method○ Explore larger subspace

Parameter tuning
● Highly sensitive to changes in parameter values
Training size of 100 Training size of 150

Validation set
● Evaluation metric - dollar per trade● Evaluated 4 models
a. Fixed thresholds, pairs picked by performanceb. Fixed thresholds, pairs picked by correlationc. Stochastic control thresholds, pairs picked by performanced. Stochastic control thresholds, pairs picked by correlation
● Model a. performed best on validation set

Test set results
Inconclusive results

Pairs Trading - Unstable Correlation for High Freq Pairs
Conclusion:1. Most correlated pairs differ by time intervals.2. Correlation for same pair changes by time intervals.3. No pattern in correlation over different days.
Table 1. Most Correlated Pair for a 1-day Window.
Table 2. Correlation between QCOM AAPL for a 1-day window from different time intervals.
Figure 1. Correlation for same pair for 20-day Window.

Incorporating PCA - Eigenportfolio
Figure 2 (Left). First eigenvector sorted by coefficient size from top 25 market cap tech stocks for 10 seconds interval. (Right) Eigenvalues of this pool of stocks for 10 seconds.

Future Work
● To trade based on factors from PCA eigenportfolio and its eigenvalues:○ take a variable number of eigenvectors, truncate to explain a given percentage
of the total variance of the system
● Implement a more dynamic strategy○ Using the correlation from yesterday to decide which pairs to trade today. ○ Or observe the market for a couple of hours and then start trading based on
earlier correlation

Thank you!Questions?

References
[1] Avellaneda, M., & Lee, J. H. (2010). Statistical Arbitrage in the US Equities Market. Quantitative Finance, 10(7), p.761-782.
[2] Cartea, A., Jaimungal, S., and Peñalva, J. (2015). Algorithmic and high frequency trading. Cambridge University Press, chapter 11.
[3] Kercheval, A. and Zhang, Y. Modeling high-frequency limit order book dynamics with support vector machines. University of Florida, 2013