


Languages
Pages
Legal

JOURNAL OF RESEARCH of the National Bureau of Standards- A. Physics and Chemistry Vol. i OA, No. 5. September- October 1972
High Accuracy Spectrophotometry at the National Physical Laboratory
F. J. J. Clarke
National Physical Laboratory, reddington, Middlesex, UK.
(June 5, 1972)
The techniques and equipment used at the National Physical Laboratory (NPL) to achieve high accuracy spectrophotometric measurements are described and discussed. The emphasis at NPL has always been on the determination of systematic components of error and their elimination or correc. tion rather than on the attainment of mere precision, which is largely a matter of variance and resolu. tion. The scales of regular transmittance, diffuse transmittance, total transmittance of scattering samples, regular refl ectance, diffuse reflectance, total reflectance and radiance factor are determined, maintained, and made available in practical form to industry by combined use of a reference NPL manual spectrophotometer and commercial recording spectrophotometers.
The presentation will concentrate on transmittance measurements made with the reference instrument, which is des igned specifically to allow separate investigation of the various possible sources of syste matic error, processes that are not practicable with commercial spectrophotometers. The investigation of the linearity of the complete photoelectronic system has always been a key factor, and double-aperture devices have been used consistently at NPL for over 40 years to monitor the performance of this instrument and its predecessors. Besides instrumentation, the procurement of material standards of suitable quality is a major limitation of the art , and the types in use at NPL are described, including the recently developed Ceramic Colour Standards.
Key words: High accuracy spectrophotometry; photoelectronic linearity; reflectance; transmittance.
I. Introduction
Spectral measurements and techniques in the ultraviolet, visible and infrared regions of the electromagnetic spectrum fall into two general classes. The first involves work aimed at elucidating the physics and chemistry of the electronic, atomic, molecular and phase states of the materials involved, and this is the realn. of the spectroscopist. The second involves work aimed at developing and using measurement techniques for ac~urate quantitative determinations of such properties as emissivity, radiance and radiant intensity of sources, transmittance, reflectance and radiance factor of passive materials , and responsivity of detectors_ This is the realm of the radiometrist , photometrist and colorimetrist, but the techniques used (spectroradiometry and spectrophotometry) are of interest to scientists and technologists in many fields and industries because of their general usefulness. Those who develop the art are a very small minority compared with the users of the techniques and instruments, and are found usually at standardising laboratories and instrument manufacturers.
We may conveniently distinguish between spectroradiometry and spectrophotometry by means of an operational definition: spectroradiometry is concerned
with the spectral properties of sources and detectors, whereas spectrophotometry is concerned with the spectral properties of material specimens. The work in these fields at the National Physical Laboratory (NPL) is currently organized in two Sections along just these lines : spectroradiometry forms part of the work of the Quantitative Spectroscopy Section under E. J. Gillham in Quantum Metrology Division , while ultraviolet, visible and near infrared spectrophotometry forms part of the work of Colorimetry and Photometry Section under myself in Metrology Centre. I regret to say that at present there is no programme of work at NPL on spectrofluorimetric standards, a subject still in its infancy but likely to become increasingly important. However fluorescent materials are measured for reflectance or diffuse transmittance as part of our spectrophotometric work, using either monochromatic illumination with broad-band detection or alternatively broad-band illumination with monochromatic detection, and the excitation and emission spectra can be distinguished from the reflected or transmitted components. Historically, spectrophotometric standards work in the ultraviolet and visible regions at NPL has always been closely integrated with colorimetry, and there is !l very sound
375
reason for this: until relatively recently, the only users of spectrophotometers who really needed limit-of-theart accuracy are those who use the instruments for colorimetric purposes. It was no accident that the colorimetrist Hardy at Massachusetts Institute of Technology (M.LT.) set to work to design and develop the first commercially manufactured automatic recording spectrophotometer (The General Electric! instrument, ref. LIJ) immediately following the establishment of the C.LE. System of Colorimetry in 1931 and its widespread adoption by divers industries. That instrument remained unsurpassed for a great many years.
High accuracy spectrophotometry is needed for colorimetry because the chromaticity discrimination of the normal human observer is so fine that only very few of the instruments on the market can guarantee a commensurate accuracy in the denved colour specification. It many be pertinent to note that the colour industries generally use tristimulus filter colorime ters for differential measurements on production samples of known spectral profile, where speed and precision is more critical than freedom from possible systematic error, whereas spectrophotometers are used with tristimulus computation in cases where the spectral profile is unknown or likely to be variable and in cases where the highest absolute -accuracy is required in colour specIfication. The development in recent years of colorant formulation by instrumental colour matched prediction systems f2, :W nearly always involves spectrophotometers that are as accurate as are available on the commercial market and can be afforded by the firm involved.
The largest class of usage of spectrophotometers is by chemists, and except where their interests have been colorimetric, their demands have usually been f~r. convenience, reliability, reproducibility and preCISIOn rather than for accuracy, for their uses are often diagnostic rather than critically quantitative. In cases where they have used spectrophotometric methods for determining concentrations, they have generally worked relative to standardised solutions and have not worried too much about the absolute accuracy of the optical density (absorbance) scales of their instruments. However, this situation is changing, and an increasing number of chemical and clinical applications are arising where high absolute accuracy is needed. Of the contributors to this Symposium, R. Mavrodineanu is probably best qualified to deal with these matters, and I will not myself comment further.
II. The General Nature of Errors and Accuracy in Spectrophotometry
Before considering in detail the methods of s pectrophotometry and the equipment used at NPL, it is
1 In orde r to ~deq~ately descri~e materials and experimenta l procedures, it was occasionall y necessary to Identify commercial products by manufacture r s name or label. In no in stances does such identification imply endorsement by the National Bureau of Standard s. nor does it imply that the particular product or equipment is necessarily the best available f~r that purpose. 2 Figures in brackets indicate the literature references at the end of this paper.
necessary to explain just what the term "high accuracy" can mean in this subject. It can mean several things: for instance one can distinguish between high quality commercial instruments and lower quality ones, and can say that by normal industrial and university laboratory criteria, high accuracy spectrophotometry is achieved when careful and competent staff. are using a high quality instrument that is properly servIced when needed by the manufacturer or his agent. This approach may be embellished by ownership of several different designs of good quality instrument and the taking of an average of results from them or even some weighted mean where the weighting depends on inspiration, prejudic~ or perhaps experience of their past history of divergences from the mean. However, such an approach is not acceptable for a standardising laboratory, or indeed any laboratory that aspires to making a determination to a known absolute accuracy, for it smacks of the "black box" approach which implicitlv assumes th~t the manufacturers have somehow managed to build absolute accuracy into the photometric scale of the instrument or instruments. As it is well known from interlaboratory comparisons that different instrument types (and even different specimens of the same. type) give systematic discrepancies that are expenmentally significant in terms of their reproduci~ility and precision [<1, 5, 6, 7, 8, 9], it is clear that It would be remarkable if even one instrument always gave a correct result. Since certilin types of systematic error are common to most instruments to some extent it ~ould also be remarkable jf a mean result (or ~ weIghted mean) could exactly or even approximately balance out the various sources of systematic error.
For the purposes of this Symposium we will take a more rigorous meaning of the term "high accuracy spectrophotometry_" We will make no assumptions whatever about the validity of commercially manufactured equipment or about any calibration procedure which has been attempted by the manufacturer. We will question and test every aspect of the function of optical components or instruments which are used and we ~ill seek out, determine and correct for ever; systematIc component of error which we can think ?f and discover, either in these component parts or III the complete reference instrument such as is described later.
Random components of error make their presence manifest in a rather obvious fashion, and most laboratories and text hooks are rather obsessed by them, with repeated use of phrases such as "signal-to-noise ratio" and similar concepts. Standardising laboratorIes should not be overconcerned with these problems, but rather with the systematic components of error. Random components of error are readily reduced by suitable statistical pooling of data from repeated runs, whereas systematic errors are not. A standardising laboratory can afford to and should make many more observations than an industrial laboratory normally would , and it usually becomes obvious as to how much reduction of variance by pooling is necessary. Again, I would point out that many laboratories are
376
unduly concerned with the statistical treatment of data, but this is not adequate to deal with the systematic errors that should be of most concern_
Excessive precision, arising from a combination of high resolution and good repeatability, is probably. a bad thing since it tends to beguile even experienced staff into a false sense of security as to the real accuracy achieved_ In the hands of inexpert staff the situation is worse, because of the confusion between the concepts of precision and accuracy that exists in so many minds. Of course, we must bear in mind that for many industrial purposes repeatability is more important than absolute accuracy. At this point we might note the difference between reproducibility and repeatability. Repeatability refers to the ability of an instrument to duplicate a result with a given sample presentation, and refers exclusively to the properties of the instrument. Reproducibility refers to the ability to duplicate a result when the sample presentation is repeated from scratch on different occasions i.e. , when it is cleaned or prepared afresh, repositioned and realigned in the instrument. Reproducibility therefore refers to the whole measurement procedure and covers effects arising both from the instrument and the sample
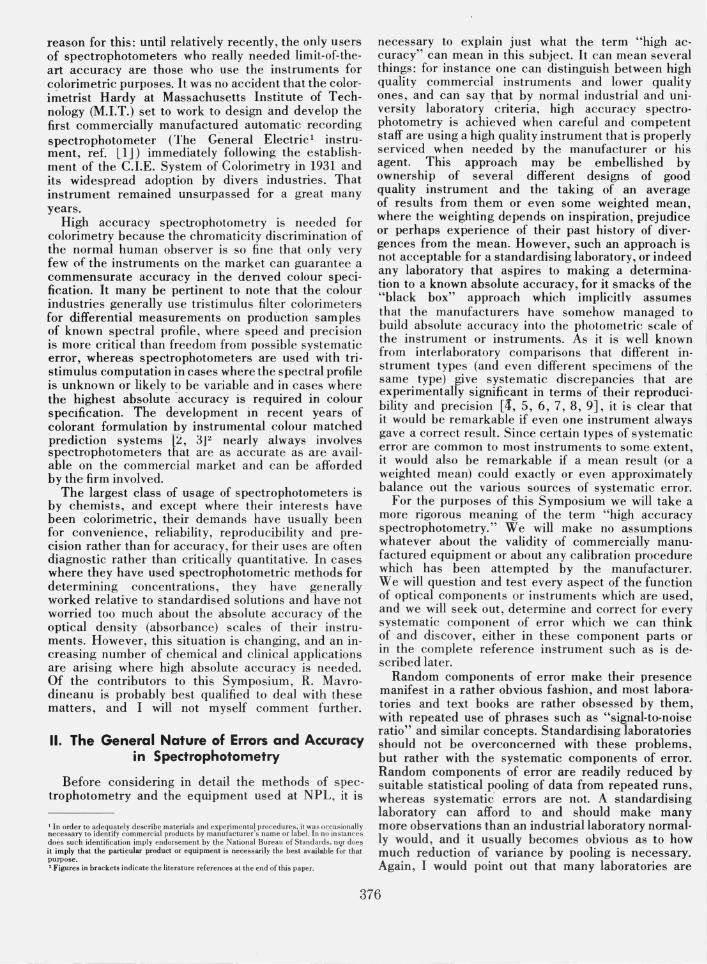
In general, components of errors are seldom purely random in nature or purely systematic, but tend to be intermediate in nature or rather closer to one aspect than the other. To assist in making this clear in practical terms, I have set out in figure 1 a classification of the more important types of error found in spectrophotometers in terms of their systematic or random nature, and it is instructive also to include for comparison the errors found in analogous instru-
SPt'CTROPHOTOMETER -- -- TRISTIMULUS
• FAULTS COLORIMETER
stray light in linearity ) :~:~~O~eVice FAULTS I monochromator reference standard
waveband ~~ non- standard geometry
filter design
J.. calibration (2SoC) faulty geometry
source s .p.d. P (A)
pen servo lag sample presentation
det ector S (A)
pen carriage alignment filter realisation dark correction
chart drive stray light I ::~~~
A calibration (49°) polarisation
source P (A) Changes pen zero thermochromism
detector S (A) changes chart irregularity drift
filter changes reading errors I I noise
FIGURE 1. Classification of types of error found in spectrophotometers and colorimeters in relation to their random or systematic nature.
ments i.e., photometers, colorimeters, and abridged (filter) spectrophotometers. Some of these will be discussed in detail in section IV. Some of the errors which are partly systematic and partly random are very difficult to deal with, and these manifest themselves as errors which are systematically present for an unpredictable period and which then change to a different systematic error for another unpredictable period and so on. Such errors tend to be found III
very complex systems, such as some of the more sophisticated double-beam automatic recording spectrophotometers, which may have several interlinked servos and feedback loops. This is one of the factors which has influenced us for decades at NPL in having a reference high accuracy spectrophotometer which is as simple as possible in fun ction, with as little interaction as possible between its component parts, so that each aspect of its function can be separately investigated.
The term "high accuracy spectrophotometry" refers to quite different magnitudes of probable error when considering different types of measurement. The simplest case is measurement of direct transmit; larice i.e., with no scattered or diffused component of flux included, and the lowest attainable error levels are found here. The next least complicated case is measurement of direct (or specular) reflectance, again with no diffused o~ scattered component included, and error levels almost as low can be achieved, the additional errors arising from the necessary movement of the optical system. Measurement of radiance factor introduces additional errors in the conditions of illumination and view · of the sample and uncertainties in the reference white standard used. Measurement of the total or of the diffused component of transmittance for scattering samples introduces the geometrical errors of integrating spheres (see later) and rather higher net error levels result, at least 0.2 percent in absolute value. In fact for this type of measurement and the remaining ones described below, the geometrical errors found in practice in the conditions of illumination and view are such that the monochromators and photoelectronic systems of good quality commercial spectrophotometers are often adequate to ensure the overall error level is not significantly increased. Measurement of total or of diffuse components of reflectance introduces not only the integrating sphere errors, but also the uncertainties in the reference white standards against which the samples are measured. Attainment of an error level of 0.2 percent in reflectance, while not impressive to a transmission spectrophotometrist, nevertheless qualifies for the term "high accuracy," because it cannot be attained reliably by using even an expensive commercial instrument in the usual way.
III. Spectrophotometric Equipment at NPL
Spectrophotometric standards at NPL are derived from measurements made on a specially constructed manual instrument (nonautomatic and nonrecording) known as the High Accuracy Spectrophotometer. This is the reference instrument, described in section III. A, and the performances of other instruments used in standards work are checked relative to it. Until about 25 years ago there were sometimes two and sometimes three manual spectrophotometers at work, these being used partly for establishing standards and partly for providing a calibration service for outside organizations. From then on the bulk of the outside calibration work was handled by two auto-
377
matic recording instruments, a General Electric and a Cary Model 10, and there was eventually only one manual instrument remaining, which became the reference instrument. In recent years the recording spectrophotometers mentioned above have been replaced by a Cary 14 and a Cary 14R with a number of improvements and accessory units, some designed and made at NPL, and these have now been interfaced to a local computer in an advanced time-sharing data handling system as described in section III. B.
In the spectrophotometric standards work at NPL the principle of substitution is strictly adhered to. This means that for double-beam instruments the measurement on a sample is sandwiched between measurements made on a reference standard ("Open" reading for absolute transmittance), and the second beam uses a comparison standard rather than a true reference standard_
In addition to the instruments used in spectrophotometric standards work, there are nowadays a number of other spectrophotometers at NPL, all regular commercial models and used as tools in a number of research and development projects, particularly by chemists. These are not instruments of the highest calibre, and are not used with any serious intention of obtaining accurate results, so we will not mention them further_ One interesting exception concerns the work of S_ C. Ellis and his colleagues in Radiation Science Division. Here a Cary 16 and an Optica CF4 are used to provide a calibration service in the dosimetry of hard radiation, the change in optical density in a photochemical actinometer being the measured indication of the previous irradiation [10]. The absolute accuracy of the optical density scale of these instruments at the appropriate UV and visible wavelength has been determined using transfer standards measured on our reference instrument described immediately below. The transfer standards were in the form of neutral density glass filters and cuvettes of accurately known pathlength containing known concentrations of pure potassium nitrate solution, so that this work also amounts to a new determination of the molar absorptivity of this material.
A. The NPL High Accuracy Spectrophotometer
The reference instrument for spectrophotometric standards at NPL is currently being completely rebuilt. The ins~!lnation has been developed and improved in a piece-wise fashion over a number of years, first one portion being replaced or improved, then another, as the art has advanced in different areas at different times. In the earlier years much pioneer work was done by Preston [11, 12], Donaldson [13, 14, 15] and Harding [16]. An important milestone was in 1947 when a Hilger "Uvisir" (Miiller-Hilger) quartz double-monochromator was introduced to supersede the use of series pairs of Hilger constant deviation prism monochromators, under the aegis of H. G_ W. Harding, and from then to the present day one of these Uvisir instruments has formed the "fixed" portio~ of the optical system.
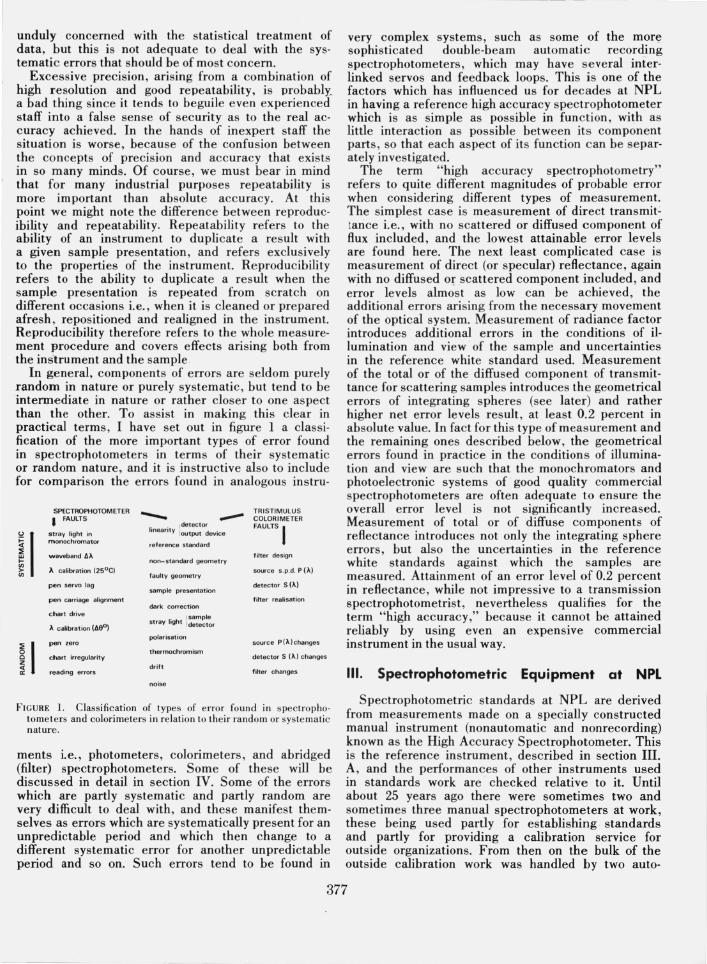
The principle of operation of the NPL reference instrument is, and always has been, deliberately simple. The layout is indicated in figure 2. A steady source (chosen for stability and output in the spectral region of interest) illuminates via the double-monochromator (chosen for aperture, freedom from stray light, wavelength adjustability and reproducibility) one of a pair of samples mounted on a two-position kinematic carriage. The transmitted or reflected light is collected over the required solid angle by suitable adjustable optics and assessed by a photoemissive detector (chosen for responsivity, stability and low dark current) which is dc coupled to a dc electrometer-input measuring system (chosen for high input impedance, low offset current and good zero and scaling stabilities). The single-beam principle is used throughout, both in optics and in electronics. No chopping or phase sensitive devices are used in the optical-ohotoelectronic system, though they may be used within electronic units such as stabilised dc supplies or digital voltmeters.
Operator's position
-- ----- ~ ---- --
PhotOmlltrlC enclosure
DH S T
~~~:(f¢
5,
St ul surface
plate
Electronics ro ck
r o L,
L,
FIGURE 2. Layout of the NPL High Accuracy Spectrophotometer, 1966-1972. OM: double monochromator; WO: wavelength drum; S" S2, S3: entrance, intermediate and exit slits; CH: condenser mirror housing; L" L" L,: alternative lamps for use in measure· ment or in wavelength calibration ; SC: sample carriage; K: operating knob for SC; T: baffle tube; S: integrating sphere with central screen; OH: detector housing, containing a selected EMI 9558Q photomultiplier P.
This use of a dc single-beam technique for the past 40 years at NPL may strike an outside observer who has read the common text books in spectrophotometry and electronics as rather strange. The reason may be summarised by saying that the various developments in double-beam, chopped or phase-sensitive techniques have made their impact largely on the problems of coping with source instability, and improving detectivity, signal-to-noise ratio and repeatability, so that more read-out resolution can be used to obtain greater precision over a wider range of scanspeed, wavelength and waveband conditions. Signalto-noise problems are inherently more serious in automatic scanning instruments because of the greater rate of information output required to reveal the
378
shape of a profile. Howe ver these techniqu es do nothing for absolute acc uracy, and their most sophis ticated employme nt in an advanced commercial recording instrument actually hinders attempts to determine syste matic error s in the photom etric values obtained (see sec. IV). For standards work there is no point in precision greatly exceeding the final accuracy that can be achi eved after correcting for known syste matic errors, whereas in ordinary commercial instruments where the syste matic errors are sometimes rather serious, there is an advantage for many indus trial purposes in having a rather better level of precision than can really b e justified.
The basic me asuring procedure is to take three types of reading in a preferred time sequence of the following character:
DRSRSRSRD
where D represents a dark reading, R a r eference reading (for absolute transmittance work a n "ope n" reading) and S a sample reading. The required photometri c ratio is calculated initially as
(5-15) / (R - lJ )
in terms of the mean values S , R a nd D found , a nd a linearity correction is subsequently applied. This last is determine d at intervals , and always immedi ately preceding and s ucceeding any limit·of-th e-art deter· minations , as described in section IV. A. The use of a time-symmetrical sequence of observations is im· portant in reducing th e influence of " drift " on the results. Apart from shot·noise flu ctuations a nd other short term instabilities, slow vari ations (drifts) of out· put are the main source of intrinsic photome tri c error in this technique. Th e time·symm etri cal sequence will completely nullify the effect of drift , provided the drift be at a co nsistent rate and in the same sense. In practice the drift tends to be fairly co nsiste nt , a nd approximate nullification of drift effects is what is achieved with the technique. Irregular drift cannot be allowed for. As will be seen in the description of the installation that follows , great a ttention has been paid to r educing all possible sources of drift and instability.
The source most favoured for visible region work from 350 nm to 800 nm is a gas·filled lamp with single vertical coil, and a stock of a suitable design of 12V 48W obsolete· pattern automobile headlamps is used. The lamps are selected for freedom from filament distortion and striae in the bulb, such as would give rise to a seriously nonuniform irradiance in the field aperture of the monochromator. They are also aged and tested for stability prior to use in measurement, and a small proportion of these lamps are found to give rhythmic variation in output due to slow thermal oscillations in the convection currents in the gas filling: such lamps are rejected. The lamp is not simply held in a commercial fittin g (bayonet or screw) but has soldered electrical connections to eliminate contact resistance. This type of source has not been improved for decades, but its operating
stability has , due to advances in electronics. Whereas an operator used to monitor the lamp current with a precision vernier potentiometer and galvanometer, and vary a trimming rheostat accordingly (which controlled the c urrent supplied from massive banks of lead-acid accumulators), nowadays the current through the lamp is automatically stabilised to typically a part in 105 over a 10 minute period by means of one from a range of c us tom-built variable dc· power s upplies developed s pecially for photometric work at NPL. A light output stability of about ± 1 part in 104 is routinely achieved over a 10 minute period.
F or near ultraviolet work · in the region 280 nm up· wards, the preferred source is nowada ys a tungsten· halogen lamp, but we have not yet discovered a type which is ideal in all respects (but see section III. B). Although the s tability should ideally be the same as with the conve ntional gas· filled lamp when run from the same stabilizer , we have not been able in practice to achie ve the same stability of light outpu t during measure ments. For work a t shorter wavelengths the deuterium arc has replaced the hydrogen arc as the preferred lamp, and although di scharge lamps are inherently far less stable tha n inoandescent fila ment la mps, the type we use gives a stability of rathe r better than 1 part in 103 over a 10 minute period.
The doubl e· monochro mator used up to the present is a MiiJler·Hilger in strument of aperture 60 mm x 60 mm. In each component monochromator there is a double pass through each of two 30° natural quartz prisms, and the di spersions at all eigh t passes through such pri sms are additive . The slit micrometers ope n the jaws symmetrically in all three cases, and fi shtail te mplets allow the slit height to be varied at the en· trance and exit slits. A prism instrument is preferred to a grating instrument for reduction of heterochro· matic stray light , and for both manual and recording type instruments used in standards work a true doublemonochromator is considered mandatory.
The light emergi ng from the exit slit enters a large light·tight pho tometric enclosure with matt black walls and measuring 1050 mm X 620 mm X 520 mm. This size of enclosure not only allows great freedom of optical configuration, with adequate room for baffles and light traps, but also reduces the influence of homo· chromatic stray light scattered or r eflected from optical components and reflec ted fro m and round the en· closure. An extensive range of optical bench fittin gs and photometric components can be deployed to suit almost any kind of spectrophotome tric measure· me nt: direct transmittance, diffuse transmittance , total trans mitta nce, direct reflectance at almost any angle, diffuse re flectance, total refl ectance , or radiance factor at almost a ny angles of illumination and view. A kine matically designed sample carriage enables the sample or samples to be moved to accurately determined position s by remote control, these positions being located by stops that can be clamped at any position on the guides. All components are mounted on a 2100 mm X 900 mm steel surface plate conforming to Grade B of BS817 for long term stability.
379
The photo detector in the enclosure is held in a lightproof housing with a sliding shutter covering a 50 mm diameter port in a plate to which a 100 mm diameter integrating sphere can be screwed. The integrating sphere has two diametrically opposite portholes, the entrance port being the smaller, and light cannot pass directly from one to the other because of the presence of a central disc-shaped screen. This particular sphere is not used for measurements invoking integrating sphere theory (such as diffuse or total transmittance or diffuse or total reflectance) but is employed in direct transmittance and direct reflectance measurements to ensure that any movement of the beam or change in its size or distribution at the detector region will have no influence on the readings. This is important in measuring samples that are of nonideal optical quality, and the uniformity of the central screen is vital.
Until 1961 the photodetector used was a vacuum photoemissive cell of a type specially developed for accurate photometry, latterly Rank-Cintel Types VB39 or VB59 for good red response or V A39 with silica window for ultraviolet response. The VB59 cell is still currently the preferred detector used in white-light photometry such as the determination of luminous intensity or luminous flux of incandescent or discharge lamps: present photomete r circuits are based on the impedance converter developed by Jones [17J. A succession of designs of dc electrometer amplifier null-balance detector systems had bee n developed over the years at NPL, especially by Preston [11], Harding [16] and Crawford [18]. In 1960 I started work on improving the photoelectronic system of Harding that was then in use, and found suitable operating conditions that would allow the EMI 9558 type of photom ultiplier to be used in a linear fashion: un til then photomultipliers were viewed askance by standards photometrists as being unstable and nonlinear
Input
IO~
, 9 " 7 I> 5 '" 10 10 10 10 10 10 10
107 ......
4,
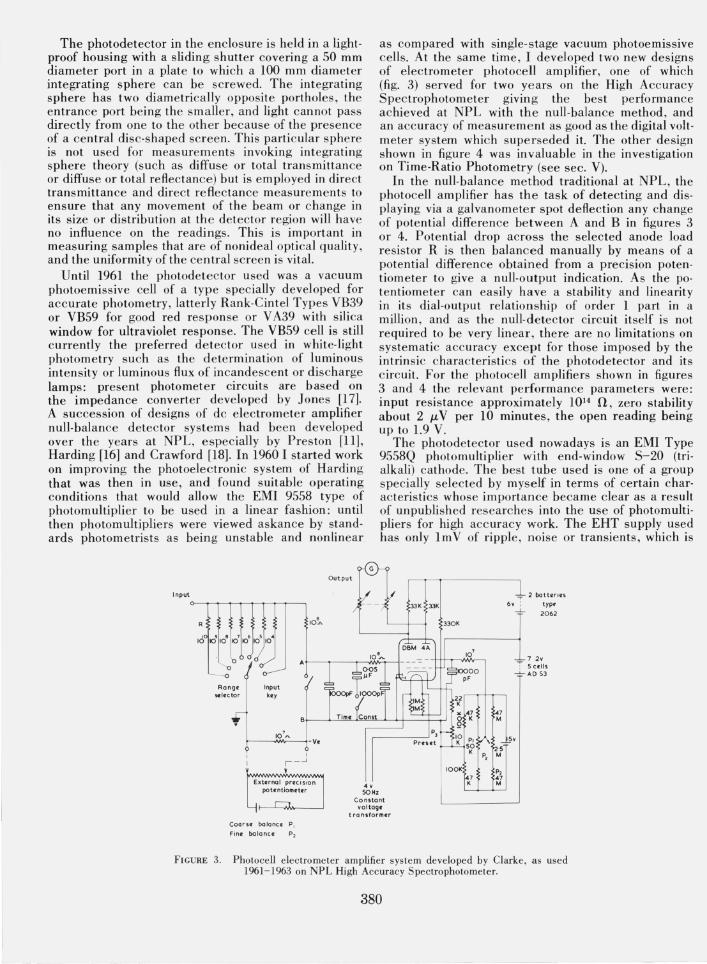
as compared with single-stage vacuum photoemissive cells. At the same time, I developed two new designs of electrometer photocell amplifier, one of which (fig. 3) served for two years on the High Accuracy Spectrophotometer gIvmg the best performance achieved at NPL with the null-balance method, and an accuracy of measurement as good as the digital voltmeter system which superseded it. The other design shown in figure 4 was invaluable in the investigation on Time-Ratio Photometry (see sec. V).
In the null-balance method traditional at NPL, the photocell amplifier has the task of detecting and displaying via a galvanometer spot deflection any change of potential difference between A and B in figures 3 or 4. Potential drop across the selected anode load resistor R is then balanced manually by means of a potential difference obtained from a precision potentiometer to give a null-output indication. As the potentiometer can easily have a stability and linearity in its dial-output relationship of order 1 part in a million, and as the null-detector circuit itself is not required to be very linear , there are no limitations on systematic accuracy except for those imposed by the intrinsic characteristics of the photodetector and its c ircuit. For the photocell amplifiers shown in figures 3 and 4 the relevant performance parameters were: input resistance approximately 1014 n, zero stability about 2 JL V per 10 minutes, the open reading being up to 1.9 V.
The photodetector used nowadays is an EMI Type 9558Q photomultiplier with end-window 5-20 (trialkali) cathode. The best tube used is one of a group specially selected by myself in terms of certain characteristics whose importance became clear as a result of unpublished researches into the use of photomultipliers for high accuracy work. The EHT supply used has only 1m V of ripple, noise or transients, which is
33QK
P,
P, 47 M
T 2 bat terles bv : typv
-L 2062
7 2, -: SecUs
-'-- AD S3
50Hz Co nstont voltage
transformer Cooru balance PI
Fine balance P2
FIGURE 3. Photocell electrometer amplifier system developed by Clarke, as used 1961- 1963 on NPL High Accuracy Spectrophotometer.
380
~othd uction _ _ c ---- -- - --- - - - I In s~porot« bOll I I - I
Coarse balance p~
Fine bolonce PJ
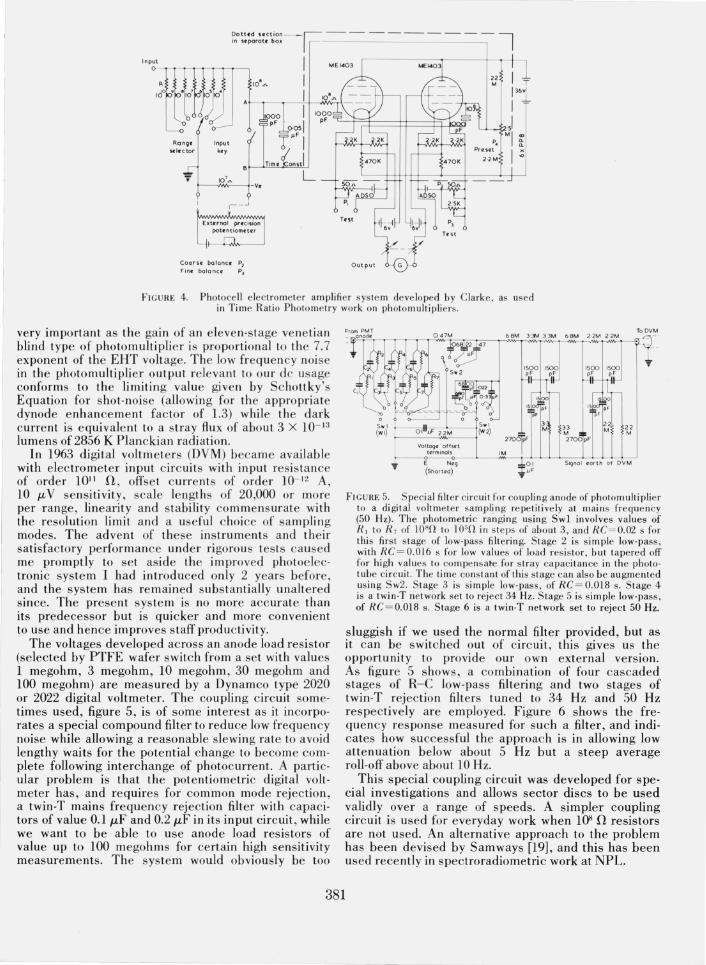
FIG URE 4. Photocell e lectrometer amplifier sys te m deve loped by Clarke , as used in Time Ratio Photome try work on photomultipliers.
very important as the gain of an eleven-stage venetian blind type of photom ulti plier is proportional to the 7.7 exponent of the EHT voltage. The low frequency noise in the photomultiplier output relevant to our de usage conforms to the limiting value given by Schottky's Equation for shot-noise (allowing for the appropriate dynode e nhanceme nt factor of 1.3) while the dark current is equivale nt to a stray flux of about 3 X 10- 1:!
lumens of 2856 K Planckian radiation. In 1963 digital voltmeters (DVM) became available
with elec trometer input c ircuits with input resistance of order 1011 fl , offset c urre nts of order 10- 12 A, 10 /-tV sensitivity, scale le ngths of 20,000 or more per range, linearity and stability commensurate with the resolution limit and a useful choice of sampling modes. The advent of these instrume nts and their satisfactory performance under rigorous tests caused me promptly to set aside the improved photoelectronic system I had introduced only 2 years before, and the system has remained substantially unaltered since. The prese nt system is no more accurate than its predecessor but is quicker and more convenient to use and hence improves staff productivity.
The voltages developed across an anode load resistor (selected by PTFE wafer switch from a set with values 1 megohm, 3 megohm, 10 megohm , 30 megohm and 100 megohm) are measured by a Dynamco type 2020 or 2022 digital voltmeter. The coupling circuit sometimes used, figure 5, is of some interest as it incorporates a special compound filter to reduce low frequency noise while allowing a reasonable slewing rate to avoid lengthy waits for the potential change to become complete following interchange of photocurrent. A particular problem is that the potentiometric digital voltmeter has, and requires for common mode rejection, a twin-T mains frequency rejection filter with capacitors of value O.l/-tF and 0.2/-tF in its input circuit, while we want to be able to use anode load resistors of value up to 100 megohms for certain high sensitivity measurements. Th e sys te m would obviously be too
Vol tog e offset terminals
E NlE9 (Shorted)
bBM 3~ 33M bBM 22M 22M
270or"
1M I
1500 1500 pF pF
3 3 M 2700pF
2·2 M
Signal eor th 0 1 DV M
FI GU RE 5. Special filter circuit for coupling a node of pholomultiplier to a digital voltmeter sampling re petitively at mains fre quency (50 Hz). The photometric ranging using Sw 1 involves values of R, to R , of lO"O to 10' 0 in s te ps of about 3, and RC= 0.02 s for thi s firs t stage of low-pass filtering. Stage 2 is s imple low-pass, with RC = 0.016 s for low values of load res istor, but tapered off for high values to compensate for s tray capacitance in the phototube circuit. The time constant of this stage can also be augme nted using Sw2. Stage 3 is simple low-pass, of RC = 0.018 s. Stage 4 is a twin-T network set to reject 34 Hz. S tage ~ is s imple low-pass, of RC = 0.018 s. Stage 6 is a twin-T network set to reject 50 Hz.
sluggish if we used the normal filter provided, but as it can be switched out of circuit, this gives us the opportunity to provide our own external version. As figure 5 shows, a combination of four cascaded stages of R-C low-pass filtering and two stages of twin-T rejection filters tuned to 34 Hz and 50 Hz respectively are employed. Figure 6 shows the frequency response measured for such a filter, and indicates how successful the approach is in allowing low attenuation below about 5 Hz but a steep average roll-off above about 10 Hz.
This special coupling circuit was developed for special investigations and allows sector discs to be used validly over a range of speeds. A simpler coupling circuit is used for everyday work when lOS fl resistors are not used_ An alternative approach to the problem has been devised by Samways [19], and this has been used recently in spectroradiometric work at NPL.
381

I F~-=~-~-~--~-_C-_-_-_-_'-C-'-------'---''--'O I ~~ . ....... Att~nuot i on
I ~ ... of power
10' - K -:--:., 20 dB
tra~~;~jn:: 1\<:,:----~ --__ _ 10 f-----+---+-+_---'\-\~+_-+_____i40
log scale \
',C
103 ~'7~60
I0 41----f-----t--+-------'~ \tt----t-'':l, 80
:: :I-----j---t--+-----t\I~--J-+/"'"'---=---1: 6 10 30 60 100
f (H Z) log scole
FI GURE 6. Transmittance versus frequency cha racteri sti c of special filt er circuit (curve A). Note the 120 dB rejection at the sampling frequency of the DVM. Curve B shows the perform ance of a simple low·pass filter whose RC is set to 0.108 s to give an equivalent effect at low frequencies « 5 Hz). Curve C shows the e ffect produced by the 4 cascaded stages of s imple low-pass filt er present in the s peci al filt er circuit.
Because of the large number of optical configurations used to provide the differe nt directions and solid angles of illumination and view and give different s izes of illuminated patch on the sample, it is impractical to show diagrams of the m. Figure 2 shows a simplified indication of the optical arrangement used in measuring the direct transmittance of a s mall filt er. However some of the points rai sed in section IV will give guidance on devising the most suitable optical layout.
The NPL High Accuracy Spectrophotometer is currently being rebuilt , and the double-monochromator to be used is a Hilger D300 which uses a double pass through a 60° Cornu prism of aperture about 55 mm X 55 mm in each monochromator section. A yet larger photometric enclosure measuring roughly 1300 mm X 900 mm X 700 mm will be used, and the sample carriage will employ a Schneeberger linear bearing as suggested by R. Mavrodineanu of NBS. The photoelectronic system is not being altered for ultraviolet and visible region work, but we are planning to add a synchronised detector chopped system for near infrared work in the region 800 nm to 2600 nm. This need arises because in 1967 Colorimetry and Photometry Section took over the responsibility for near infrared spectrophotometric standards (at up to 2600 nm) and until the present we have had no independent means of verifying the accuracy of our Cary 14 instruments in this region.
A number of checks and determinations of various kinds of systematic error are routinely made when working at high accuracy. These are detailed and discussed in section IV.
B. On-Line Data System for Automatic Recording Spectrophotometry
The bulk of the work in spectrophotometric standards and measurement services for outside organisa-
tions is performed on good quality recording spectrophotometers, and Cary 14 and Cary 14R instruments are used for these purposes. A detailed description of the Cary 14 instrument would be out of place here as it is a very well· known design and full details are obtainable elsewhere [20]. It is particularly noteworthy among commercial instrumentation for the size, freedom from stray light , wavelength calibration reproducibility and wide range of scan speeds of its prism-grating double-monochromator. In fact it is our experience that a wavelength value for a peak, trough or emission line can be determined more accurately with one of these recording instruments than with our reference manual instrument, and this is undoubtedly due to the ability to scan and record continuously and to the absence of stick·slip irregularities when scanning at even the slowest speed (0.05 nm/s).
Accessories available include the direct reflection attachment and the Model 1411 sphere. The direct reflection attachment uses the "V /W " optical arrangement after Strong [21] and invokes the use of a specimen compartment that is unusually large by commercial standards. In view of my comments on the importance of having a large compartment for the sample and supplementary" optics in section III. A, it will come as no surprise to the reader to learn that we use this compartment unit in preference to the normal one for all direct transmittance work as well , and that we have built a duplicate ourselves for the second instrume nt. In addition we have a box extension above the lid which allows rather lengthy items to be measured a reasonable distance from either end , a feature which has proved very useful when measuring the envelope transmittances of photometric standard lamps.
The Cary 1411 sphere attachment is noteworthy among commercial instrumentation in having a pair of screens inside, between the reflectance sample and comparison ports and the detector port. This means that the largest source of systematic error found in the majority of commercial integrating spheres is taken care of, for without such screens the component of flux diffusely reflected directly to the detector port is grossly overweighted relative to the flux diffusely reflected in all other directions. The unit is provided with supplementary deuterium and tungsten sources for broad-band irradiation of samples, and the result is that a total of 30 measuring modes (combinations of source , detector and geometry of illumination and view) are available with our Cary 14 instrument and 32 modes with our Cary 14R. These are set out in table 1.
At the present time it is not practicable to determine the geometrical errors in integrating spheres by calculation. This is because classical integrating sphere theory depends on certain elegant simplifications which arise from the assumptions that a wall coating is uniform over its whole surface and that it is also Lambertian i.e. , a uniform diffuser. Other common simplifications are to assume that samples are small enough to have a negligible effect on the
382
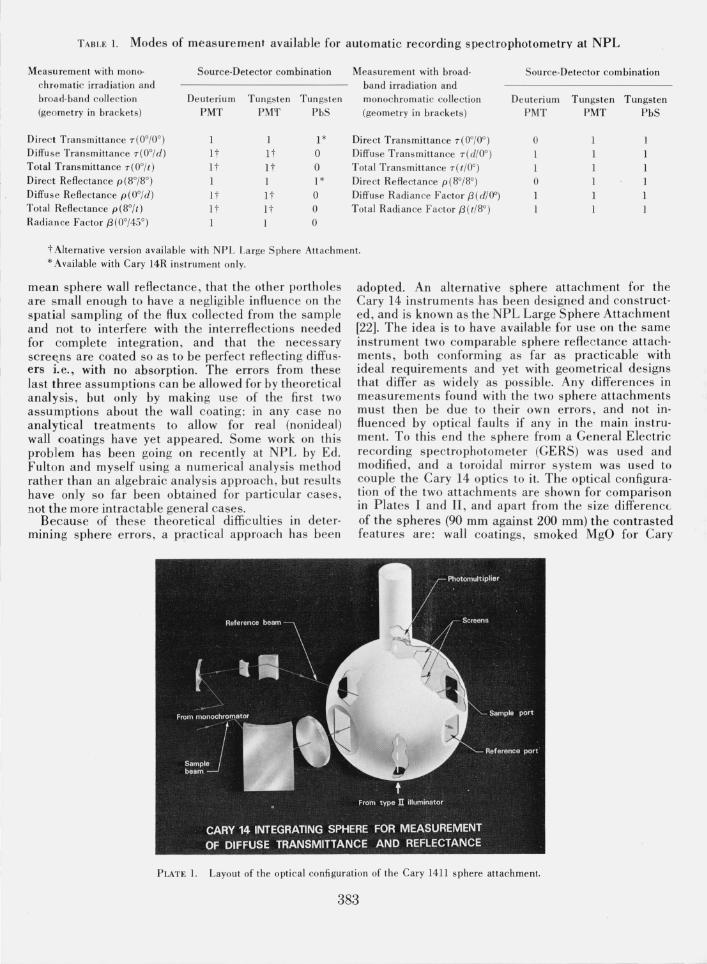
TABLE 1. Modes of measurement available for automatic recording spectrophotometry at NPL
Measurement with mono- Source-Detector combination Measurement with broad- Source-Detector combination chromatic irrad iation and band irradiat ion and broad-band coll ection Deuterium Tungs ten Tungsten monochromatic co llection Deuterium Tungsten Tungsten (geometry in brackets) PMT PM'f PbS (geometry in brackets) PMT PMT PbS
Direct Transmittance T(Oo/OO) 1 I 1* Direct Transmittance T(Oo/OO) 0 I Diffu se Transmittance T(oo/d) It It 0 Diffuse Transmittance T( d/OO) 1 Total Transmittance T(oo/t) It It 0 Total Transmittance T(t /OO) I Direct Reflectance p (8°/8°) I 1* Direct Reflectance p(8°/8°) 0 Diffu se Re flectan ce p(oo/d) It It 0 Diffuse Radian ce Factor f3(d/OO) Total Reflectance p(8°/ t) It It 0 Total Radiance Factor f3 (t/8°) Radiance Factor ,8(0°/45°) 0
t Alternative version available with NPL Large Sphere Attachment. * Available with Cary 14R instrument only.
mean sphere wall reflectance, that the other portholes are small enough to have a negligible influence on the spatial sampling of the flux collected from the sample and not to interfere with the interreflections needed for complete integration, and that the necessary scre~n s are coated so as to be perfect reflecting diffusers i e_, with no absorption_ The errors from these last three assumptions can be allowed for by theoretical analysis, but only by making use of the first two assumptions about the wall coating: in any case no analytical treatments to allow for real (nonideal) wall coatings have yet appeared_ Some work on this problem has been going on recently at NPL by Ed_ Fulton and myself using a numerical analysis method rather than an algebraic analysis approach, but results have only so far been obtained for particular cases, not the more intractable general cases_
Because of these theoretical difficulties in determining sphere errors, a p~actical approach has been
adopted_ An alternative sphere attachment for the Cary 14 instruments has been designed and constructed, and is known as the NPL Large Sphere Attachment [22]_ The idea is to have available for use on the same instrument two comparable sphere reflectance attachments , both conforming as far as practicable with ideal requirements and yet with geometrical designs that differ as widely as possible_ Any differences in measurements found with the two sphere attachments must then be due to their own errors, and not influenced by optical faults if any in the main instrument. To this end the sphere from a General Electric recording spectrophotometer (GERS) was used and modified, and a toroidal mirror system was used to couple the Cary 14 optics to it. The optical configuration of the two attachments are shown for comparison in Plates I and II, and apart from the size differenc<of the spheres (90 mm against 200 mm) the contrasted features are: wall coatings, smoked MgO for Cary
PLATE 1. Layout of the opti cal configuration of the Cary 1411 sphere attachment.
383
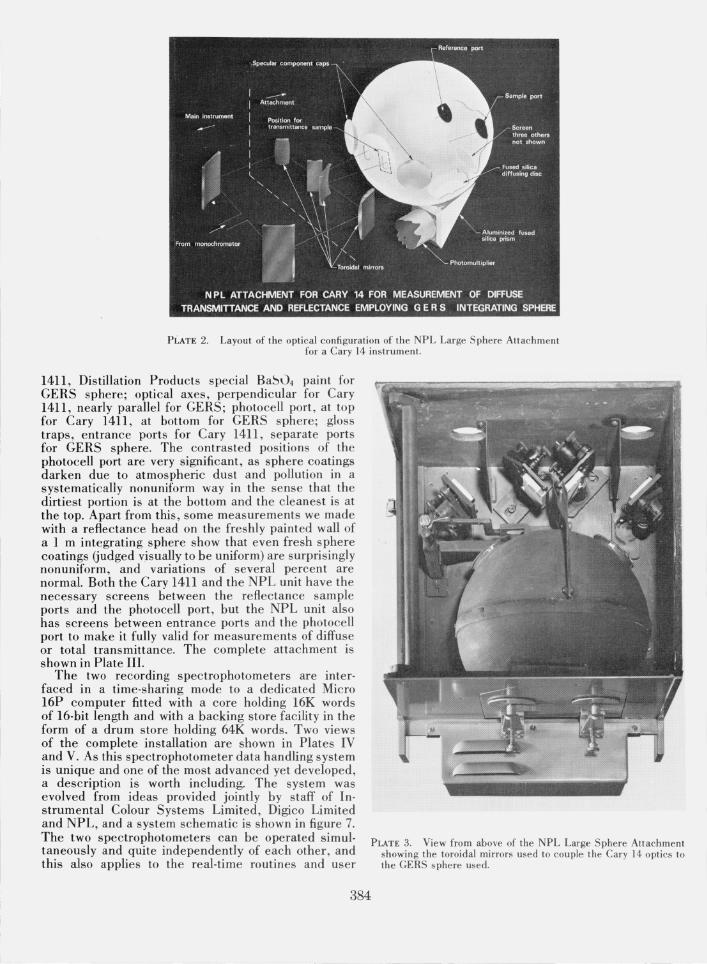
PLATE 2. Layout of the optical configuration of the NPL Large Sphere Attachment for a Cary 14 instrument.
1411 , Distillation Products special Ba~04 paint for GERS sphere; optical axes, perpendic ular for Cary 1411, nearly parallel for GERS; photocell port, at top for Cary 1411, at bottom for GERS sphere; gloss traps, e ntrance ports for Cary 1411 , separate ports for GERS sphere. The contrasted positions of the photocell port are very significant, as sphere coatings darken due to atmospheric dust and pollution in a systematically nonuniform way in the sense that the dirtiest portion is at the bottom and the cleanest is at the top. Apart from this, some measurements we made with a reflectance head on the freshly painted wall of aim integrating sphere show that even fresh sphere coatings (judged visually to be uniform) are surprisingly nonuniform , and variations of several percent are normal. Both the Cary 1411 and the NPL unit have the necessary screens between the reflectance sample ports and the photocell port, but the NPL unit also has screens between entrance ports and the photocell port to make it fully valid for measurements of diffuse or total transmittance. The complete attachment is shown in Plate III.
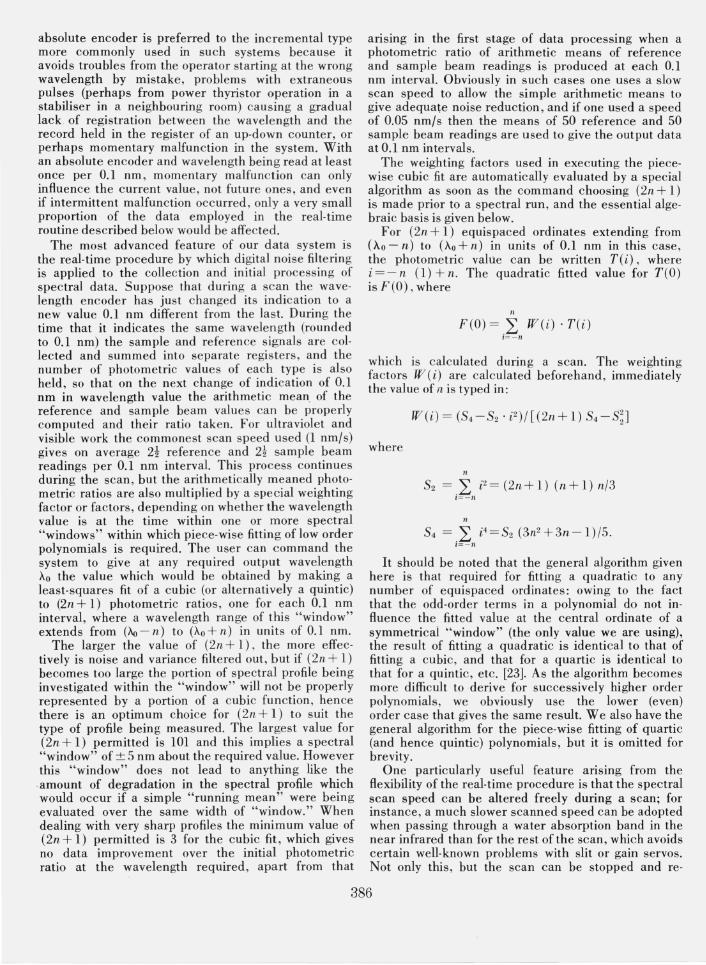
The two recording spectrophotometers are interfaced in a time-sharing mode to a dedicated Micro 16P computer fitted with a core holding 16K words of 16-bit length and with a backing store facility in the form of a drum store holding 64K words_ Two views of the complete installation are shown in Plates IV and V_ As this spectrophotometer data handling system is unique and one of the most advanced yet developed, a description is worth including. The system was evolved from ideas provided jointly by staff of Instrumental Colour Systems Limited, Digico Limited and NPL, and a system schematic is shown in figure 7_ The two spectrophotometers can be operated simultaneously and quite independently of each other, and this also applies to the real-time routines and user
384
PLATE 3. View from above of the NPL Large Sphere Attachment showing the toroidal mirrors used to couple the Cary 14 optics to the GERS sphere used.
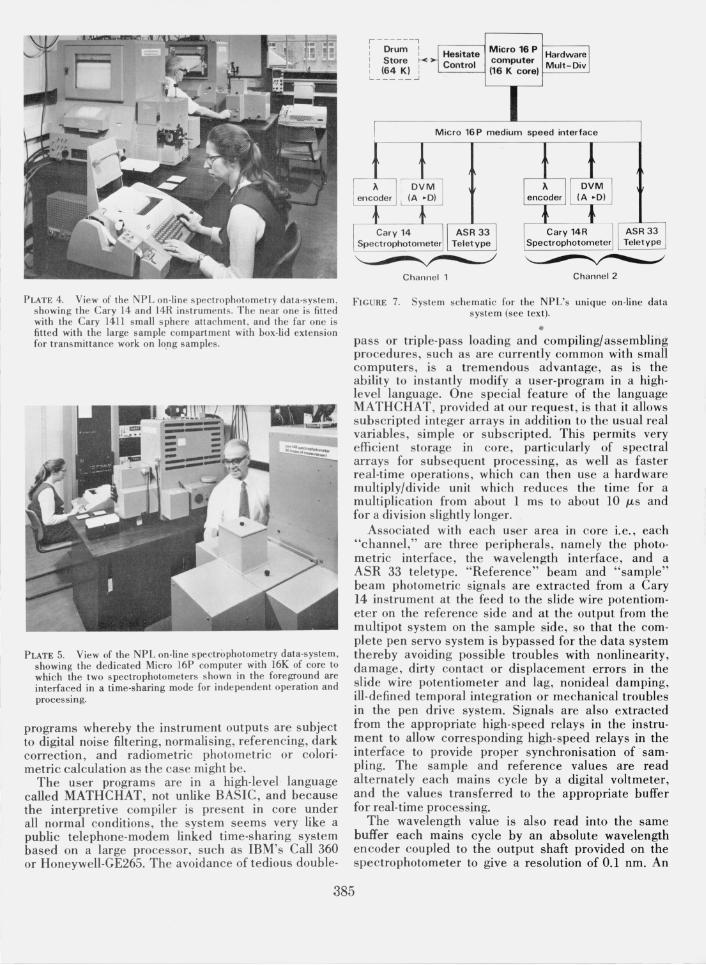
PLATE 4. View of the NPL on-tine spectrophotometry data-system , showing the Cary 14 and 14R instruments. The near one is filled with the Cary 1411 small sphere attachment , and the far one is filled with the large sample compartment with box-lid extension for transmittance work on long samples.
PLATE 5. View of the NPL on-line spectrophotometry data-system, showing the dedicated Micro 16P computer with 16K of core to which the two s pectrophotometers shown in the foreground are interfaced in a time-sharing mode for independent operation and processing.
programs whereby the instrument outputs are subject to digital noise filtering, normalising, referencing, dark correction, and radiometric photometric or colorimetric calculation as the case might be_
The user programs are in a high-level language called MATHCHAT, not unlike BASIC, and because the interpretive compiler is present in core under all normal conditions , the system seems very like a public telephone-modem linked time-sharing system based on a large processor, such as IBM's Call 360 or Honeywell-GE265. The avoidance of tedious double-
r ----- --, I Drum I I I I Store K
: (64 K) : L ____ _ ~
Hesitate Micro 16 P Hardware Control computer Mult-Div
L-___ (16 K core) ~_---=-:~
Micro 16 P medium speed interface
Channel 1 Channel 2
FIGURE 7. System sche mati c for the NPL's unique on-line data system (see text).
• pass or triple-pass loading and compiling/asse mbling procedures, such as are currently common with small computers, is a tremendous advantage, as is the ability to instantly modify a user-program in a highlevel language_ One special feature of the language MATH CHAT , provided at our request, is that it allows subscripted integer arrays in addition to the usual real variables, simple or subscripted_ This permits very efficient storage in core, particularly of spectral arrays for subsequent processing, as well as faster real-time operations, which can then use a hardware multiply/divide unit which reduces the time for a multiplication from about 1 ms to abo ut 10 JLS and for a division slightly longer.
Associated with each user area in core i_ e_, each "channel," are three peripherals, namely the photometric interface, the wavelength in terface, and a ASR 33 teletype_ "Reference" beam and "sample" beam photometric signals are extracted from a Cary 14 instrument at the feed to the slide wire potentiometer on the reference side and at the output from the multipot system on the sample sid e, so that the complete pen servo system is bypassed for the data system thereby avoiding possible troubles with nonlinearity, damage, dirty contact or displacement errors in the slide wire potentiometer and lag, nonideal damping, ill-defined temporal integration or mechanical troubles in the pen drive system_ Signals are also extracted from the appropriate high-speed relays in the instrument to allow corresponding high- speed relays in the interface to provide proper synchronisation of sampling_ The sample and reference values are read alternately each mains cycle by a digital voltmeter, and the values transferred to the appropriate buffer for real-time processing_
The wavelength value is also read into the same buffer each mains cycle by an absolute wavelength encoder coupled to the output shaft provided on the spectrophotometer to give a resolution of 0_1 nm_ An
385
absolute encoder is preferred to the incremental type more commonly used in such systems because it avoids troubles from the operator starting at the wrong wavelength by mistake, problems with extraneous pulses (perhaps from power thyristor operation in a stabiliser in a neighbouring room) causing a gradual lack of registration between the wavelength and the record held in the register of an up-down counter, or perhaps momentary malfunction in the system_ With an absolute encoder and wavelength being read at least once per 0.1 nm , momentary malfunction can only influence the current value, not future ones, and even if intermittent malfunction occurred, only a very small proportion of the data employed in the real-time routine described below would be affected.
The most advanced feature of our data system is the real-time procedure by which digital noise filtering is applied to the collection and initial processing of spectral data. Suppose that during a scan the wavelength encoder has just changed its indication to a new value 0.1 nm different from the last. During the time that it indicates the same wavelength (rounded to 0.1 nm) the sample and reference signals are collected and summed into separate registers , and the number of photometric values of each type is also held, so that on the next change of indication of 0.1 nm in wavelength value the arithmetic mean. of the reference and sample beam values can be properly computed and their ratio taken. For ultraviolet and visible work the commonest scan speed used (1 nm/s) gives on average 2t reference and 2t sample beam readings per 0.1 nm interval. This process continues during the scan, but the arithmetically meaned photometric ratios are also multiplied by a special weighting factor or factors, depending on whether the wavelength value is at the time within one or more spectral "windows" within which piece-wise fitting of low order polynomials is required. The user can command the system to give at any required output wavelength 11.0 the value which would be obtained by making a least-squares fit of a cubic (or alternatively a quintic) to (2n + 1) photometric ratios , one for each 0.1 nm interval, where a wavelength range of this "window" extends from (11.0 - n) to (11.0 + n) in units of 0.1 nm.
The larger the value of (2n + 1), the more effectively is noise and variance filtered out, but if (2n + 1) becomes too large the portion of spectral profile being investigated within the "window" will not be properly represented by a portion of a cubic function, hence there is an optimum choice for (2n + 1) to suit the type of profile being measured. The largest value for (2n + 1) permitted is 101 and this implies a spectral "window" of ± 5 nm about the required value. However this "window" does not lead to anything like the amount of degradation in the spectral profile which would occur if a simple "running mean" were being evaluated over the same width of "window." When dealing with very sharp profiles the minimum value of (2n + 1) permitted is 3 for the cubic fit, which gives no data improvement over the initial photometric ratio at the wavelength required, apart from that
ansmg in the first stage of data processing when a photometric ratio of arithmetic means of reference and sample beam readings is produced at each 0.1 nm interval. Obviously in such cases one uses a slow scan speed to allow the simple arithmetic means to give adequate noise reduction, and if one used a speed of 0.05 nm/s then the means of 50 reference and 50 sample beam readings are used to give the output data at 0.1 nm intervals.
The weighting factors used in executing the piecewise cubic fit are automatically evaluated by a special algorithm as soon as the command choosing (2n + 1) is made prior to a spectral run, and the essential algebraic basis is given below.
For (2n + 1) equispaced ordinates extending from (Ao-n) to (Ao+n) in units of 0.1 nm in this case, the photometric vallie can be written T(i) , where i = -n 0) +n. The quadratic fitted value for T(O) is F(O), where
1/
F(O) = L Wei) - T(i) i=-n
which is calculated during a scan. The weighting factors W (i) are calculated beforehand , immediately the value of n is typed in :
where
n
S2 .L i 2 = (2n+ 1) (n+ 1) n/3 l= - n
11.
S4 .L i 4 = S2 (3n2 +3n-l)/5. l =-n
It should be noted that the general algorithm given here is that required for fitting a quadratic to any number of equispaced ordinates: owing to the fact that the odd-order terms in a polynomial do not influence the fitted value at the central ordinate of a symmetrical "window" (the only value we are using), the result of fitting a quadratic is identical to that of fitting a cubic, and that for a quartic is identical to that for a quintic, etc. [23]. As the algorithm becomes more difficult to derive for successively higher order polynomials, we obviously use the lower (even) order case that gives the same result. We also have the general algorithm for the piece-wise fitting of quartic (and hence quintic) polynomials, but it is omitted for brevity.
One particularly useful feature arising from the flexibility of the real-time procedure is that the spectral scan speed can be altered freely during a scan; for instance, a much slower scanned speed can be adopted when passing through a water absorption band in the near infrared than for the rest of the scan, which avoids certain well-known problems with slit or gain servos. Not only this , but the scan can be stopped and re-
386
started or even partly back-trac ked and restarted without corruption of the acceptable part of the scan already produced.
The use of the bac king store to hold an assortment of user program texts and standard data blocks as weJl as an image of the system software, compiler and math s pac kages is a great convenience, but is quite conventional and needs no further comm ent here.
What have proved to be the main advances in NPL's recording spectrophotometry given by the on-line data system? The main objective has been amply achieved , namely a major reduction in the staff time involved in all stages of standards work and calibration services for outside organisations, from making the measurements through various stages of data reduction to the final tabulations in our records or the despatch of a calibration report. Th e ease of producing and comparing data has led to anomalous operating conditions of the spectrophotometers being spotted more certainly. We have been gratified to find that the precision and repeatability of measurement has also been significantly improved , which suggest s that the slide wire poten tiometer and pen servo system of th e Cary 14 instrument imposes a major limitation on its performance when used with a pen recorder output in the normal way. However we have not been deceived into imagining that the data sys tem has necessarily redu ced the systematic errors of measurement. Since we do not rely on commercial spectrophotometers to provide our scales of measuremen t, this is no great worry to us.
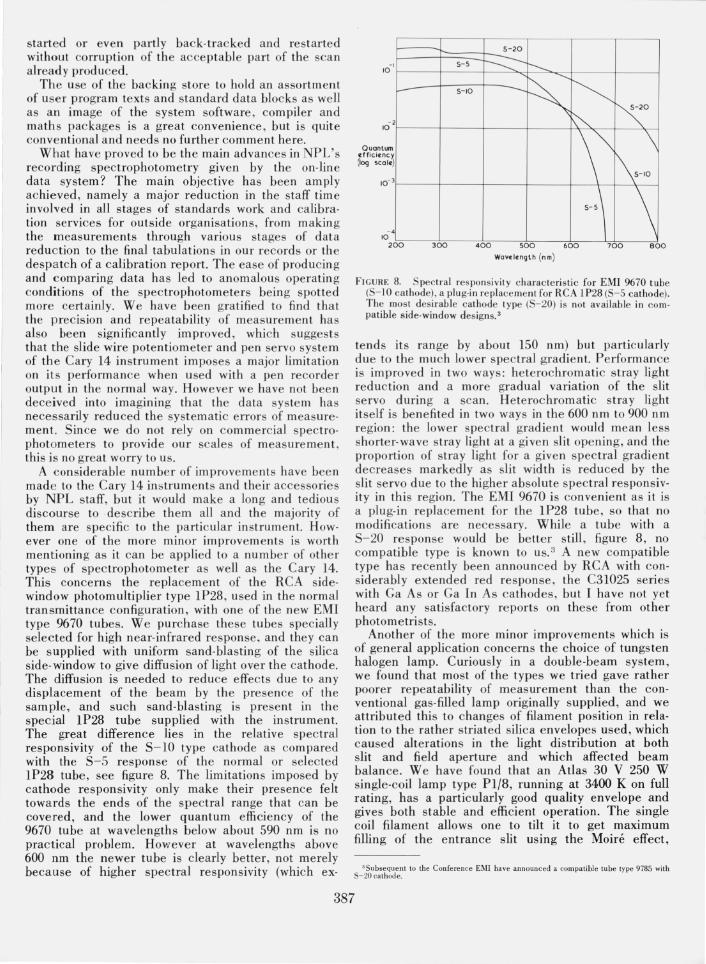
A considerable number of improvements have been made to the Cary 14 instruments and their accessories by NPL s taff, but it would make a long and tedious discourse to describe them all and the majority of them are specific to the particular in strum ent. However one of the more minor improvements is worth mentioning as it can be applied to a number of other types of spectrophotometer as well as the Cary 14. This concerns the re placement of the RCA sidewindow photomultiplier type IP28 , used in the normal transmittance configuration , with one of the new EMI type 9670 tubes. We purchase these tubes specially selected for high near-infrared response, and they can be supplied with uniform sand-blasting of the silica side-window to give diffusion of light over the cathode. The diffusion is needed to reduce effects due to any displacement of the beam by the presence of the sample, and such sand-blasting is present in the spedal IP28 tube supplied with the instrument. The great difference lies in the relative spectral responsivity of the S- 1O type cathode as compared with the S-5 response of the normal or selected IP28 tube , see figure 8. The limitations imposed by cathode responsivity only make their presence felt towards the ends of the spectral range that can be covered, and the lower quantum efficiency of the 9670 tube at wavelengths below about 590 nm is no practical problem. However at wavelengths above 600 nm the newer tube is clearly better, not merely because of higher spectral responsivity (which ex-
I 10
10 2
Quantum dflcirnc (log scelr ~
3
4
I-
10 200
5-5
5-10
300
5-20
-=::::- -........-.
~ ~ ---- Ko ~
\~ '\ \5-,0
\ \ 5-5
400 500 600 700 BOO
WOv<I.ngth (nm)
FIGURE 8. S pectral responsivity characte ri sti c for EM! 9670 tube (S- IO cathode) , a plug·in replacement for RCA IP28 (S- 5 cathode). The most desirable cathode type (S-20) is not available in co mpatible side· window designs. 3
te nds its range by about 150 nm) but particularly due to the much lower spectral gradient. P erformance is improved in two ways: heterochromatic s tray light reduction and a more gradual variation of the sli t servo during a scan. Heterochromatic stray light itself is benefited in two ways in the 600 nm to 900 nm region : the lower spectral gradient would mean less shorter-wave stray light at a given slit opening, and the proportion of stray light for a given spectral gradient decreases markedly as sli t width is reduced by the slit servo due to the higher absolute spectral responsivity in this region. The EMI 9670 is convenie nt as it is a plug-in replacement for the IP28 tube, so that no modifications are necessary. While a tube with a S-20 response would be better still , figure 8, no compati ble type is known to us. 3 A new compatible type has recently been announced by RCA with considerably extended red response, the C31025 series with Ga As or Ga In As cathodes, but I have not yet heard any satisfactory reports on these from other photometrists.
Another of the more minor improvements which is of general application concerns the choice of tungsten halogen lamp. Curiously in a double-beam syste m, we found that most of the types we tried gave rather poorer repeatability of measurement than the conventional gas-filled lamp originally supplied, and we attributed thi s to changes of filament position in relation to the rather striated silica envelopes used, which caused alterations in the light distribution at both slit and fi eld aperture and which affected beam balance. W e have found that an Atlas 30 V 250 W single-coil lamp type PI/8, running at 3400 K on full rating, has a particularly good quality envelope and gives both stable and efficient operation. The single coil filament allows one to tilt it to get maximum filling of the entrance slit using the Moire effect,
:.I Subsequent to the Confere nce EM! have announced a compatible tube type 9785 with 5- 20 cathode.
387
and about 50 percent more throughput can be obtained than with the 120 V 650 W tungsten halogen source which the manufacturer can supply, while heating problems with the monochromator are eased.
IV. Determination and Correction of Systematic Errors
As described in section II, the spectrophotometrist seeking after high accuracy should concern himself much more with correction of systematic errors (and indeed avoiding them as far as possible) than with statistical exercises that relate to variance and random types of error. In the subsections 4.A to 4.D that follow some guidance is given as to how to deal with the more important types of systematic error. As the precise procedure depends on the details of the installation used, any description must refer to some particular type of configuration, and the NPL High Accuracy Spectrophotometer has been used as the model. It will become apparent that the procedures can easily be applied to any other instrument working on the same manual single-beam dc principle, but often not at all easily to a typical commercial instrument working on the double-beam chopped synchronous detection principle. While manufacturers have sometimes made drastic modifications so as to produce special versions of their instrument to investigate errors, this does not normally lie within the power of a user.
A. Linearity Correction, using the Double-Aperture or Multi-Aperture Methods
At NPL the preferred method of determining linearity errors in the photoelectronic system is the DoubleAperture method, and it has continued in use in high accuracy spectrophotometry for over 40 years. The method tests the linearity of response of the complete instrument system as it is set up for measurement of a sample, whereas other methods (sec. IV. B) often involve drastic modifications or major additions to the system or separate investigations on parts of the system i.e., the photocell, or amplifiers or potentiometer and the pen recorder or the digital readout, or some combination thereof. Provided that the method is sound, it therefore allows a single investigation of linearity to settle the question for the complete instrument at the time involved. The double-aperture method is the most accurate , sound, simple and foolproof technique that we know of for testing linearity in a manual single-beam dc-mode instrument.
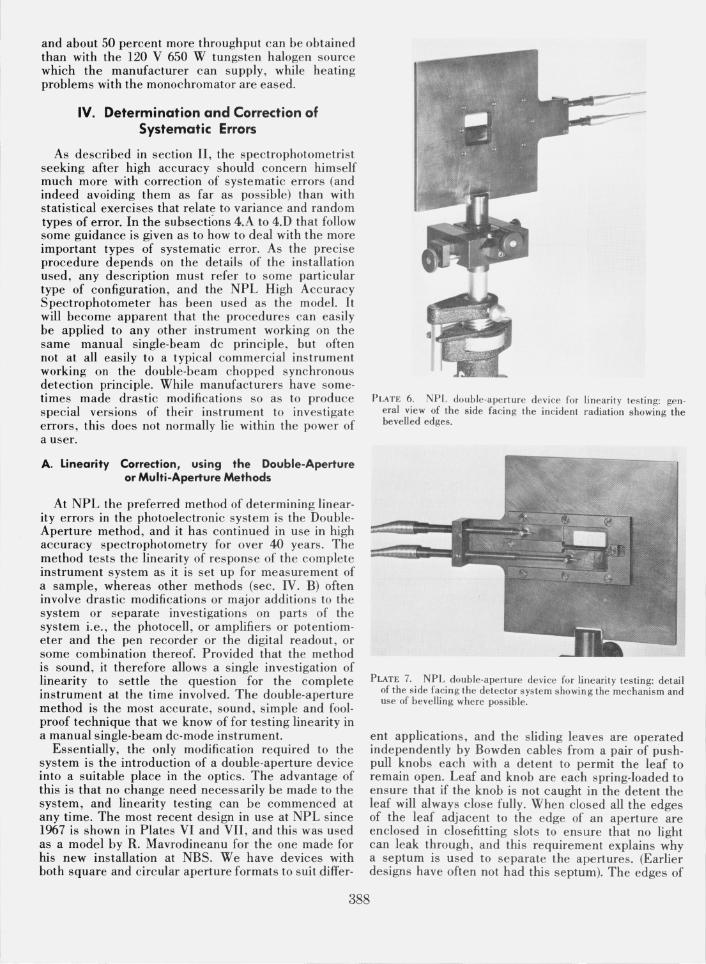
Essentially, the only modification required to the system is the introduction of a double-aperture device into a suitable place in the optics. The advantage of this is that no change need necessarily be made to the system, and linearity testing can be commenced at any time. The most recent design in use at NPL since 1967 is shown in Plates VI and VII, and this was used as a model by R. Mavrodineanu for the one made for his new installation at NBS. We have devices with both square and circular aperture formats to suit differ-
388
PLATE 6. NPL double-aperture device for unearity testing: general view of the side facing the incident radiation showing the bevelled edges.
PLATE 7. NPL double-aperture device for linearity testing: detail of the side facing the detector system showing the mechanism and use of bevelling where possible.
ent applications, and the sliding leaves are operated independently by Bowden cables from a pair of pushpull knobs each with a detent to permit the leaf to remain open. Leaf and knob are each spring-loaded to ensure that if the knob is not caught in the detent the leaf will always close fully. When closed all the edges of the leaf adjacent to the edge of an aperture are enclosed in closefitting slots to ensure that no light can leak through, and this requirement explains why a septum is used to separate the apertures. (Earlier designs have often not had this septum). The edges of
the apertures are bevelled on both sides where pos· sible, and the brass used in construction of the aperture plate and leaves is chemically blackened. This black· ening leaves a weak specular component of reflection but very little diffuse component, and to prevent reo flections of light back to some preceding optical com· ponent and thence back through one or both of the apertures, the whole device is slightly rotated about a vertical axis from the perpendicular orientation when being aligned.
The double·aperture device permits the departure from linearity of the complete instrument to be meas' ured over any 2: 1 step within the range of the photo· metric scale, and the procedure is first to place and align the device in a suitable part of the optical system (see later) and adjust the vertical position until the readings of each aperture (the other being shut) are approximately equal. If the readings from each aper· ture alone are A and B, those from both together are (A + B), and those with both shut are D, then a minimal sequence of readings is
DAB (A + B) (A + B) BAD
and this would be called a single·volley set. This is of course a time·symmetrical sequence to minimise drift and variance effects, and equal numbers of obser· vations of each type are made to give equal statistical weight. For more accurate work, double·or·triple volley sets of observations are made for any particular 2: 1 step. If the mean values of each type of reading are calculated then the linearity error € is calculated as
e= [A + B- (A + B) -D]/[(A +B) - D].
The error € is normally expressed as a percentage, and the correction to be applied to a measured photo· metric value of 50 percent over the corresponding part of the scale is - €.
But what if the photometric value to be corrected is not 50 percent, or is not measured over precisely the same part of the scale? To cope with the general case the procedure is to cascade the linearity testing in binary steps, so that if the first step involves output readings of full scale (f.s.) and 50 percent f.s., then the second step involves outputs of 50 percent f.s. and 25 percent f.s., the third step 25 percent f.s. and 12i percent f.s., and so on. Various methods can be used to reduce the (A + B) reading of the nth step to the A reading of the (n-l)th step, such as reduction of lamp power, slit widths or use of a supplementary attenuator such as a filter. The settings of the suc· cessive steps to half the readings of the preceding step need not be closer than 1 percent of the value. This, and the fact that the A and B readings need not be equal to closer than 1 percent of the value, arises because the input·output relationship of the photo· electronic system, if not exactly linear, is always at least a smooth continuous function and approximately linear in any instrument that is in sound operating condition.
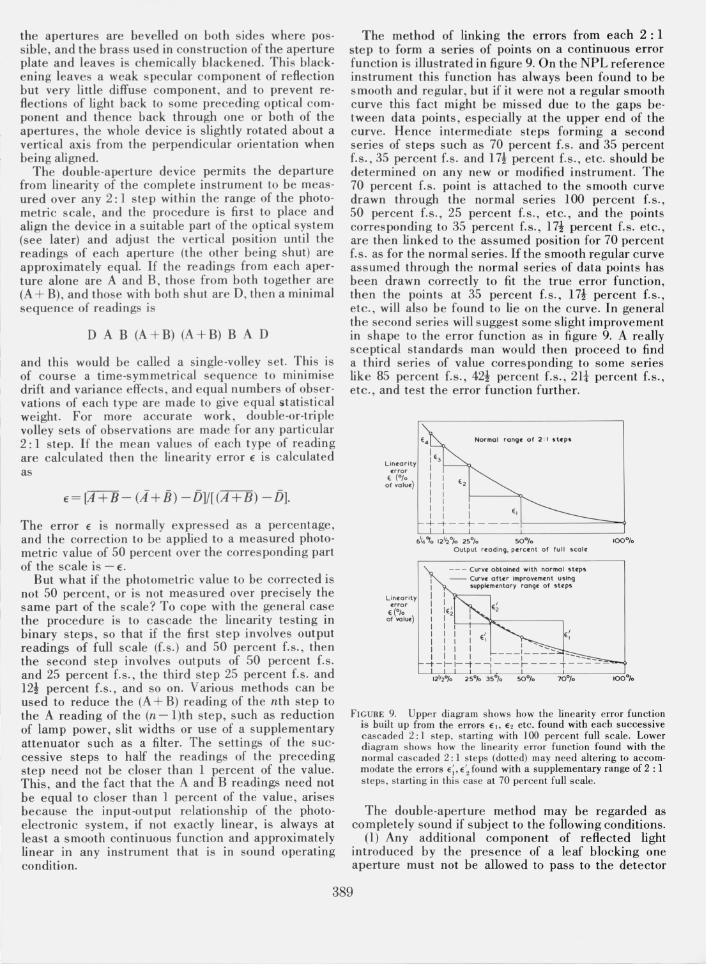
The method of linking the errors from each 2 : 1 step to form a series of points on a continuous error function is illustrated in figure 9. On the NPL reference instrument this function has always been found to be smooth and regular, but if it were not a regular s mooth curve this fact might be missed due to the gaps be· tween data points, especially at the upper end of the curve. Hence intermediate steps forming a second series of steps such as 70 percent f.s. and 35 percent f.s.,35 percent f.s. and 17i percent f.s., etc. should be determined on any new or modified instrument. The 70 percent f.s. point is attached to the s mooth curve drawn through the normal series 100 percent f.s. , 50 percent f.s., 25 percent f.s ., etc., and the points corresponding to 35 percent f.s., l7i percent f.s. e tc., are then linked to the assumed position for 70 percent f.s. as for the normal series. If the s mooth regular curve assumed through the normal series of data points has been drawn correctly to fit the true error fun ction, then the points at 35 percent f.s., 17i percent f.s., etc., will also be found to lie on the curve. In general the second series will suggest some slight improvement in shape to the error function as in figure 9. A really sceptical standards man would then proceed to find a third series of value corresponding to some seri es like 85 percent f.s., 42i percent f.s., 2It percent f.s., etc., and test the error function further.
Linc:orily «fror
€ (OJ. of value:)
Unc:ority «fror
€ (0'0 of value:)
Normal range: of 2 : I ~tc:ps
I I (, - - t- - - --f-, - ------'=-¢
Output rc:odir'l<J. pc:rcc:nl of full !.calc:
- - - Curve: obtainc:d with normal SUps
I - Curve: after improvc:mc:nt using I supplc:mc:ntory range: o f !otc:ps
I I I I I I
i I I I I '--_ I I I I I ---:----,·t-----_ ~-~~~-~ - --~---T- -- --
FIGURE 9. Uppp.r diagram shows how the linearity error fun ction is built up from the errors "" '" etc. found with each successive cascaded 2: 1 step, starti ng with 100 percent full scale . Lower diagram shows how the linearity error function found with the normal cascaded 2: 1 s teps (dotted) may need altering to accommodate the errors ,,;, E', found with a supplementary range of 2 : 1 steps, starting in this case at 70 percent full scale.
The double·aperture method may be regarded as completely sound if subject to the following conditions.
(1) Any additional component of reflected light introduced by the presence of a leaf blocking one aperture must not be allowed to pass to the detector
389
by the other aperture or by any other stray light path. This is met by keeping the double-aperture devices as far from other optical components on the illuminated side as practicable, by masking any bright parts of these components with black flock paper and by tilting the device slightly as mentioned before.
(2) By the same argument , there must be no alteration of reading from one aperture due to changes in interreflected components on the detector side of the device caused by alteration of the other aperture leaf. This is met by keeping the double-aperture device as far from optical components on the detector side as possible.
(3) There must be no relative change of light distribution at the double-aperture during a volley of observations. Apart from trying to prevent relative movement (not always completely possible, due to the need for adjustability and the opening and closing forces imposed), the light distribution should be as uniform as possible and slightly larger than the size of the double-aperture, so that to first order any relative movement produces no variation of reading.
(4) There must be no change of light distribution at the actual detector surface during a volley of observations, since an ideal filter inserted into the beam for measurement will cause no such change. In the NPL instrument the use of the integrating sphere as a diffusing device ensures that this condition is met. If the double-aperture device were focused onto the photocathode, the test would not be valid since when both apertures are open for (A + B) there would be two separate portions of the cathode acting like two photocells in parallel, and an intrinsic nonlinearity would not be detected if two photoelectron streams remained reasonably separate as in many types of photomulti pli er.
(5) There must be no optical interference between the fluxes transmitted through each aperture. According to K. G. Birch of Optical Metrology Division, NPL this condition is met for all practical purposes in typically dimensioned equipment when conventional tungsten or discharge sources are used, provided that slit widths are not reduced below 0.002 mm during the linearity testing.
A consequence of (1) and (2) above is that at NPL we usually change the optical system within the photometric enclosure for linearity testing to allow the double-aperture device to be as far from other optical components as practicable.
The freedom from optical interference effects mentioned at (5) above arises because with slit widths commonly met with and with. conventional sources the "coherence patch" at the double-aperture device is not large enough to straddle the septum, which is of order 3 mm wide. However to make doubly sure that interference effects cannot invalidate the test, the practice at NPL is to actually focus the doubleaperture onto the target screen- in the integrating sphere in front of the detector. Then even if the "coherence patch" were to cover the whole doubleaperture, there would be no overlap of the fluxes from each aperture at the screen where they receive their
first diffusion, so that no fringes could be formed there. The region of the slit image is the only. place where fringes could be formed, and we make sure that the mirror or lens which images the double-aperture onto the target screen is not in this region as such fringes could interact with flaws, blemishes or dust particles to give readings capriciously high or low according to the precise relative positioning.
For systems employing temporal or spatio-temporal chopping of the light, a further condition must be met.
(6) There must be no change in the temporal features of the waveform reaching the detector between the three types of reading, A, B, or (A + B), whether of shape or phase: only a strict change of amplitude is permitted. This cannot be met if the light distribution of the beam alters at all during the sampling time , due to actual movement or due to sector-mirrors or rocking mirrors having a non-uniform reflectance due to poor coating, ageing, dust or pollution.
The requirement (6) arises because no ac-detector circuit (tuned narrow-band, synchronous sine-wave, synchronous square-wave, homodyne, heterodyne , or any other type) is ideal in the sense that it functions exactly as supposed, and changes of waveform shape or phase at a given amplitude will therefore generally cause a spurious change of output. This condition (6) can seldom be proved to be met in commercial instruments.
1 ~2% I " , II I I I I
3%6% 1211:z% 25% 50% 100% 0 -0 : I -.l - 1- - - f- - - - - - - 1- - - - - - -- - - - - - - - - '.000
II I I I I I
:!: ::: : I: I I I : /./.~/:;.' I I) I I I I .....:: "/ I I I I I I ... /~: .... /
-0 '1 I : : : /_ ",," 0 .999 Linearity : : ) ll"..,/ /",/ nchor point for Lin~arily
correct ion I I I /",, 0 ",,/ supp~me'nlary correction (% of I I ,/ /~ rangt of 2 : 1 stlps foctor
value ) II I ',/ "'" I II I I /);- .... / I I I I ",. ",,"" I
-0'2 I I .",...1(;'/// : 0 -998 II I "",/ >ft>< '
EHT Ruistor Wavelength (n m)
II I +/ .... "1 I i 1//' // I Iy~/)/ I ;7,~ I
-O'3 :v~' : : 111 I I I I I I I
I
volt!. R ohms
750 3 . 10' 950 3 10' 750 107 950 107
436 550 740 v x . 0 D . 0 +
0
0 '4 O'b 0 '8 ' ·0 ' ·2 1'4 I ·b 1·8 2·0
Output rc:ading (voll!. )
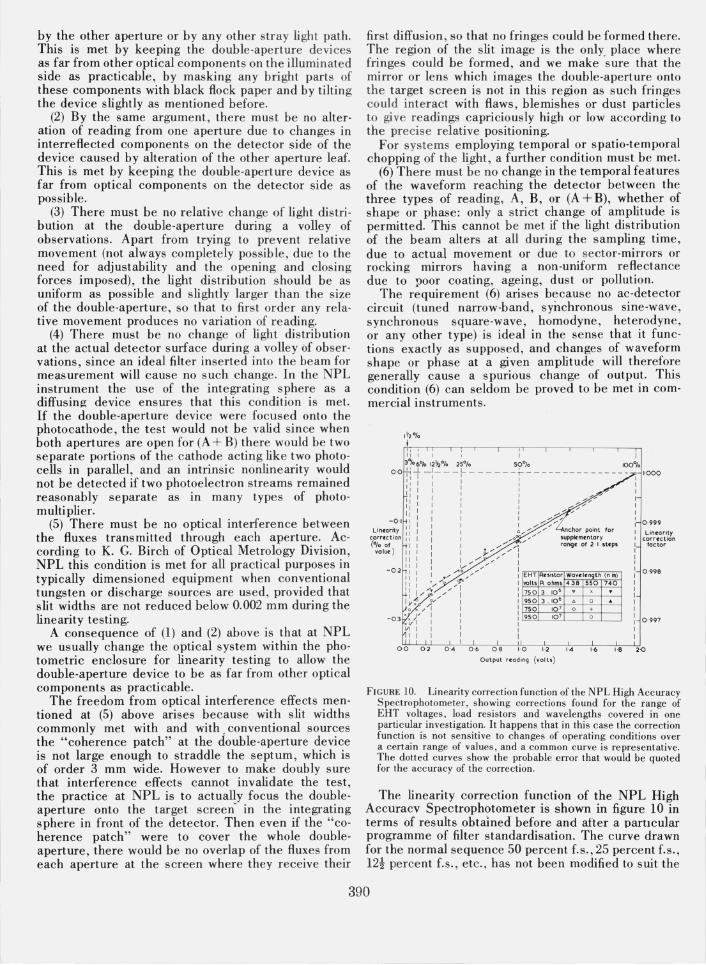
FIGURE 10. Linearity correction function of the NPL High Accuracy Spectrophotometer, showing corrections found for the range of EHT voltages, load resistors and wavelengths covered in one particular investigation. It happens that in this case the correction function is not sensitive to changes of operating conditions over a certain range of values, and a common curve is representative. The dotted curves show the probable error that would be quoted for the accuracy of the correction.
The linearity correction function of the NPL High Accuracv Spectrophotometer is shown in figure 10 'in terms of results obtalnea before and after a particular programme of filter standardisation. The curve drawn for the normal sequence 50 percent f.s., 25 percent f.s., 12t percent f.s., etc., has not been modified to suit the
390
-------~---------------
sequence 70 percent £'s., 3S percent [.s., 17t percent f.s., etc. Results are shown for the two values of dynode load resistor used, for different values of photomultiplier E.H.T., and for several wavelengths. Strictly speaking one should not assume that the cor· rection reqllired is the same when any of these key parameters is varied; however it can be seen that the correction function turned out to be not significantly different in any of the cases tested. In general, there is usually a preferred range of output currentE.H.T. combinations where an invariant and almost linear cha.racteristic is obtained for the photocell. However departure from Ohm's Law behaviour of the load resistor is often a larger source of linearity failure than the photocell itself in well-designed systems, so each load resistor needs a separate in· vestigation. As it ~as been found that the linearity correction function has remained stable over a period of several years, no attempt has been made to find load resistors that are more nearly ohmic in characteristic: a survey of resistors with thorough testing of all available types and ratings of interest would prove too costly to be justified in these circumstances.
It is not necessary to test linearity at different wavelengths unless it is thought possible that different mechanisms might then be operative in the photodetector. Some photocells do indeed have different characteristics in certain wavelength regions, usually at the long wave end of their spectral response. So when a new instrument or photocell is being tested for linearity , several wavelengths covering the whole range of spectral response should be used to check this point.
The multi-aperture method, commonly employing ten apertures, is but a variant of the double-aperture method, and is equally sound in principle. It has been used at NPL by lamp standards photometrists, whose needs are not quite so exacting as s pectrophotometrists. In fact the multi-aperture method cannot be made as accurate as the double-aperture method with a given number of observations on a particular aperture combination, because it is impracticable to use a time-symmetrical sequence of readings which allow the values
A, (A+B), (A+B+C), ... (A+B+C+D+E+ F + G+ H + 1+ J) to be determined with equal and optimum accuracy relative to each other so as to produce ten points on the error function of equal uncertainty. To get results of equivalent accuracy, the demands on system stability are rather greater than with the double-aperture approach.
The double-aperture method allows the linearity correction reqllired for any given 2: 1 step to be determined to a few parts or less in 104 , depending on the number of volleys of readings used. The accumulation of probable error for cascaded steps is illustrated in figure 10.
B_ Linearity Correction, Using Other Methods
A great many approaches have been suggested over the years to the problem of determining linearity errors, and it is not proposed to review them critically
------_._- - - -- _.
in this paper as each would need a section equivalent to the preceding one to cover relevant points thoroughly. In this section some indications will be given as to why these other approaches are not preferred at NPL. In essence they nearly all amount to employment of a device or equipment which varies the irradiance at the photo detector in a predictable or calculable manner. Methods which involve the photocell being removed and tested away from the rest of the spectrophotometer can tell us much about the photocell but require supplementary investigations to be carried out on the rest of the photoelectronic system, for example on the Ohm's Law behaviour of the load resistors. Since even when this has been done, assumptions have to be made as to how the photocell might behave when in the instrument and connected into the system circuitry, such an approach cannot be regarded as foolproof. To give illustrations, temperature rises, magnetic fields, earth loops or cross modulation effects within an instrument can give rise to real or apparent linearity departures which have confused many an unwary investigator.
The double and multiple aperture methods are examples of the general principle of addition of fluxes, and the other methods which use this principle are equally sound but are difficult to implement experimentally with sufficient rigour. The use of several sources is clumsy as demands on the stability of the optics and the sources are great, and the apparatus is bulky. The device of using one source but multibeam optics avoids severe source problems but leaves the problem of optical stability. Where beam-splitters are used for dividing or recombining the beams, the problems of polarisation , scatter and multiple reflections have to be faced, and where one source is used the interference effects are more likely to be troublesome than with the multi-aperture method becaus.e optical superposition of related wave fronts is more closely achieved. Beam-splitters are in general spectrally selective, and this makes their use for linearity testing difficult over a wide spectral range.
A pair of plane polarising devices used as polariser and analyser offers a possibility of producing a net transmittance varying predictably as a function of the angle of rotation of the analyser. Most polarisers (sheet polarisers, Brewster windows and electrooptic devices) are too poor in quality and too spectrally selective to be taken seriously, but polarising prisms of high quality have been used in attempts to obtain accura~e linearity testing. The problem here is that the predicted law is only obeyed in practice over a limited range of optical density (absorbance) for as the "crossed" position is approached the optical density starts to change very rapidly making the orientation and alignment very critical, and at densities above unity the slightest flaw, surface blemish, or foreign particle on the intermediate surfaces causes partial depolarisation and hence a breakdown of the predicted law. Another problem is that the light passed by the analyser is plane polarised and at varying orientations, and most photodetectors are sensitive to polarisation effects to some extent. Unfortunately
391
470-063 OL - 72 - 2
,--
It IS not possible fully to depolarise plane-polarised light by means of a single diffusion, by reflection from smoked or pressed magnesium oxide or from opal glass, or by transmission through opal glass when its transmittance is of reasonable magnitude.
The inverse square law has often been used as a means of controlling the flux incident on a photocell in a predictable manner, but it is not good enough for work of the highest accuracy due to the nonuniform radiation field emitted by practical sources. If the source and detector apertures are finite, a correction to the inverse-square law has to be calculated using configuration integrals (a. process sometimes called calculation of the mutual exchange coefficient), but this assumes a Lambertian (Cosine Law) behaviour of source emission and detector response. Practical sources and detectors never obey Lambert's Law closely. I myself have used pot opal glass as a secondary source, carefully masked to give a known aperture and with a tungsten ribbon source fo'cused on the far side, but have not obtained good enough obedience to Lambert's Law: the departure from Lambert's Law is very difficult to measure by goniophotometry to sufficient accuracy to calculate an adequate correction, and is wavelength dependent. A "black body" source might prove acceptably Lambertian, but its defining aperture presents severe difficulties.
Variable apertures are another old favourite for producing a controlled attenuation of flux, but the method is generally unsound because of the impossibility of producing an optical beam in a spectrophotometer of uniform radiance cross-section. To overcome this the division of the aperture into numerous small variable apertures has been tried using combs, rotating grilles and venetian blind devices. The problem then becomes a geometrical on~ of realising the desired construction by precision engineering, and high accuracy cannot be achieved reliably. An alternative approach is to use fixed meshes or perforated screens as attenuators, but they too require calibration by some metrological procedure and this is unsound because not only is transmitted light lost in an instrument by diffraction but also for small apertures the effective area for transmission is less than the metrological area. This last point arises because radiant energy is absorbed for a distance of the order of its wavelength away from any metal edge: this effect of physical optics is too complicated to permit of any adequate calculations for a correction in any real situation.
Testing for obedience to Bouguer's Law or Beer's Law is another much used method of testing linearity, especially among chemists. However it is fallacious, for if these laws are verified for an instrument it only establishes that the photoelectronic system obeys a simple power law, not that the power (exponent) is exactly unity. In fact some particular faults in photoelectronic systems lead to precisely this type of nonlinearity, so that the method can be dangerously reassuring. Apart from this, Beer's Law seems to be exactly obeyed in remarkably few of the solutions
that have been rigorously examined. The usual form of application involves cuvettes of varying path length or solutions of varying concentration. A variant is the technique suggested by Campbell in the 1930's but resurrected by Slavin and Porro [24], of grinding and polishing homogeneously absorbing glass to different thicknesses and verifying whether the density (absorbance) is proportional to thickness after allowing for reflection losses. This is equally fallacious of course.
Sector discs are an important method of accurate attenuation, and they are spectrally nonselective, not sensitive to polarisation and relatively easy to construct accurately and measure metrologically. If the Talbot-Plateau Law is obeyed the transmittance is linearly proportional to the angular opening. The problem is whether the detector really obeys the Talbot-Plateau Law: while many solid-state types do not, it happens that with suitable circuitry and choice of operating conditions vacuum photoemissive devices obey the law very closely indeed. This has led to the development of the technique of Time Ratio Photometry at NPL, as described in section V.
c. Heterochromatic Stray Light
The unqualified term "stray light" in spectrophotometry usually means heterochromatic stray light i.e., light transmitted by the monochromator that is outside the required or set waveband. There are in fact other types of stray light, referred to in the following section IV. D. ' Heterochromatic stray light arises from thre€ main causes: general small angle and wide angle scatter from dust, blemishes and pollution of optical surfaces; stray reflections, especially where lenses or prisms are used; and unwanted orders of diffraction in grating instruments. General scatter is usually the worst culprit, and because of this it nearly always happens that the components of stray light become progressively smaller as their wavelengths depart further from the set wavelength.
The obvious approach in reducing errors is to purchase a high quality double-monochromator, and for guidance we would rank the different types of system in the following order for stray light: best is prismprism, then prism-grating and finally grating-grating. However, even with such an instrument there are circumstances when significant heterochromatic stray light errors can arise. This is most commonly met at the long wave limit of ultraviolet and visible instruments, where a photomultiplier is used and particularly where a grating has been blazed for optimum performance in the awkward 280 nm to 340 nm region where one changes from an incandescent lamp to a hydrogen or deuterium arc. That choice of blaze has of course been dictated by the need to increase net response in this latter region and reduce heterochromatic stray light there, for this region is the second most suspect, apart from the region of short wave cutoff imposed by air and silica absorption at around 185 nm. For any source-detector combination the error is maximal where the net response is very low compared with the average over the usable range and
392
where the spectral gradient of response is steep, and this normally occurs near the limit of the usable range. It is for this reason that we are prepared to sacrifice peak quantum efficiency if necessary in order to obtain a less steep spectral gradient of response at the red end of the working range.
The general method of testing for errors is to use selective band or cutoff filters, and is well enough known to need no description here. It is important to check that introduction of the selective filter has no adverse optical effect. A convenient place to introduce such a filter into a common-p~th part of the system in a double-beam system is between the source and entrance slit, but this may alter the light distribution at both slit and field aperture and hence give a bias to the reading other than due to its absorption properties. It is therefore particularly important to adhere to the strict substitution principle in making the additional measurements. The same requirement applies equally when matched pairs of selective filters (even if of high quality and closely matched) are introduced into the sample and comparison beams of double-beam instruments.
D_ Homochromatic Stray Light
Homochromatic stray light is any light which is present in addition to the light which has passed to the point in question along the optical system in the desired manner, and which is of approximately the same spectral distribution. Thus it means in practice all stray radiation except the heterochromatic stray light from the monochromator or any leakage of ambient light through chinks in the casing. (Leakage of ambient light becomes obvious if one switches off or covers all light sources in the room and blacks out the windows and one can then detect an alteration of output or of operating conditions. and this will not be commented on further.) Homochromatic stray light usually arises from specular or diffuse reflections, or from diffuse components of transmitted light in the case of transmitting elements of the system, and consists in general of light which has departed from its desired optical path and which somehow re-enters the system so as to be included with the required light being measured. There are so many mechanisms by which this can happen, and they are so particular to the precise optical configuration, that one cannot discuss the various possibilities in any general way. I will only mention therefore a few specific types of homochromatic stray light and how we deal with them.
Interreflections, involving specular reflections from optical surfaces or from bright metal components like slit jaws, and lens or mirror mounts , have two effects: if they involve the reflection from the sample itself then they impose a direct error on the photometric value being measured, whereas if they are independent of the sample itself they only impose an indirect error due to the spatial or angular distributions of illumination and collection not being quite as required. Tilting the sample usually reveals the direct type of error, but there is one circumstance (commonly met with in commercial instruments) where this is not
necessarily so. I refer to the practice of placing a filter or cuvette at a slit image to minimise beam movements at a conjugate image formed at the detector. If an optical surface at a slit image is tilted slightly the reflected beam is deviated to cover a slightly different part of the aperture of the mirror or lens which has focussed the radiation, but a slit image will still be formed from the reflected light back at the exit slit of the monochromator, and it will not move. As slit jaws are bright-edged and either flat to the outside world or bevelled (often at 45°), and as monochromators often have plain windows there to prevent entry of the atmosphere or its pollutants, it is clear that there is usually a reflection back once more down the optical system towards sample and detector, and this will be focussed yet again to form an image at the specimen. Direct errors from interreflections can also occur on the detector side of the sample, especially if a bare (diffuserless) end-window photomultiplier receives light normally. In NPL standards work the sample is therefore never placed at a slit image if this can be avoided. The presence of both types of interreflection (i.e., involving the sample or not) can be checked most readily by eye using a dental mirror.
Both specular and diffuse reflections often occur at surfaces close to the beam and parallel to it, such as inner surfaces of lens or mirror mounts or tubes, and the cure is to add suitably shaped and dimensioned stops in the system. Stray specular reflections may strike the instrument casing or other parts and be diffusely or s pecularly reflected so as to "by-pass" the sample. This provides a further argument for a large photometric enclosure (sample compartment). This type of effect can cause serious errors in very dark samples, and a routine practice is to place a dummy (black) sample in the sample position and of identical dimensions to the sample and then take dark readings, and compare them with the more normal dark readings obtained by blocking the beam prior to entry into the photometric enclosure. The latter reading gives the photoelectronic system component of dark error (assuming there is no leakage of ambient light), whereas the difference in these readings gives the optical component of dark error. This procedure is very important in total and diffuse reflectance measurements, for small angle scatter in the sample beam optics preceding the integrating sphere causes a halo of scattered light surrounding the illuminating patch on the sample, both on the outer parts of the sample and on the sphere wall. In this case the "black" sample consists of a blackened cavity brought up against the sample port, and the error is usually the largest component of systematic error found in reflectance measurements, representing a zero offset ranging from roughly 0.1 percent in the infrared (2 p.m) to roughly 0.5 percent in the ultraviolet (0.3 p.m) in reflectance value but depending on the condition of the preceding optical surfaces. For transmittance measurements an opaque dummy is used, with a mirror or matt white surface attached in some cases to exaggerate particular types of stray light effect.
393
Samples should always be masked so as to cover their edges and have an opaque surround. This is to prevent by-passing of light , especially in small specimens, for it is not uncommon for stray reflections or small angle scatter to produce a weak flux distribution alongside or surrounding the beam: again I emphasise the use of the eye looking along the direction of the beam. The reference sample (or the absence of a sample for an "open" reading in absolute transmittance) must also have precisely the same masking present, to prevent systematic error. However these local masks on the sample carriage are not sufficient: it is also necessary to have a fixed mask as close as possible forming a locally limiting stop. This is to cover the possibility that the sample and reference masks do not assume the same position due to misalignment on the carriage or faulty adjustment of the stops on the carriage guides, or that they are not precisely the same size and shape. The fixed mask should either be slightly larger than the beam cross-section there, with clearance all round, or it should be smaller than the nearly uniform "core" of the beam cross-section. This is to obtain optimum photometric stability if one accepts that some slight relative movement of optical components might occur.
At NPL the direct interreflection error (involving the sample itself) is avoided by tilting the filter by an angle of order 10 , keeping the solid angle of illumination down to half-cone values of under 10 , avoiding forming a slight image at or near the filt er, and catching the beam reflected back on to a piece of black velvet or flock paper placed just to the side of the exit slit. Even with such precautions , recent investigations with highly reflecting filters have shown that great care needs to be taken with metal-film or thin-film filters, and errors are likely to be appreciably greater than with normal absorbing filters.
Phenomena which can give rise to systematic errors in spectrophotometry are photochromism, thermochromism and fluorescence; but these could arguably be regarded as defects in the sample rather than defects in the measurement procedure. As with testing for heterochromatic stray light, the principles of testing for these phenomena are well known and largely common sense once the nature of the problem is understood, and further comment will not be made here.
E. Polarisation Errors
If we confine our attention to the normal isotropic materials used in standards and calibration work, then Fresnel's Equations tell us that for light incident or reflected at normal incidence polarisation has no effect on the measurement , while for angles near to normal polarisation effects are negligible. This is fortunate, for all monochromators produce a partial plane polarisation that is very significant, and it means that transmittance measurements are usually not subject to a significant error due to polarisation effects. For measurements of direct reflectance , diffuse reflectance or of radiance factor involving inclinations above 10° from normal however, certain
precautions must always be taken as explained below. The proportion of polarisation varies appreciably
from monochromator to monochromator, so it is never satisfactory to quote a measurement which refers to the particular polarisation conditions (often not known reliably) in one particular instrument only. So we must specify "standard" conditions: but what are these? There are 3 obvious candidates: 100 percent s-polarised light, 100 percent p-polarised light, or randomly polarised light. The most generally useful value for a photometric quantity is the one which refers to randomly polarised light. Unfortunately randomly polarised incident irradiances and collector/detector systems not selective for polarisation are almost impossible to produce in instruments without sacrificing light by the use of heavy diffusion, and one therefore measures the quantity with a plane polariser present in either the irradiating or the collecting system or both, depending on which of these are inclined at appreciable angles to normal. This results in two (or sometimes four) measurements being made. and the required result for randomly polarised light is easily calculated from these as ~! is the arithmetic mean of the measure-ments.
v. Time Ratio Photometry
A few years ago o. C. Jones and I invented a new technique of photometry [25, 26] aimed at equalling or perhaps surpassing the accuracy achievable by the dc single-beam method, which relies as we have seen earlier on the close approximation to true linear behaviour of certain preferred types of photoemissive detector and on the fact that any slight non-linearity found in such systems is very stable and therefore accurately correctable by use of the cascaded doubleaperture method of linearity testing. Our aim was to develop an independent scale for determining photometric ratios by which we could verify the validity of the existing method. At the same time we wanted the technique to be self-calibrating and not relying on corrections determined on another occasion, and also more suited to exploitatiop, of modern developments in digital data techniques.
A. Talbot's Law and the Principle of Time Ratio Photom.etry
Talbot's Law, sometimes called the Talbot-Plateau Law, states that light fluctuating periodically above the critical fusion frequency of vision is exactly equivalent to steady radiation of the same average value, and the law was of course discovered (in 1834) in connection with the response of the human eye. Mathematically, if F (t) is the periodically fluctuating light and R, is the response evoked,
R {F(t)} = R {F}
where
F= I F(~dt. 394
In 1913 Marx and Lichtenecker found that Talbot' Law applied also to vacuum photoemissive cells, as far as could be judged with the accuracy possible at that time. For a photocell that obeys Talbot's Law the mean photocurrent observed with a periodically fluctuating illumination is the same as that obtained if the incident flux is distributed uniformly throughout the duration of the period. For this to be true in practice, the associated e.lectrical circuit must be linear and with an appropriate overall time constant. The linearity is necessary to prevent rectification, whereby energy can be transferred from the oscillatory terms to the cons tant term in the Fourier series for the chopped waveform as a function of time. In passing I would point out that linearity of the circuit elements is also necessary in the cognate case of tuned or phase sensitive detector systems, to prevent errors due to cross modulation.
In 1929 Carruthers and Harrison working at NPL [27], found strict obedience to Talbot's Law for a variety of photoemissive cells, including some that were markedlynonli"ear as judged by their steadystate behaviour. It would not be out of place to emphasise that if a sector disc, whose opening is say 10 percent of its circumference, is inserted in a beam of light falling on a photocell obeying Talbot's Law, it is not correct to assume "that the photocurrent falls to 10 percent of its former value. That will only be true if the photocell happens to have a linear characteristic as well as obeying Talbot's Law. What Talbot's Law does say is that the photocurrent falls to the same value that obtains if a 10 percent filter is inserted in the beam.
To consider th e essence of the time ratio method, let us assume that one is trying to measure the transmittance of a filter. The method is, however, readily applicable to other types of photometric measurement. Imagine a steady beam of light illuminating a photoemissive cell with a suitable dc-measuring circuit. One needs a repetitive shutter, which opens and closes fully, and whose open-to-shut time ratio can be varied. The photocurrent obtained with the shutter open and the filter attenuating the beam is noted, then the filter is removed and the shutter sequence is started. The fraction of the total time during which the shutter is open is varied until the same photocurrent is obtained, then some accurate timing technique is employed to measure this time-ratio. The transmittance of the filter is then equal to the fraction of time for which the shutter was open, provided that the photometric detector obeys Talbot's Law. It is as simple as that. "
The beauty of the method is that the shutter can be calibrated absolutely, in terms of time, in situ, and even simultaneously with the measurement as described later. Thus the shutter need not possess long term stability of characteristics: an adjusted value need only be held for a few seconds at a time.
It would be appropriate to break off for a moment to consider what is really happening, that a vacuum photoemissive device can adhere exactly to Talbot's Law yet give a s lightly nonlinear response to steady
radiation. The three important fa:ctors in this are: Firstly, the cell has an intrinsic response time of
order 10-9 second, which is much shorter than any chopping period that would be employed. Secondly, the cell has an instantaneous intrinsic response that is normally strictly linear, if it could be measured a few J-tS after a change of illumination with some suitable fast circuit, this instantaneous linearity not being affected by previous illumination. Thirdly, the cell possesses a relatively slow fatigue or drift characteristic whereby the observed photosensitivity changes progressively under illumination.
In our technique, if the cell obeys Talbot's Law, drift or fatigue do not affect the measurement, because the output produced by chopped radiation must suffer exactly the same drift or fatigue as that arising with steady radiation of the same average value. Otherwise the cell would not obey Talbot's Law.
B. Experimental Verification
We can now look at the experimental work carried out at NPL to see a selection of the evidence relating to the accuracy and the generality of Talbot's Law obedience in actual specimens of photoemissive detectors. The finer details of experi"mental technique and methodology will be omitted for brevity in this description of the work. Figure 11 shows the optical and electronic arrangement used in the initial studies. Later work has used modified systems of the same general kind. The variable shutter chops a slit image to provide a full on-off modulation with a fast rise time of a few microseconds, and for all our accurate fundamental work we have used a variety of sector discs. We have favoured mechanical or electro-mechanical shutters throughout, for such devices really do provi~e complete and stable mod\.!lation irrespective of wavelength , polarisation or angle of inciden'ce.
A fraction of the light passed by the shutter is received via a beam-splitter at a supplementary gating photocell, which was a spare photomultiplier of no great quality. This had the function of simply opening and closing electronic gates rapidly to permit pulses from a stable 100 KHz oscillator to pass to counters as appropriate. Most of the light in the beam reached photodetector A, which in these first experiments was connected to one of several types of dc-electrometer current-amplifier via adjustable smoothing filters, the dc-null-balance technique being employed. The electroll1P-ter null-balance system shown in figure 4 was used for much of the work on photomultipliers. In some of the later experiments, a digital voltmeter was used to indicate directly the residual difference between the signal and a backing-off voltage: the backing-off technique proved very helpful in respect of the compromise needed between smoothing and slewing rate.
We have emphasised small transmission factors of order 1 percent in most of the work, due to the fact that the differences in waveform and instantaneous values between the test and comparison fluxes are then most pronounced, and impose the most difficult sampling conditions. Work on a vacuum photo-diode was carried
395
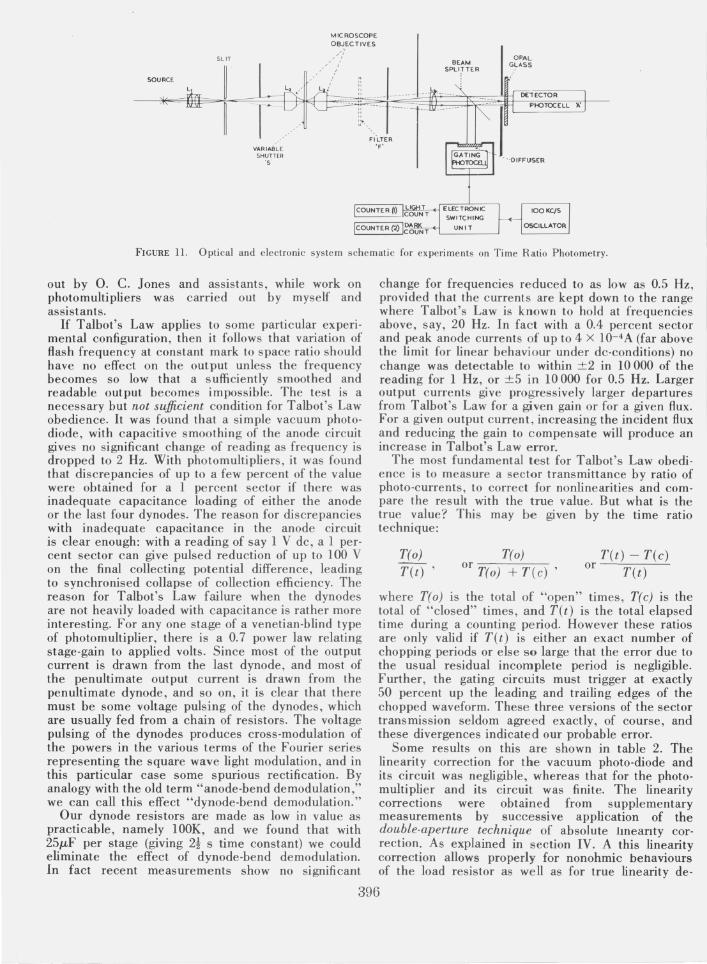
SLIT
SOURCE
VARIABLE SHUTTER
'5'
MICROSCOPE OBJECTIVE.S
BEAM SPU;rTER
OPAL GI,.ASS
[)ErECTOR
PHOTtXE.ll ),'
FIGURE 11. Optical and electronic system schematic for experiments on Time Ratio Photometry.
out by O. C. Jones and assistants, while work on photomultipliers was carried out by myself and assistants.
If Talbot's Law applies to some particular experimental configuration, then it follows that variation of flash frequency at constant mark to space ratio should have no effect on the output unless the frequency becomes so low that a sufficiently smoothed and readable output becomes impossible. The test is a necessary but not sufficient condition for Talbot's Law obedience. It was found that a simple vacuum photodiode, with capacitive smoothing of the anode circuit gives no significant change of reading as frequency is dropped to 2 Hz. With photomultipliers, it was found that discrepancies of up to a few percent of the value were obtained for a 1 percent sector if there was inadequate capacitance loading of either the anode or the last four dynodes. The reason for discrepancies with inadequate capacitance in the anode circuit is clear enough: with a reading of say 1 V dc, a 1 percent sector can give pulsed reduction of up to 100 V on the final collecting potential difference, leading to synchronised collapse of collection efficiency. The reason for Talbot's Law failure when the dynodes are not heavily loaded with capacitance is rather more interesting. For anyone stage of a venetian-blind type of photomultiplier, there is a 0.7 power law relating stage-gain to applied volts. Since most of the output current is drawn from the last dynode, and most of the penultimate output current is drawn from the penultimate dynode, and so on, it is clear that there must be some voltage pulsing of the dynodes, which are usually fed from a chain of resistors. The voltage pulsing of the dynodes produces cross-modulation of the powers in the various terms of the Fourier series representing the square wave light modulation, and in this particular case some spurious rectification. By analogy with the old term "anode-bend demodulation," we can call this effect "dynode-bend demodulation."
Our dynode resistors are made as low in value as practicable, namely lOOK, and we found that with 25/-tF per stage (giving 2t s time constant) we could eliminate the effect of dynode-bend demodulation. In fact recent measurements show no significant
change for frequencies reduced to as low as 0.5 Hz, provided that the currents are kept down to the range where Talbot's Law is known to hold at frequencies above, say, 20 Hz. In fact with a 0.4 percent sector and peak anode currents of up to 4 X 10⁻⁴ A (far above the limit for linear behaviour under dc-conditions) no change was detectable to within ±2 in 10000 of the reading for 1 Hz, or ±5 in 10000 for 0.5 Hz. Larger output currents give progressively larger departures from Talbot's Law for a given gain or for a given flux. For a given output current, increasing the incident flux and reducing the gain to compensate will produce an increase in Talbot's Law error.
The most fundamental test for Talbot's Law obedience is to measure a sector transmittance by ratio of photo-currents, to correct for nonlinearities and compare the result with the true value. But what is the true value? This may be given by the time ratio technique:
T(o) T(t) ,
T(o) or =----=-,---,-
T(o) + T(e)
T(t) - T(c) or T(t)
where T(o) is the total of "open" times, T(c) is the total of "closed" times, and T(t) is the total elapsed time during a counting period. However these ratios are only valid if T(t) is either an exact number of chopping periods or else so large that the error due to the usual residual incomplete period is negligible. Further, the gating circuits must trigger at exactly 50 percent up the leading and trailing edges of the chopped waveform. These three versions of the sector transmission seldom agreed exactly, of course, and these divergences indicated our probable error.
Some results on this are shown in table 2. The linearity correction for the vacuum photo-diode and its circuit was negligible, whereas that for the photomultiplier and its circuit was finite. The linearity corrections were obtained from supplementary measurements by successive application of the double-aperture technique of absolute lmeanty correction. As explained in section IV. A this linearity correction allows properly for nonohmic behaviours of the load resistor as well as for true linearity de-
396
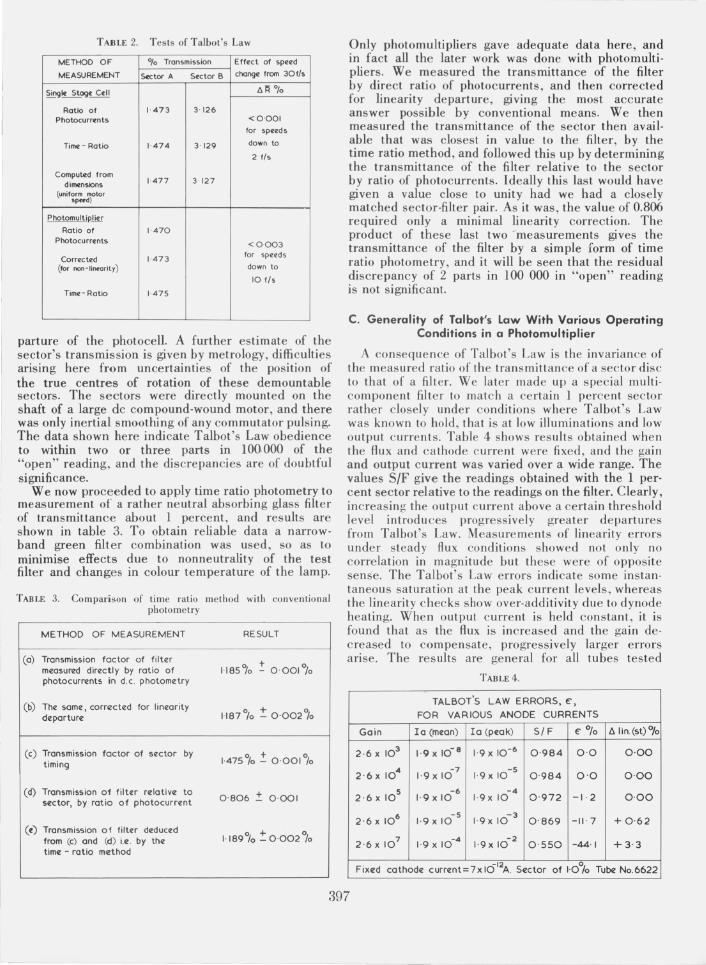
TABLE 2_ Tests of Talbot's Law
METHOD OF Ofo Transmission Effect of sp •• d
MEASUREMENT 5«tor A Sector B chang. from 30f/.
~ngl< St~. C.II A r;. 0/0
Ratio of 1·473 3' 12/> Photocurr~nts <0'001
for spuds
Time - Ratio 1·474 3' 129 down to
2 f/s
Comput~d from 1·477 3·127 dimensions
(uniform motor sp«d)
Phatomulti~li<r
Ratio of 1'470 Photocurrents <0·003
Corrected 1·473 for speeds
(for non-liMority) down to
10 f/s
Time - Ratio 1·475
parture of the photocell. A further estimate of the sector's transmission is given by metrology, difficulties arising here from uncertainties of the position of the true centres of rotation of these demountable sectors. The sectors were directly mounted on the shaft of a large dc compound-wound motor, and there was only inertial smoothing of any commutator pulsing. The data shown here indicate Talbot's Law obedience to within two or three parts in 100·000 of the "open" reading, and the discrepancies are of doubtful significance.
We now proceeded to apply time ratio photometry to measurement of a rather neutral absorbing glass filter of transmittance about 1 percent, and results are shown in table 3. To obtain reliable data a narrowband green filter combination was used, so as to mlmmise effects due to nonneutrality of the test filter and changes in colour temperature of the lamp.
TABLE 3_ Comparison of time ratio method with conventional photometry
METHOD OF MEASUREMENT RESULT
(a) Transmission factor of filter ! 0-001 0/0 measured directly by ratio of 1185~0
photocurrents in d.c. photometry
(b) The same, corrected for linearity 1-187% :!:: 0'002% departure
(c) Transmission factor of sector by 1'475% .:!: 0'001% timing
(d) Transmission of filter relative to 0'806 + 0·001 sector, by ratio of photocurrent -
(~) Transmission of filter deduced 1'189% :!::0'002 0/0 from (c) and (d) i.e . by the
time - rotio method
Only photomultipliers gave adequate data here, and in fact all the later work was done with photomultipliers. We measured the transmittance of the filter by direct ratio of photocurrents, and then corrected for linearity departure, giving the most accurate answer possible by conventional means. We then measured the transmittance of the sector then available that was closest in value to the filter, by the time ratio method, and followed this up by determining the transmittance of the filter relative to the sector by ratio of photocurrents. Ideally this last would have given a value close to unity had we had a closely matched sector-filter pair. As it was, the value of 0.806 required only a minimal linearity correction. The product of these last two -measurements gives the transmittance of the filter by a simple form of time ratio photometry, and it will be seen that the residual discrepancy of 2 parts in 100 000 in "open" reading is not significant.
C. Generality of Talbot's Law With Various Operating Conditions in a Photomultiplier
A consequence of Talbot's Law is the invariance of the measured ratio of the transmittance of a sector disc to that of a filter. We later made up a special multicomponent filter to match a certain 1 percent sector rather closely under conditions where Talbot's Law was known to hold, that is at low illuminations and low output currents. Table 4 shows results obtained when the flux and ca thode current were fixed, and the gain and output current was varied over a wide range. The values S/F give the readings obtained with the 1 percent sector relative to the readings on the filter. Clearly, increasing the output current above a certain threshold level introduces progressively greater departures from Talbot's Law. Measurements of lineari ty errors under steady flux conditions showed not on ly no correlation in magnitude but these were of opposite sense. The Talbot's Law errors indicate some instantaneous saturation at the peak current leve ls, whereas the linearity checks show over-additivity due to dynode heating. When output current is held constant, it is found that as the flux is increased and the gai n decreased to compensate, progressively larger errors arise. The results are general for all tubes tested
TABLE 4 .
TALBOT'S LAW ERRORS, €',
FOR VARIOUS ANODE CURRENTS
Gain la (mean) 10 (peak) S/F €' % D. I in. (st) %
2-6 X 10³ 1-9 X 10- 8 1·9 X 10-/> 0'984 0·0 0·00
2-6x 10⁴ -7 1-9x 10 1·9x 10
-5 0-984 0'0 0-00
2-6 X 10⁵ -6 1-9 X 10
-4 1·9x 10 0-972 -I 2 0·00
2'6 X 10⁶ -5
1·9 X 10 -3
1·9x 10 0'869 -II ' 7 +0·62
2'6 X 10⁷ -4 1·9 X 10
-2 1-9x 10 0-550 -44,1 +3-3
Fixed cathode current=7x IOI2A . Sector of 1'0% Tube NO.6622
397
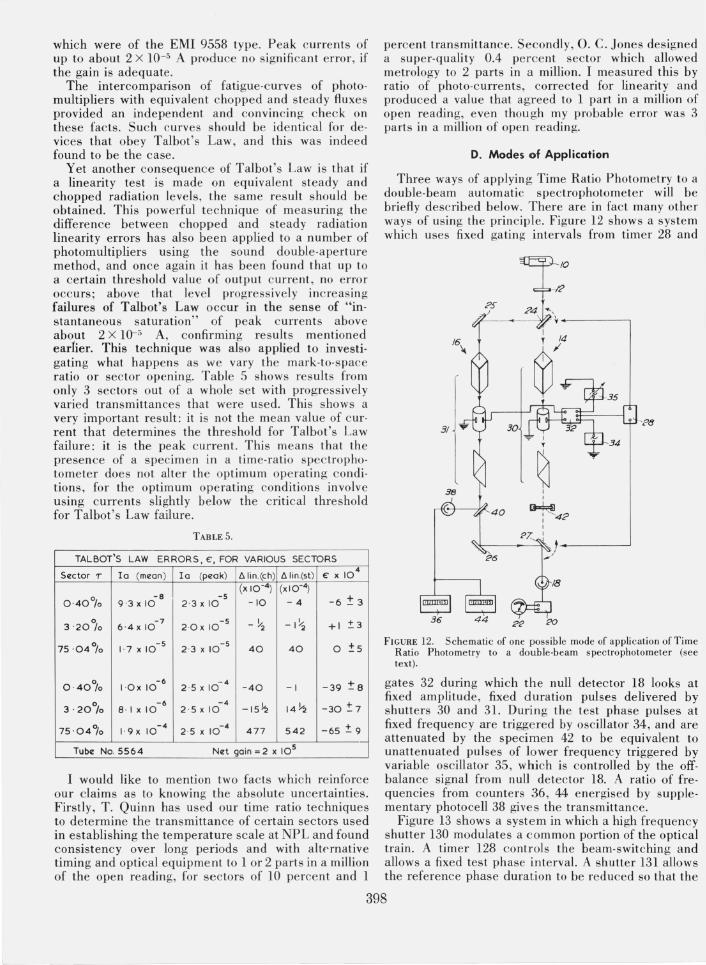
which were of the EMI 9558 type. Peak currents of up to about 2 X 10⁻⁵ A produce no significan t error, if the gain is adequate.
The intercomparison of fatigue-curves of photo· multipliers with equivalent chopped and steady fluxes provided an independent and convincing check on these facts. Such curves should be iden ti cal for devices that obey Talbot's Law , and this was indeed found to be the case.
Yet another consequence of Talbot's Law is that if a linearity test is made on equivalent steady and chopped radiation levels, the same result should be obtained. This powerful technique of measuring the difference between chopped and steady radiation linearity errors has also been ap plied to a number of photomultipliers using the sound double·aperture method , and once again it has been found that up to a certain threshold value of output c urrent, no error occurs; above that level progressively increasing failures of Talbot's Law occur in the sense of "instantaneous saturation" of peak c urrents above about 2 X 10⁻⁵ A, confirming results mentioned earlier. This technique was also applied to investigatin g what happens as we vary the mark-to·space ratio or sec tor opening. T able 5 shows results from only 3 sectors out of a whole set with progressively varied transmittances that were used. This shows a very importa nt result : it is not the mean value of current that determines the threshold for Talbot's Law failure: it is the peak current. This means that the presence of a specimen in a time-ratio spectrophotometer does not alter the optimum operating condi· tions, for the optimum operating conditions involve using currents slightly below the critical threshold for Talbot's Law failure.
T ABLE 5.
TALBOT'S LAW ERRORS, E:, FOR VARIOUS SECTORS
Sector T Ia (mean) Ia (peak) t.lin.(ch) t.lin.(st) E: x 104
-8 I -5 (x 10-4 ) (x 10-4)
0 .40 % 9 ·3 x 10 2 ·3 x 10 -10 -4 -6 ± 3
° 3 ·20 /0 - 7
6 ·4 x 10 2 ·0x 10 - 5 - Y2 -I~ +1 :!:.3
7S ·04 % 1·7 x 10 -5
2 ·3 x 10 -5
40 40 0 ±5
0 . 40% I ·Ox 10 -6 - 4
2 ·5 x 10 -40 -I -39 ± 8
3 . 20% -6 - 4
-15~ 14~ -30 :!:7 8 · 1 x 10 2 ·5 x 10
75 · 04'70 1· 9x 10 -4 -4
2 ·5 x 10 477 542 -65 :!:. 9
Tube No. 5564 Net gain = 2 x 10⁵
I would like to mention two facts which reinforce our claims as to knowing the absolute uncertainties. Firstly, T . Quinn has used our time ratio techniques to determine the transmittance of certain sectors used in establi shing the temperature scale at NPL and found consistency over long periods and with altf'fnative timing and optical equipment to 1 or 2 parts in a million of the open reading, for sectors of 10 percent and 1
percent transmittance. Secondly, O. C. Jones designed a super-qu ality 0.4 percent sector whic h allowed metrology to 2 parts in a million. I measured this by ratio of photo-curre nts, corrected for linearity and produced a value that agreed to 1 part in a million of open reading, eve n though my probable error was 3 parts in a million of open readin g.
D. Modes of Application
Three ways of applying Time Ratio Photometry to a double-beam automatic spectrophotometer will be briefl y desc ribed below. There are in fact many other ways of using the principle. Figure 12 shows a sys te m which uses fixed gating intervals from timer 28 a nd
36
~ I T
~ I I
~.? I
FIGURE 12. Sche matic of one possible mode of application of Time Ratio Photometry to a double -beam spectrophotomete r (see text).
gates 32 during which the null detector 18 looks at fixed amplitude, fixed duration pulses delivered by shutters 30 and 31. During the test phase pulses at fixed frequency are triggered by oscillator 34, and are attenuated by the specimen 42 to be equivalent to unattenuated pulses of lower freque ncy triggered by variable oscillator 35 , which is controlled by the offbalance signal from null detector 18. A ratio of frequencies from counters 36 , 44 energised by supplementary photocell 38 gives the transmittance.
Figure 13 shows a syst em in which a high frequency shutter 130 modulates a common portion of the optical train. A timer 128 controls the beam-switching and allows a fixed tes t phase interval. A shutter 131 allows the reference phase duration to be reduced so that the
398
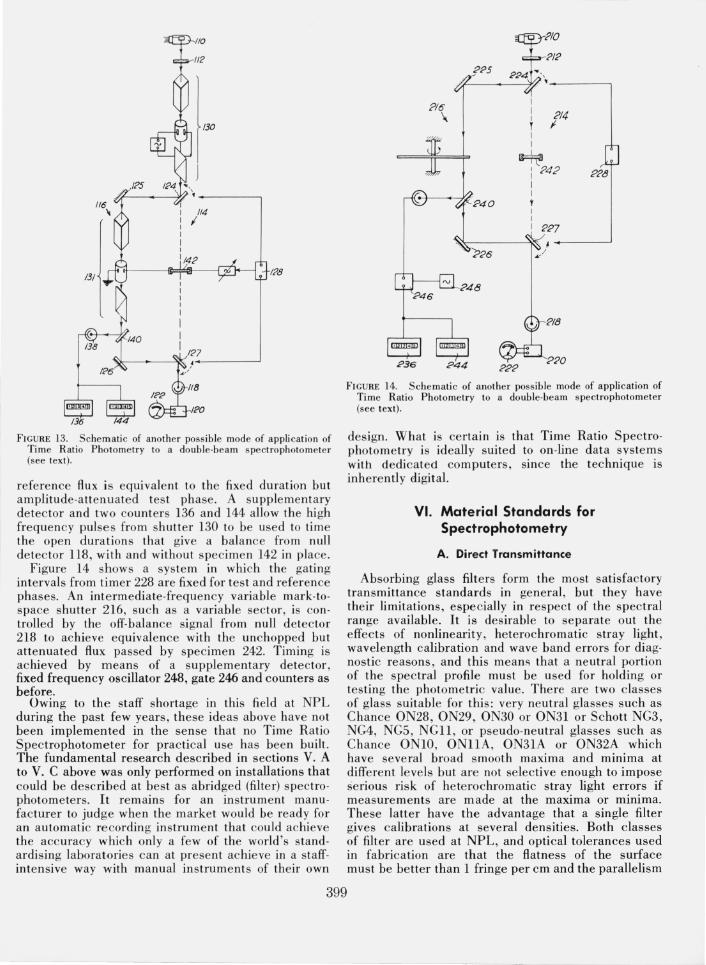
1;>8
FIGURE 13. Schematic of another poss ible mode of application of Time Ratio Photometry to a double·beam spectrophotometer (see text).
reference flux is equivalent to the fixed duration but amplitude-attenuated test phase. A supplementary de tector and two counters 136 and 144 allow the high freque ncy pulses from shutter 130 to be used to time the open durations that give a bal ance from null detector 118, with and without specimen 142 in place.
Figure 14 sh ows a system in which the gating intervals from timer 228 are fixed for test and reference phases. An intermediate-frequency variable mark·tospace shutter 216, such as a variable sector , is controlled by the off-balance signal from null detector 218 to achieve equivalence with the unc hopped but attenuated flux passed by specime n 242. Timing is achieved by means of a supplementary detector , fixed frequency oscillator 248, gate 246 and counters as before.
Owing to the staff shortage in this field at NPL during the past few years, these ideas above have not been implemented in the sense that no Time Ratio Spectrophotometer for practical use has been built. The fundamental research described in sections V. A to V. C above was only performed on installations that could be described at best as a bridged (filter) spectrophotometers. It re mains for an instrument manufacturer to judge when the market would be ready for an automatic recording instrument that could achieve the accuracy which only a few of the world 's stand· ardi sing laboratories can at present achieve in a staffintensive way with manual instruments of their own
216 \
I
I 214 T I I I
~ 1 242 I I t
~/8
220
FI GURE 14. Schemati c of another poss ible mode of application of Time Ratio Photometry to a double·beam spectrophotometer (see text) .
design. What is ce rtain is that Time Ratio Spectrophotometry is ideall y suited to on-line data sys te ms with dedicated co mputers, since the technique is inherently digital.
VI. Material Standards for Spectrophotometry
A. Direct Transmittance
Absorbing glass filters form the most satisfactory transmittance standards in general, but they have their limitations, espe cially in respec t of the spectral range available. It is desirable to separate out the effects of nonlinearity, heterochromatic stray light , wavelength calibration and wave band errors for diagnostic reasons, and thi s means that a neutral portion of the spectral profile must be used for holding or tes ting the photometdc value. There are two classes of glass suitable for thi s : very neutral glasses such as Chance ON28 , ON29 , ON30 or ON31 or Schott NG3, NG4, NGS, NGll, or pseudo-neutral glasses such as Chance ONlO, ONllA, ON31A or ON32A which have several broad s mooth maxima and minima at different levels but are not selective enough to impose serious risk of heterochromatic stray light errors if measurements are made at the maxima or minima. These latter have the advantage that a single filter gives calibrations at several densities. Both classes of filter are used at NPL, and optical tolerances used in fabrication are that the flatness of the surface must be be tter than 1 fringe per cm and the parallelism
399
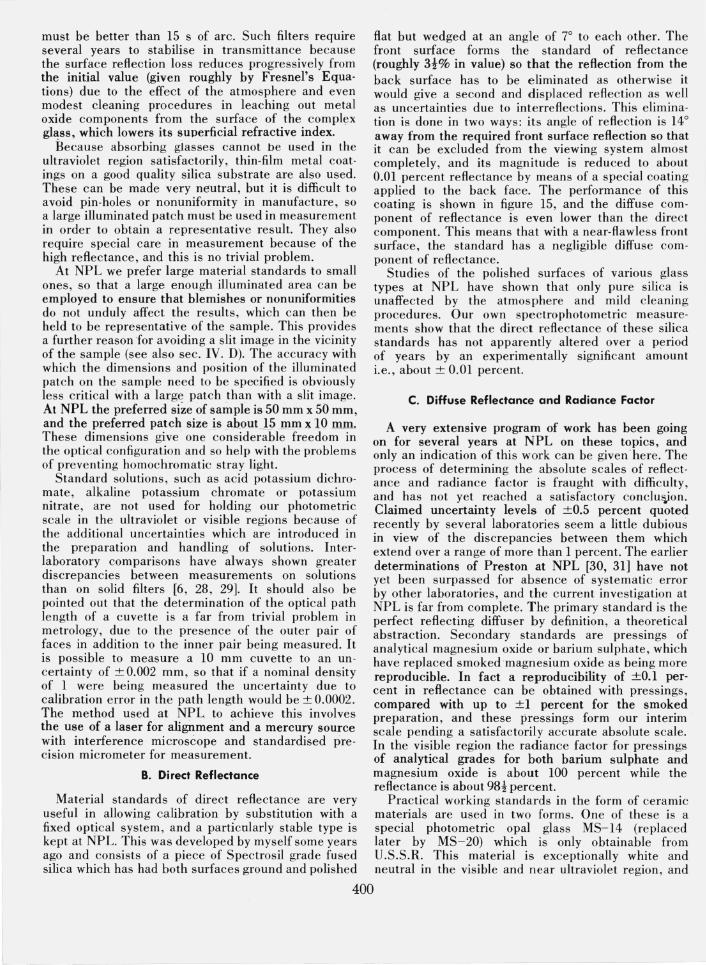
must be better than 15 s of arc. Such filters require several years to stabilise in transmittance because the surface reflection loss reduces progressively from the initial value (given roughly by Fresnel's Equations) due to the effect of the atmosphere and even modest cleaning procedures in leaching out metal oxide components from the surface of the complex glass, which lowers its superficial refractive index.
Because absorbing glasses cannot be used in the ultraviolet region satisfactorily, thin-film metal coat· ings on a good quality silica substrate are also used. These can be made very neutral, but it is difficult to avoid pin-holes or nonuniformity in manufacture, so a large illuminated patch must be used in measurement in order to obtain a representative result. They also require special care in measurement because of the high reflectance, and this is no trivial problem.
At NPL we prefer large material standards to small ones, so that a large enough illuminated area can be employed to ensure that blemishes or nonuniformities do not unduly affect the results, which can then be held to be representative of the sample. This provides a further reason for avoiding a slit image in the vicinity of the sample (see also sec. IV. D). The accuracy with which the dimensions and position of the illuminated patch on the sample need to be specified is obviously less critical with a large patch than with a slit image. At NPL the preferred si~e of sample is 50 mm x 50 mm, and the preferred patch size is _ab.out~ !JIm x 10 mm. These dimensions give one considerable freedom in the optical configuration and so help with the problems of preventing homochromatic stray light.
Standard solutions, such as acid potassium dichromate, alkaline potassium chromate or potassium nitrate, are not used for holding our photometric scale in the ultraviolet or visible regions because of the additional uncertainties which are introduced in the preparation and handling of solutions. Interlaboratory comparisons have always shown greater discrepancies between measurements on solutions than on solid filters [6, 28, 29]. It should also be pointed out that the determination of the optical path length of a cuvette is a far from trivial problem in metrology, due to the presence of the outer pair of faces in addition to the inner pair being measured. It is possible to measure a 10 mm cuvette to an un· certainty of ± 0.002 mm, so that if a nominal density of 1 were being measured the uncertainty due to calibration error in the path length would be ± 0.0002. The method used at NPL to achieve this involves the use of a laser for alignment and a mercury source with interference microscope and standardised precision micrometer for measurement.
B. Direct Reflectance
Material standards of direct reflectance are very useful in allowing calibration by substitution with a fixed optical system, and a particularly stable type is kept at NPL. This was developed by myself some years ago and consists of a piece of Spectrosil grade fused silica which has had both surfaces ground and polished
flat but wedged at an angle of 7° to each other. The front surface forms the standard of reflectance (roughly 3t% in value) so that the reflection from the back surface has to be eliminated as otherwise it would give a second and displaced reflection as well as uncertainties due to interreflections. This elimination is done in two ways: its angle of reflection is 14° away from the required front surface reflection so that it can be excluded from the viewing system almost completely, and its magnitude is reduced to about 0.01 percent reflectance by means of a special coating applied to the back face. The performance of this coating is shown in figure 15, and the diffuse component of reflectance is even lower than the direct component. This means that with a near-flawless front surface, the standard has a negligible diffuse component of reflectance.
Studies of the polished surfaces of various glass types at NPL have shown that only pure silica is unaffected by the atmosphere and mild cleaning procedures. Our own spectrophotometric measurements show that the direct reflectance of these silica standards has not apparently altered over a period of years by an experimentally significant amount i.e., about ± 0.01 percent.
C. Diffuse Reflectance and Radiance Factor
A very extensive program of work has been going on for several years at NPL on these topics, and only an indication of this work can be given here. The process of determining the absolute scales of reflectance and radiance factor is fraught with difficulty, and has not yet reached a satisfactory conclu!j.ion. Claimed uncertainty levels of ±0.5 percent quoted recently by several laboratories seem a little dubious in view of the discrepancies between them which extend over a range of more than 1 percent. The earlier determinations of Preston at NPL [30, 31] have not yet been surpassed for absence of systematic error by other laboratories, and the current investigation at NPL is far from complete. The primary standard is the perfect reflecting diffuser by definition, a theoretical abstraction. Secondary standards are pressings of analytical magnesium oxide or barium sulphate, which have replaced smoked magnesium oxide as being more reproducible. In fact a reproducibility of ±0.1 percent in reflectance can be obtained with pressings, compared with up to ±l percent for the smoked preparation, and these pressings form our interim scale pending a satisfactorily accurate absolute scale. In the visible region the radiance factor for pres sings of analytical grades for both barium sulphate and magnesium oxide is about 100 percent while the reflectance is about 98t percent.
Practical working standards in the form of ceramic materials are used in two forms. One of these is a special photometric opal glass MS-14 (replaced later by MS-20) which is only obtainable from U.S.S.R. This material is exceptionally white and neutral in the visible and near ultraviolet region, and
400
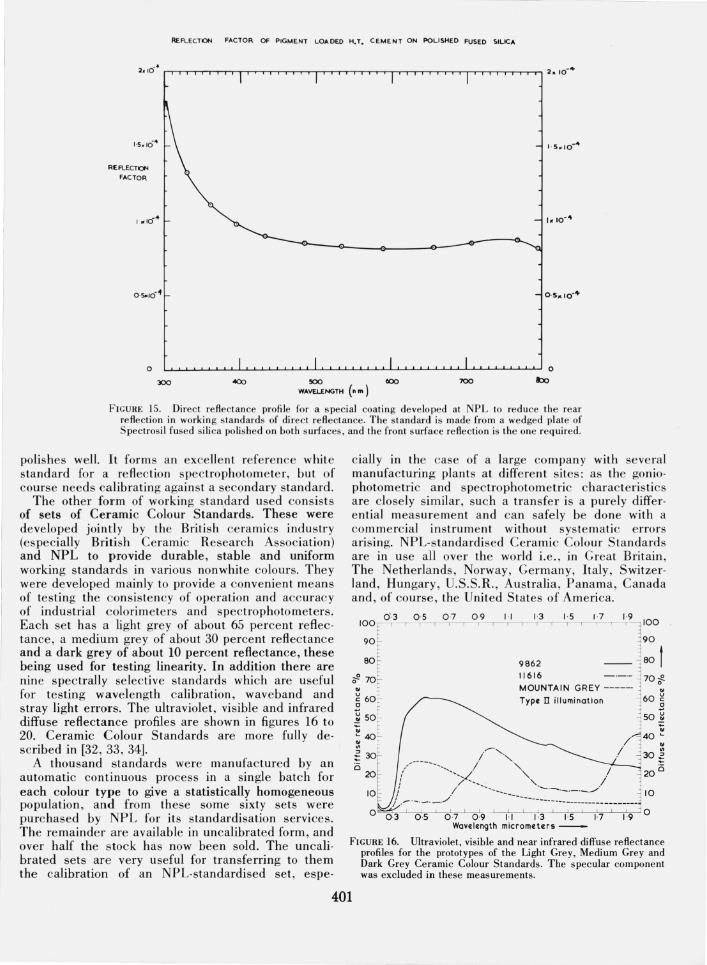
REFLECTION FACTOR OF PIGMENT LOADED H.T .. CEMENT ON POLISHED FUSED SILICA
RER.ECTION
FACTOR
o LL~~~~~~~~-L~~~~~~~~~WL~~-L~~~~~~~ 0
JOO 500 600 700 I::lo WAVELENGTH (n m )
[<I CU RE 15_ Direct re flectance profi le for a s pecial coating developed at NPL to reduce the rear reflection in working standards of direct reflectance_ The standard is made from a wedged plate of Spectros il fused silica polished on both surfaces, and the front surface re flection is the one required_
polishes well. It forms an excellen t refe rence white standard for a reflection spectrophotometer, but of course needs calibrating against a secondary sta ndard_
The other form of working standa rd used consist s of sets of Ceramic Colour Standards. These were developed jointly by the British cera mi cs indus try (especially Briti sh Ceramic Research Association) and NPL to provide durable , stable and uniform working standards in various nonwhite colours. They were developed mainly to provide a convenie nt mean s of testing the consistency of operation and accuracy of industrial colorimeters and spectrophotometers. Each set has a light grey of about 65 percent re fl ectance, a medium grey of about 30 percent re fl ectance and a dark grey of about 10 percent reflectance, these being used for testing linearity. In addition there are nine spectrally selective s tandards which are useful for testing wavelength calibration , waveband and stray light errors. The ultraviolet , visible and infrared diffuse reflectance profiles are shown in fi gures 16 to 20_ Ceramic Colour Standards are more fully de scribed in [32, 33, 34].
A thousand standards were manufactured by an automatic continuous process in a single batch for each colour type to give a statistically homogeneous population , and from these some sixty sets were purchased by NPL for its s tandardisation services. The remainder are available in uncalibrated form , and over half the s toc k has now bee n sold_ The uncalibrate d sets are very useful for transferring to them the calibration of an NPL-standardised set, espe-
ciaUy in the case of a large co mpa ny with several manufacturing plants a t different sites: as the goniophotome tri c and spectrophotometric characteri sti cs are close ly similar, such a transfer is a purely differential measure me nt and can safely be done with a commercial in strument without sys te matic errors arising. NPL-standardised Ceramic Colour S tandards are in use all over the world i.e_, in Great Britain, The Netherlands, Norway, Germany, Italy , Switzerland , Hungary, U.S.S.R. , Australia, Panama, Canada and, of course, the United States of America.
100f O'? ,-0 ;5.....,. 0 ;""" 0 ;9
90
80
rf 701-
II 13_-._1,..:-5--,-,1--,-7-,- 1;9 100
90
9862 11616
80 ! 70-;;" .. :
~ 60:' a -
~ 50~ c
~ 40:-.. ; ~ 30-o
20
MOUNTAIN GREY ------ .. Typ~ II illumination
,..-', / -" - .I -,,_
----/ " ./ ---__ -,,_~ .I : ,f - ---______ '-'-'-'-'/
60 ~ !l
J SO~ - 40 ~
./ .. .I 30 ~
20 0
10 / .- --._ ._ ./ -----------------------
° -~ , 0 -5 ' 0 -7 0 '9 I-I 1-3 1-5 1-7 1-9 ° Wavelength micrometers -
FICURE 16. Ultraviolet, visible and near infrared diffuse reflectance profiles for the prototypes of the Light Grey, Medium Grey and Dark Grey Ceramic Colour Standards. The specular component was excluded in these measurements.
401
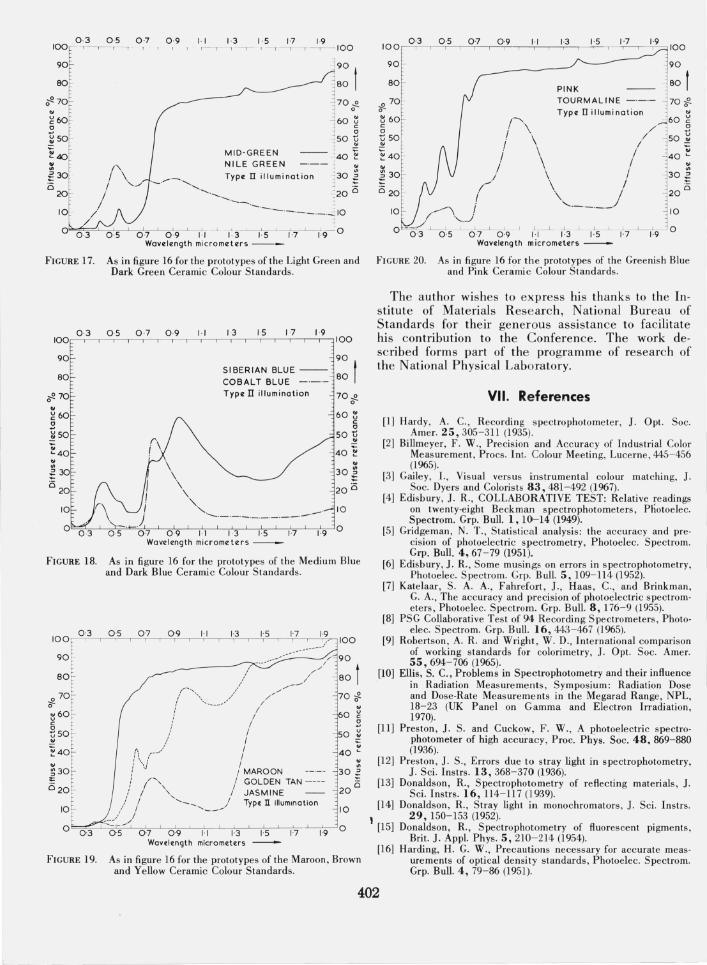
1~:( 3
~:[ .. ~60 o ~50 -~40 -.. .. ~30 o
20
0 ·5
I' . i \ i
i /
10 //
0-7 0 ·9 1· 1 1·3 1·5 1-7 1-9 T 1----,------. 100
" 90
~Bol 170~
60 ~ c: o
·50 t: . .. MID-GREEN :40 ~ NILE GREEN _ ._ .- : :::
Type II illumination ; 30 ~ .-...--.-........ ,.----. ____ ...... ~ 20 0
------- ~ IO
0'~0~·3"""'----,.-'-.---'---0"'-7.----'~09 II ' 1' 3---"--15 ~If-'I-~O Wavelength micrometers ---
FIGURE 17. As in figure 16 for the prototypes of the Light Green and Dark Green Ceramic Colour Standards.
as 0 ·7 0 ·9 1·1 13 15 17 1·9 ~~,_~-,~~~r-,-,_-,_,-,--,_,_,_,__,~ I OO 03
100
90
80
ct- 70 .. ~60 0
~50 .. L40 .. .. ::30 0 20
10
0
FIGURE 18.
SIBERIAN BLUE-- 90 I COBALT BLUE _._._ BO
(\ ! . \ \
\
Type II illumination
'''.
70;f..
60 ~ c:
" 50 t) ~
40 ~ .. 30 ~ 20 0
'-...''"-.._._._ ._ ._ ._ -_ ._ ._ -- . 10
0 ·7 0 ·9 11 13 1·5 1-7 1.9 a Wavelength microme ters ---
As in figure 16 for the prototypes of the Medium Blue and Dark Blue Ceramic Colour Standards.
lOaf r~0-r;3'---r°-r'5'---,~Or7----r--=°r·9---'----lI 'r-I ---'-----lI . .=.3--'-'rI'.=.5--'-----T17'--____ r ____ T~.97-l 100
90 E- -:--,----'/. 90
801 /' __ "." / __ ./,,/ 80 t
i:1 /" / ;/ ::j ~40 /\ (-j I 40 :
~ 30 i \j i MAROON ~--. 30 ~ :z= / /'~" i GOLDEN TAN ----- ;: 020 ,: /', / JASMINE ___ 20 Q
/.1 ............... _....... / Type n. illumination 10 :' ! '---' 10
,:.:."-/ a a os 0·7 09 1·1 1·3 1·5 1'7 1-9
FIGURE 19.
Wov(ltngth micromtttrs
As in figure 16 for the prototypes of the Maroon, Brown and Yellow Ceramic Colour Standards.
100 0 ·3
90 -
BO
0 70 0-
0 ·5 07 0·9 1·1 1·3
PINK TOURMALINE Type II illumination
100
90
BO t 70~ ..
~ 60 c: o
/-....\ /
i \ / 60 ~
" 50 ~ v 50
~
'E 40 I / i \ / . \ / / \ /
\ / \ /
........ _ ._ ._ ._./
L ~ L-------L~-.l L~
0 ·7 09 1·1 1·3 1·5 1·7 Wavelength micrometers -
~ 40 L .. 30 ~ 20 0
10
1.9 0
FIGURE 20. As in figure 16 for the prototypes of the Greenish Blue and Pink Ceramic Colour Standards.
The author wishes to express his thank s to the Institute of Materia]s Rese arch, National Bureau of Standards for their generous assistance to facilitate his contribution to the Conference. The work described forms part of the programme of research of the National Physical Laboratory.
VII. References
[1) Hardy, A. C , Recording spectrophotometer , J. Opt. Soc. Amer. 25, 305-311 (1935).
[2] Billmeyer, F. W. , Precis ion and Accuracy of Industrial Color Measurement, Procs. Int. Colour Meeting, Lucerne, 445- 456 (1965).
[3] Gailey, l., Visual versus instrumental colour mat ching, J. Soc. Dyers and Colorists 83,481-492 (1967).
[4] Edisbury, J. R. , COLLABORATIVE TEST: Relative readings on twenty-eight Beckman spectrophotometers , Pliotoelec. Spectrom. Grp. Bull. 1,10- 14 (1949).
[5] Gridgeman, N. T. , Statistical analysis : the accuracy and precision of photoelectric spectrometry, Photoelec. Spectrom. Grp. Bull. 4,67-79 (1951).
[6] Edisbury, J. R., Some musings on errors in spectrophotometry, Photoelec. Spectrom. Grp. Bull. 5, 109- 114 (1952).
[7] Katelaar, S. A. A. , Fahrefort, J. , Haas, C, and Brinkman, G. A. , The accuracy and precision of photoelectric spectrometers, Photoe lec. Spectroffi. Grp. Bull. 8,176- 9 (1955).
[8) PSG Collaborative Test of 94 Recording Spectrometers , Photoelec. Spectrom. Grp. Bull. 16,443-467 (1965).
[9) Robertson , A. R. and Wright , W. D. , International comparison of working standards for colorimetry, J. Opt. Soc. Amer. 55,694- 706 (1965).
[10] Ellis, S. C. , Problems in Spec trophotometry and their influence in Radiation Measure ments, Symposium: Radiation Dose and Dose-Rate Measurements in the Megarad Range, NPL, 18- 23 (UK Pane l on Gamma and Electron Irradiation, 1970).
[11] Preston , J . S. and Cuckow, F. W., A photoelectric spectrophotometer of high accuracy, Proc. PhYs. Soc. 48.869-880 (1936).
[12] Preston , J. 5., Errors due to stray light in spectrophotometry, J. Sci. Instrs. 13, 368-370 (1936).
[13] Donaldson, R., Spectrophotometry of reflec ting materials , J. Sci. Instrs. 16, 114- 117 (1939).
[14] Donaldson, R. , Stray light in monochromators, J. Sci. Instrs. 29, 150- 153 (1952).
, [15] Donaldson, R., Spectrophotometry of fluorescent pigments, Brit. J. Appl. Phys. 5,210-214 (1954).
[16] Harding, H. G. W., Precautions necessary for accurate measurements of optical density standards , Photoelec. Spectrom. Grp. Bull. 4, 79-86 (1951).
402
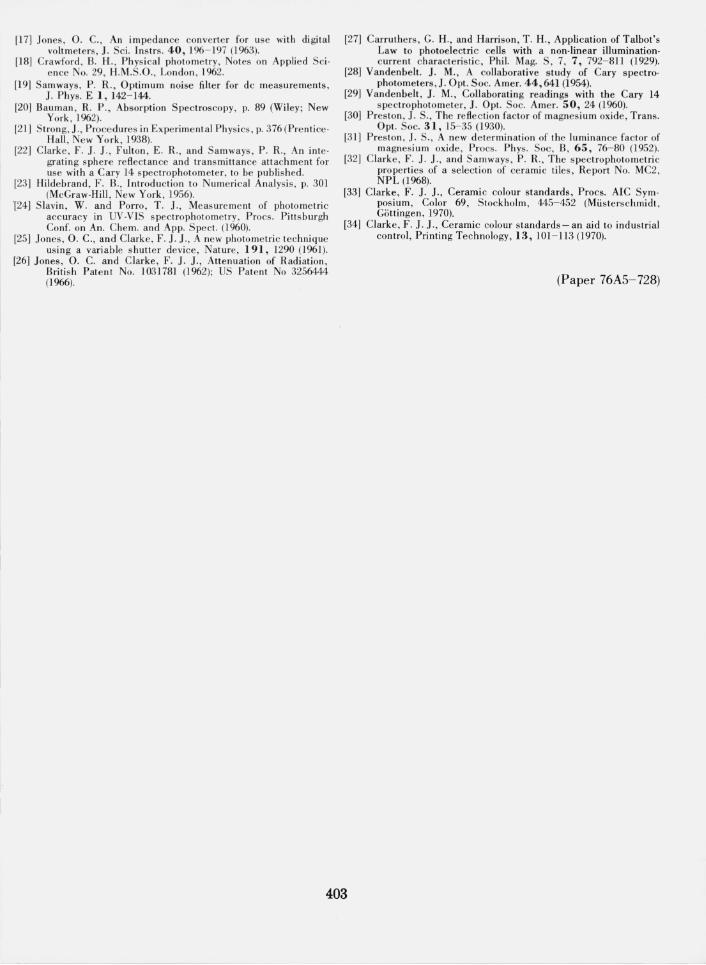
[11'1 Jones, O. C., An impedan ce converter for use with di gital voltmeters, J . Sci. Instrs . 40, 196 - 197 (1963).
[18) Crawford , B. H., Physical photometry, Notes on Applied Sci· ence No. 29, H.M.S.O., London, 1962.
[19) Samways, P . R., Optimum noise filter for dc measurements, J . Phys. E 1 , 142- 144.
[20) Bauman, R. P ., Absorption Spectroscopy, p. 89 (Wiley; New York , 1962).
[21) Strong, J. , Procedures in Experimental Ph ys ics, p. 376 (Pre nti ce· Hall , New York , 1938).
[22) Clarke , F. J . J ., Fulton, E. R., and Samways, P . R. , An inte' grating sph ere re flectance and transmittance attachment for use with a Cary 14 spectrophotom eter, to be published.
[23) Hildebrand, F . B., Introduction to Numeri cal Analysis, p. 301 (McGraw·HiII , New York , 1956).
124) Slavin , W. and Porro, T. J. , Meas urement of photometri c accuracy in UV·VIS spectrophotometry, Procs. Pittsburgh Conf. on An. Che rn. and Ap p. S pec t. (1 960).
[25) Jones, O. C. , and Clarke , F . J. J ., A new photometri c technique usin g a variable shutte r de vice, Nature, 191, 1290 (1961).
[26) Jones , O. C. and Clarke, F . J . J ., Attenuation of Radiation, Briti sh Patent No. 1031781 (1962); US Patent No 3256444 (1966).
[27) Carruthe rs, G. H., and Harrison , T. H. , Application of Talbot's Law to photoelectric cells with a non·linear illumination· current characte ri s tic, Phil. Mag. S, 7, 7, 792-811 (1929).
[28) Vandenbelt. J . M., A collaborative study of Cary spectro' photometers , J. Opt. Soc. Amer. 44,641 (1954).
[29) Vandenbelt, J. M. , Collaborating readings with the Cary 14 spectrophotomete r, J. Opt. Soc. Amer. 50, 24 (1960).
[30) Preston, J . S., The reflection factor of magnesium oxide, Trans. Opt. Soc. 31, 15- 35 (1930).
[31) Preston , J . S., A new de termination of the luminan ce factor of magnesium oxide, Procs. Phys. Soc, B, 65, 76- 80 (1952).
[32) Clarke, F. J . J. , and Samways, P. R., The spectrophotometric prope rties of a selection of cerami c tiles , Report No. MC2, NPL (1968).
[33) Clarke, F. J. J. , Ceramic colour standards , Procs. AIC Sym· posium, Color 69, S tockholm, 445- 452 (Miiste rschmidt Gottingen , 1970). '
[34) Clarke, F. J. J., Ceramic colour standards~ an aid to industrial control, Printing Technology, 13, 101- 113 (1970).
(Paper 76AS- 728)
403
Top Related