


Languages
Pages
Legal


Fine specificity of domain-motif interaction and the role
of structure: a case study with proteasomal chaperones
By
MAHALAKSHMI HARISH
LIFE09201304014
Tata Memorial Centre, ACTREC
A thesis submitted to the
Board of Studies in Life Sciences
In partial fulfillment of requirements
for the Degree of
DOCTOR OF PHILOSOPHY
of
HOMI BHABHA NATIONAL INSTITUTE
November, 2020

Certificate
will be
Upload
soon.

STATEMENT BY AUTHOR
This dissertation has been submitted in partial fulfillment of requirements for an advanced
degree at Homi Bhabha National Institute (HBNI) and is deposited in the Library to be made
available to borrowers under rules of the HBNI.
Brief quotations from this dissertation are allowable without special permission, provided that
accurate acknowledgement of source is made. Requests for permission for extended quotation
from or reproduction of this manuscript in whole or in part may be granted by the Competent
Authority of HBNI when in his or her judgment the proposed use of the material is in the
interests of scholarship. In all other instances, however, permission must be obtained from the
author.
Date: 25th November 2020
Place: Navi Mumbai
Mahalakshmi Harish

DECLARATION
I, hereby declare that the investigation presented in the thesis has been carried out by me. The
work is original and has not been submitted earlier as a whole or in part for a degree / diploma
at this or any other Institution / University.
Mahalakshmi Harish

List of Publications arising from the thesis
Journal 1. A Novel Determinant of PSMD9 PDZ Binding Guides the Evolution of the First
Generation of Super Binding Peptides. Mahalakshmi Harish, Srinivasaraghavan
Kannan, Srivalli Puttagunta, Mohan R. Pradhan, Chandra S. Verma, and Prasanna
Venkatraman. Biochemistry 2019 58 (32), 3422-3433. DOI:10.1021/acs.biochem.9b003082.
Chapters in books and lectures notes
1. DLS and its applications in structural biology of proteins. Mahalakshmi Harish &
Prasanna Venkatraman, Cutting Edge, Spinco Biotech Vol.5, Issue 7, November 2015
2. Quaternary structure of proteins probed by DLS and Allied Light Scattering
Techniques. Mahalakshmi Harish & Prasanna Venkatraman, Cutting Edge, Spinco
Biotech Vol.5, Issue 9, January 2016
3. Protein-Protein Interactions-studies using Light Scattering Techniques.
Mahalakshmi Harish & Prasanna Venkatraman, Spinco Biotech Cutting Edge. PP. 9-
13, Volume 5, Issue 12, April 2016
Conferences
1. EMBO Chemical Biology Workshop held in Heidelberg, Germany in August 2018
2. IBS meeting held in IISER Pune in March 2018
3. Biophysics Paschim meetings in September 2014 and March 2015
4. AsCA meeting for crystallography from 5th-8th December 2015
5. Attended workshop on “Biomolecular Interactions” at NCBS from 24-26
November 2015
6. Participated in SPR workshop organized by GE Healthcare in September 2016
7. Indo-US ‘Enzymes’ conference held at ACTREC from 15th-19th January 2017
8. 42nd meeting of the Indian Biophysical Society from 9th-11th March 2018
Date: 25th November 2020
Place: Navi Mumbai
Mahalakshmi Harish

Dedicated to my little world,
Harish and Aditri

ACKNOWLEDGEMENTS
The completion of PhD marks the end of a long journey. This thesis is a fruit of six years of
research and would have remained a dream if not for the contributions, support and sacrifices
of the people who have always been there for me.
From the day I joined ACTREC, I was inclined to join Dr Prasanna Venkatraman. I was
enchanted by her faculty talk and was really lucky to get accepted in her lab. She is one of the
rare people who would say ‘it is okay to fail, rather than not try at all’. She would constantly
encourage us to read, organize data more effectively, and hone our presentation skills. I can
never thank you Ma’am enough for all the support you have rendered, especially during my
maternity break and getting back to lab.
I also take this opportunity to thank the Director, ACTREC, Dr Sudeep Gupta, Ex Director Dr
S.V. Chiplunkar for the infrastructure and support rendered during PhD. I would also like to
thank my doctoral committee members, Dr Vinay Kumar (BARC), Dr Kakoli Bose, Dr Ashok
Varma, Dr. Ainavarapu Sri Rama Koti (TIFR) and Prof Shyamalava Mazumdar (TIFR) for
their valuable suggestions and comments during doctoral committee meetings.
When you spend considerable amount of time at work, the workplace becomes more of a
family. I was fortunate to get seniors like Nikhil, Indrajit, Padma, who have taught me most of
the experiments. I cannot forget the contributions of Mukund and Saim, who have also helped
me the most by doing many crucial experiments for me and also being the best of friends in the
lab. I would also like to thank Nilesh, Burhan, ‘Sir’ Joel, Merlyn, Priyanka, Soma, Dr. Kruti,
Dr. Priya and Kamlesh for their support and making the lab an amazing place. Ludbe Sir, who
has been a father figure in the lab, deserves a special mention, as a person who would go to any
extent to help me and others. I cannot forget the support of my dear friend Rucha, my best
companion and always been there for me.

My pillars of support have been my interns who have worked effortlessly, tirelessly, without
complaining and have been my extra pair of hands when I needed them the most. I would like
to thank (in no specific order) Srivalli, Vignesh, Nirja, Achu, Aakash, Rutuja, Janhavi and
Srushti for all the help rendered.
The journey of PhD would have never been possible without my amazing batchmates, JRF-
2013, who have been with me through thick and thin, celebrating good times and holding hand
during tough times.
I have been truly blessed to have an amazing mother-in-law (Amma), who has taken care of
me like her own daughter, doubled up as a mother for my child in my absence and what not.
My father-in-law (Appa), who always stood by me and helped me sail through most difficult
times. I would have never got here without them having my back. I am also truly indebted to
my parents for all the love, encouragement, ever-lasting support and guidance. My sister
Kavita, my biggest support system, who has been my constant source of encouragement, and
always been my ‘elder’ sibling.
This journey has been possible only because of my rock, my world and one of life’s biggest
blessings, my beloved husband Harish, whose faithful support in this journey is beyond words
and my little princess, Aditri who can vanish all my worries with her unconditional love and
cuteness. Thank you so much Papu.
Last but not the least, I would immensely thank my salvager, friend, philosopher and guide,
Krishna, for making things happen, at the right time.
Thank you,
Mahalakshmi Harish

CONTENTS
Synopsis………………………………………………………………………..…….12
List of Abbreviations……………………………………………………………..…24
List of Figures………………………………………………………………………..25
List of Tables……………………………………………………………………...…28
Chapter 1: Introduction and review of literature
1.1 Protein degradation: Unravelling the enigma of the fundamental life processes...30
1.2. Proteasome structure……………………………………………………………..33
1.3 Proteasome mediated protein degradation mechanism…………………………...36
1.4. Assembly of the proteasome……………………………………………………..39
1.5. PSMD9, a proteasome assembly chaperone……………………………………..45
1.6. PDZ domains: Protein interaction domains for recognition of short-linear sequence
motifs (SLiMs)……………………………………………………………..50
Chapter 2: Materials and Methods
Materials…………………………………………………………………………….64
2.1 Media for bacterial culture………………………………………………………..64
2.2. Antibiotics stock preparation…………………………………………………….64
2.3. Buffer and chemical stock preparation………………………………………….65
2.4. Protein purification buffers……………………………………………………...67
2.5 Coating buffer for ELISA………………………………………………………...70
2.6 Buffers and reagents for DNA preparation and agarose gel electrophoresis……..70
2.7. Buffers and reagents for polyacrylamide gel electrophoresis……………………71
2.8. Buffers and reagents for western blot……………………………………………73
2.9. Buffers and reagents for immunoprecipitation experiments……………………..74
2.10. Buffers and reagents for CD experiments………………………………………74
2.11. Tissue Culture Media and Reagents…………………………………………….76
2.12. Commercial buffers……………………………………………………………..77
2.13. Antibodies……………………………………………………………………….77
2.14. Miscellaneous………………………………………………………………..….77
2.15. Reagents for transfection………………………………………………………..77
Methods………………………………………………………………………………78
2.16.1. Primer design for cloning…………………………………………………….78
2.16.2. Primer design for site-directed mutagenesis…………………………………80
2.16.3. Primer reconstitution…………………………………………………………80
2.16.3. Plasmid construction………………………………………………………….81
2.16.4. PCR for gene amplification…………………………………………………..82
2.16.5. PCR for Site-directed mutagenesis (SDM-PCR)……………………………..83
2.17. Agarose gel electrophoresis (AGE)………………………………………….…84
2.18. Restriction digestion……………………………………………………………85
2.19. DpnI digestion……………………………………………………………….….85
2.20. Extraction of DNA from agarose gel…………………………………………...86
2.21. Quantification of DNA…………………………………………………………86
2.22. Ligation…………………………………………………………………………87

2.23. Preparation of bacterial competent cells………………………………………..88
2.24. Transformation of plasmid DNA……………………………………………….89
2.25. Colony PCR…………………………………………………………………….89
2.26. Small scale plasmid extraction using miniprep protocol……………………….90
2.27. Large-scale plasmid extraction using maxiprep protocol………………………90
2.28. Standardization of induction conditions for protein expression in bacteria……90
2.29. Screening of conditions for optimal protein expression………………………..91
2.30. Preparation of glycerol stock of bacterial culture………………………………92
2.31. Protein purification……………………………………………………………..92
2.31.1. Ni-IDA affinity purification…………………………………………………..92
2.31.2. Purification of GST-tagged proteins……………………………………….…93
2.31.3. Purification of MBP-tagged proteins…………………………………………94
2.32. Gel filtration chromatography………………………………………………….94
2.33. Cleavage of His tag using TEV protease……………………………………….95
2.34. Concentrating proteins using protein concentrators……………………………95
2.35 Protein estimation by Bradford method…………………………………………95
2.36. Buffer exchange/dialysis of proteins…………………………………………...96
2.37. Analysis of protein secondary structure by CD………………………………...96
2.38. Thermal denaturation and refolding by CD…………………………………….97
2.39. Chemical denaturation and refolding by CD…………………………………...98
2.40. DLS analysis of proteins……………………………………………………….99
2.41. Reconstitution of peptides for ELISA………………………………………….100
2.42. Screening and optimization of crystallization conditions……………………..100
2.43. DTNB labelling of proteins…………………………………………………...101
2.44. Glutathione labelling of proteins……………………………………………...100
2.45. ELISA for protein-peptide interaction………………………………………...102
2.46. ELISA for protein-protein interaction………………………………………...102
2.47. Competition ELISA assays……………………………………………………103
2.48. Pulldown with purified recombinant proteins………………………………...103
2.49. Western blot…………………………………………………………………...103
2.50. Microscale thermophoresis…………………………………………………....104
2.51. Surface Plasmon Resonance (SPR) experiments……………………………...105
2.52. Maintenance and trypsinization of cell lines……………………………….....106
2.53 Transient transfection by calcium phosphate method……………………….…106
2.54. Mammalian cell lysis………………………………………………………….107
2.55. Immunoprecipitation of FLAG-tagged proteins using M2 agarose beads…….107
2.56. Luciferase reporter assay……………………………………………………...108
Chapter 3: Structural and functional characterization of PSMD9: Exploring the
synergy between domains
Introduction………………………………………………………………………….110
Results and Discussion……………………………………………………………....111
Chapter 4: Identification of a novel signature motif for high affinity interaction with
PDZ domain of PSMD9: understanding binding preferences and per residue
contribution to binding
Introduction………………………………………………………………………….147
Results and discussion……………………………………………………………….149

Chapter 5: Crystallization of PDZ domain
Introduction………………………………………………………………………….175
Results and discussion…………………………………………………………….....175
Chapter 6: Conclusion and significance of the study……………………………179
References………………………………………………………………………..…183

Chapter 6:
Conclusion and significance of the study

Protein-protein interactions play crucial role in maintenance of cellular homeostasis. These
interactions are primarily mediated by specialized and conserved domains in proteins, which
recognize and bind to specialized binding interfaces, often called as motifs. Any perturbation
in protein interaction network can have deleterious consequences to the cell or organism. While
structural and biophysical studies have identified the molecular basis of many domain-motif
interactions, these interactions are poorly understood in proteins with no crystal or solution
structure. In the current study, we chose to investigate the primary mediators of domain-motif
interaction in the atypical PDZ domain of PSMD9, using a combination of extensive
biochemical and computational approaches. Our studies led to the identification of a
superbinder peptide, which was capable of inhibiting PSMD9-hnRNPA1 interaction. This
signature motif could be utilized as a scaffold for designing small-molecule inhibitors to block
PSMD9 mediated NF-κB activation in cancers.
Computational approaches including molecular dynamic simulations and docking studies aided
in understanding the finer details and the molecular basis for the huge affinity differences
between high-affinity and low-affinity peptides, which informed us about how the preference
and position of cysteine in the peptide would lead to tight binding with the PDZ domain. It also
gave us information on per-residue contribution of the peptide towards binding energy, which
would be of great importance in inhibitor design to block NF-κB signalling. While PDZ-
peptide interaction is crucial for PSMD9-hnRNPA1 interaction, the vast differences in affinity
of C-terminal peptide of hnRNPA1 vis-à-vis full-length hnRNPA1 protein towards PSMD9
could only be understood by looking at the role of secondary binding sites in mediating the
interaction. Taking cue from parallel studies on the yeast ortholog Nas2, we decided to look
into the role of the uncharacterized N-terminal domain of PSMD9 in mediating interaction with
hnRNPA1. The domain boundaries of N domain of PSMD9 were identified, cloned, expressed
and purified as recombinant soluble proteins in bacteria. Analysis of the secondary structure of

N domain with PSMD9 indicated that it contributed to most of the structure in PSMD9 and
both showed nearly similar Tm during thermal denaturation. Our studies revealed a very
interesting structural property of N domain and PSMD9 to refold after thermal or chemical
denaturation, which highlights the role of N domain in the stability and structure of PSMD9.
The difference in the secondary structure of PSMD9 and the additive spectrum of domains
could indicate of conformational changes or structural rearrangements occurring when both
domains are a part of PSMD9. Interaction of N domain and PDZ domain with hnNRPA1
revealed a distinct role of domains in binding. While N-domain had high affinity but lower
occupancy, PDZ domain was a low binder in isolation, thus inferring that presence of both
domains in PSMD9 is essential for its binding functions. The lower binding potential of the
domains was also reflected in ex vivo immunoprecipitation studies in mammalian cell lines. In
addition, both domains were also unable to activate NF-κB in cells. Further kinetic analysis of
PSMD9-hnRNPA1 interaction by SPR revealed that the interaction was bi-phasic in nature and
indicated conformational changes during binding, as indicated by the two-state fit model.
Taken together, we propose a two-state model for binding and conformational changes, where
PDZ in isolation lacks the native fold and N domain in isolation lacks the interactions which
maximize hnRNPA1 binding. When both domains are present as a part of the full-length
protein, N domain drives the native fold of PDZ domain, while the PDZ domain reinforces the
interactions of N-domain with hnRNPA1, thereby leading to optimal interaction and hence
function of PSMD9. In summary, these studies established structure-function correlation and
potential role of inter-domain communication in driving the structure, stability and functions
of PSMD9, which could be crucial in understanding its biology in normal and diseased
conditions. Given the role of N-domain in binding to hnRNPA1, it will be interesting to
decipher the molecular details of tri-partite interaction between proteasome-bound PSMD9,
hnRNPA1 and proteasomal ATPase/other subunits. One of the major outcomes of this work is

the identification of a short sequence motif, which can be improvised for designing inhibitors
for IκBα degradation and therefore NF-κB activation in cancers. Such inhibitors are likely to
help in future drug development to overcome resistance in cancers that are dependent on
PSMD9 for stress induced NF-κB activation.
Figure 6.1. Model for concerted action of N-domain and PDZ domain in regulating binding
functions of PSMD9


Chapter 1:
Introduction and review of literature

1.1 Protein degradation: Unravelling the enigma of the fundamental life process
Proteins, central elements to all life processes, were discovered in the eighteenth century as
essential macromolecules that coagulated due to heat or acid (Osborne 1909). Proteins were
first identified by Mulder, a chemist and the term ‘protein’ was coined by Jacob Berzelius in
1838 from ‘proteus’ which meant primary or ‘to stand first’ in Greek (GJ 1838). Pioneering
work by Linus Pauling in deciphering the secondary structure of proteins gave a new direction
to protein structure and chemistry (Pauling and Corey 1951). Subsequently, the crystal
structure of haemoglobin by Max Perutz and myoglobin by Sir John Kendrew (Muirhead and
Perutz 1963; Kendrew et al. 1958) gave a new direction towards understanding 3D structure of
proteins by X-ray crystallography. With the growing acceptance of the fact that proteins play
a crucial role in all biological processes, it also became imperative to understand the dynamic
state of proteins in living cells. Proteins are constantly synthesized and degraded and can have
varying half-lives from nanoseconds to few hours or even days. In the 1940s, with the
elucidation of the structure of DNA by Watson and Crick and further identification of genetic
code, the focus was more on understanding the synthesis of proteins, and therefore the area of
protein degradation remained largely neglected, and therefore obscure. However, it was only
in 1953, when Christian de Duve serendipitously discovered lysosomes as organelles
harbouring acid proteases which was specifically involved in degrading cellular proteins, the
field of protein degradation garnered significant importance (Cohn 1963b). Initially identified
as a ‘bag of enzymes’, detailed investigations by Essner & Novikoff 1961, Straus 1954, Cohn
1963 (Essner and Novikoff 1961; Straus 1954; Cohn 1963a) gave a better understanding of
lysosomal degradation. Not so long after discovery of lysosomes, the existence of a lysosome-
independent, protein degradation machinery was discovered in the 1970s. In 1977, Etlinger and
Goldberg discovered the presence of an ATP dependent protein degradation process in rabbit
reticulocytes, which typically do not harbour lysosomes (Etlinger and Goldberg 1977). Further,

the covalent modification of amino group of lysine in histones and terminal glycine of ubiquitin
was identified, whose role was unidentified at that time (Goldknopf and Busch 1977). It was
later confirmed that the APF-1 protein was actually ubiquitin (Wilkinson, Urban, and Haas
1980). Further work revealed that the proteasome was comprised of two high molecular weight
complexes, namely, the 20S catalytic core complex which harbours catalytic subunits that
proteolytically cleave unfolded substrates (Hoffman, Pratt, and Rechsteiner 1992) which is
capped on one or both ends by the 19S regulatory particle (Dubiel et al. 1992). The 19S
harbours ubiquitin receptors which aid in recognition of ubiquitin-tagged protein substrates,
and a hexameric ATPase ring which is responsible for unfolding of protein substrates into
linear polypeptides. These unfolded polypeptides are translocated into the narrow core of the
20S for degradation. The name 26S is derived from the sedimentation coefficient of density
gradient centrifugation, which is around 26S-30S, depending on whether the proteasome is
single or doubly capped. While the initial discovery of proteasome was contributed by different
groups across the globe, pioneering work by Hershko, Ciechanover and Rose elucidated
fundamental concepts of proteasome mediated protein degradation, for which the three of them
shared the Nobel Prize in Chemistry in 2004(Hershko and Ciechanover 1998). The importance
of this degradation machinery can be gauged from the pathogenesis of human disease arising
due to aberrant functions of the proteasome, more profound in cancers and neurodegenerative
disorders. It is now widely recognized that the function of this proteasome is crucial for
regulation of many processes including cell division, DNA replication, transcription, protein
synthesis, cellular transport, immune response and overall cellular quality control.
Although mechanistic details of proteasome degradation were understood, the structure of
proteasome could not be solved until the late 1990s owing to its large molecular weight, which
rendered it resistant to crystallization. Although electron microscopy revealed the size and
shape of the proteasome, the crystal structure of proteasome from thermophilus acidiphilum

was solved in 1994 by Lowe and colleagues. In 1997, the crystal structure of the catalytic 20S
proteasome was solved by Groll and colleagues. While the crystal structure of proteasome from
various organisms like yeast, bacteria have been solved at high resolution by many groups, no
structure of the 19S regulatory component of proteasome is available, probably due to its
dynamic nature. However, recently, cryo-electron microscopy has revealed the dynamic
structure and arrangement of the 26S proteasome at near-atomic resolution.
Figure 1.1. Structural architecture of proteasome (Goldberg 2012)
1.2.Proteasome structure
Extensive crystallization and cryo-electron microscopy revealed that the 26S proteasome
comprises of two structurally and functionally distinct, but well-organized multi-subunit
complexes; namely the 20S core particle and the 19S regulatory particle
The 20S catalytic core is an organized complex with a molecular weight of approximately
750kDa and a sedimentation coefficient of 20S, from which the name is derived. It is a
cylindrical barrel-shaped complex comprising of four stacked rings with seven alpha rings in
the outer two ends of the cylinder and two beta rings in the centre. The alpha rings gate entry
into the catalytic core, which was indicated by electron microscopy of substrate bound to core

particle in Thermophilus acidophilum, while the crystal structure reveals that the centre of the
alpha ring is tightly closed and the pore has a 13A diameter constriction through which only
unfolded polypeptides can pass. Additionally, the first twelve residues from the N-terminus of
alpha subunits form disordered polypeptides, further impeding entry into the catalytic site
(Bochtler et al. 1999). The alpha subunits are also involved in proteasome localization as many
of them harbour nuclear localisation signal (NLS). The inner two rings of stacked beta subunits
harbour the catalytic core, which is rendered by the β1, β2 and β5 of each B ring which harbour
caspase, trypsin and chymotrypsin activities respectively. These catalytic beta subunits are
synthesized as zymogens harbouring pro-peptides at the N-terminus. During proteasome
assembly, the pro-peptides are cleaved, which allows exposure of the N-terminal catalytic
residue. Cellular milieu also harbours specialized beta subunits in immunoproteasome and
thymoproteasome, which is found specifically in cells of the thymus which is crucial of CD8+
T cells. The 19S regulatory complex, also known as the ‘proteasome cap’, sits on the 20S
catalytic core. Structurally, the 19S is highly complex and heterogenous in composition than
its catalytic 20S counterpart. Although intact crystal or solution structure of the 19S in entirety
is not available, recent advances in cryo-EM based structure determination has revealed the
arrangement and structural features of the 19S particle. In addition, the structures of several
subunits of the 19S have been determined independently, providing further insights into its
structure and function. Structurally, the 19S comprises of two components; lid and base.
The base subcomplex comprises of a ring of six ATPases and four non-ATPases, Rpn1, Rpn2,
Rpn10 and Rpn13. The Rpt subunits are part of the conserved AAA class of ATPases, which
include ClpA, ClpC and ClpX in bacteria, the PAN ATPase in archaea, and Cdc48 in yeast.
Rpts1 to Rpt6 form a hetero-hexameric ATPase ring. The Rpts harbour an N-terminal coiled-
coil (CC) domain which binds to neighbouring ATPase, an oligosaccharide binding (OB)
domain, and a AAA ATPase domain at C-terminus (Unverdorben et al. 2014). The CC

domains of Rpts contact the CC domain of neighbouring specific Rpt, forming a trimer of
dimers (Djuranovic et al. 2009). Using disulphide engineering and guided by crystal structures,
the order of the Rpt ring assembly was deciphered to be Rpt1, Rpt2, Rpt6, Rpt3, Rpt4 and Rpt5
(Tomko et al. 2010). The Rpts serve as contact point between the 19S and 20S, since they
harbour HbYX motif (where Hb represents a hydrophobic residue, Y is tyrosine and X can be
any amino acid) at the C-terminus of Rpt2, Rpt3 and Rpt5. The C-termini of Rpt2 and Rpt5
dock into the open surface of the 20S alpha ring (Smith et al. 2007). The hexameric nature of
ATPases and the heptameric nature of alpha subunits leads to uneven and loose contact, which
could help in substrate processing (Tian et al. 2011). Two base subunits (regulatory non-
ATPase) Rpn10 and Rpn13 are ubiquitin receptors, which can recognize poluyubiquitin chains.
Rpn10 harbours a ubiquitin-interacting motif at C-terminus, while Rpn13 contains pleckstrin
homology domain. Surprisingly, Rpn13 has high affinity for monoubiquitin as well (Liu et al.
2002; Husnjak et al. 2008). Two other base subunits Rpn1 and Rpn2 comprise the largest
proteasomal subunits and fold into toroid shaped alpha-helical solenoids and interact with 20S
proteasome. Rpn1-Rpn2 form stack like structures, extending the proteolytic core an also co-
ordinate substrate recruitment and translocation into the proteolytic core (Rosenzweig et al.
2008).
The 19S lid encompasses of nine non-ATPase subunits, namely, Rpn3, Rpn5, Rpn6, Rpn7,
Rpn8, Rpn9, Rpn11, Rpn12 and Rpn15 (Schweitzer et al. 2016). Rpn3, Rpn5, Rpn6, Rpn7, and
Rpn9 shape into a horseshoe-like conformation, thus enabling more flexibility to N-terminal
solenoid domains. Rpn6 and Rpn5 interact with the C-termini of alpha2 and alpha1,
respectively thus providing stability to the 26S complex. Rpn8 and Rpn11 are metalloenzymes
which form dimers through their MPN domains (Mpr1, Pad1 N-terminal), which associate with
the C-terminal helices of PCI (Proteasome Containing) domains of lid subunits. Rpn11 is a
DUB which cleaves polyubiquitin chains into mono-ubiquitin by other DUBs. DUBs Usp14

and Uch37 associate with Rpn1 and Rpn2 and also cleave polyubiquitin chains. The lid
subcomplex, which was previously thought to sit on top of the base, actually sits on the side,
as revealed by recent cryo-EM reconstruction images.
Figure 1.2 Cryo-EM reconstruction image of proteasome (Dong et al. 2019)
1.3 Proteasome mediated protein degradation mechanism
Proteasome-mediated protein degradation begins with the primary step of covalent
modification of the protein with ubiquitin, a small 8.6kDa protein, which is highly conserved
across eukaryotes. The amino side chain of lysine of the protein is attached to ubiquitin, which
serves as the nucleation step. Further, more ubiquitin molecules are added to form a
polyubiquitin chain. This serves as ‘barcode’ for recognition by ubiquitin receptor subunits of
the 19s particle.
1.3.1 Ubiquitination process:
The covalent association of ubiquitin with protein is a multistep process requiring the stepwise
activation of three enzymes in the cascade. In the first step, a ubiquitin-activating enzyme (E1)

activates the C-terminal glycine of ubiquitin to form ubiquitin adenylate leading to
subsequently release of pyrophosphate (PPi). This is followed by formation of a thioester bond
between ubiquitin and the active site cysteine residue in E1, followed by transfer of active
ubiquitin to the cysteine residue in the active site of E2 (ubiquitin conjugating enzyme). Finally,
E3 ligase or ubiquitin ligase mediates covalent bond formation between C-terminus of
ubiquitin and ε-amino group of lysine residue in target protein via an amide-isopeptide linkage,
which plays the major role in recognition target proteins (Hershko 1996). Several families of
E2 and E3 proteins have been reported, each family for recognition of specific target proteins.
The specificity of these enzymes is crucial for targeting different proteins for proteasomal
degradation
1.3.2 Recognition of ubiquitin-tagged substrates by proteasome:
Ubiquitin receptors Rpn13, Rpn10 and Rpn1 recognize and bind to ubiquitin-tagged substrates
via their ubiquitin binding domain. Rpn13 along with another DUB Uch37 serve as checkpoint
to allow poorly ubiquitinated substrates to escape and also trim the chain length to allow better
access by the proteasome for efficient degradation (Yao et al. 2006; Hamazaki et al. 2006). The
presence of an unstructured region on the protein substrate is along with ubiquitin tag is
essential for recognition by the proteasome(Takeuchi, Chen, and Coffino 2007). The length
and distance of the unstructured region from the ubiquitin tag influences the rate of processing
by proteasome. Even with the recent advances in proteasome structure, the detailed and exact
mechanism of how proteasome recognizes a substrate is still elusive, due to the huge
complexity of proteasome structure and its dynamic state.
Once recruited on the proteasome, the substrates are channeled to deubiquitinases which
remove or edit the ubiquitin tag. These DUBs have low isopeptidase activity in isolation, but
upon association with the proteasome, they exhibit increased activity. One of the key

proteasomal DUB is Rpn11, which belongs to JAMM metalloprotease family and related to
NEDD8 isopeptidase CSN5 of the COP9 signalosome (Cope et al. 2002). Rpn11 harbours a
catalytic zinc coordinated by EXnHXHX10D metal binding motif (Verma et al. 2002). It
resides just above the N-ring of the AAA ATPase ring and adjacent to Rpn10 (ubiquitin
receptor). It removes ubiquitin by hydrolyzing isopeptide bond between lysine of substrate and
C-terminus of the immediate ubiquitin moiety (Yao and Cohen 2002). Crystal structure of
Rpn11 -Rpn8 complex have revealed that binding of ubiquitin leads to conformational switch
from inactive closed state to the active beta-hairpin structure, which ensures tight regulation of
Rpn11’s DUB activity. Substrate translocation by ATPase ring strongly accelerates the switch,
which ensures that polyubiquitin chains are removed only from protein substrates targeted for
degradation (Worden, Dong, and Martin 2017). Ubp6 and Uch37 are few other DUBs which
exhibit increase proteasome activity upon association with the proteasome.
1.3.3 Substrate translocation and degradation of unfolded substrates by proteasome:
The AAA ATPase ring serves as motor for substrate unfolding and translocation by converting
the chemical energy of ATP hydrolysis to unfold substrates via mechanical force for unfolding
of substrates. The N-terminal coiled-coiled domains of Rpts form coiled-coil pairs for
appropriate arrangement. The OB domain which lies downstream to the coiled-coil stabilizes
the hexamer and act as bottleneck against which the ATPase motor pulls the substrates during
mechanical stress to induce unfolding (Wehmer et al. 2017). Structural insights from single
particle cryo-electron microscopy have revealed four defined conformational states (s1 to s4)
for the ATPase ring. The conserved loops in the ATPase rings interacts with the substrate and
cycles through high and low conformations in response to ATP hydrolysis.
1.3.4 Degradation of unfolded substrates by 20S core:

The unfolded substrates enter the proteolytic core, where they are degraded by the six
proteolytic sites repeatedly into smaller fragments and released into the cytosol, where they are
digested by cellular endopeptidases to form free amino acids which are recycled for protein
synthesis (Kisselev et al. 1999).
Figure 1.3. Schematic representation of substrate degradation by proteasome (Image adapted
from Viestra lab webpage, University of Wisconsin, Laboratory of Genetics)
1.4. Assembly of the proteasome
Assembly of the huge megadalton multi subunit proteasome complex is essential for its
function. The assembly is dictated by a set of dedicated proteasome assembly chaperones
which function in a highly specific and coordinated manner.

1.4.1 Assembly of 20S core particle:
The core particle assembly initiates with formation of the heptameric alpha ring of 20S core
particle, which serves as the nucleation point onto which beta subunits are incorporated (Hirano
et al. 2008). The Pba1-Pba2, Pba3-Pba4 chaperone pairs in yeast (and their PAC counterparts
in mammals) associate with isolated alpha subunits to initiate alpha ring formation. Pba1-Pba2
chaperones contain a HbYX motif which allows them to bind to the ATPase facing (upper) end
of alpha subunits and also stabilize adjacent alpha subunits as they bind. These HbYX motif
insert into the interface of adjacent alpha subunits, thus stabilizing their association
(Kusmierczyk et al. 2011). Pba3-Pba4 complex binds to the beta ring facing (lower) end of
alpha subunits and reinforces interaction between α4 and α5 which is crucial for correct
orientation of alpha subunits and assembly of alpha ring. The absence of Pba3-Pba4 leads to
aberrant positioning of alpha subunits (Kusmierczyk et al. 2008; Takagi et al. 2014).
The formation of alpha ring serves as the base onto which beta ring formation assembly ensues.
Initially beta 2, beta 3 and beta r subunits assemble to form a 13S intermediate state which is
followed by subsequent entry of beta 5, beta 6 and beta1 to form a 15S intermediate(Hirano et
al. 2008). Lastly, beta 7 is incorporated to form the transient, half proteasome. Most of the beta
subunits are synthesized as inactive precursors harboring an N-terminal pro-peptide, which aids
in ring formation and is eliminated in mature proteasome. Removal of the N-terminal extension
is also crucial for exposing the catalytic threonine residues of catalytic beta subunits, which are
essential for cleavage of peptide bonds in substrate proteins (Chen and Hochstrasser 1996; Li
et al. 2016; Huber et al. 2016). The Ump1 chaperone assists in formation of the B-ring by
binding to the centre of the alpha ring and b2 subunit (Ramos et al. 1998). Ump1 also serves
as checkpoint by prevents premature dimerization of partially or poorly form alpha/beta ring
precursors through its N-terminal domain. It does so by residing close to beta 6 subunit, where
it senses arrival of beta 7 subunit, which is the last subunit to be incorporated (Kock et al.

2015). Once beta 7 subunit is integrated, the two half-assembled proteasomes dimerize by
inserting their C-terminal tails into the narrow channel between beta2 and beta 5. Subsequent
auto-catalytic cleavage of the beta1, beta2 and beta5 subunits expose the N-terminal catalytic
threonines, which then cleave the pro-peptides of adjacent beta6 and beta 7 (Chen and
Hochstrasser 1996). The Ump1 remains bound in the core of the proteasome through the
dimerization process and is subsequently degraded by the catalytic activity of the proteasome
(Hirano et al. 2008; Ramos et al. 1998).
This fully functional core particle is capped by a huge 200kDa HEAT-repeat protein Blm10
(PA200 in humans), which docks on the alpha ring the core particle via its HbYX motif forming
a dome-like structure (Schmidt et al. 2005; Dange et al. 2011). Among the numerous functions
ascribed to Blm10 are to stabilize the nascent core particle, prevent accidental entry of proteins
or partially folded proteins into the proteolytic core (Dange et al. 2011), shuttle functional and
dissociated core particle between nucleus and cytoplasm (Weberruss et al. 2013). Incidentally,
deletion mutants of Blm10 along with beta 7 tail deletion leads to severe core particle assembly
defects in yeast, thus indicating the importance of Blm10 in proteasome assembly(Marques et
al. 2007).

Figure 1.4. Assembly process of the 20S proteasome (Kunjappu and Hochstrasser 2014)
1.4.2 Assembly of the 19S regulatory particle:
Since the regulatory particle is far more heterogenous in structure and function as compared to
the core particle, its assembly requires a different and unique set of chaperones. The base and
lid of regulatory complex is assembled independently which are then stitched together (Bai et
al. 2019; Isono et al. 2007). The assembly of the regulatory particle base subcomplex is
mediated by four dedicated Rpt assembly chaperones; Nas2, Nas6, Hsm3 and Rpn14 in yeast
and p27, p28,S5b and PAAF-1 in mammals (Kaneko et al. 2009; Funakoshi et al. 2009; Roelofs
et al. 2009). Each of these chaperones harbour a specific protein interaction domain which
interacts with C-terminus of its designated Rpt subunits, thus forming three Rpt precursor
assembly modules, which are Nas2-Rpt4-Rpt5, Nas6-Rpt3-Rpt6-Rpn14, Hsm3-Rpt2-Rpt1-
Rpn1 modules. Once recruited, these base modules are stabilized by interaction among the N-
terminal coiled-coil domains of the ATPases. An interesting fact is that none of the assembly

chaperones are part of the fully assembled proteasome (Funakoshi et al. 2009), indicating that
the chaperones exit once the assembly occurs, and therefore presence of chaperones could be
a steric hindrance for assembly of intact functional proteasome. Extensive studies on the
assembly pathway of 19S complex by independent groups have established that formation of
the 19S base subcomplex begins with association of the Nas2 and Nas6 modules, which is
subsequently followed by addition of the Hsm3 component along with Rpn10 and Rpn13. The
final step of base assembly is incorporation of Rpn10 (Saeki et al. 2009; Kaneko et al. 2009;
Roelofs et al. 2009). Alternatively, another model for base formation has been put forth, in
which the base modules are assembled on the top of the alpha ring (Kusmierczyk et al. 2008).
The interaction mode of each regulatory particle assembly chaperone has been investigated in
great detail using crystallographic studies of Rpt-chaperone structures. Each chaperone
harbours a distinct protein interaction domain, including ankyrin repeats in Nas6/p28
(Nakamura et al. 2007), WD40 repeats in Rpn14 (Kim et al. 2010), HEAT repeats in Hsm3/S5b
(Barrault et al. 2012) and PDZ domain in Nas2/p27 (Funakoshi et al. 2009), which bind to the
C-terminal tail of its cognate ATPase as revealed by crystallographic studies and yeast two
hybrid studies (Nakamura et al. 2007; Saeki et al. 2009). Since the C-terminal tails of ATPase
subunits dock into the inter-subunit pockets of alpha ring in the core particle, thereby activating
the core particle (Smith et al. 2007; Gillette et al. 2008), binding of the above chaperones to
the C-terminus of Rpt would serve as a blocker for proteasome activation, preventing assembly,
which is also in accordance with the observation that the assembly chaperones are bound only
to the regulatory particle and not in the fully assembled proteasome.
The assembly of the 19S complex particle lid begins when DUBs Rpn8 and Rpn11 dimerize,
succeeded by consecutive binding of Rpn6, Rpn5 and then Rpn9(Estrin et al. 2013). Alongside,
Sem1 chaperone aids assembly of Rpn3 and Rpn7 to form a trimeric complex(Sharon et al.
2006). These two subcomplexes are assembled to form the nearly complete lid which now only

lacks Rpn12. Sem1 plays crucial role in RP lid assembly by stabilizing Rpn3-Rpn7 interaction
during early steps of lid formation, and is the, the only chaperone identified in lid assembly till
date. In the final step of lid assembly, Rpn12 which induces large conformational changes via
its C-terminal helix to reorganize the lid from compact to more loosely packed structure, thus
leading to the formation of a complete lid subcomplex.
1.4.3 Formation of 26S holo proteasome:
The ultimate step in proteasome assembly is the association of the 19S regulatory and 20S core
particles to form the entire, functional 26S proteasome. This is initiated by anchoring of the C-
terminal hydrophobic tail of Rpt subunits into the cavities between adjacent alpha particle
subunits, which in turn leads to opening of proteasome gate and allows substrate entry (Smith
et al. 2007; Rabl et al. 2008). The lid-base association is spontaneous in nature and requires
ATP for stabilization (Livnat-Levanon et al. 2014). This process is reversible, as gauged by
spontaneous dissociation of 20S and 19S complexes in the absence of ATP. Rpn6 also helps in
stabilization of RP-CP complex by binding to alpha 2 subunit(Lander et al. 2012). In addition
to proteasomal assembly chaperones, numerous other chaperones have been implicated in
proteasome assembly, which include Ecm29, which serves as the quality control protein for
preventing aberrant formation of proteasome, and Hsp90 whose function remains elusive till
date (Park et al. 2011; Imai et al. 2003).

Figure 1.5. Schematic representation of the assembly process of the 19S proteasome
(Kunjappu and Hochstrasser 2014)
1.5. PSMD9, a proteasome assembly chaperone
PSMD9/p27 is a human ortholog of Nas2, which is involved in assembly of the ATPase ring
at the base of the regulatory particle. Although the crystal or solution structure of PSMD9 is
not available yet, literature and modelling studies have indicated that it comprises of a coiled-
coil domain at N-terminus and a PDZ domain at C-terminus. PSMD9 was first identified by
DeMartino and coworkers as a part of a tri-modulator complex that enhances proteasome
assembly (DeMartino et al. 1996) along with two ATPases p42 and p50, which are PSMC3
and PSMC6 respectively. Later the cDNA of PSMD9 was cloned and the location if PSMD9
was mapped to chromosome 12 (12q24.2–q24.3) and sequence similarity studies identified it
to be a close homolog of Nas2 (yeast) and similar counterpart in C.elegans (Watanabe et al.
1998). Extensive characterization of proteasomal assembly functions of PSMD9 and its yeast
counterpart, Nas2 have revealed that it binds and recruits two proteasomal ATPases PSMC3
and PSMC6 of the ATPase ring(Kaneko et al. 2009; Saeki et al. 2009).

1.5.1 Assembly independent functions of PSMD9
However, apart from being a bonafide assembly chaperone, PSMD9 has been implicated in
other cellular functions as well. Gragnoli and coworkers performed sequencing of a cohort of
Italian patients with type 2 diabetes and discovered four rare single-nucleotide polymorphisms
in PSMD9 which were associated with type 2 diabetes(Gragnoli and Cronsell 2007). Further,
these SNPs were also linked to depression and anxiety disorders in type 2 diabetes (Gragnoli
2010). A number of other studies identified strong association of PSMD9 SNPS and clinically
diagnosed cases of schizophrenia and depression, which incidentally also suggested possible
role of PSMD9 as a transcriptional co-activator (Wong et al. 2008; Lee, Kim, and Song 2013).
It is likely that SNPs in PSMD9 lead to change in antigen processing or degradation which may
be responsible for differential immune response in individuals treated with antidepressants.
This is also supported by studies which indicate that PSMD9 as a part of the proteasome may
be involved in immunotolerance checking process and therefore, dysregulation of these
pathways could lead to heightened or autoimmune response, leading to mental illnesses
(Gragnoli 2012).
Bridge-1, the rat homolog of PSMD9 was found to enhance transcription of insulin signaling
by interacting with transcription factors PDX-1 (pancreas duodenum homeobox-1), E12 and
E47 via its PDZ domain (Stanojevic, Yao, and Thomas 2005; Thomas et al. 1999).
Overexpression of PSMD9 led to increased survival of beta cells in the pancreas, while
decreased expression of PSMD9 led to lowering of insulin promoter activity in rat insulinoma
cells (INS-1), which suggested strong role of PSMD9 in diabetes. However, in contrast, Volinic
and colleagues reported that overexpression of PSMD9 led to insulin deficiency and diabetes
in mice, thus indicating a bimodal role of PSMD9 in insulin signaling. They also showed that
increasing levels of PSMD9 initially activate transcription, but later leads to uncoupling of the

transcription activating complexes. Thus, individuals with SNPs in PSMD9 or lower levels of
PSMD9 could be at higher risk of type II diabetes, which makes it an attractive therapeutic
target for personalized treatment.
Inflammation is one of the key pathways for development of type II diabetes and metabolic
stress induced-chronic inflammation of pancreatic islets leads to defective insulin secretion
(Donath 2014). In coherence, a study by Liu et al showed that production of reactive oxygen
species due to diabetes led to increase in PA700 dependent proteasome function and also
increased NF-κB activation, thus implicating the role of PSMD9 in inflammation and
regulation of NF-κB in diabetes (Liu et al. 2012). Apart from inflammation and diabetes,
studies have also implicated probable role of PSMD9 in cell cycle progression. When breast
cancer cells were treated with TGF-B family ligand, increase in PSMD9 expression and along
with its signal transduction proteins, Smad2, Smad3 and Smad4 were observed. Subsequently,
knockdown of PSMD9 led to decrease in levels of Smads, suggesting a strong correlation
between PSMD9 and Activin signalling pathway mediated by Smads(Banz-Jansen et al. 2011).
Activin A is involved in myriad of cancer signalling pathways including inflammation, wound
repair and glucose metabolism among others(de Kretser et al. 2012; Hashimoto and Funaba
2011).
A recent report by Langlands et al provided a direct evidence of PSMD9 levels in modulation
of radiotherapy response, where they showed that patients having low expression of PSMD9
had reduced incidence of recurrence after adjuvant radiotherapy, thus providing a probable
previously uncharacterized role of PSMD9 in mediating radio-sensitivity. Additionally,
silencing PSMD9 in breast cancer cells led to increased sensitivity of cells to radiotherapy,
indicating a novel role of PSMD9 in mediating radiotherapy response in breast cancer
(Langlands et al. 2014).

1.5.2 PSMD9 and NF-κB pathway
Previously, several novel interacting partners of PSMD9 were identified in our lab which
included hnRNPA1 (heterogenous ribonucleoprotein-1), growth hormone, S14 (ribosomal
protein) and FN3 domain of IL-6 receptor (Sangith et al. 2014). Our lab also established that
interaction of PSMD9 with hnRNPA1 activation of NF-κB via proteasomal degradation of
IκBα. The PDZ domain of PSMD9 binds to the C-terminal motif GRRF of hnRNPA1, which
in turn interacts with IκBα, thereby recruiting it to the proteasome for degradation, thereby
releasing NF-κB from its inhibitor, IκBa. NF-κB then translocates to the nucleus, where it leads
to activation of its downstream genes (Sahu et al. 2014). An interesting observation in the study
was that PSMD9 was bound to proteasome whereas previous studies report that the assembly
chaperones dissociate upon proteasome assembly and are not a part of fully formed
proteasome, which could probably indicate that during signal-induced NF-κB activation,
PSMD9 aids in IκBα degradation by binding to proteasome instead of functioning as an
assembly chaperone, and is therefore found in association with proteasome
1.5.3 PSMD9: structural inferences from Nas2 crystal structure
Although no crystal or solution structure of PSMD9 or its domains is not solved till date, the
structure of the N-terminal and PDZ domain of Nas2, the yeast ortholog of PSMD9 has been
solved independently by two groups (Satoh et al. 2014; Singh et al. 2014). Nas2 and PSMD9
share 42% identity and 64% sequence similarity. Therefore, using the crystal structures of Na2
N-domain (PDB ID: 3WHJ) and Nas2 PDZ domain (PDB ID: 4O06) as template, the model of
PSMD9 can be deciphered.
The N-terminal domain of Nas2 comprises of four alpha helices, α1, α2, α3 and α4, where the
α4 helix forms the structural core with α2 and α3 helices. The study reported a novel mode of
interaction of the α3 and α4 helices with the α1 helix of its cognate ATPase Rpt5 in the crystal

complex of Nas2N -Rpt5C domain (3WHL). This new mode of interaction came as a surprise,
since previously, Lee et.al had reported that PDZ domain of Nas2 interacts with the C-terminus
of Rpt5, and deletion of C-terminal tail of Rpt5 leads to proteasome assembly defect.
Investigation into the detailed mode of binding using a combination of homology modelling
and NMR chemical shift perturbations indicated a dual mode of interaction of Nas2 with Rpt5.
The N-domain of Nas2 interacts with the inner alpha helices of Rpt5, while the Nas2 PDZ
domain interacts with the C-terminal motif of Rpt5.
The crystal structure of Nas2 PDZ domain indicates that it forms a typical PDZ domain-like
fold comprising of five beta strands and two alpha helices. In sharp contrast to conventional
PDZ domains where the binding pocket is formed by the β2 strand and α2 helix, there appears
to be a cyclic permutation in the beta-sheet arrangement, where the β5 strand forms the floor
instead of the β2 strand and the binding motif harbours the sequence GLLG instead of the
typical GLGF motif found in most PDZ domains (Lee and Zheng 2010). The altered beta sheet
arrangement is similar to that observed in GRASP5 PDZ domain (Truschel et al. 2011). The
interaction of Nas2 PDZ domain with the Rpt5 peptide studied by biolayer inferometry,
revealed that Nas2 PDZ domain had a high affinity for Rpt5 C-domain (8.5µM), however the
affinity was modestly lower than the full length Nas2 (1.4µM), indicating that the N-terminal
domain of Nas2 also modulates affinity to Rpt5, either by influencing binding or providing
structural stability to Nas2.
1.6 PDZ domains: Protein interaction domains for recognition of short-linear sequence
motifs (SLiMs)
It is of paramount importance to the cell to organize cellular processes in a spatio-temporal
manner. Most cellular signalling processes operate in an ultrafast manner to the tune of
nanoseconds. In order to achieve specificity during such processes, signalling molecules and

complexes require to be in close contact and correct orientation. Scaffolding proteins play a
pivotal role in bringing together signalling molecules in close proximity to enable them to bind,
localize and function in a precise manner(Good, Zalatan, and Lim 2011). Most scaffold
proteins harbour distinct protein-protein interaction or protein-lipid or protein-carbohydrate
interaction domain and are often found to be a part of a larger proteins which include many
classes of receptors, transporter proteins, ion-channels and kinases(Hung and Sheng 2002).
PDZ domains are one such class of protein interacting domains which recognize and bind to
C-terminal sequence of interacting partners (Kornau et al. 1995; Niethammer, Kim, and Sheng
1996), although some PDZ domains can recognize and bind to internal motifs (Hillier et al.
1999). They were first identified as regions of sequence homology found in myriad of
signalling proteins and were also named as DHR (Discs large homology repeat) proteins(Cho,
Hunt, and Kennedy 1992; Woods and Bryant 1993; Kim et al. 1995) or GLGF repeat (due to
presence of the conserved GLGF motif) proteins. The term PDZ is an acronym of proteins in
which they were identified; PSD-95 (a 95 kDa protein involved in signalling at the post-
synaptic junctions), Discs-large (Drosophila melanogaster DLG) protein and ZO-1 (zonula
occludens protein, which maintains cellular polarity) (Kennedy 1995). PDZ domains are
predominantly found as part of signalling complexes, where the act as scaffold proteins to
recruit signalling proteins, and are an integral part of almost all cellular processes (Lee and
Zheng 2010).
1.6.1. PDZ domain structure
The crystal structure of the PSD-95 PDZ3 domain in its native and peptide bound form was
the first PDZ domain structure to be determined (Doyle et al. 1996). Subsequently, the
structures of other PDZ domains including PDZ2 of PSD95 (Tochio et al. 2000), PDZ domains
of syntrophin (Schultz et al. 1998), nitric oxide synthase (nNOS), PDZ1 of Na/H+ exchange

regulatory factor (NHERF-1) (Karthikeyan, Leung, and Ladias 2001) were determined, which
revealed the common structural fold of PDZ domains. The overall structural architecture of
PDZ domains comprises of six beta strands and two alpha helices which fold in a beta-sandwich
structure. The C-terminal peptide of interacting partner protein binds in an extended manner in
the hydrophobic pocket formed between the β2 strand and α2 helix forming an antiparallel beta
strand to the β2 of PDZ domain, thus extending the PDZ domain by an additional beta strand
(Harrison 1996). The loop connecting the α2 helix and β2 strand harbours the conserved
glycine-leucine-glycine-phenylalanine (GLGF) motif, which is found in majority of PDZ
domains, although variations in the conserved motif also exist. The N and C-termini of the PDZ
domains lie close to each other, similar to other protein interaction domains like the SH2
domain.
The arrangement of the beta strand is also found to vary in few PDZ domain structures, In the
Nas2 and GRASP5 PDZ domain, the beta 5 strand forms the floor for peptide binding instead
of the beta2 strand (Singh et al. 2014; Truschel et al. 2011); in the PDZ like domain of the D1
protease of photosystem II and Tsp protease of E.coli, the first strand is formed by the C-
terminus instead of N-terminus (Liao et al. 2000; Beebe et al. 2000).
Additionally, some families of PDZ-like domains are also found in proteins if the (high-
temperature requirement serine protease) Htra family, which comprise of five beta strands
capped by two alpha helices and capped by two additional beta strands at N and C-termini (Xu
et al. 1998).
A subset of PDZ domains are also found to exist in dimeric forms, including Shank-1 PDZ
domain and GRIP-1 PDZ6 domain, which form homodimers through the loop connecting
second and third beta strand, which however, does not alter the peptide binding regions of both
PDZ domains (Im, Lee, et al. 2003; Im, Park, et al. 2003). An unusual mode of dimer formation
mediated by symmetrical domain swapping of beta strands has been identified in PDZ2 of ZO-

1 protein by two independent groups (Utepbergenov, Fanning, and Anderson 2006; Wu et al.
2007).
Figure 1.6. Cartoon representation of the third PDZ domain of PSD-95 in complex with
peptide typical PDZ domain (Jeleń et al. 2003)
1.6.2 The binding pocket in PDZ domains
PDZ domains harbour a single binding motif between the alpha 2 and beta 2 strand comprising
of a highly a conserved binding pocket harbouring the G- φ -G- φ motif, where φ is hydrophobic
residue (Doyle et al. 1996). The first glycine residue is not conserved and can be replaced by
serine, threonine or phenylalanine, while the second and fourth residues are hydrophobic
residues including valine, isoleucine, leucine or phenylalanine (Laskowski, Chistyakov, and
Thornton 2005). The side chains of these residues form the hydrophobic pocket of PDZ
domains, which is pre-requisite for peptide binding (Morais Cabral et al. 1996). Analysis of
the Ramachandran plot of the residues in the binding pocket reveal that each residue harbours
distinct conformation. The second residue in the G-φ-G- φ binding loop adopts alpha helical
conformation, while the fourth residue harbours beta strand-like conformation. The third
glycine residue is conserved and adopts left alpha helical conformation. The specific

conformation of residues is necessary to allow the amides of the residues in binding pocket to
function as H-bond donors (Lee and Zheng 2010).
1.6.3 Structural basis of PDZ domain-ligand interaction
Extensive crystallographic studies on PDZ-peptide complexes have revealed that the C-
terminal four residues of the ligand are involved in direct interaction with the hydrophobic
peptide binding pocket in PDZ domain. The peptide ligand which forms an extended beta
strand forms hydrogen bonds with the beta 2 sheet which stabilizes the peptide binding, but
does not mediate specificity of PDZ-peptide interaction. Detailed analysis of C-terminal
residue binding to PDZ using peptide library screening approach reveals that recognition of
carboxylate group of the peptide by PDZ domain is crucial for peptide binding, since the
terminal carboxylate of the ligand is involved in hydrogen bonding with the amide groups in
the main chain of the residues in binding pocket of PDZ domain, which firmly orients the
peptide in the pocket. The C-terminal residue in the of the peptide is designated as P0 residue,
and subsequent residues towards N-terminus are referred as P-1, P-2 P-3 etc. An extensive
peptide library screening approach by Songyang and coworkers classified PDZ domains based
on their distinct binding specificities (Songyang et al. 1997), which implicate that the residues
at P0 and P-2 position in the C-terminal peptide are the most critical determinants of
recognition. Concurrently, PDZ domains are broadly divided into three classes based on their
binding preferences for residues at these positions; Class I PDZ domains recognize S/T-X- φ-
COOH motif (φ: hydrophobic; X: any amino acid); Class II PDZ domain recognize the
sequence φ-X- φ-COOH motif; Class III PDZ domains recognize X-X-C-COOH motif. There
also exist PDZ domains which do not belong to the above classes.
The P0 residue, which is hydrophobic docks into the hydrophobic groove of PDZ domain,
while the sidechain of the residue at P-2 position docks into a separate pocket. Sequence

variation of residues that line the pocket could change the preference for particular hydrophobic
residue at P0 position, while variation of residues in P-2 binding pocket can result in preference
for charged or hydrophobic residues at P-2 position. The precise positioning of peptide in the
binding groove allows the side chains of P0 and P-2 residues to point inwards in peptide-
binding groove, which could also account for the importance of these residues in determining
specificity. However, there are also reports of other residues adjacent to the peptide binding
groove that play a role in determining specificity which could help in fine tuning of specificity
for specific interactions (Doyle et al. 1996; Tochio et al. 2000).
1.6.4 PDZ domains as functional modules in cellular signalling
Scaffolding functions:
PDZ domains are primarily known to function as a part of scaffolding complexes, which help
in localizing multiple protein complexes and assist localization of cellular proteins. They were
first identified in PSD-95 where, the PDZ1 and PDZ2 domains in PSD-95 which interact with
the C-terminal peptides of Shaker type K+ channels and NR2 subunits of NMDA (N-methyl-
D-aspartic acid) receptors (Kim et al. 1995; Kornau et al. 1995). The PDZ domains of PSD-95
and syntrophin interact with PDZ domain of nNOS (nitric oxide synthase) bringing nNOS and
synaptic NMDA receptor in close proximity thereby mediating association of nNOS with
skeletal muscle membranes (Brenman et al. 1995).
Role in phototransduction process in Drosophila:
They aid in anchoring of receptors to the cytoskeleton for example assembly of the
phototransduction pathway in Drosophila is mediated by InaD, which harbours multiple PDZ
domains (Montell 1998). The photoreceptor cells in Drosophila are specialized for specific
detection of photons. Photon-mediated activation of receptor protein rhodopsin causes rapid

depolarization of cells, opening up large number of channels. InaD is a key regulator of this
phototransduction process and it was first identified as a mutation which led to retinal
degeneration. Interestingly, InaD mutants showed mislocalization of many proteins in the
signalling pathway. Extensive characterization of InaD revealed that it has five tandem PDZ
domains which interact with specific proteins in the phototransduction pathway. The third and
fourth PDZ domains are involved in PDZ-PDZ interaction and hence aid in oligomerization.
The effective organization of multiple proteins by InaD helps in ultrafast phototransduction
process within 20 milliseconds, and hence this process is also termed ‘quantum bump’.
6.4.3 PDZ domains in regulation of membrane protein activity and protein trafficking:
NHERF1/EBP50 (Na+/H+ exchanger regulatory factor/ Ezrin-radixin-moesin -binding
phosphoproteinof 50kDa) controls activity of Na+/H+ antiporter and regulates activity of beta
2 adrenergic receptor by controlling its localization and recycling. PDZ domains of NHERF1
interact with C-terminal tails of B2 adrenergic receptor in the endosome and recycles it to
plasma membrane, while inhibition of PDZ domain interaction by phosphorylation of β2
adrenergic receptor directs the receptor to lysosome for degradation. via endocytosis.
Establishment of cellular polarity:
The PDZ domains of LIN family of proteins in C. elegans mediate polarity in epithelial cells
by mediating localization of LET-23, a tyrosine kinase receptor to the basolateral side of the
cells. Loss of LIN proteins leads to defects in receptor localization, while deletion of last six
residues of LET-23 leads to defect in vulval induction in epithelial cells (Kaech, Whitfield, and
Kim 1998).
CFTR signalling:

Cystic fibrosis transmembrane conductance regulator (CFTR) is a chloride ion channel which
maintains ion and fluid balance which is essential for clearance of mucus. The activity of CFTR
is regulated by a combination of cAMP concentration, activity of protein kinase A and protein
interactions. Interaction of a NHERF PDZ domain with C-terminus of CFTR anchors the
channel to membrane of epithelial cells (Raghuram, Mak, and Foskett 2001). Other PDZ
domain containing proteins, including Shank-1 and CAL (CFTR-associated ligand) interact
with CFTR and localizes it in Golgi to facilitate endocytosis (Li and Naren 2010). Thus,
interaction of CFTR with multiple PDZ domain containing proteins is crucial for its recruitment
to the membrane and receptor internalization by endocytosis, which helps in maintenance of
ion conductance and mucus thickness
1.6.5 PDZ domains in disease
PDZ domains in neuronal dysfunction:
Several PDZ domain proteins are an integral part of many neural synaptic junctions,
t\abrogation of PDZ-motif interaction is often associated with profound neurological
dysfunction (Toyooka et al. 2002). Loss of Dlg1 leads to aberrant glutamate signalling pathway
in schizophrenia. Interaction of PSD-95 PDZ with glutamate receptors including AMPAR,
NMDAR and 5-HT and association of neuroglin (NLGN) with neurexin, a postsynaptic
transmembrane protein crucial for neural function, CASK and other PDZ proteins is crucial for
maintenance of synaptic functions and dysregulation of this complex network leads to
schizophrenia and autism spectrum disorders (Sudhof 2008).
PDZ domains in cancer:

PDZ domains play crucial role in tumor progression in multiple cancers. The Wnt signalling
cascade is critical for tumor formation and progression by induction of transcription of
cyclinD1 and C-Myc (Weeraratna et al. 2002; Yuzugullu et al. 2009). The dishevelled (Dvl)
protein, a PDZ domain containing protein of Wnt signalling cascade is overexpressed in many
breast and lung cancers. Concurrently, loss or deletion of Dvl slows tumor progression in
cancers, suggesting that PDZ domain interactions in the Wnt pathway drive tumorigenesis
(Nagahata et al. 2003; Uematsu et al. 2003). PDZ domains found in association with cell-cell
junctions where they regulate epithelial-mesenchymal transition, which is a key step in
malignant transformation in cancers. The TGF-B signalling cascade activates the Par complex,
which is interacts with PDZ domain containing proteins mediates apical-basal polarity in cells,
which is lost in many tumours leading to malignant transformation (Aranda, Nolan, and
Muthuswamy 2008). Patients with a predisposition to develop acute myeloid leukemia were
found to have higher levels of PDZ domain GEF (guanidine exchange factor) LARG protein
(Rujkijyanont et al. 2007). Tumor suppressors like APC and PTPN phosphatase harbour C-
terminal motif which interacts with PDZ domains, and subsequently, disruption of PDZ-ligand
interactions leads to unchecked cell proliferation and is implicated in many cancers (Miyoshi
et al. 1992).
PDZ domains in cystic fibrosis:
CFTR is a protein involved in maintenance of ion/fluid balance, which helps in clearance of
mucus. Disruption of the interaction of CFTR with it PDZ binding partner leads to a
pathological condition known as cystic fibrosis. Mutation of the last residue in CFTR (del
F508) leads to misfolding of protein leading to decreased ion conductance activity and rapid
degradation, which is mediated by the interaction of CFTR with CAL PDZ domain (Lukacs et

al. 1993). This mutation leads to impairment of ion transport across epithelial membranes,
causing buildup of mucus in the lung airways (Riordan 2008).
1.6.6 Targeting PDZ-peptide interaction: Implications in cancer and neuronal therapy:
Inhibition of protein-protein interactions is one of the approaches to target diseases resulting
due to deranged cellular signalling. Since PDZ domain interactions are critical to many
biological processes and loss of PDZ-ligand interaction can result in various pathological
outcomes including neuronal toxicity, neuropathic pain, cancers and cystic fibrosis, they serve
as attractive therapeutic targets. In addition, the unique nature PDZ domain interaction arising
from its short yet specific recognition motif could serve as scaffold for design of inhibitors with
lesser off-target effects, along with being permeable, bioavailable and cost effective as
compared to monoclonal antibodies. Thus, PDZ domains have emerged as attractive ‘druggable
targets’ (Dev 2004)
PDZ domain inhibitors in neuronal diseases:
PDZ domains play a key role in organization and localization of cellular complexes at synaptic
junctions and maintenance of synaptic plasticity, through PSD-95, nNOS and NMDAR PDZ
containing proteins. It has been observed that excess of NO causes neural toxicity alongwith
ischemic brain damage (Huang et al. 1994). Inhibition of PSD-95 using an antisense
oligonucleotide led to decrease in neurotoxicity without disrupting NMDAR functions(Sattler
et al. 1999). Few studies have been successful in inhibiting interaction of PSD-95 with its
ligands using naturally occurring C-terminal peptides, thus making PSD-95 an attractive target
for inhibitor to treat stroke and neuropathic pain (Aarts et al. 2002). A modified peptide ligand
derived from NR2B subunit of NMDAR was able to suppress NO production by inhibiting
association of PSD-95 with NMDAR and nNOS. Further, intraperitoneal injection of this
peptide into mice profoundly reduced ischemic neuronal damage after onset of stroke (Cui et
al. 2007). Further, this peptide has been further optimized to improve pharmacokinetics and
stability of the peptide Currently, a combination of two Tat ligands linked by a central modified
PEG linker is the most effective PSD-95 antagonist and is an attractive target for treatment of
stroke (Bach et al. 2008; Bach et al. 2012).
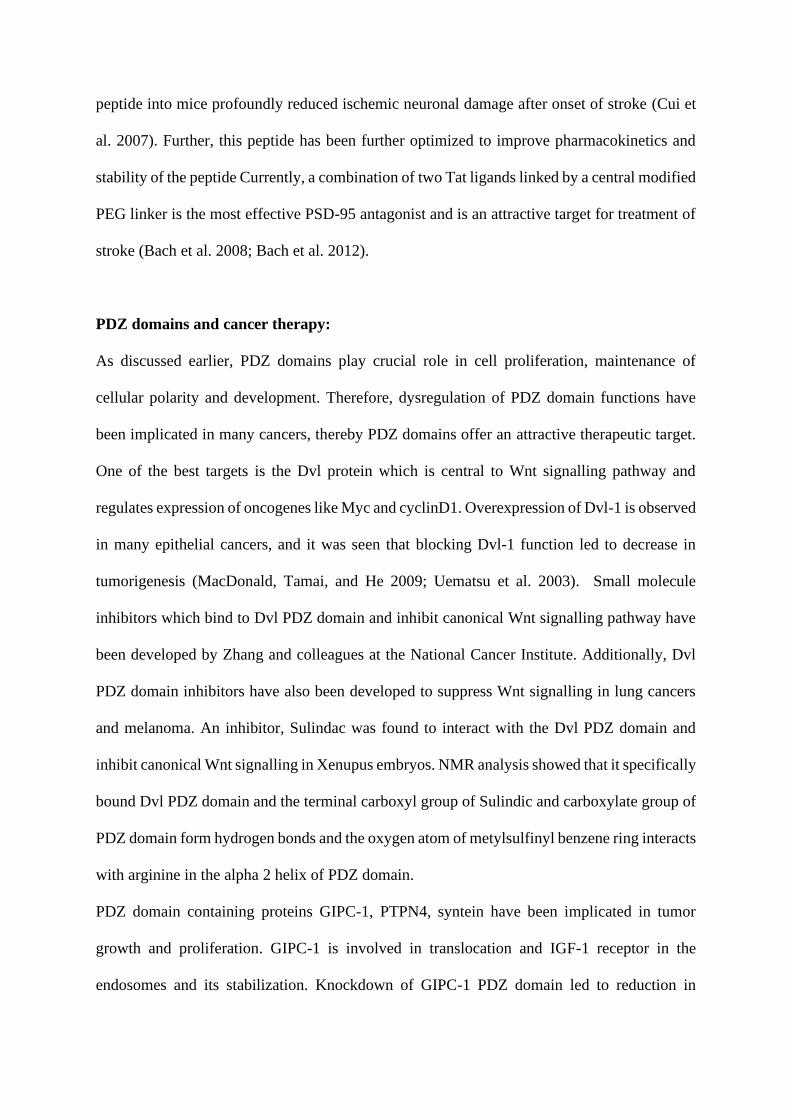
PDZ domains and cancer therapy:
As discussed earlier, PDZ domains play crucial role in cell proliferation, maintenance of
cellular polarity and development. Therefore, dysregulation of PDZ domain functions have
been implicated in many cancers, thereby PDZ domains offer an attractive therapeutic target.
One of the best targets is the Dvl protein which is central to Wnt signalling pathway and
regulates expression of oncogenes like Myc and cyclinD1. Overexpression of Dvl-1 is observed
in many epithelial cancers, and it was seen that blocking Dvl-1 function led to decrease in
tumorigenesis (MacDonald, Tamai, and He 2009; Uematsu et al. 2003). Small molecule
inhibitors which bind to Dvl PDZ domain and inhibit canonical Wnt signalling pathway have
been developed by Zhang and colleagues at the National Cancer Institute. Additionally, Dvl
PDZ domain inhibitors have also been developed to suppress Wnt signalling in lung cancers
and melanoma. An inhibitor, Sulindac was found to interact with the Dvl PDZ domain and
inhibit canonical Wnt signalling in Xenupus embryos. NMR analysis showed that it specifically
bound Dvl PDZ domain and the terminal carboxyl group of Sulindic and carboxylate group of
PDZ domain form hydrogen bonds and the oxygen atom of metylsulfinyl benzene ring interacts
with arginine in the alpha 2 helix of PDZ domain.
PDZ domain containing proteins GIPC-1, PTPN4, syntein have been implicated in tumor
growth and proliferation. GIPC-1 is involved in translocation and IGF-1 receptor in the
endosomes and its stabilization. Knockdown of GIPC-1 PDZ domain led to reduction in

survival of cancer cells, highlighting its importance as a novel target to inhibit tumorigenesis.
An N-terminal myristoylated octapeptide designed to block GIPC-1 PDZ domain showed
significant reduction in in vitro as well as in vivo growth, survival and proliferation of tumours.
Further modification of this compound yielded a more potent peptide inhibitor which
significantly reduced breast and pancreatic tumours in mice.
The PTPN4 protein has been explored as a potential target for glioblastoma. A series of
peptides of varying affinities were designed by introducing residues of varying charges at P-1
and P-4 positions. The enhanced peptide-HIV Tat protein fusion was able to effectively induce
apoptosis in highly invasive glioblastoma cell line.

Chapter 2:
Materials and methods

Materials
2.1 Media for bacterial culture
3.1.1 LB broth (1000ml):
25 g of LB powder (Merck) was dissolved in 1 liter of fresh MilliQ water and autoclaved.
2.1.2 LB agar (500ml):.
LB powder (Merck): 12.5 g
Agar (Himedia): 10g
LB powder and agar were added in 500ml of fresh MilliQ and autoclaved. Alternatively, the
LB agar mixture can also be heated briefly in microwave to dissolve the agar and then
transferred to 50ml tubes, each containing 15 ml of LB agar and then autoclaved.
2.2. Antibiotics stock preparation
100mg/ml Ampicillin stock
2g of ampicillin sodium salt was carefully weighed and dissolved in 20ml of fresh MilliQ.
The solution was filter sterilized using 0.22µ filter and distributed as 1ml aliquots in sterile
microcentrifuge tubes and stored at -20oC
50mg/ml Kanamycin
1g of kanamycin was weighed and dissolved in 20ml of fresh MilliQ. The solution was filter
sterilized using 0.22µ filter and distributed as 1ml aliquots in sterile microcentrifuge tubes
and stored at -20oC
34mg/ml Chloramphenicol

0.68g of chloramphenicol was weighed and dissolved in 20ml of ethanol. The solution was
filter sterilized using 0.22µ filter and distributed as 1ml aliquots in sterile microcentrifuge
tubes and stored at -20oC
50mg/ml Carbenicillin (non-hydrolysable analogue of ampicillin)
1g of carbenicillin was weighed and dissolved in 20ml of fresh MilliQ. The solution was
filter sterilized using 0.22µ filter and distributed as 1ml aliquots in sterile microcentrifuge
tubes and stored at -20oC
2.3. Buffer and chemical stock preparation
2M Tris-HCl
121.14g of Tris base (Himedia) was weighed and dissolved in 400ml of fresh MilliQ water by
continuous stirring. The pH of the solution was adjusted to 7.5 using concentrated HCl. The
volume of buffer solution was made up to 500ml by MilliQ water. The solution was filtered
through Whatman filter paper no.2 and autoclaved.
1M HEPES
119.15g of HEPES sodium salt was weighed and dissolved in 400ml of fresh MilliQ water.
The pH was adjusted to 7.5 with 10N NaOH and volume was adjusted to 500ml with MilliQ
water. The buffer was filtered through Whatman filter paper no.2 and stored in 50ml aliquots
in sterile tubes at 4oC.
1M Na2HPO4

70.98g of Na2HPO4 was weighed and dissolved in 400ml of fresh MilliQ water by continuous
stirring. The volume of buffer solution was made up to 500ml by MilliQ water. The solution
was filtered through Whatman filter paper no.2 and autoclaved.
1M NaH2PO4
78.005g of NaH2PO4 was weighed and dissolved in 400ml of fresh MilliQ water by
continuous stirring. The volume of buffer solution was made up to 500ml by MilliQ water.
The solution was filtered through Whatman filter paper no.2 and autoclaved.
5M NaCl
146.1g of NaCl was dissolved in 400ml of fresh MilliQ water by continuous stirring. Once
dissolved, the volume was made up to 500ml. The solution was filtered using Whatmann
filter paper no.2 and autoclaved.
1M DTT
154.25mg of DTT was dissolved in 1ml of sterile (autoclaved) MilliQ water
1M Imidazole
6.81g of imidazole was dissolved in 100ml of fresh MilliQ water and autoclaved.
100mM IPTG
0.48g of IPTG was carefully weighed and dissolved in 20ml of fresh MilliQ. The solution
was filter sterilized using 0.22µ filter and distributed as 1ml aliquots in sterile
microcentrifuge tubes and stored at -20oC
10X protease inhibitor cocktail

10ml of sterile ultrapure water was added to 1 vial of Protease Inhibitor Cocktail (Sigma).
The vial vortexed briefly to dissolve the components. The reconstituted PIC were distributed
in sterile microcentrifuge tubes and stored at -20oC
2.4. Protein purification buffers
2.4.1 Ni-IDA (nickel affinity chromatography) lysis buffer (500ml)
50mM Tris: 12.5ml of 2M Tris HCl stock
300mM NaCl: 30ml of 5M NaCl
20mM Imidazole: 0.34g of imidazole
10% glycerol: 50ml of 100% glycerol
0.1% Triton-X 100: 1ml of Triton-X100
5mM beta-mercaptoethanol: 175µl of beta-mercaptoethanol stock (14.3 M)
1X Protease Inhibitor Cocktail: 200µl of 10X PIC stock
2.4.2 Ni-IDA wash buffer (500ml)
50mM Tris: 12.5ml of 2M Tris HCl stock
300mM NaCl: 30ml of 5M NaCl
20mM Imidazole: 0.34g of imidazole
10% glycerol: 50ml of 100% glycerol
0.1% Triton-X 100: 1ml of Triton-X100
5mM beta-mercaptoethanol: 175µl of beta-mercaptoethanol stock (14.3 M)
2.4.3 Buffers for gradient elution: (10ml each solution)
Wash buffer + 50mM Imidazole

Wash buffer + 75mM Imidazole
Wash buffer + 100mM Imidazole
2.4.4 Ni-IDA elution buffer: (50ml)
50mM Tris: 12.5ml of 2M Tris HCl stock
300mM NaCl: 30ml of 5M NaCl
250mM Imidazole:0.851g of imidazole
10% glycerol: 50ml of 100% glycerol
0.1% Triton-X 100: 1ml of Triton-X100
5mM beta-mercaptoethanol: 175µl of beta-mercaptoethanol stock (14.3 M)
2.4.5 GST lysis buffer
137mM NaCl
2.7mM KCl
10mM Na2HPO4. 2H2O
2mM KH2PO4
1X Protease inhibitor
1mM DTT
10% glycerol
0.1% TritonX-100
2.4.6 GST wash buffer
137mM NaCl
2.7mM KCl

10mM Na2HPO4. 2H2O
2mM KH2PO4
1mM DTT
10% glycerol
0.1% TritonX-100
2.4.7 GST elution buffer (50ml)
50mM Tris (pH 8.0): 1.25ml of 2m Tris pH 8.0
L- Glutathione reduced 10mM: 0.15g
2.4.8 MBP lysis buffer (100ml)
50mM Tris: 2.5ml of 2M tris pH 7.5
150mM NaCl: 3ml of 5M NaCl
10% glycerol: 10ml of 100 %glycerol
1X Protease Inhibitor Cocktail
2.4.9 MBP wash buffer
50mM Tris: 2.5ml of 2M tris pH 7.5
150mM NaCl: 3ml of 5M NaCl
10% glycerol: 10ml of 100% glycerol
2.4.9 MBP elution buffer
50mM Tris: 2.5ml of 2M tris pH 7.5
150mM NaCl: 3ml of 5M NaCl
10% glycerol: 10ml of 100% glycerol

10mM maltose monohydrate
2.5 Coating buffer for ELISA
10mM Sodium bicarbonate buffer pH 9.3 (50 ml)
Sodium bicarbonate 0.42 g
Sodium carbonate 0.17 g
2.6 Buffers and reagents for DNA preparation and agarose gel electrophoresis
2.6.1. 50X TAE (1 litre)
242g of Tris base was weighed and dissolved by continuous stirring in a beaker containing
500ml fresh MilliQ water. 57.1ml of glacial acetic acid and 100ml of 0.5M EDTA (pH 8.0)
was added to the beaker and mixed. The solution was filtered and stored at room temperature.
2.6.2. 1X TAE (1 litre)
20 ml of 50X TAE stock solution was measured and added to 900ml of fresh MIlliQ water.
The volume was adjusted to 1000ml and filter sterilized using a 0.22µ filter
2.6.3. TE buffer
10 mM Tris-HCl (pH 7.5)
1 mM EDTA
2.6.4. 6X gel loading dye (DNA) (10ml)
Xylene Cyanol FF 0.025 g (migrates at 4160 bp with TAE)

Bromophenol blue 0.025 g (migrates at 370 bp with TAE)
Glycerol: 3ml
2.6.5. Ethidium bromide (EtBr)
Stock concentration 10 mg/ml (20000X)
Working concentration 0.5 μg/ml
2.7. Buffers and reagents for polyacrylamide gel electrophoresis
1.5M Tris pH 8.8 (500ml)
90.85g of Tris base (Himedia) was weighed and dissolved in 400ml of fresh MilliQ water by
continuous stirring. The pH of the solution was adjusted to 8.8 using concentrated HCl. The
volume of buffer solution was made up to 500ml by MilliQ water. The solution was filtered
through Whatman filter paper no.2 and autoclaved
1.0M Tris pH 6.8 (500ml)
60.57g of Tris base (Himedia) was weighed and dissolved in 400ml of fresh MilliQ water by
continuous stirring. The pH of the solution was adjusted to 6.8 using concentrated HCl. The
volume of buffer solution was made up to 500ml by MilliQ water. The solution was filtered
through Whatman filter paper no.2 and autoclaved
30% acrylamide solution:
29.2g of acrylamide and 0.8g of bis-acrylamide were weighed and dissolved in 75ml of fresh
MilliQ water in amber coloured bottle under dark conditions. The volume was made up to

100ml and the solution was filtered through Whatman filter paper no. 2 and stored in dark (or
amber bottle) at 4oC.
10% SDS
1g of SDS was carefully weighed and dissolved in 10ml of fresh MilliQ water and stored at
room temperature
10% APS
1g of APS was carefully weighed and dissolved in 10ml of fresh MilliQ water and stored at
room temperature
5X SDS gel loading dye (10ml)
5% β-Mercaptoethanol (5%): 500µl of absolute solution of beta-mercaptoethanol
0.02% Bromophenol blue (0.02%): 2mg
30% glycerol (30%): 3ml of 100% glycerol
10% SDS (Sodium dodecyl sulfate): 1g of SDS
250mM Tris-Cl (pH 6.8): 2.5ml of 1.0M Tris-Cl pH 6.8
1X Transfer Buffer (for 1 L)
Glycine 14.4 g
Tris Base 3.02 g
Milli-Q 800ml
Methanol 200 ml
2.8. Buffers and reagents for western blot

2.8.1. Tris Base Saline Tween 20 buffer (TBST) (for 1L)
50mM Tris: 25ml of 2M Tris
150mM NaCl: 30mlof 5M NaCl
0.1% Tween 20: 1 ml (0.05%)
2.8.2. BSA Blocking buffer (3% BSA in TBST)
3 grams of BSA was weighed and dissolved in 100 ml of 1X TBST. The solution was filtered
through 0.45µ syringe filter and stored at 4oC till use.
2.8.3. Antibody dilution buffer (1% BSA in TBST)
1 gram of BSA was weighed and dissolved in 100 ml of 1X TBST. The solution was filtered
through 0.45µ syringe filter and stored at 4oC till use.
2.8.4. Milk blocking buffer (5% non-fat dry milk)
5 grams of milk powder was weighed and dissolved in 100ml of 1X TBST. The solution was
stored at 4oC till use.
2.9. Buffers and reagents for immunoprecipitation experiments
2.9.4. NP-40 lysis buffer (50ml)
50mM Tris: 0.5 ml of 2M Tris pH 7.5
150mM NaCl: 1.5 ml of 5M NaCl
NP-40 250μl of absolute solution
DTT 0.0077 g (1mM DTT) or 50 μl of 1M DTT solution

2.9.4. IP lysis buffer (50ml)
50mM Tris: 1.25ml of 2M Tris pH 7.5
150mM NaCl: 1.5ml of 5M NaCl
1X protease inhibitor: 200µl of 10X protease inhibitor
0.4% NP-40 lysis: 200µl of NP40 absolute solution (aspirated with a cut-tip)
2.9.5. IP wash buffer (50ml)
50mM Tris: 1.25ml of 2M Tris pH 7.5
150mM NaCl: 1.5ml of 5M NaCl
1X protease inhibitor: 200µl of 10X protease inhibitor
0.1% NP-40 lysis: 50µl of NP40 absolute solution (aspirated with a cut-tip)
* buffers to be chilled on ice before adding to cells
2.10. Buffers and reagents for CD experiments
2.10.1. 10M Urea solution (protocol adapted from Pace 1986)
0.78g of NaH2PO4 and 0.71g of Na2HPO4 were weighed and added to beaker containing
magnetic stir bar. The beaker was weighed and tared. 60g of urea (Sigma) was weighed in a
separate weighing boat and added to the tared beaker. The weight of the weighing boat was
recorded and was found to be 60g. Fresh MilliQ water was added to the beaker to bring the
weight of the beaker to 114.36g. The beaker was covered with foil and kept on magnetic
stirrer for 3 hours. The dissolved urea solution was filtered through 0.45µ filter.
2.10.2. 8M Guanidine HCl

A 250 ml beaker containing a magnetic stir bar was tared on weighing balance and the
following were added: 95.5 mg KH2PO4, 312.5 mg K2HPO4, 7.7 mg DTT, 38.2 g guanidine
hydrochloride. Further autoclaved MilliQ water to 59.5 g. The solution was stirred until
dissolved and pH was adjusted to 7.2 (minor adjustment). The buffer was filtered with 0.2µ
filter before use.
3.10.3. Refolding buffer
25mM phosphate buffer, pH 6.9
0.1mM EDTA
0.5M KCl
1mM DTT
2.10.4. 10mM phosphate buffer
NaH2PO4: 0.836g
Na2HPO4: 1.96g
Autoclaved MilliQ: 1 litre
The pH of the solution was checked using pH strip and it was found to be around 7.2. The
solution was filter sterilized and stored at 4oC.
2.11. Tissue Culture Media and Reagents
2.11.1. Dulbecco’s Modified Eagle Medium (DMEM)
DMEM containing pyridoxine hydrochloride, sodium pyruvate and high glucose (Gibco) was
prepared according to the manufacturer’s directions. DMEM powder was dissolved in sterile

water. 3.5 g of sodium carbonate was added and the pH was adjusted to 7.2 using HCl. The
volume was made up to 1 litre and the medium was filter sterilized through a 0.22 filter.
2.11.2. 10X phosphate buffered saline (PBS) (for 1 litre)
NaCl 80.8 g (137 mM)
KCl 2.0 g (2.7 mM)
Na2HPO4. 2H2O 12.6 g (21.6 mM)
KH2PO4 2.0 g (293.3 mM)
Glucose 10.0 g (55.5 mM)
The constituents were added to 800ml of sterile water and solution was filtered through 0.22µ
filter.
2.11.3. 10X Trypsin (0.25%)
2.75 g of trypsin was added to 110 ml of autoclaved Milli-Q water and the solution was
sterilized through a 0.22µ filter. The filtered solution was dispensed in 10ml aliquots and
stored at -20oC. The solutions were diluted to 1X working stocks with 1X PBS before use.
2.12. Commercial buffers
10X FastDigest buffer (Thermofisher Scientific, USA)
10X Tango buffer (Thermofisher Scientific, USA)
10X T4 DNA ligase buffer (NEB, England)
5X GC buffer (NEB, England)
5X HF Buffer (NEB, England)

2.13. Antibodies
PSMD9 antibody (Sigma)
Anti-His antibody (Cell signalling)
2.14. Miscellaneous
PnPP substrate (Sigma)
TMB substrate (BD Sciences)
2.15. Reagents for transfection
2.15.1. 2X BBS (BES Buffered Saline) (for 50 ml)
50mM BES: 0.533 g of BES
280mM NaCl 0.818g of NaCl
1.5mM Na2HPO4.2H2O: 0.0134 g of Na2HPO4.2H2O
All the reagents were dissolved in 50 ml of Milli-Q water, filtered through 0.2µ filter,
dispensed in 400µl aliquots and stored at -20oC.
2.15.2. 0.5M CaCl2 (for 50 ml)
CaCl2.2H2O 3.675 g
CaCl2.2H2O was dissolved in 50 ml of Milli-Q water, filtered through 0.2µ filter, dispensed
in 400µl aliquots and stored at -20oC.
2.16. Methods
2.16.1. Primer design for cloning

Using the vector map, the enzyme sites in the MCS region of vector were noted.
The restriction sites in the gene of interest to be cloned were identified by pasting the
sequence in an online restriction digestion tool, NEB cutter (http://nc2.neb.com/NEBcutter2/)
The restriction enzyme sites in MCS of vector which were also present in the gene were
excluded. A suitable pair of forward and reverse restriction enzymes were chosen for forward
and reverse primers based on the 5’ to 3’ positioning of the enzyme sites in the MCS of the
vector.
Note:
• If enzyme has an ATG site, and if that happens to be the first ATG, then ensure that
the ATG does not change the open reading frame of the gene.
• Ensure that the enzymes chosen in forward and reverse do not create the same 5’ and
3’ overhangs upon digestion. Otherwise gene may ligate to itself or may ligate in a flipped
orientation
An appropriate overhang for the enzymes were chosen using NEB overhang tutorial
(https://www.neb.com/tools-and-resources/usage-guidelines/cleavage-close-to-the-end-of-
dna-fragments)
A primer sequence of 18-20 base pairs was chosen from the start of the gene for forward
primer and the end of the gene was chosen for reverse primer.
(Note: For cloning part of the gene or individual domains, an ATG (start codon) must be
added before the gene sequence.
A stop codon (TAA/TAG/TGA) was added in the reverse primer sequence at the end of the
gene sequence
The Tm and GC content of primers were calculated using on online tool, Oligocalc
(http://biotools.nubic.northwestern.edu/OligoCalc.html ). The self-complementarity and
propensity of the primers to form hairpin loops were also checked. Based on the calculator,

the primer sequences were extended or truncated to optimize primer properties within the
following criteria:
Tm: 50-65oC; Primer pairs to have a Tm difference of not more than 5oC
GC content: 40-60%
Hairpin loop if any, to have a Tm of less than 40oC
The primers were designed in the following layout
Forward primer:
5’ Overhang---Restriction enzyme site---ATG---gene sequence 3’
Reverse Primer:
5’ Gene sequence---STOP---Restriction enzyme site---Overhang 3’
2.16.2. Primer design for site-directed mutagenesis:
Site-directed mutagenesis primers were designed for amplification using nested-PCR method.
The sequence of codon at the site of mutation was changed (for example, TTC to GGG for
Phe to Gly mutation). Using the mutation as the centre of the primer, the two ends of primers
were extended with the same sequence of the gene. Around 10-15 bp of gene sequence
flanking each side of the mutation were incorporated in the primer design. The reverse primer
sequence was the reverse complement of the forward primer.
2.16.3. Primer reconstitution:
Primers were commercially synthesized from Eurofins India Pvt Ltd. The vials containing
lyophilized primers were spun briefly and incubated on ice for 15 minutes. 10mM Tris pH
7.5 was added to the primer vials to achieve a final concentration of 100µM (volume of
10mM Tris added according to manufacturer’s instructions) and kept on ice for 1 hour with

intermittent vortexing. The main stock was diluted to 10μM which was used a working stock
for PCR reaction.
Table 2.1. List of primers for cloning and site-directed mutagenesis
Name of primer Sequence (5’-3’)
Ndom-Fw-BamHI-
pET28A CGCGGATCCATGTCCGACGAGGAAGCGA
Ndom-Rv-EcoRI-
pET28A CCGGAATTCTCACATGGCCTCTTTGTGGG
PDZ-Fw-BamHI-
121-pET28A CGCGGATCCAGCCGCAAACTGGGTCAG
PDZ-Fw-BamHI-
134-pET28A CGCGGATCCGCCTTCGCCAAAGTGAACAGC
PDZ-Rv-EcoRI-
pET28A CCGGAATTCTCATCTTTGCAGAGGAATAATGTTGCAGC
Ndom-HindIII-
pCMV-Fw CCCAAGCTTATGTCCGACGAGGAAGCGA
PDZ-HindIII-
pCMV-Rv CCGAAGCTTATGAGCCGCAAACTGGGTCAG
PSMC1 fw CATGCCATGGGAATGGGTCAAAGTCAGAGTG
PSMC1 rv GGGAAGCTTTTAGAGATACAGCCCCTCAGG
PSMC2 fw CCGGAATTCATGCCGGATTACCTCGGT
PSMC2 rv CCCAAGCTTTCAGTTGTATGTCATGTAACG
PSMC3 fw CCGGAATTCATGAATCTGCTGCCGAAT
PSMC3 rv CCCAAGCTTCTAGGCGTAGTATTGTAGG
PSMC4 fw CCGGAATTCATGGAGGAGATAGGCATC
PSMC4 rv CCCAAGCTTTCACTTGTAAAACTCATGCT
PSMC5 fw CGCGGATCCATGGCGCTTGACGGA
PSMC5 rv CCCCAAGCTTTCACTTCCATAATTTC
PSMC6 fw CATGCCATGGGCATGGCCATTCCCGGCAT
PSMC6 rv CCGGAATTCTTACACAGGTTTGTAGTC
PDZ 121-196 Rv ACAGTGATCCGCAGGGGGTGAGAATTCCGG
PDZ 121-211 Rv ACACGCTGGGCAGGAAAATGAGAATTCCGG
PDZ forward CGCGGATCCAGCCGCAAACTGGGTCAG
PDZ reverse CGCGGATCCGCCTTCGCCAAAGTGAACAGC
F162G forward ATTGTGGAGGGGGGCTCTGTGAA
F162G reverse TTCACAGAGCCCCCCTCCACAAT
Q181G forward GCAGTGTGGTGGGGCACAGTGAGGG
Q181G reverse CCCTCACTGTGCCCCACCACACTGC
C216G forward ACTGCTGGGCGGGAACATTATTCCTCT
C216G reverse AGAGGAATAATGTTCCCGCCCAGCAGT

I218G forward TGGGCTGCAACGGGATTCCTCTGCAAAGA
I218G reverse TCTTTGCAGAGGAATCCCGTTGCAGCCCA
2.16.3. Plasmid construction:
N-domain and PDZ domain were cloned from PSMD9-pRSET-A construct between BamHI
and EcoRI restriction sites of pETyong vector (modified form of pET28a vector). pETyong
vector was a kind gift from Dr Ruchi Anand, IIT Bombay. PSMD9 and PDZ mutants were
generated by site-directed mutagenesis. PSMCs were cloned from PSMC-pJET vectors in
pCMV-10-3X-FLAG vector.
2.16.4. PCR for gene amplification:
PCR was performed using Pfu turbo DNA polymerase (NEB). Initially, a gradient PCR was
set up in a 20µl pilot-scale reaction and an optimal annealing temperature, which gave
maximum PCR efficiency and minimal non-specific amplification was chosen for large scale
PCR reaction (100µl). A 100µl mastermix containing the following reagents except enzyme
was prepared in sterile (autoclaved) RNase free PCR tubes. The mastermix was spinned
briefly and divided in five 20µl aliquots in PCR vials and 0.2µl of enzyme was added to each
vial except control vial. The PCR was performed in PCR thermocycler (Prima-Duo™
Thermal cycler, Hi-media). Each vial was placed at different annealing temperature to
perform gradient PCR. This was done to determine optimum annealing temperature for
amplification of desired template
PCR reaction mix:
Component Volume (µl)
Sterile molecular biology grade water 73
10X Cloned Pfu buffer 10

DNA (100ng/µl) 2
10mM dNTPs 5
10µM forward primer 2.5
10µM reverse primer 2.5
25mM MgCl2 3.0
Total 100
The mastermix was divided into five 20µl aliquots
Pfu Turbo enzyme 0.2µl in each vial except control vial
PCR cycling parameters:
Step Temperature (°C)
Time
(min:sec)
No. of cycles
Initial denaturation 95 1:00 1
Denaturation 95 00:30
25
Annealing
Tm of primer-5oC
(55-65oC)
1:00
Extension 72 2 minutes/kb
Final extension 72 10 1
Hold 4 ∞ --
The PCR products were analysed to check for amplification of desired gene by resolving the
samples on a 0.8% agarose gel (Technosource) containing ethidium bromide (1mg/ml).
2.16.5. PCR for Site-directed mutagenesis (SDM-PCR):

The master mix was prepared in the same manner as described in previous section. The
extension time in the PCR cycling conditions was increased for amplification of entire vector
during each cycle of PCR
Step Temperature (°C)
Time
(min:sec)
No. of cycles
Initial denaturation 95 1:00 1
Denaturation 95 00:30
25
Annealing
Tm of primer-5oC
(55-65oC)
1:00
Extension 72
2 minutes/kb (11
minutes)
Hold 4 ∞ --
2.17. Agarose gel electrophoresis (AGE):
AGE was used to analyse DNA samples including PCR products, purified plasmids,
restriction digestion products. 0.8g of agarose (Himedia/Sigma) was weighed and added to
100ml of 1X TAE buffer in a beaker. The solution was heated in microwave for about 1
minute to dissolve agarose. The agarose solution was allowed to cool to 60oC and EtBr was
added to a final concentration of 0.5µg/ml (1µl). The solution was mixed thoroughly and
poured in a gel casting tray with comb (Technosource). The gel was allowed to polymerize
for about 15 minutes. The comb was carefully removed and gel was transferred to the gel
tank containing 1X TAE buffer. The samples were mixed with DNA loading dye and loaded
in the wells. The samples were resolved at 100V for 45 minutes. The gel was then
documented using gel documentation system (UVP, Bioimaging system) and viewed using
Launch Vision Works LS software.

2.18. Restriction digestion:
Restriction digestion involves sequence specific cleavage of DNA by highly specific
restriction endonucleases which recognize and cleave conserved stretch of nucleotides on
either sides of the recognition sequence to generate overhangs. In cloning protocols,
restriction digestion is employed to generate compatible overhangs in vector and desired gene
of interest which then ligate with each other in the presence of a DNA ligase
Restriction digestion mix:
Component Volume (µl)
Water 33.0
10X CutSmart buffer (NEB) 5.0
DNA (1µg) 10.0
Enzyme 1 1.0
Enzyme 2 1.0
Total 50.0
The components were added to sterile microcentrifuge tubes and incubated at 37oC in
circulating water bath (Trishul equipments) for 1 hour or as per manufacturers specifications.
2.19. DpnI digestion:
DpnI enzyme is employed to digest wild type parental plasmid strand after amplification in
SDM-PCR. DpnI recognizes andcleaves methylated cytosines in DNA. Since newly

synthesized DNA are not methylated, mutant plasmids are not digested, whereas the wild
type parent plasmid is digested by DpnI.
DpnI reaction mix
Component Volume (µl)
Water 12.0
10X Tango buffer 3.0
PCR product 15.0
DpnI 1.0
Total 30.0
The reaction mix was incubated at 37oC in circulating water bath for 16 hours for complete
digestion and then resolved on AGE to check for digestion of plasmid.
2.20. Extraction of DNA from agarose gel:
Low melting agarose (Invitrogen) was used to prepare gel to resolve samples for gel
extraction. The samples were mixed with DNA loading dye and resolved at 100V for 2-3
hours at 4oC (in the cold room). The gel was viewed in UV transilluminator and the band of
interest was excised using a clean scalpel blade with a handheld UV lamp (UVP 3UV-38).
The DNA was extracted from the agarose gel piece using a commercial gel extraction kit
(Qiagen).
2.21. Quantification of DNA:
The concentration and purity of DNA was determined by the measuring the absorption of
DNA in a microvolume spectrophotometer (NanoDrop® ND-100, Thermofisher Scientific).
The pedestals of the spectrophotometer were cleaned with fresh MilliQ water and wiped with

lint-free tissue and 2µl of DNA was loaded on the instrument. The concentration of DNA was
displayed by the absorption of DNA at 260nm and the purity of DNA was estimated from its
absorption at 230nm and 280nm. The concentration of DNA was calculated by software
using the following formula:
OD260nm x Dilution factor x 40 = ng/μl RNA
Abs260/Abs280 and Abs260/Abs230 ratio for each sample was recorded. Ratios ~ 2 of
Abs260/Abs280 and ~ 1.8-2.2 of Abs260/Abs230 indicated pure DNA/RNA samples.
Samples with absorbance values outside these ratio ranges were indicative of potential
contaminants due to protein or phenol or ethanol and of bad quality DNA/RNA.
2.22. Ligation:
Ligation is the final step in generation of recombinant plasmid, where the gene of interest is
connected to the desired vector backbone which have compatibly digested overhang
sequences. The sugar backbone of the two DNA fragments is covalently connected by a T4
DNA ligase enzyme (NEB). This enzyme catalyzes the formation of covalent phosphodiester
linkages, which permanently tethers the nucleotides, thereby generating a complete circular
plasmid, which can be transformed and propagated in bacterial cells.
The gene or insert is usually taken at a 3-fold or 6-fold molar excess concentration to that of
the vector DNA. The amount of insert is calculated using the formula
ng of insert = ng of vector × (molar ratio ofinsert
vector) × (kb size of
insert
vector)
Ligation mix:
Component Volume
Water 12.0

10X T4 DNA ligase buffer 3.0
Vector (1000ng) Variable
Insert variable
T4 DNA ligase (NEB) 1.0
Total 30.0
A control reaction containing only the digested vector was set up to test the possibility and
rate of self-ligation of vector. The ligation reaction mix was made in sterile RNase free
microcentrifuge tubes and incubated at 16oC overnight in a circulating cooling water bath
(Lab Companion).
2.23. Preparation of bacterial competent cells:
Competence is a process by which bacterial cells are made more amenable for uptake of
foreign DNA using techniques to alter their cell wall. For the calcium chloride-competent
cells, a loopful of DH5α strain was streaked on LB plate and incubated overnight at 37oC in
shaker incubator (Lab Companion, SIF60000R). A single colony from the plate was
inoculated in 50ml of LB medium and allowed to grow at 37oC, 180 rpm) till O.D. of the
culture reached 0.4. The cells were incubated on ice for 30 minutes and harvested by
centrifugation at 5000 rpm for 10 minutes at 4oC (Centrifuge: Eppendorf, 5430R). The
supernatant was discarded and 10ml of chilled 100mM CaCl2 was added to the cell pellet.
The cell pellet was resuspended by vortexing briefly and incubated on ice for 45 minutes. The
cells were then centrifuged at 3500 rpm for 10 minutes at 4oC followed by decanting the
supernatant and resuspending the pellet in 1 ml of chilled 100mM CaCl2. The pellet was
resuspended by carefully tapping the vial. The cells were distributed as 50-100µl aliquots in
pre-chilled microcentrifuge tubes, followed by transformation on the same day.

2.24. Transformation of plasmid DNA:
The competent cells were transformed with the DNA of interest using heat shock method.
100ng of DNA was added to 50µl of competent cells and mixed by gentle tapping. Cells were
incubated on ice for 30-45 mins and subjected to heat shock at 42oC for 90 seconds and
incubated on ice for 2 minutes. 1ml of LB medium was added to the cells and allowed to
grow at 37oC for 1 hour at 180rpm. The cells were then centrifuged at 5000 rpm for 5
minutes. The supernatant was discarded and cells were resuspended 100µl of LB broth and
plated on LB agar plate containing the desired antibiotic selection marker.
2.25. Colony PCR:
Colony PCR is a technique to quickly screen large number of positive clones from the
ligation plate. The technique involves setting up a PCR with the same conditions used for
amplification of desired gene, with the only difference being the source of DNA which will
be the colony instead of the plasmid DNA.
A PCR mastermix for screening 10 colonies was prepared and the PCR cycling conditions
were followed with an increased initial denaturation time of 10 minutes. The PCR product
was resolved on 0.8% agarose gel to check for presence of desired gene. Presence of
amplified PCR product with a length corresponding to size of desired gene indicated positive
clone.
2.26. Small scale plasmid extraction using miniprep protocol:
Colonies on the LB agar plate were picked using a sterile toothpick and inoculated in 10 ml
of LB medium containing 100 μg/ml of ampicillin. The culture was allowed to grow
overnight at 37oC shaker incubator (Lab companion, Model–SIF6000R). The cells were

harvested by centrifugation at 5000 rpm (Plasto Craft, Model - Rota 4R). Plasmid extraction
was performed using commercial plasmid extraction kit (GenElute Plasmid Extraction kit,
Sigma Aldrich).
2.27. Large-scale plasmid extraction using maxiprep protocol:
A loopful of culture was inoculated in 5ml LB medium for starter culture and allowed to
grow at 37oC, 180rpm overnight. shaker incubator. Th starter culture was inoculated in 100ml
of fresh LB medium containing antibiotic and the culture was allowed to grow at 37oC, 180
rpm till the O.D. reached 0.4. The cells were harvested by centrifugation (Beckman Avanti
JXN-26 centrifuge) at 5000 rpm for 10 minutes at 4oC. Plasmid extraction was performed
using commercial plasmid extraction kit (Qiagen Maxiprep kit)
2.28. Standardization of induction conditions for protein expression in bacteria:
Once the positive clone is confirmed by sequencing, the growth conditions for optimal
expression of protein needs to be standardized. This is achieved by optimization of the
bacterial expression host, temperature of induction, concentration of IPTG used for induction,
O.D. of culture at the time of induction. As a preliminary check, initially the IPTG
concentration and induction temperature is standardized. The positive clone was transformed
in protein expression strain like BL21 codon pus, Rosetta2 DE3, Rosetta pLysS. Five
colonies were inoculated in 5ml of LB medium containing desired antibiotic and allowed to
grow at 37oC, 180rpm overnight. (Note: bacterial strains which harbour inherent antibiotic
resistance must always be grown in presence of the antibiotic, as the presence of antibiotic in
the medium is essential for maintaining the optimal growth conditions suitable for protein
expression). 100µl of the starter culture was inoculated in 5ml of LB medium containing
antibiotic(s) and allowed to grow at 37℃ and 180rpm till OD reached 0.4. For the uninduced
control, 1ml of the culture was transferred to a microcentrifuge tube and 100mM IPTG was
added to remaining 4ml culture to achieve a final concentration of 100µM, 250µM and
500µM IPTG. Both induced and uninduced cultures allowed to grow at 18℃, 25℃, and
37℃and 180 rpm in shaker incubator till OD of induced culture reached 1 to 1.5. The cells
were harvested by centrifugation at 5000rpm for 10 minutes.
2.29. Screening of conditions for optimal protein expression:
The cell pellets were resuspended in 200µl of lysis buffer containing 2µl of PIC (protease
inhibitor cocktail, Sigma) by vortexing. The cells were lysed by sonication (Branson digital
sonifier). Five sonication cycles were given for each tube (pulse for 30 seconds; 0.5 off and
0.5 on). The cells were then centrifuged at 13000 rpm and 15℃ for 20 minutes at 4℃. The
supernatant was resolved on SDS-PAGE and stained with Coomassie blue to observe protein
induction. For separation on SDS-PAGE, 30µl of supernatant was mixed with 15µl of 3X
SDS loading dye in a fresh microcentrifuge tube and mixed well. The sample was heated at
95oC for 10 minutes in dry bath (Note: The lids of the microcentrifuge tubes must be poked
with a syringe to allow heated air to escape form the tube, else the tube may snap open during
heating, leading to loss/spillage of samples). 30µl of the sample was loaded and resolved on
15% SDS-PAGE at a constant 150V till the dye front reached the bottom of the gel. The gel
was then stained with Coomassie Brilliant Blue solution (CBB) for 30 minutes followed by
destaining in destain solution till distinct blue protein bands were visible against clear
background.
2.30. Preparation of glycerol stock of bacterial culture:
Glycerol stocks of all positive clones in DH5α and protein expression clones in expression
strains were prepared and labelled with date, clone number, gene name, vector name and

strain on each vial. For preparation of glycerol stock, 100µl of culture was added to a sterile
microcentrifuge tube and mixed with 100µl of 30% glycerol. The cells were mixed by gentle
tapping and snap frozen in liquid nitrogen followed by storage in -80oC deep freezer.
2.31. Protein purification:
Protein purification was performed using affinity purification by nickel affinity
chromatography, GST-affinity or MBP-affinity purification followed by gel filtration on a
HiLoad Superdex200 16/600 column.
2.31.1. Ni-IDA affinity purification:
Proteins with a 6X-His tag (in vectors pRSET-A or PETyong) were purified by Ni-IDA
chromatography. The cell pellets from a 500ml culture were thawed on ice for 20 minutes.
Meanwhile Ni-IDA lysis buffer was prepared and chilled on ice. 10ml of chilled Ni-IDA lysis
buffer was added to cell pellet and incubated for 10 minutes. The cell pellets were
resuspended by vortexing and the cell lysate was incubated on ice for 10 minutes. The cell
lysate was then sonicated to lyse the cells (Branson digital sonifier) using 1 minute pulse ON,
30 seconds pulse OFF for 10 cycles for each tube containing cell lysate derived from a 500ml
culture). The lysate was centrifuged at 18000 rpm for 20 minutes at 4oC (Beckman Avanti
JXS, rotor no 25.5) in Laxbro tubes. The sonicated cell-free lysate was transferred
immediately to a fresh tube to prevent dislodging of cell pellet. 4ml of Ni-IDA beads
(Clontech Inc, Takara) were taken in a protein purification column (Bio-Rad Econo-Column®
chromatography column, 0.5cmx10cm) using a cut-tip and equilibrated with three-column
volumes of Ni-IDA wash buffer. The cell lysate was then bound to the beads and incubated

on a test tube rotator (Rotospin, Remi) for 1 hour at 4oC in cold room. The bound beads were
washed with 10 column-volumes of Ni-IDA wash buffer and eluted in Ni-IDA elution buffer.
1 ml elution fraction were collected and checked for presence of protein using Bradford
reagent
2.31.2. Purification of GST-tagged proteins:
The cell pellet was resuspended in 10ml of GST lysis buffer. 2ml of GST-Sepharose beads
(GE Healthcare) were taken in a protein purification column (Bio-Rad Econo-Column®
chromatography column, 0.5cmx10cm) using a cut-tip and equilibrated with three-column
volumes of GST wash buffer. The cell lysate was then bound to the beads and incubated on a
test tube rotator (Rotospin, Remi) for 1 hour at 4oC in cold room. The bound beads were
washed with 10 column-volumes of GST wash buffer and eluted in GST elution buffer. 1 ml
elution fraction were collected and checked for presence of protein using Bradford reagent
2.31.3. Purification of MBP-tagged proteins:
The cell pellet was resuspended in 10ml of MBP lysis buffer. 2ml of amylose resin (GE
Healthcare) were taken in a protein purification column (Bio-Rad Econo-Column®
chromatography column, 0.5cmx10cm) using a cut-tip and equilibrated with three-column
volumes of MBP wash buffer. The cell lysate was then bound to the beads and incubated on a
test tube rotator (Rotospin, Remi) for 1 hour at 4oC in cold room. The bound beads were
washed with 10 column-volumes of MBP wash buffer and eluted in MBP elution buffer. 1 ml
elution fraction were collected and checked for presence of protein using Bradford reagent.
2.32. Gel filtration chromatography:

Gel filtration was carried out in a prepacked Superdex200 column (HiLoad Super200 16/600)
connected to a FPLC system (Biologic Duoflow, Biorad). The column was equilibrated with
one column volume of gel filtration buffer before injection of protein. 2ml of affinity-purified
protein sample was centrifuged at 13000 rpm for 5 minutes at 4oC and injected in the column
via the injection port. The protein elution was monitored by the absorption spectrum at
280nm using the detector connected to the FPLC system (Quadtec). Peak fractions were
collected using manually and resolved on SDS-PAGE to check purity of samples.
2.33. Cleavage of His tag using TEV protease:
The 6X His-tag in protein was cleaved using TEV protease, a highly specific protease which
recognizes the sequence Glu-Asn-Leu-Tyr-Phe-Gln↓Gly and cleaves before the last glycine
of the sequence. The protein was incubated with purified TEV protease in the ratio of 2:1 at
4oC for 16 hours. The protein-TEV protease mixture was then incubated with Ni-IDA beads
for one hour and after which the flow-through containing the cleaved protein of interest was
collected.
2.34. Concentrating proteins using protein concentrators:
Proteins were concentrated using Amicon® Ultra Centrifugal filers with a 3kDa cut-off
membrane. The centrifugal units were washed twice with water and then with buffer. The
protein was loaded on top of the filtration tube and centrifuged at 5000 rpm for 30 minutes at
4oC. The concentrated protein solution remaining in the upper chamber of the filtration tube
was collected and the lower chamber containing buffer components were discarded.
2.35 Protein estimation by Bradford method:

Bradford assay was used to estimate the concentration of proteins in the sample. Bradford
reagent contains an acidic solution of Coomassie Brilliant Blue G-250 whose absorbance
maximum shifts from 465 nm to 595 nm when binding to protein occurs. Both hydrophobic
and ionic interactions stabilize the anionic form of the dye, causing a visible colour change.
BSA standards were prepared using Bovine serum albumin (BSA) standard (Bio-Rad, Cat.
No. 500-0206) at 1, 0.5, 0.25, 0.125 and 0.0625mg/ml. 5µl of the standards and samples were
loaded in 96-well plate (Tarsons). 5μl of each sample was pipetted in duplicates in a 96-well
plate. 200 μl Quick startTM Bradford 1X Dye Reagent (Bio-Rad,Cat. No. 500-0205) was
added to each well and incubated in the dark for 10-15 minutes. The absorbance readings
were measured on a spectrophotometer at a wavelength of 595 nm.
2.36. Buffer exchange/dialysis of proteins:
Dialysis of proteins was carried out for exchanging buffer, removal of salts. The protein to be
dialysed was centrifuged at 13000 rpm for 10 minutes at 4oC. The dialysis bag (SnakeSkin™
dialysis tubing, Thermo Scientific) of desired length was cut carefully and equilibrated in
sterile hot water 80oC for 5 minutes. The dialysis membrane was then clipped on one end
using a dialysis clip (Bio Rad) and checked for leakage. The protein was then carefully
dispensed into the dialysis membrane and the membrane was clipped on the other end leaving
a small space inside the membrane for expanding. The dialysis membrane was then placed in
the beaker containing the buffer solution and kept on magnetic stirrer at 4oC. The buffer was
changed three times in four-hour intervals for complete buffer exchange of protein
2.37. Analysis of protein secondary structure by CD:
CD Circular Dichroism spectroscopy is a technique to assess the secondary structure content
of protein including alpha helices, beta sheets and random coils. All amino acids in proteins

are achiral and depending on the ability of achiral amino acids to rotate the plane of circularly
polarized light, each secondary structure element which has a distinct arrangement of amino
acids can rotate the circularly polarized light to a different extent. This a distinct polarizing
ability is measured in terms of ellipticity of the sample. Since CD is a bulk property, it gives
valuable information on overall secondary structure component of proteins, stability of
proteins in different buffers. To measure the CD spectrum, the protein of interest should be in
a compatible buffer like phosphate buffer of low ionic strength and low salt (upto 30mM
NaCl or KCl). Tris buffers are not preferable due to the high absorption of tris below 200nm,
which can overshoot the voltage, and damage the photodiode detector. The protein to be
analysed was buffer exchanged in phosphate buffer just rpior to measuring the CD spectrum.
The concentration of the protein and the 260/280 ratio was checked to assess the quality of
protein. The protein was diluted to the desired concentration (5-20µM) in phosphate buffer
and the concentration. of the diluted sample was checked before recording the spectrum. The
CD cuvette which was stored in 0.1% Triton-X-100 (Starna Scientific Ltd, 0.1mm) was
cleaned with water thoroughly to remove traces of detergent. The ‘spectra measurement’
program was selected and the CD spectrum of the empty cuvette was recorded from 260nm
to 190nm, followed by buffer spectrum and protein spectrum. The protein scan was recorded
in triplicates with two acquisitions in each measurement.
2.38. Thermal denaturation and refolding by CD:
CD can also be employed to measure the Tm (melting temperature) and hence thermal
stability of proteins. Thermal denaturation experiment is carried out by increasing the
temperature in small increments and recording the CD spectrum from 260nm to 190 nm at
every temperature. The protein was prepared in the same way for recording CD spectrum.
The ‘temperature interval measurement’ option was selected and the CD spectrum was

recorded from 20oC to 100oC at every 2oC increment. After denaturation experiment was
complete, if refolding had to be assessed, then the temperature setting was changed at the end
of denaturation experiment to record spectrum from 100oC to 4oC, with all the other settings
unchanged. The Tm was calculated by measuring the ellipticity at 222nm for each
temperature
2.39. Chemical denaturation and refolding by CD:
Chemical denaturation is used as a tool to evaluate the chemical stability of protein in
presence of denaturation reagents. It also yields valuable information on whether protein
unfolds in a one-step or multi-step pathway, and indicates the presence of intermediates in
folding pathway of proteins. Urea and guanidine hydrochloride are the most common
denaturing agents, which act through different mechanisms to unfold proteins. While urea
interacts directly with the hydrophobic patches on protein and also alters the solute
environment, Gu-HCl is a stronger denaturant and interacts directly with the proteins and
destabilizes beta sheets by forming hydrogen bonds with proteins. For chemical denaturation,
an 8M solution of Gu-HCl or 10M Urea was prepared in phosphate buffer as described earlier
in methods section. The protein was diluted to the required concentration (5-20µM) and
incubated with increasing concentrations of Gu-HCl or urea (0M, 1M, 2M,3M 4M, 5M, 6M)
for 16 hours at 4oC. The CD spectrum of the protein was recorded from 260nm to 190nm. For
refolding after chemical denaturation, the protein was rapidly diluted 10-fold in refolding
buffer under cold conditions. The protein was allowed to refold by slow equilibration at 4oC
for 24 hours. The CD spectrum of the refolded protein was recorded.
2.40. DLS analysis of proteins:

Figure 2.1 DLS experimental setup
DLS is a technique to assess the macromolecular properties of protein including its
hydrodynamic radii, polydispersity in a given buffer and a useful tool to screen optimal
crystallization conditions. It is based on the ability of molecules in solution to scatter the
incident laser light. Based on the molecular mass and slow or fast tumbling, the
autocorrelation plot of intensity versus time is plotted, which gives an idea of the size of
molecules in solution. For DLS analysis, the protein solution was thawed on water and
centrifuged at 13000 rpm for 10 minutes at 4oC. The proteins were filtered through 0.1µ filter
directly into the quartz cuvette. The DLS quartz cuvette (Wyatt, JC-0082) was cleaned
thoroughly in fresh MilliQ, 0.1% Triton-X 100, Isopropanol and MilliQ again. The cuvette
was dried with the help of air duster spray. The DLS instrument (DynaPro NanoStar, Wyatt)
and the connecting system were switched on 10 minutes before start of the experiment. The
instrument laser was switched on just before putting the protein. The software was opened
and connected to hardware. Initially the buffer scan was acquired followed by protein scan.
Ten acquisitions in each scan were taken and the average reading was computed by the
software.
2.41. Reconstitution of peptides for ELISA:

Peptides were commercially synthesized with N-terminal biotin tag (Biotin-KGG-XXXX-
OH, where XXXX corresponds to the peptide sequence, -OH is the carboxy terminus) and
purified to 99% purity by HPLC for ELISA experiments. The peptide containing vials were
thawed at room temperature. The vials were the placed in 50ml conical tubes and cushioned
with cotton. The conical tubes were centrifuged at 4000 rpm for 2 minutes at 20oC. 25mM of
peptide main stock was prepared in 100% DMSO. Cysteine containing peptides stored in
DMSO containing 1mM DTT. The reconstituted peptides were stored in 10µl aliquots in -
20oC.
2.42. Screening and optimization of crystallization conditions:
Figure 2.2 Crystallization plate setup for Mosquito™ crystallization robot
For screening large number of crystallization conditions using commercial crystallization
buffer screens, a crystallization robot (Mosquito, TTP Labtech) was used. A purified protein
solution of a high concentration was prepared (15-25mg/ml). 5µl of protein was added to the
designated slot in strip in 8 wells in the robotic dispenser. 50µl of buffer of respective screen
was added to each reservoir and the plate was placed in the rack. The instrument was
programmed to dispense the required microvolume of protein (range 0.15-0.5µl) in the
subwell and 50µl of buffer in the buffer reservoir of the crystallization plate. The plates were
then immediately sealed with plate sealer and incubated in vibration-free crystallization

incubator. Once the initial conditions from the crystal screen were identified, the next step
was to optimize the suitable conditions by varying the salt concentration, concentration and
choice of cryoprotectant and ionic strength of buffer. The optimization was carried out
manually in 24-well or 48-well plate ().
2.43. DTNB labelling of proteins:
DTNB or Ellman’s reagent is a compound which reacts with free sulfhydryl groups in
proteins, which converts DTNB to 2-nitro-5-thiobenzoate (TNB−), which is ionized to
TNB2− dianion, a yellow coloured compound. Purified protein (72µM) was incubated with
20-fold molar excess (1440µM) of DTNB (Invitrogen) in 50mM Tris, 150mM NaCl, pH 8.5
for one hour at 25oC in dark. The excess DTNB was removed by desalting over PD10
desalting column (G25 Sephadex, GE Healthcare). The absorption spectrum of labelled
protein was monitored from 280nm to 700nm and the extent of labelling was calculated from
the absorbance at 412nm and molar extinction coefficient of DTNB.
2.44. Glutathione labelling of proteins:
Purified PDZ domain was incubated with a 20-fold molar excess of glutathione in 50mM
Tris, 150mM NaCl, pH 8.5 for one hour. The excess unreacted glutathione was removed by
desalting over a PD10 column (G25 Sephadex, GE Healthcare). The extent of glutathione
modification was checked by incubating glutathione-modified PDZ domain with an excess of
DTNB, which would react with free cysteines, if available and monitoring the absorption
spectrum from 280nm to 700 nm.
2.45. ELISA for protein-peptide interaction:
Proteins were diluted in 0.1M sodium carbonate buffer, pH 9.5 and 100µl of protein was
added to Nunc-Immuno™ MicroWell™ 96 solid plates for coating the plate with protein and
incubated for 16 hours at 4°C. Wells were blocked with 2% BSA in TBST (10mM
Tris pH 8, 138mM NaCl and 0.5% Tween 20) for 1 hour at 37°C. Plates were washed, and
biotinylated peptides (in TBST with 0.1% BSA) were added to the wells and incubated for 1
hour at 37°C. The plates were washed with TBST vigorously after each incubation step.
Finally, streptavidin alkaline phosphatase (Sigma), at 1:2000 dilution in TBST (with 0.1%
BSA) was added to all wells. After incubation 1 hour at 37°C, binding was detected by the
addition of para-Nitro phenyl phosphate (PNPP) (Sigma), the substrate of alkaline
phosphatase and colour developed was read at 405nm. Wells that lacked PSMD9 were taken
as negative controls.
2.46. ELISA for protein-protein interaction:
One of the binding partner proteins was diluted in coating buffer and coated in ELISA plates.
The plates were incubated overnight at 4oC. After blocking and washing, the interacting
partner protein were added at different concentrations on the plate and incubates for one hour
at 37oC. The plates were washed and primary antibody for the interacting protein was added
to the plate and incubated for one hour at 37oC. The plates were washed and second antibody
was added to the plate and incubated for one hour at 37oC. After incubation and washes,
freshly prepared TMB substrate (1X, BD Biosciences) was added to the wells and incubated
for 15 minutes. The reaction was stopped by addition of 2M sulfuric acid. The O.D. of the
plates were recorded at 450nm (Biotek plate reader)
2.47. Competition ELISA assays:

PSMD9 or PDZ domain were incubated with varying concentrations of peptide for one hour
at 37oC and then added to plates coated with hnRNPA1. The other steps were the same for
protein-protein interaction ELISA as described in section
2.48. Pulldown with purified recombinant proteins:
GST-tagged proteins were diluted in transport buffer and incubated with GST-Sepharose
beads (GE Healthcare) for one hour at 4oC. The beads were washed thrice and incubated with
interacting partner proteins (PSMD9 and its domains) for two hours at 4oC. Beads were
washed thoroughly (5-6 times) and boiled in the presence of SDS Laemmli buffer. Proteins
were resolved on a 12% SDS PAGE and western blotting was performed using anti-his
antibody (Cell Signaling).
2.49. Western blot:
Protein/cell lysate samples were resolved on 12% SDS PAGE. Proteins were transferred on
polyvinylidene difluoride (PVDF) membrane (Millipore). PVDF membrane was blocked with
3% BSA in TBST at room temperature for 1 hour on rocker. PVDF membrane was incubated
with 1:1000 dilution of primary antibody for 1 hour at room temperature on rocker.
Antibodies were diluted in TBST containing 1% BSA. After incubation, primary antibody
was removed and membrane was washed with TBST at least four times, 15 min each time at
room temperature on rocker. Membrane was incubated with corresponding secondary
antibody in the standardized dilution at room temperature for 1 hour on rocker. Secondary
antibody was removed and membrane was washed with TBST at least four times, 15 min
each time on rocker at room temperature. Membrane was incubated with ECL plus reagent
(GE Healthcare) was developed using ChemiDoc (Biorad)
2.50. Microscale thermophoresis

Figure 2.3 Experimental setup and output of microscale thermophoresis (image source:
Nanotemper Technologies)
Microscale Thermophoresis (MST) refers to the directed movement of any molecule across a
temperature gradient, which is also known as thermophoresis. The thermophoretic movement
of a molecule in its unbound state is different from its movement when it is bound to its
ligand. This difference in mobility is used to measure the affinity of interaction. One of the
interacting partners is fluorescently labelled and kept at constant concentration in a capillary
while the interacting partner is titrated at different concentrations. For MST analysis, one of
the interacting partners was labelled with fluorescent dye as per the manufacturer’s
instructions and the fluorescence signal was checked in the instrument to set the MST power
and fluorescence counts. 10µl of the unlabelled protein was titrated serially in 16 PCR tubes.
10µl of the fluorescently labelled protein was added to each tube and thoroughly mixed. The
samples were loaded into MST glass capillaries and kept in the instrument for MST analysis.
2.51. Surface Plasmon Resonance (SPR) experiments:

For immobilization approach on CM5 chip, the protein to be immobilized (ligand) was
diluted in sodium acetate buffer (between pH 4-5.5) and immobilized on CM5 chip via an
amine coupling reaction using EDC and NHS. The interacting partner protein was diluted in a
compatible running buffer and flown at different concentrations over the chip for kinetic
analysis. The maximum response unit generated upon analyte binding is known as Rmax.
Generally, for kinetic experiments, a Rmax of 50-100 is desirable.
The amount of ligand to be immobilized for a desired Rmax response is calculated using the
following formula:
𝑅𝑙𝑖𝑔𝑎𝑛𝑑 =(𝑀𝑜𝑙𝑒𝑐𝑢𝑙𝑎𝑟 𝑤𝑒𝑖𝑔ℎ𝑡 𝑜𝑓 𝑙𝑖𝑔𝑎𝑛𝑑 × 𝑅𝑚𝑎𝑥)
(𝑀𝑜𝑙𝑒𝑐𝑢𝑙𝑎𝑟 𝑤𝑒𝑖𝑔ℎ𝑡 𝑜𝑓 𝑎𝑛𝑎𝑙𝑦𝑡𝑒 × 𝑣𝑎𝑙𝑒𝑛𝑐𝑦 𝑜𝑓 𝑙𝑖𝑔𝑎𝑛𝑑)
The concentration of ligand to be immobilized was immobilized was calculated using the
formula:
𝐿𝑖𝑔𝑎𝑛𝑑 𝑐𝑜𝑛𝑐𝑒𝑛𝑡𝑟𝑎𝑡𝑖𝑜𝑛 =𝑅𝑙𝑖𝑔𝑎𝑛𝑑
100 ∗ 𝑀𝑜𝑙𝑒𝑐𝑢𝑙𝑎𝑟 𝑤𝑒𝑖𝑔ℎ𝑡 𝑜𝑓 𝑙𝑖𝑔𝑎𝑛𝑑
2.52. Maintenance and trypsinization of cell lines
The glassware and autoclavable plasticware were sterilized by autoclaving. For trypsinization
of adherent cell lines, media was aspirated with a pasteur pipette and cells were washed with
1X PBS gently. The PBS was removed carefully and trypsin was added to the cells. The cells
were incubated at 37oC for few minutes and then observed under microscope to check for
rounding up of cells. To the cells, 1ml of media was added to sop further action of trypsin.
The cells were detached by pipetting and transferred to glass tubes. The cells were then
centrifuged at 3000 rpm for 2 minutes. The supernatant was discarded and the cells were
resuspended in fresh medium by tapping. The cells were resuspended in complete medium,

counted with the help of haemocytometer and the desired number of cells were seeded in
plates containing complete medium.
2.53 Transient transfection by calcium phosphate method
HEK 293 cells were transfected with FLAG-PSMD9, PSMCs, N-domain or PDZ domain
using. One day prior to transfection, the cells were trypsinized and 5х 105cells were seeded
in a 55 mm plate. The plate should be around 60% confluent at the time of transfection. Next
day, 4 hr before transfection, medium was replaced with fresh complete medium. The cells
were transfected using 12 μg plasmid DNA (55 mm plate) using BBS. A total of 12 μg
plasmid was diluted to 100 μl in autoclaved MilliQ in a sterile tube. 100 μl of CaCl2 was
added drop wise to the DNA in a sterile microcentrifuge tube. Then, 200 μl of 2X BBS was
added drop wise and mixed gently by pipetting 3-4 times. The mix was incubated at room
temperature for 20 min, followed by gentle mixing of the DNA complexes. The DNA
mixture was then added drop wise over the cells, mixed gently by swirling the medium in the
plate and incubated at 37°C in CO2 incubator for 16 hrs. After 16 hrs, the transfection
medium was replaced with fresh complete medium.
2.54. Mammalian cell lysis
Cells were cultured till 80-90% confluent. The media was completely aspirated and plate was
washed with 4ml of 1X PBS. Immediately, 500μl of chilled NP40-lysis buffer was added to
the plate (90mm) and cells were scrapped from the plate and collected in a sterile
microcentrifuge tube. The cell suspension was vortexed for 10 seconds and incubated on ice
for 30minutes. After incubation, the suspension was again vortexed for 20 seconds and then
centrifuged at 13000 rpm for 30 minutes at 4ºC. The supernatant or the cell lysate was
transferred to a fresh microcentrifuge tube and incubated on ice. The protein content of the

lysate was estimated by Bradford or BCA estimation method following the manufacturers’
protocol
2.55. Immunoprecipitation of FLAG-tagged proteins using M2 agarose beads
FLAG-tagged constructs and empty vector control were transiently overexpressed in
HEK293 cells. After harvesting cells and lysis, the total protein content was estimated using
BCA method. The cell lysates were bound to 30µl of M2 agarose beads (Sigma) and
incubated for two hours at 4oC. The beads were washed five times with IP wash buffer
carefully and resolved on SDS-PAGE for western blot. The interaction of FLAG-tagged
proteins with endogenous interacting partner in HEK293 were checked by western blot.
2.56. Luciferase reporter assay
For luciferase assay, HEK 293 cells were co- transfected with vector control, PSMD9, N
domain and PDZ domain along with luciferase control plasmids (gift from Dr. Neil Perkins,
USA). After 48 hours of transfection, the cells were treated with 10ng/ml TNF-α (Invitrogen,
USA). The cells were lysed according to standard protocol and luciferase assay were carried
out as described in the manufacturer’s protocol (Promega Luciferase Assay kit).


Chapter 3:
Structural and functional characterization of
PSMD9: Exploring the synergy between domains

Introduction:
Previous reports from our lab established the role of PSMD9-hnRNPA1 interaction in NF-κB
activation. Here, Sahu et al showed that the ternary interaction between proteasome-bound
PSMD9, hnRNPA1 and IκBα results in degradation of IκBα by the proteasome, thereby leading
to NF-κB activation (Sahu et al. 2014). It was further established that the PDZ domain of
PSMD9 interacts with the C-terminus of hnRNPA1 and mutations in the PDZ domain affect
hnRNPA1 binding but not the association of PSMD9 with the proteasome. The role of the N-
terminal domain in this interaction was elusive and therefore, intricate details of inter-domain
communication and its influence on binding and functions of PSMD9 remained unclear. Such
mechanistic understanding is important to target PSMD9-hnRNPA1 interaction to inhibit IκBα
degradation and NF-κB activation.
Although many NF-κB inhibitors are currently in clinical trials, most of them target the IKKα
phosphorylation, or IκBα degradation and therefore, lead to many off-target effects (Gilmore
and Herscovitch 2006). Since PSMD9 has been identified as a regulator for NF-κB activation
and recent reports have reported the role of PSMD9 in sensitizing breast cancer cells to
radiotherapy, it could be envisaged that targeting PSMD9-hnRNPA1 interaction would be
beneficial in treating cancers that are dependent on NF-κB for survival and radio-resistance.
To dissect the molecular details of PSMD9-hnRNPA1 interaction, we cloned and expressed
the N-domain and PDZ domain of PSMD9, studied their secondary structure in isolation,
compared their folding and stability with the full-length protein and deciphered their interaction
with hnRNPA1 and C-terminal peptides. Guided by biophysical and biochemical insights and
experimental investigation, we provide evidence for the role of the two domains in folding and
stability of the full-length PSMD9, their concerted role in achieving the final folded structure
and describe the probable events leading to the formation of PSMD9-hnRNPA1 interaction.

Results and Discussion
Identification of domain boundaries of PSMD9
The homology model of PSMD9 was generated using the Nas2 N domain (PDB ID: 3WHL)
and Nas2 PDZ domain (PDB ID: 40O6) using MODELLER. The model indicated that the N-
domain is primarily α-helical and folds as a coiled-coil domain, while the PDZ domain has the
characteristic beta-sandwich fold with a permuted beta-sheet arrangement (figure 3.1). Based
on the model, the domain boundaries of the N-domain and PDZ domain were marked from 1-
120 for the N-domain and residues from 121-223 for the PDZ domain.
Figure 3.1. Homology model of PSMD9 (A)Sequence alignment of Nas2 and PSMD9 using
PRALINE tool (Heringa 1999) coloured according to secondary structure (red: helices; blue:
beta strands). (B) Nas2 N domain (PDB ID: 3WHJ) Satoh et.al., (2014) Nas2 PDZ domain
(PDB ID: 4O06) CR Singh.et.al. (2014). (C) Modelled structure of PSMD9

Figure 3.2. Cartoon representation of modelled structures of PSMD9, N-domain and PDZ
domain using Pymol (Delano 2002)
Cloning, expression, and purification of N-domain and PDZ domain
The domains were cloned and expressed in pETyong vector, a modified form of pET28a vector
harbouring a 6X His tag. Both N-domain and PDZ domain was obtained in the soluble fraction
of the cell lysate (figure 3.3) and were purified to homogeneity using nickel-affinity (Ni-IDA)
and gel filtration chromatography (figure 3.4, 3.5).
The molecular weight of the N-domain and PDZ domain were determined by SDS PAGE was
16kDa and PDZ domain was 14kDa on as estimated from the protein molecular weight markers
on the gel.

Figure 3.3. Expression of N-domain and PDZ domain in E.coli BL21 Codon Plus. Lane 1: N-
domain uninduced supernatant; Lane 2: N-domain induced supernatant; Lane 3: PDZ domain
uninduced supernatant; Lane 4: PDZ domain induced supernatant
Figure 3.4 (A) Purification of N-domain by Ni-IDA affinity chromatography (B) gel filtration
profile of N-domain on HiLoad Superdex 200 16/600 gel filtration column (C) Gel filtration
samples of N-domain resolved on 15% SDS gel
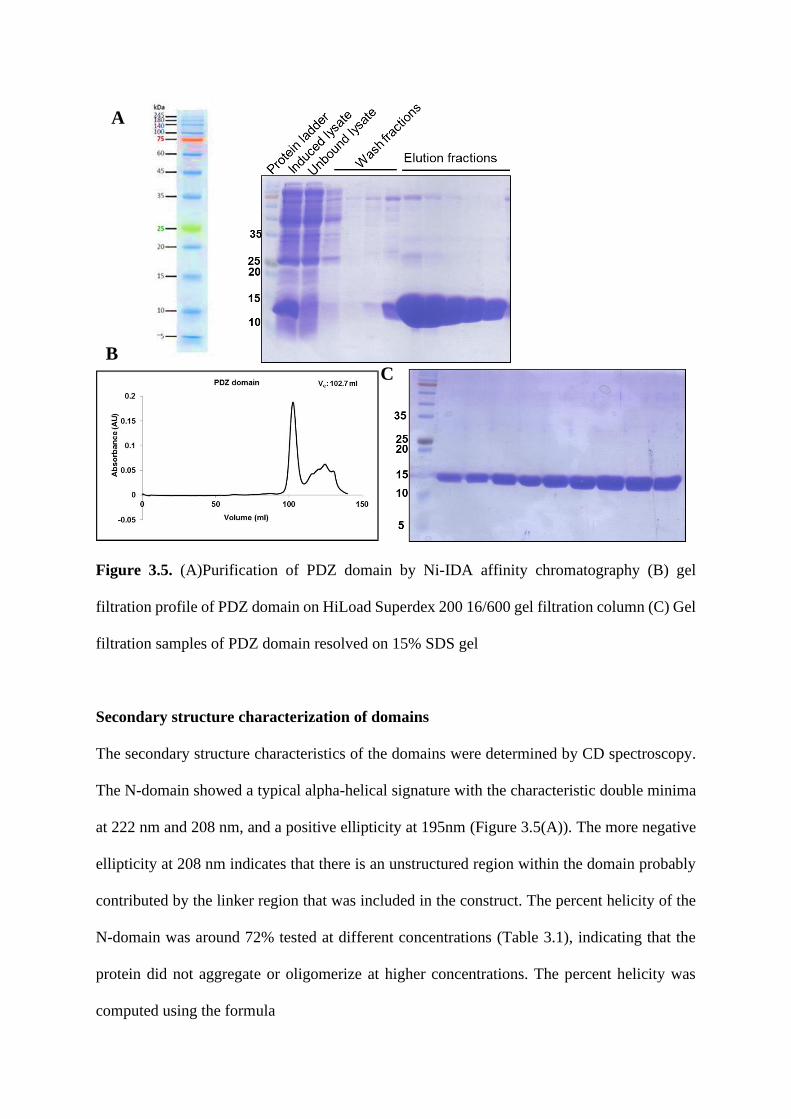
Figure 3.5. (A)Purification of PDZ domain by Ni-IDA affinity chromatography (B) gel
filtration profile of PDZ domain on HiLoad Superdex 200 16/600 gel filtration column (C) Gel
filtration samples of PDZ domain resolved on 15% SDS gel
Secondary structure characterization of domains
The secondary structure characteristics of the domains were determined by CD spectroscopy.
The N-domain showed a typical alpha-helical signature with the characteristic double minima
at 222 nm and 208 nm, and a positive ellipticity at 195nm (Figure 3.5(A)). The more negative
ellipticity at 208 nm indicates that there is an unstructured region within the domain probably
contributed by the linker region that was included in the construct. The percent helicity of the
N-domain was around 72% tested at different concentrations (Table 3.1), indicating that the
protein did not aggregate or oligomerize at higher concentrations. The percent helicity was
computed using the formula
A
B C

θ]222/[θ]max, where [θ]max = (−44 000 + 250T)(1 − k/n)]
where n is the number of amino acids, T is the temperature in degree Celsius and k is a finite
length correction (Shepherd et al. 2005). The PDZ domain was characterized by a beta-sheet
signature with a broad minimum at 215nm (Figure 3.5(B)). The CD signature of the domains
correlated with the predicted models, indicating that the domain structures were similar to their
Nas2 counterparts. The structural characteristics were independent of the concentrations tested
here. Further experiments were conducted within these concentrations. Thus, N-domain and
PDZ domain seem capable of folding independent of each other. The domain secondary
structures were compared with the full-length. The full length PSMD9 secondary structure is
characterized by double minima at 208 and 222 nm and a positive ellipticity at 195 nm. Here
again, the relative increase in negative ellipticity at 208 nm compared to 222 nm indicates the
presence of unstructured region/s. To address whether there was any structural alteration in the
full-length protein, the CD spectra of N and PDZ domains were summed and compared with
that of the full-length protein (Figure 3.7). There was a definite decrease in the 208nm
ellipticity of PSMD9 in comparison to the additive spectra of the domains, indicating a
reduction in randomness in the full-length PSMD9 structure which may arise either from
structural rearrangement of the domains or by the introduction of disordered to ordered
transition in some regions of the protein.
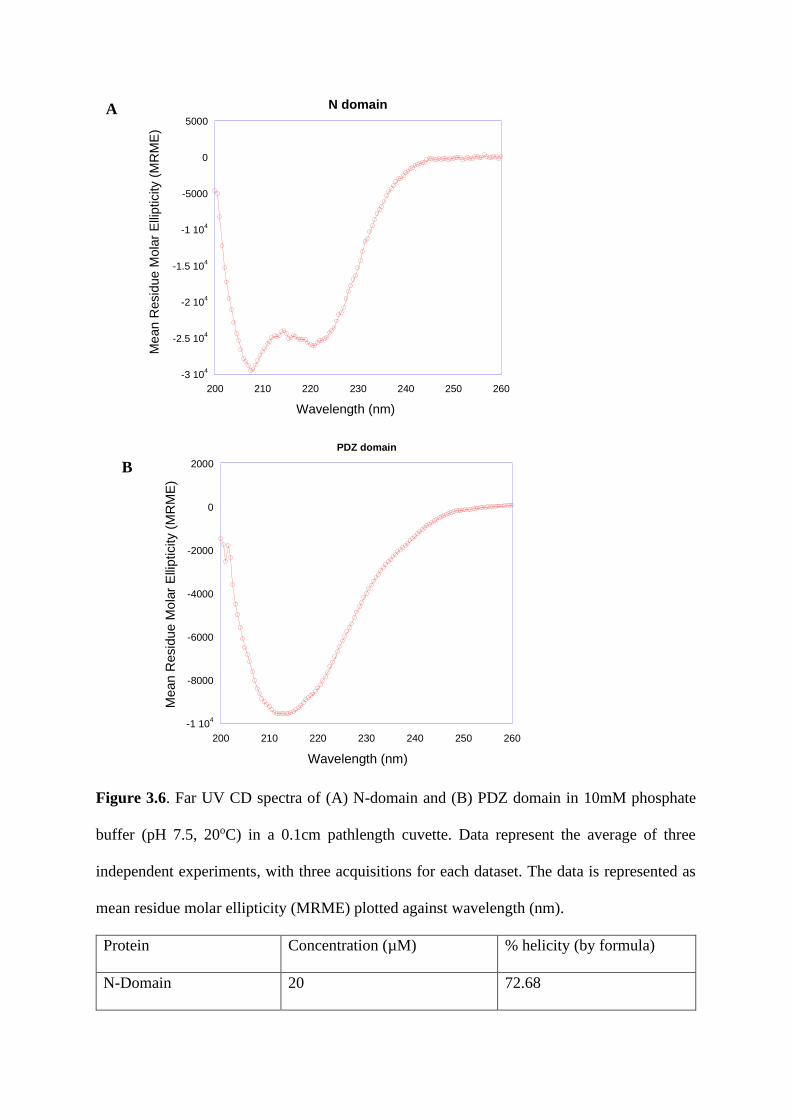
Figure 3.6. Far UV CD spectra of (A) N-domain and (B) PDZ domain in 10mM phosphate
buffer (pH 7.5, 20oC) in a 0.1cm pathlength cuvette. Data represent the average of three
independent experiments, with three acquisitions for each dataset. The data is represented as
mean residue molar ellipticity (MRME) plotted against wavelength (nm).
Protein Concentration (µM) % helicity (by formula)
N-Domain 20 72.68
-3 104
-2.5 104
-2 104
-1.5 104
-1 104
-5000
0
5000
200 210 220 230 240 250 260
N domain
Me
an
Resid
ue
Mo
lar
Elli
pticity (
MR
ME
)
Wavelength (nm)
-1 104
-8000
-6000
-4000
-2000
0
2000
200 210 220 230 240 250 260
PDZ domain
Mean
Resid
ue
Mo
lar
Elli
pticity (
MR
ME
)
Wavelength (nm)
A
B

10 71.62
5 73.78
Table 3.1. Calculation of percent helicity of N-domain at three different concentrations
Figure 3.7. Comparison of CD spectrum. The CD spectrum of PSMD9, N-domain and PDZ
domain with the additive spectrum of N and PDZ domain in 10mM phosphate buffer (pH 7.5,
20oC) in a 0.1cm pathlength cuvette. Data represent the average of three independent
experiments, with three acquisitions for each dataset. The data is represented as mean residue
molar ellipticity (MRME) plotted against wavelength (nm).
Contribution of N-domain in folding and stability of PSMD9: denaturation and refolding
studies
-4 104
-3 104
-2 104
-1 104
0
1 104
200 210 220 230 240 250 260
CD spectra
N domain
PSMD9
PDZ
N+PDZ domain
Mean R
esid
ue M
ola
r E
llipticity (
MR
ME
)
Wavelength (nm)
N+PDZ domain
N domain
PSMD9
PDZ domain

While the two domains can be purified in their soluble monomeric forms, their contribution to
the final fold and stability of the full-length protein can only be determined by subjecting them
to chemical or thermal denaturation. The thermal and chemical denaturation were attempted
for PSMD9 and its domains and the fraction folded was computed using the following formula:
𝛼 =(𝜃𝑡 − 𝜃𝑈)
(𝜃𝐹 − 𝜃𝑈)
Where,
𝜃𝑡 is the observed ellipticity at any temperature,
𝜃𝐹 is the ellipticity of the fully folded form
𝜃𝑈 is the ellipticity of the unfolded form
Thermal denaturation of PSMD9
20 40 60 80 1000.0
0.2
0.4
0.6
0.8
1.0
Temperature (oC)
Fra
cti
on
fo
lde
d
Refolding after thermal denaturation PSMD9
204060801000.0
0.1
0.2
0.3
0.4
0.5
Temperature (oC)
Fra
cti
on
fo
lde
d
A B

Figure 3.8. Thermal denaturation and refolding of PSMD9 assessed by CD spectroscopy (A)
Fraction folded calculated during thermal denaturation of PSMD9 from 20oC to 100oC (B)
Fraction folded calculated during refolding after thermal denaturation of PSMD9 from 100oC
to 20oC. The ellipticity at 222nm was used to compute the fraction folded. The data was fit to
non-linear regression least square analysis using the asymmetric sigmoidal five parameter
dose-response curve in GraphPad Prism software (C) CD spectra of native (red), unfolded
(green) and refolded (blue) PSMD9 in 10mM phosphate buffer (pH 7.5, 20oC) in a 0.1cm
pathlength cuvette. The data were averaged over three acquisitions and represented as mean
residue molar ellipticity (MRME) plotted against wavelength (nm).
-2.5 104
-2 104
-1.5 104
-1 104
-5000
0
5000
1 104
200 210 220 230 240 250 260
Thermal denaturation and refolding of PSMD9
native PSMD9
unfolded PSMD9refolded PSMD9
Mean
Resid
ue M
ola
r E
llipticity (
MR
ME
)
Wavelength (nm)
C

Figure 3.9. Thermal denaturation and refolding of N-domain assessed by CD spectroscopy (A)
Fraction folded calculated during thermal denaturation of N-domain from 20oC to 100oC (B)
Fraction folded calculated during refolding after thermal denaturation of N-domain from 100oC
to 20oC. The ellipticity at 222nm was used to compute the fraction folded. The data was fit to
non-linear regression least square analysis using the asymmetric sigmoidal five parameter
dose-response curve in GraphPad Prism software (C) CD spectra of native (red), unfolded
(green) and refolded (blue) N-domain in 10mM phosphate buffer (pH 7.5, 20oC) in a 0.1cm
pathlength cuvette. The data was averaged over three acquisitions and represented as mean
residue molar ellipticity (MRME) plotted against wavelength (nm).
20 40 60 80 100
0.0
0.5
1.0Thermal denaturation of Ndomain
Temperature (oC)
Fra
cti
on
fo
lde
dRefolding after thermal denaturation Ndomain
204060801000.0
0.1
0.2
0.3
0.4
0.5
Temperature (oC)
Fra
cti
on
fo
lde
d
-3.5 104
-3 104
-2.5 104
-2 104
-1.5 104
-1 104
-5000
0
5000
210 220 230 240 250 260
Thermal denaturation and refolding of N-domain
native N domain
unfolded N domain
refolded N domainMe
an
Resid
ue
Mo
lar
Elli
pticity (
MR
ME
)
Wavelength (nm)
C
A B

Figure 3.10. Thermal denaturation of PDZ domain assessed by CD spectroscopy. Fraction
folded calculated during thermal denaturation of the PDZ domain from 20oC to 100oC. The
ellipticity at 222nm was used to compute the fraction folded. The data were fit to non-linear
regression least square analysis using the asymmetric sigmoidal five parameter dose-response
curve in GraphPad Prism software
The thermal denaturation of PSMD9 and N-domain were strikingly similar and characterized
by a minor pre-transition state and a late post-transition state (figure 3.8A, 3.9A). The Tm and
of the N-domain in isolation and PSMD9 were almost identical (≈49oC), indicating that N-
domain has a major contribution to the stability of the protein. Since the pre-transition state
baseline is not stable, it is possible that both N-domain and PSMD9 show little or no resistance
to unfolding as evinced by the loss in ellipticity at 222 nm even at lower temperatures. In sharp
contrast, the PDZ domain in isolation was characterized by a much higher Tm and it was
resistant to denaturation and prone to aggregation, indicated by visible precipitates (figure
3.10). The plasticity of the individual structures was assessed by reversible cooling. Post-
denaturation, while the PSMD9 and N domain regained more than 80% of their structure upon
cooling or refolding (figure 3.8C, 3.9C), the PDZ domain was unable to do so and precipitated
at the end of thermal denaturation. To determine if these findings were consistent with chemical
denaturation, PSMD9 and N-domain were denatured in different concentrations of Gu-HCl and
Thermal denaturation of PDZ domain
40 60 80 1000.0
0.5
1.0
Temperature (oC)
Fra
cti
on
fo
lde
d

urea, allowed to unfold at 16oC overnight to achieve equilibrium. Both PSMD9 and the N-
domain denatured following a two-state transition followed the same denaturation profile in
Gu-HCl and urea. The denatured proteins were refolded by rapid dilution in cold refolding
buffer and incubated at 4oC for 16 hours to allow the slow refolding of proteins (3.11, 3.12,
3.13). The CD spectrum of refolded PSMD9 showed regain of around 60% of the native
structure after refolding and PSMD9 denatured in 8M urea showed more gain in structure as
compared to proteins refolded after denaturation in lower urea concentrations (3.14, 3.15). Two
important observations that were consistent (A) The denaturation profile of the full-length
PSMD9 was recapitulated by the N domain in its entirety. (B) The N domain and full-length
protein refolded to regain substantial structure while the PDZ domain could not (probably due
to accumulation of intermediates). Because full-length PSMD9 refolds with a substantial gain
in structure, the N domain must play a significant role in assisting the folding of the PDZ
domain.
-3 104
-2 104
-1 104
0
1 104
2 104
3 104
210 220 230 240 250 260
Urea denaturation of PSMD9
0M Urea2M Urea6M Urea8M Urea4M UreactrlM
ean
Resid
ue M
ola
r E
llipticity (
MR
ME
)
Wavelength (nm)
A

Figure 3.11. Urea denaturation and refolding of PSMD9 (A) CD spectra of PSMD9 denatured
in 0M, 2M, 4M, 6M and 8M urea at 20oC in a 0.1cm pathlength cuvette. (B) CD spectra of
PSMD9 refolded from 0M, 2M, 4M, 6M and 8M urea at 20oC in a 0.5cm pathlength cuvette.
Data was an average of three acquisitions.
-2.5 104
-2 104
-1.5 104
-1 104
-5000
0
5000
1 104
200 210 220 230 240 250 260
PSMD9 urea refolding
0M Urea
2M Urea
4M Urea
6M Urea
8M Urea
ctrlMean
Resid
ue M
ola
r E
llipticity (
MR
ME
)
Wavelength (nm)
-2 104
-1.5 104
-1 104
-5000
0
5000
1 104
220 230 240 250 260
GuHCl denaturation of PSMD9
PSMD9 ctrl
PSMD9 1M GuHCl
PSMD9 2M GuHCl
PSMD9 3M GuHCl
PSMD9 4M GuHCl
PSMD9 5M GuHCl
PSMD9 6M GuHCl
Mean
Resid
ue
Mola
r E
llip
ticity (
MR
ME
)
Wavelength (nm)
B
A

Figure 3.12. GuHCl denaturation and refolding of PSMD9 (A) CD spectra of PSMD9
denatured in 0M, 1M, 2M, 3M, 4M, 5M, and 6M GuHCl at 20oC in a 0.1cm pathlength cuvette.
(B) CD spectra of PSMD9 refolded from 0M, 1M, 2M, 3M, 4M, 5M and 6M GuHCl at 20oC
in a 0.5cm pathlength cuvette. Data was the average of three acquisitions and plotted as mean
residue molar ellipticity against wavelength (nm).
-1.5 104
-1 104
-5000
0
5000
220 230 240 250 260
PSMD9 GuHCl refolding
0M GuHCl refolded
1M GuHCl refolded
2M GuHCl refolded
3M GuHCl refolded
4M GuHCl refolded
5M GuHCl refolded
6M GuHCl refoldedMean R
esid
ue
Mola
r E
llipticity (
MR
ME
)
Wavelength (nm)
-3 104
-2.5 104
-2 104
-1.5 104
-1 104
-5000
0
5000
1 104
220 225 230 235 240 245 250 255 260
GuHCl denaturation of N-domain
ctrl
1M GuHCL
2M GuHCl
3M GuHCl
4M GuHCl
5M GuHCl
6M GuHClMe
an
Resid
ue M
ola
r E
llip
ticity (
MR
ME
)
Wavelength (nm)
B
A

Figure 3.13. GuHCl denaturation and refolding of N-domain (A) CD spectra of N-domain
denatured in 0M, 1M, 2M, 3M, 4M, 5M, and 6M GuHCl at 20oC in a 0.1cm pathlength cuvette.
(B) CD spectra of N-domain refolded from 0M, 1M, 2M, 3M, 4M, 5M and 6M GuHCl at 20oC
in a 0.5cm pathlength cuvette. Data was the average of three acquisitions and plotted as mean
residue molar ellipticity against wavelength (nm).
Figure 3.14. Refolding of PSMD9 from urea and GuHCl denaturation. (A) CD spectra of
native (red), control refolded (blue), urea refolded (purple) and GuHCl refolded (green)
PSMD9 in refolding buffer at 20oC in 0.1cm pathlength cuvette. Data was the average of three
-3 104
-2.5 104
-2 104
-1.5 104
-1 104
-5000
0
220 230 240 250 260
N domain GuHCl refolding
ctrl
1M GuHCl
2M GuHCl
3M GuHCl
4M GuHCL
5M GuHCl
6M GuHCl
Me
an
Resid
ue
Mo
lar
Elli
pticity (
MR
ME
)
Wavelength (nm)
-3 104
-2.5 104
-2 104
-1.5 104
-1 104
-5000
0
5000
210 220 230 240 250 260
Refolding of PSMD9
ctrlctrl refoldedGuHCl refoldedUrea refolded
P S M D 9 r e fo ld e d
Ctr
l
Gu
HC
l re
fold
ed
ure
a r
efo
lded
0 .0
0 .2
0 .4
0 .6
0 .8
1 .0
fra
cti
on
fo
lde
d
B
A B
A

acquisitions (B) Extent of refolding of PSMD9 computed from ellipticity at 222nm. The
ellipticity of control was considered as 1.
Figure 3.15. Refolding of N-domain from urea and GuHCl denaturation. (A) CD spectra of
native (red), control refolded (blue), urea refolded (purple) and GuHCl refolded (green) N-
domain in refolding buffer at 20oC in 0.1cm pathlength cuvette. Data was the average of three
acquisitions (B) Extent of refolding of N-domain computed from ellipticity at 222nm. The
ellipticity of control was considered as 1.
Thermal and chemical stability studies of the individual domains of PSMD9 under various
denaturing conditions led to the identification of the contribution of the N-domain towards
stability and structural contribution of PSMD9. Thus, by using the structure as a probe, we
describe for the first time, the structure, stability and thermodynamic properties of PSMD9 and
N-domain. These results would be used to better interpret the role of N and PDZ domains in
the binding of peptides, full-length proteins, and proteasomal subunits.
Structure-activity correlations and contribution of domains towards PSMD9 function
PDZ domains are conserved interaction domains that recognize and bind to C-terminus of
interacting partner proteins. Our earlier studies indicated that the PDZ domain can fully account
-1.4 105
-1.2 105
-1 105
-8 104
-6 104
-4 104
-2 104
0
2 104
200 210 220 230 240 250 260 270
Refolding of N-domain
ctrlctrl refolded GuHCl refolded Urea refolded
Mean
Resid
ue M
ola
r E
llipticity (
MR
ME
)
Wavelength (nm)
N d o m a in re fo ld e d
Nd
om
ctr
l
Gu
HC
l re
fold
ed
Ure
a r
efo
lded
0 .0
0 .2
0 .4
0 .6
0 .8
1 .0
fra
cti
on
fo
lde
d
B
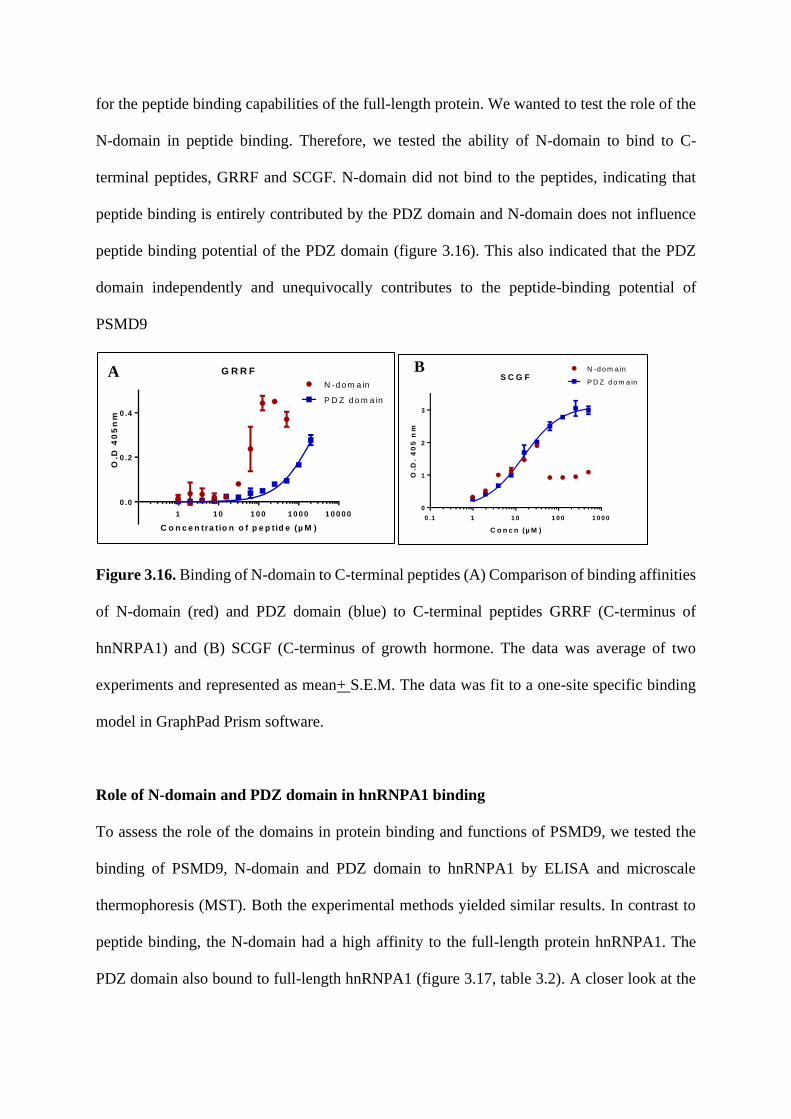
for the peptide binding capabilities of the full-length protein. We wanted to test the role of the
N-domain in peptide binding. Therefore, we tested the ability of N-domain to bind to C-
terminal peptides, GRRF and SCGF. N-domain did not bind to the peptides, indicating that
peptide binding is entirely contributed by the PDZ domain and N-domain does not influence
peptide binding potential of the PDZ domain (figure 3.16). This also indicated that the PDZ
domain independently and unequivocally contributes to the peptide-binding potential of
PSMD9
Figure 3.16. Binding of N-domain to C-terminal peptides (A) Comparison of binding affinities
of N-domain (red) and PDZ domain (blue) to C-terminal peptides GRRF (C-terminus of
hnNRPA1) and (B) SCGF (C-terminus of growth hormone. The data was average of two
experiments and represented as mean+ S.E.M. The data was fit to a one-site specific binding
model in GraphPad Prism software.
Role of N-domain and PDZ domain in hnRNPA1 binding
To assess the role of the domains in protein binding and functions of PSMD9, we tested the
binding of PSMD9, N-domain and PDZ domain to hnRNPA1 by ELISA and microscale
thermophoresis (MST). Both the experimental methods yielded similar results. In contrast to
peptide binding, the N-domain had a high affinity to the full-length protein hnRNPA1. The
PDZ domain also bound to full-length hnRNPA1 (figure 3.17, table 3.2). A closer look at the
G R R F
C o n c e n tra t io n o f p e p tid e (µ M )
1 1 0 1 0 0 1 0 0 0 1 0 0 0 0
0 .0
0 .2
0 .4
O.D
40
5n
m
P D Z d o m a in
N -d o m a inS C G F
C o n c n (µ M )
O.D
. 4
05
nm
0 .1 1 1 0 1 0 0 1 0 0 0
0
1
2
3
N -d o m a in
P D Z d o m a inA B

data and further analysis provided interesting insights. The binding potential of the individual
domains was low as compared to the full-length protein and the reasons for this poor binding
potential were very different: the equilibrium dissociation constant (KD) of the N domain was
surprisingly similar to PSMD9 but the Bmax of binding was low for N domain. In contrast, the
KD was higher for the PDZ domain but the Bmax was closer to that of PSMD9.
Figure 3.17. ELISA for binding of PSMD9 (blue), N-domain (red) and PDZ domain (green)
to hnRNPA1. The data was an average of two independent experiments, each run in duplicate
and represented as mean + SEM. The data were fitted to one-site total binding in GraphPad
Prism software.
Protein Kd (µM±S.E.) Bmax Binding
potential B. P
B.P relative
to PSMD9
PSMD9-
hnRNPA1 1.52±0.18 1.43 94% --
N-domain
hnRNPA1 2.33±0.35 0.68 29% 31%
PDZ-hnRNPA1 11.15±2.41 1.67 15% 16%
P ro te in -p ro te in E L IS A
C o n c n (µ M )
O.D
. 4
50
nm
0 2 0 4 0 6 0 8 0 1 0 0
0 .0
0 .5
1 .0
1 .5 P S M D 9
N -d o m a in
P D Z

Table 3.2. Binding affinities of PSMD9, N-domain and PDZ domain to hnRNPA1 computed
from ELISA.
Figure 3.18. MST for binding of (A) PSMD9, (B) N-domain and (C) PDZ domain to
hnRNPA1. The data was an average of two independent experiments, each run in duplicate and
represented as mean + SEM.
Protein Kd (µM±S.E.)
PSMD9-hnRNPA1 2.68±0.75
N-domain hnRNPA1 3.22±1.13
PDZ-hnRNPA1 13.54±0.63
P S M D 9 -h n R N P A 1
C o n c n (µ M )
Re
sp
on
se
(a
vg
)
0 .0 0 1 0 .0 1 0 .1 1 1 0 1 0 0
9 2 5
9 3 0
9 3 5
9 4 0
N d o m a in -h n R N P A 1
C o n c n (µ M )
Re
sp
on
se
(a
vg
)0 .0 0 0 1 0 .0 0 1 0 .0 1 0 .1 1 1 0 1 0 0
9 0 0
9 1 0
9 2 0
P D Z -h n R N P A 1
C o n c n (µ M )
Re
sp
on
se
(a
vg
)
0 .0 0 0 1 0 .0 0 1 0 .0 1 0 .1 1 1 0 1 0 0
9 2 5
9 3 0
9 3 5
A B
C

Table 3.3. Binding affinities of PSMD9, N-domain and PDZ domain to hnRNPA1 computed
from MST experiments. The data were fitted to a Kd model of MST in GraphPad Prism
software.
Kinetics of PSMD9-hnRNPA1 interaction by surface plasmon resonance (SPR)
The binding studies revealed a characteristic role of each domain in the structure and function
of PSMD9. Since binding studies are equilibrium studies that do not give information on the
dynamic nature of the interaction, we probed the kinetics of PSMD9-hnRNPA1 interaction
SPR which provides a real-time kinetic measure of the on and off the rate of association to
understand the complex nature of the interaction (figure 3.19). Here, PSMD9 was used as
ligand and captured on an NTA chip via its His-tag and hnRNPA1 was titrated at varying
concentrations over the chip. The interaction between the two proteins was evident with
response units increasing with the increase in concentration and equilibrium achieved at each
of the concentrations tested. The association and dissociation rates are low and the response
does not return to baseline during the dissociation phase. When data was analyzed using global
fitting for a simple 1:1 binding, the fit was poor and the residuals were wide indicating that the
model does not adequately explain the data. This is not entirely surprising since both PSMD9
and hnRNPA1 are multi-domain proteins with interactions involving various regions of the
protein. Based on the detailed investigations above, it can be inferred that both N and the PDZ
domain carry binding sites for hnRNPA1 (as the N domain does not bind to the tetrapeptide,
other regions of hnRNPA1 must be involved in interaction). Based on this rationale, we fit the
data to two-state reaction kinetics and found that the experimental data is better explained by
this rate equation and the residuals were clearly within the limits. Besides the equilibrium, Kd
obtained by this method was very similar to the Kd obtained using ELISA indicating that the
model in all likely hood is correct.

Figure 3.19: Kinetics of PSMD9-hnRNPA1 interaction studied by SPR. (A) The data were
fitted to a two-state reaction model. The fitted data was represented as red and original data
was represented in black. (B) Residual plot of the fitted kinetics data
Curve ka1 (1/Ms) kd1 (1/s) ka2 (1/s) kd2 (1/s) KD (M) Rmax (RU) Conc (M) tc kt (RU/Ms) RI (RU) Chi² (RU²)
3800 0.03046 0.01773 0.005219 1.82E-06 346 5.39E+06 69.2
Cycle: 11 5 µM 5.00E-06 1.99E+07 35.47
Cycle: 13 10 µM 1.00E-05 1.99E+07 47.3
Cycle: 15 20 µM 2.00E-05 1.99E+07 27.2
Table 3.4. Kinetic parameters of PSMD9-hnRNPA1 interaction. The kinetic data were fit to
two-state reaction model of Biaevaluation software.
Immunoprecipitation of PSMD9, N-domain and PDZ domain with hnRNPA1
The interaction of the N-domain and PDZ domain with hnRNPA1 was tested by in vitro
pulldown using recombinant proteins and immunoprecipitation of FLAG-overexpressed
P S M D 9 -h n R N P A 1
t im e (s e c o n d s )
-1 0 0 1 0 0 2 0 0
-1 0 0
1 0 0
2 0 0
3 0 0
4 0 0
h n w t 5 µ M
F itte d h n w t 5 µ M
h n w t 1 0 µ M
F itte d h n w t 1 0 µ M
h n w t 2 0 µ M
F itte d h n w t 2 0 µ Mre
sp
on
se
un
its
(R
U)
A
B

domains with endogenous hnRNPA1 in HEK293 cells. The pulldown with recombinant N-
domain showed a considerable amount of background signal, hence could not be interpreted
(data not shown). The pulldown of PSMD9 and PDZ domain with purified hnRNPA1 revealed
that the interaction of the PDZ domain with hnRNPA1 was less as compared to PSMD9. The
interaction of the PDZ domain with the C-terminal deleted construct of hnRNPA1 (hndelC7)
was negligible, indicating that in the absence of the C-terminal motif of hnRNPA1 leads to
further reduction of binding with PDZ domain (figure 3.20). For immunoprecipitation
experiments in HEK293 cells, FLAG-tagged constructs of PSMD9, N-domain and PDZ
domain were trans-overexpressed in HEK293 and the lysates were bound to M2 agarose beads
(FLAG) (Sigma) and probed for interaction with endogenous hnRNPA1. Both the N-domain
and PDZ domains showed a modest reduction in binding to hnRNPA1 in comparison to
PSMD9 (figure 3.21).
Figure 3.20. Immunoprecipitation of purified recombinant proteins PSMD9 and PDZ domain
with hnRNPA1. The blot was probed with anti-His antibody

Figure 3.21. Immunoprecipitation of FLAG-tagged PSMD9, N-domain and PDZ domain with
endogenous hnRNPA1 in HEK293 cells
The ability of N-domain and PSMD9 to regain function after refolding
Our denaturation and refolding studies revealed an interesting structural property of PSMD9
and N-domain to refold after thermal and chemical denaturation. We investigated whether
refolded protein could regain function as well by testing the binding of refolded proteins to
hnNRPA1 and peptide SCGF. While refolded PSMD9 regained 43% binding to hnRNPA1, the
refolded N-domain regained 50% binding to hnRNPA1 in comparison to respective controls
(figure 3.22, 3.33). Surprisingly, when we tested the ability of refolded PSMD9 to bind to C-
terminal peptide SCGF, we observed that refolded PSMD9 could regain 93% of peptide
binding as compared to control (figure 3.24). This further confirms our earlier interpretation
that the PDZ domain in the context of PSMD9 regains its native fold (although alone it is
unable to do so). The N domain or the linker must provide the structure or the space to refold.
The inability to regain near-native binding potential of the full-length PSMD9 or N domain
with hnRNPA1 indicates that the refolded protein has not reached the native-like fold (despite
the near-complete gain in the secondary structure) or that the inter-domain communication is
not fully established. A more trivial reason could be the presence of residual denaturant and

salt present in the refolding mixture which seems to affect protein interaction and not peptide
binding.
Figure 3.22. Binding ability of denatured and refolded PSMD9 to hnRNPA1. Data were fitted
to one site total binding in GraphPad Prism software
PSMD9 control PSMD9 urea
refolded
PSMD9 GuHCl
refolded
Bmax 1.224 0.5433 0.5144
Kd 0.9506 0.6083 0.9405
Table 3.5. Binding affinities of refolded PSMD9 to hnRNPA1 tested by ELISA.
Figure 3.23. Binding ability of denatured and refolded N-domain to hnRNPA1. Data were
fitted to one site total binding in GraphPad Prism software
N-domain control N-domain urea
refolded
N-domain GuHCl
refolded
Bmax 0.8385 0.4071 0.4360
Kd 4.380 1.329 1.356
P S M D 9 -h n R N P A 1
C o n c n (µ M )
O.D
. 4
50
nm
0 .0 1 0 .1 1 1 0 1 0 0
0 .0
0 .5
1 .0
1 .5
2 .0
P 9 u re a re fo ld e d
P 9 G u H C l re fo ld e d
N d o m a in -h n R N P A 1
C o n c n (µ M )
O.D
. 4
50
nm
0 .0 1 0 .1 1 1 0 1 0 0
0 .0
0 .2
0 .4
0 .6
0 .8
1 .0
N d o m c tr l
N d o m u re a re fo ld e d
N d o m G u H C l re fo ld e d

Table 3.6. Binding affinities of refolded N-domain to hnRNPA1 tested by ELISA.
Figure 3.24. The binding ability of PSMD9 refolded after denaturation in GuHCl and urea to
peptide SCGF. Data were fitted to one site total binding in GraphPad Prism software
PSMD9 control PSMD9 urea
refolded
PSMD9 GuHCl
refolded
Bmax 2.516 2.359 2.326
Kd 7.248 10.63 12.62
Table 3.7. Binding affinities of refolded PSMD9 C-terminal peptide SCGF tested by ELISA.
Concerted action of N-domain and PDZ domain in NF-κB signaling
The binding and kinetic studies revealed the synergy between N-domain and PDZ domain for
binding to hnRNPA1. However, the role of both domains in the function of PSMD9 was not
yet deciphered. Previously, our lab established that PSMD9 overexpressing cells had a higher
NF-κB activity, which was attributed to PSMD9-hnRNPA1 interaction and complex formation.
We asked to what extent the decrease in the binding potential of N and PDZ domains to
hnRNPA1 as seen from in vitro experiments affected interaction within the mammalian cells
and what may be the consequence of NF-κB activity. Both N-domain and PDZ domain was
defective in binding to hnRNPA1 as compared to the full-length PSMD9. Consequently, both
N-domain and PDZ domain expressing cells did not show any enhancement of NF-κB activity
P S M D 9 -S C G F
C o n c n (µ M )
O.D
. 4
05
nm
0 .1 1 1 0 1 0 0 1 0 0 0 1 0 0 0 0
0
1
2
3
P 9 c tr l
P 9 G u H C l re fo ld
P 9 u re a re fo ld

as compared to PSMD9 overexpressing cells, with values remaining similar to vector control
cells. In PSMD9 overexpressing cells, there was a 2.5-fold increase in NF-κB activity as
compared to vector control cells (figure 3.25). These results indicate the observed interaction
of the individual domains with hnRNPA1 in HEK293 cells is suboptimal for NF-κB activation
faithfully reflecting the lower binding potential of these domains observed in in vitro
experiments. The domain architecture of the full-length protein in its native fold is a mandatory
requirement for NF-κB activation. Thus, N-domain and PDZ domain act in synergy not only
to regulate binding but also for NF-κB activation.
N F k B A c tiv ity
pC
MV
Co
ntr
ol
pC
MV
-PS
MD
9
pC
MV
-ND
om
ain
pC
MV
-PD
Z D
om
ain
0
1
2
3
4
5
Fo
ld C
ha
ng
e
Fir
efl
y/R
en
illa
Ra
tio
Figure 3.25. Luciferase assay for NF-κB activation. PSMD9, N-domain and PDZ domain were
transiently overexpressed along with luciferase vectors. The NF-κB activity was estimated by
measuring luciferase activity of overexpressed lysates of PSMD9, N-domain and PDZ domain.
The luciferase activity from firefly luciferase was normalized with renilla luciferase control.
The data were represented as fold change and represents mean + SEM of four independent
experiments, each done in triplicate.

Understanding the crosstalk between PSMD9 and proteasomal ATPases
The above studies highlight the role of the individual domains of PSMD9 in mediating its
binding to hnRNPA1. While the role of PSMD9 as a proteasomal assembly chaperone has been
reported extensively, the finer details of its interaction with the proteasomal ATPases have still
not been studied in the mammalian system. To probe into the details of PSMD9 interaction
with the proteasomal subunits, especially the ATPases, we tested the interaction of PSMD9
and PDZ domain with the C-terminal peptides of the reported interacting ATPases, PSMC3,
and PSMC6. (The binding of N-domain peptides was not tested since our studies have indicated
that N-domain has no role in peptide binding). Both PSMD9 and PDZ domain bound to the C-
terminus of PSMC3 (QYYA) with high affinity (figure 3.26). The C-terminal peptide of
PSMC6 (YKPV) bound to PSMD9 and PDZ domain but the Bmax was only 29% in
comparison to PSMC3. These results are in coherence with previous studies which indicate
that the interaction of PSMD9 with PSMC3 is direct and the interaction of PSMD9 with
PSMC6 is indirect in nature, probably mediated via PSMC3 (Kaneko et al. 2009, Satoh et al.
2014).
Figure 3.26. Interaction of PSMD9 and PDZ domain with C-terminal peptides of proteasomal
ATPases PSMC3 (QYYA, shown in red) and PSMC6 (YKPV, shown in blue). The
measurements were done in duplicates and data is an average of two independent experiments.
The data were fitted to one-site specific binding in GraphPad Prism software.
P S M D 9
C o n c e n tra t io n o f p e p tid e (µ M )
O.D
. 4
05
nm
1 1 0 1 0 0 1 0 0 0
0 .0
0 .5
1 .0
Q Y Y A
Y K P V
P D Z d o m a in
C o n c e n tra t io n o f p e p tid e (µ M )
O.D
. 4
05
nm
1 1 0 1 0 0 1 0 0 0
0 .0
0 .5
1 .0
1 .5
Q Y Y A
Y K P V
A B

Protein Peptide Kd (µM±S.E.) Bmax
PSMD9 QYYA 13.2±1.7 0.94
PSMD9 YKPV 26.7±4.7 0.32
PDZ domain QYYA 6.9±0.8 1.2
PDZ domain YKPV 18.6±2.6 0.61
Table 3.8. Binding affinities of PSMD9 to C-terminal peptides of proteasomal ATPases
PSMC3 (QYYA) and PSMC6 (YKPV).
The interaction of PSMD9 with proteasomal ATPases was studied in a mammalian expression
system. The PSMCs (1,2,3,4,5 and 6) were cloned in the FLAG-tag expression vector and
transiently transfected in HEK293 cells. The interaction of FLAG-PSMCs with endogenous
PSMD9 in HEK293 was tested by immunoprecipitation and probing with the anti-PSMD9
antibody. PSMD9 showed interaction with PSMC3 and PSMC5, which also corroborate with
previous reports(Kaneko et al. 2009, Satoh et al. 2014) (figure 3.27).
Figure 3.27. Immunoprecipitation of FLAG-PSMCs with endogenous PSMD9 in HEK293
probed with anti-PSMD9 antibody.
Structure-function correlation in PSMD9 and synergy between domains

The binding experiments suggest that the total binding of the domains is less as compared to
full-length PSMD9. Combining the structural characterization and binding experiments, it is
possible to decipher the role of the domains in binding, structure, and function of PSMD9.
In the binding experiments, while the N-domain has a high affinity, the Bmax is less than
(almost half) of PSMD9. This indicates that the total occupancy of the N-domain is less than
PSMD9. Structural characterization of PSMD9, N-domain and PDZ domain indicate that most
of the structure in PSMD9 is contributed by the N-domain, while the PDZ domain in isolation
has less structure as compared to N-domain and PSMD9. The model of N-domain generated
based on Nas2 N domain comprises of 4 alpha-helices. These results indicate that although N-
domain may have a major structural contribution in PSMD9, efficient/maximal binding
requires the presence of the PDZ domain. The lower occupancy of the N-domain could be
attributed to the rapid koff (dissociation rate) of the N-domain in the absence of the PDZ domain.
Since ELISA and pulldown binding experiments equilibrium experiments, it is not possible to
estimate kinetic parameters such as association (kon) and dissociation rates (koff).
The rapid dissociation of the N-domain could be due to the lack of the interactions that are
present in full-length PSMD9, or decreased stability of the complex in the absence of the PDZ
domain. To understand the details of the concerted action of the domains, some inferences can
be drawn from Nas2-Rpt5 interaction studies.
The Nas2 N-domain comprises of four alpha-helices, where the α4 helix forms the structural
core and α3 and α4 helices of Nas2 N-domain primarily interact with Rpt5 C-terminal domain.
In the kinetics of Nas2-Rpt5C interaction studied by SPR, the Nas2 N domain shows reduced
binding (Kd of 14.8µM) in comparison to Nas2 (5.8µM) to Rpt5C and Nas2 PDZ does not bind
to Rpt5C. In the same report, the koff of the Nas2 N-domain was higher than the full-length
Nas2. In a parallel study, the interaction of the Nas2 PDZ domain with Rpt5C was studied by
an analogous technique, biolayer interferometry using three constructs of the Nas2 PDZ

domain; one which encompassed the full-length Nas2, one covering residues 92-223 and third
one covering residues 120-223 (Nas2 PDZ). Here, it was seen that the incorporation of residues
form the Nas2 N-domain (from the α4 helix) increased the affinity to Rpt5C, indicating that
the α4 helix of Nas2 N-domain has a major role in mediating the binding in Nas2.
Similarly, it could be envisaged that in PSMD9, the N-domain contributes to the bulk of the
binding to hnRNPA1, but efficient binding requires the presence of the PDZ domain. PDZ
domain in isolation does not bind effectively to hnRNPA1 as indicated by our binding
experiments, however, it reinforces binding to N-domain. This could readily explain the
differences in Bmax values of N-domain-hnRNPA1 and PSMD9-hnRNPA1 interaction. The
N-domain in isolation interacts with hnRNPA1 with high affinity (Kd- 2µM), but due to the
absence of the PDZ domain, the interaction is not stable and the dissociation rate is high, which
results in lower Bmax as compared to the full-length protein. However, the PDZ domain, by
itself cannot bind to hnRNPA1 in isolation, either due to the lack of structure in absence of N-
domain or due to the absence of strong interactions that are contributed by the N-domain. Thus,
N-domain accounts for maximal binding, while the PDZ domain reinforces binding by N-
domain.
It is also likely that the interaction of the PDZ domain with the C-terminus of hnRNPA1
induces conformational changes in the N-domain, thereby orienting it to interact maximally
with hnRNPA1.
The kinetics of PSMD9-hnRNPA1 interaction revealed an interesting pattern of two-state
reaction kinetics of interaction, which can be attributed to binding induced conformational
changes, however, these conformational changes need to be confirmed by additional parallel
techniques. Based on these results, it is also possible that the binding of the PDZ domain to the
C-terminus of hnRNPA1 induces conformational changes in the N-domain, which leads to the
stabilization of N-domain-hnRNPA1 interaction.

Besides, analysis of the PSMD9 sequence reveals that the loop connecting the N-domain and
PDZ domain harbours a stretch of charged residues, which could also play a role in mediating
interaction with hnRNPA1. It has been observed in membrane proteins that stretch of charge
residues play a crucial role in determining the topology of the protein (Harley and Tipper 1996).
Therefore, the presence of the PDZ domain with the charged loop may orient the N-domain
such that it forms stable interactions with hnRNPA1. Thus, the concerted action of the N-
domain and PDZ domain helps in mediating the interaction with hnRNPA1.
An interesting observation is that N-domain and PDZ domain alone is unable to activate NF-
κB indicating that both domains regulate essential functions of PSMD9. Apart from its
functional role, the N-domain also has major contributions towards the structure of PSMD9.
Since Nas2 and PSMD9 are orthologous in nature, the α 4 helix of PSMD9 N-domain may also
form the structural core. Although the role of the α4 helix in hnRNPA1 binding remains to be
tested, it has a major structural contribution in PSMD9. Deletion of a part of the helix (1-92)
in the N-domain leads to complete loss of structure in the N-domain, while the incorporation
of this region (93-223) in the PDZ domain leads to gain of structure in PDZ domain,
characterized by increased alpha-helical content of PDZ domain. Thus, while the PDZ domain
reinforces binding in the N-domain, the N-domain also leads to the stabilization of PDZ-
hnRNPA1 interaction. In the absence of the N-domain, the long linker region (of about 30
residues) connecting the N-domain and PDZ -domain is unstructured, which could impede the
folding of the PDZ domain. This could also explain the less structured nature of the isolated
PDZ domain. Even if this loop region is removed (PDZ 134-223), the random coil signature of
the PDZ domain reduces, but the overall structure of the PDZ domain is still less as compared
to full-length PSMD9. Grafting a region of the α4 helix of the N-domain in the PDZ domain
(93-223) leads to an increased structure in the PDZ domain.

N-domain is an all alpha-helical protein and the folding of alpha-helix is kinetically favoured.
Many alpha-helical proteins are known to refold after chemical denaturation. In PSMD9, most
of the structural contribution comes from the N-domain, therefore the refolding of PSMD9
after denaturation can be attributed to the refolding ability of the N-domain. PDZ domain in
isolation does not refold, and even in refolded PSMD9, it may or may not regain its native
structure. However, even if the PDZ domain does not regain its native fold, it still can retain
its ability to bind to tetrapeptides, which is evident by the near-complete binding to C-terminal
tetrapeptides. This is not surprising since our MD simulations of PDZ-peptide interaction
indicate that the peptide is held in an extended conformation by several hydrogen bonds,
hydrophobic interactions and charge-charge interactions in the PDZ domain. Moreover,
mutation of critical residues in the binding pocket of the PDZ domain led to an only modest
reduction in affinity to the peptide, indicating that even if few interactions are lost, the peptide
can still bind to PDZ domain. Therefore, even if the PDZ domain does not regains its complete
native structure, partial regain of structure, especially of the core residues in the hydrophobic
peptide-binding pocket is sufficient for the peptide to bind, and therefore, near-complete regain
of peptide-binding ability is seen in PSMD9 after refolding.
Thus, the above studies reveal an interesting cross-talk between domains for binding and
function. While the N-domain accounts for maximal binding to hnRNPA1, the PDZ domain
reinforces binding, either by the orientation of N-domain to ensure maximal binding or
inducing conformational changes which result in an increased affinity of N-domain. The N-
domain, in turn, imparts structure to the PDZ domain and aids in the folding of the PDZ domain.
Our studies reveal an interesting phenomenon of synergy between two domains to regulate the
structure and functions in PSMD9. These studies also highlight the importance of the
previously uncharacterized N-domain and its role in structure and binding in PSMD9. In

addition, our studies unravelled an important property of PSMD9 to refold and gain structure
after denaturation, which could be crucial for its chaperoning functions.

Chapter 4:
Identification of a novel signature motif for
high affinity interaction with PDZ domain
of PSMD9: understanding binding
preferences and per residue contribution to
binding

Introduction
Protein-protein interactions are primarily mediated by specific recognition motifs or domains
in proteins. PDZ domains are one such class of conserved modular protein interaction domains
found in nature and widely represented in the human proteome. PDZ domains recognize and
bind to the C-terminus of interacting partner proteins in a highly sequence-specific fashion,
although some PDZ domains bind to internal sequences of client proteins as well. The term
‘PDZ’ is an derived from three proteins in which this domain was first identified; PSD-95,
Discs-large, ZO-1(Kennedy 1995). Structurally, this conserved interaction domain comprises
of conserved fold comprising of five to six beta sheets and two alpha helices which fold in a
beta-sandwich structure(Hung and Sheng 2002, Lee and Zheng 2010). These domains typically
serve as scaffold proteins for tethering protein complexes in close proximity in signalling
complexes and found in many synaptic junctions, where they are primarily function to
transduce and amplify signals among others, thus serving as a multi-functional protein. Since
PDZ domains are implicated in many signalling processes, mutations in this domain have been
linked to several neurological diseases and cancer. The small region of recognition and binding
by PDZ domain to interacting partner peptides has rendered them as attractive ‘druggable’
targets (Wang, Lee et al. 2008). However, targeting PDZ-peptide interaction using specific
inhibitors is fraught with difficulties because a single PDZ domain can bind to multiple
interacting partners with similar binding interfaces. These problems can be addressed by
detailed assessment of the PDZ-peptide interaction using high-resolution structural which can
aid in development of inhibitors with minimum off-target effects.
PSMD9 harbours an atypical PDZ domain which is distinct in its arrangement of beta sheets
and binding pocket as compared to other PDZ domains. Based on the premise that PDZ
domains recognize C-terminus of interacting partners, our lab identified, our lab identified
several novel interacting partners of PSMD9 using a peptide library of the human proteome

generated by Chung and co-workers (Sangith, Srinivasaraghavan et al. 2014). Two of these
proteins, hnRNPA1 (harbouring GRRF sequence at the C-terminus) and growth hormone
(harbouring SCGF sequence at the C-terminus) were interesting because they showed
drastically different binding affinities to PSMD9 (KD of GRRF- 600µM and SCGF- 8µM).
Modified peptides of GRRF harbouring a hydrophobic residue (X=I, L or C) at the P0 position
could bind with same or higher affinity to PSMD9, but the peptide harbouring glycine at P0
position (GRRG) did not bind to PSMD9 and was unable to inhibit PSMD9-hnRNPA1
interaction, thus indicating that a ligand with hydrophobic residue at P0 position was favoured
by the PSMD9 PDZ for recognition and hence binding. However, peptide variants of SCGF
harbouring glycine at P0 position (SCGG), retained binding to PSMD9 and also inhibited
PSMD9-growth hormone interaction.
These results indicated an interesting phenomenon where two peptides harbouring same
residue at P0 position, which contributes largely to peptide binding and recognition showed
~70-fold difference in affinity to the same PDZ domain. It is also interesting to note that,
hydrophobicity at P0 position is critical for weak binding peptide but not for strong binder.
Since most PDZ-peptide interactions are driven by residues at P0 and P-2 position of peptide
ligands, we asked if we could convert a weak binder to a strong binder by modulating residues
at specific position in the peptides, and thereby could we develop a peptide which can compete
with natural counterpart in hnRNPA1 for binding to PSMD9. Screening of peptide variants
with differential binding affinities, we converted the weak binder to a tight binder peptide. This
scaffold was able to inhibit PSMD9-hnRNPA1 and PDZ-hnRNPA1 interaction, which is a
crucial event in NF-κB signalling and hence can be targeted in cancers which rely on NF-κB
signalling for growth, survival and resistance.
Using a guided computational approach to decipher the mechanistic details of PDZ-peptide
interaction, we identified the contribution of residues at varying positions of peptides towards

binding energy. Extensive ligand mapping simulations gave insights into the possible reasons
for vast affinity differences between peptides GRRF and SCGF. Further structure-guided
peptide screening also led to identification of a peptide scaffold for inhibiting PSMD9-
hnRNPA1 interaction, which could pave the way for new generation NF-κB inhibitors
Results and discussion
PDZ domain mirrors peptide binding of PSMD9
In the previous study from our lab, we identified peptides with strikingly different affinities to
PSMD9. We tested the ability of the PDZ domain alone to bind to peptides and found that PDZ
domain had low affinity to GRRF (KD 439.3±62.94µM) and high affinity towards SCGF (KD
10.9± 0.99µM) (Figure 4.1). More interestingly, the affinities of PDZ domain and PSMD9
were very similar, thus indicating that PDZ domain alone accounts for the entire C-terminal
peptide binding potential of PSMD9.
Figure 4.1. Comparison of binding affinities of PSMD9 and PDZ domain to C-terminal
peptides. Protein-peptide binding ELISA showing binding affinities of (A) GRRF and (B)
SCGF to PSMD9 (red) and PDZ domain (blue). Data was collected from sample run in
duplicates and is represented as mean ± SEM (n=2). The data was fitted to one-site specific
binding model in GraphPad Prism software.
Identification of a superbinder peptide
G R R F
C o n c e n tra t io n o f p e p tid e (µ M )
O.D
. 4
05
nm
0 .1 1 1 0 1 0 0 1 0 0 0
0 .0
0 .5
1 .0
1 .5
P S M D 9
P D Z d o m a in
S C G F
C o n c e n tra t io n o f p e p tid e (µ M )
O.D
. 4
05
nm
0 .1 1 1 0 1 0 0 1 0 0 0
0
1
2
3
P S M D 9
P D Z d o m a in
A B

PDZ domains bind to their client peptide partners in a sequence specific manner and extensive
characterization of binding determinants of PDZ-peptide interactions has established that the
residues at P0 and P-2 position of peptide contribute to the maximal binding energy. Since
SCGF and GRRF both harbour phenylalanine at P0 position, but the residue at P-2 position is
different, we asked if the presence of cysteine in SCGF is responsible for high affinity
interaction, and whether substituting the arginine in position P-2 in GRRF with a cysteine
would change the low binder (GRRF) to a tight binder GCRF. As expected, peptide GCRF
showed a 96-fold higher affinity than GRRF to PDZ domain (Kd of GCRF: 5.66±0.62µM)
(Table 4.1). However, replacing the phenylalanine at P0 of GRRF with cysteine in peptide
(GRRC) resulted in only 10-fold higher affinity as compared to GRRF (Table 4.1). Further,
replacing cysteine with glycine in peptide SCGF to SGGF led to complete loss of peptide
binding (Table 4.1). These results further emphasized the importance of cysteine at position P-
2 in mediating high-affinity interactions of the peptide to the PDZ domain of PSMD9. Thus,
using design based on knowledge, we converted a very weak binding peptide (GRRF) to a
super binder (GCRF), and identified a unique position-specific determinant which is crucial
for mediating high-affinity interactions with PSMD9 PDZ domain.
Peptide Protein KD (µM)+S.E.
GCRF PDZ WT 5.66+0.62
SCGF C216G mutant of PDZ
domain 12.86+0.99
SCGF Thiol modified PDZ
(DTNB) 7.5+0.66
GRRC PDZ WT 71.65+9.05
SCGG PDZ WT 44.03+7.19
SGGF PDZ WT No binding

GCGF PDZ WT 8.89+0.82
Table 4.1. Binding affinities of PDZ domain (wild type, mutant and modified) and peptides.
Values are represented in µM+S.E. Data was computed from one site specific binding model
using GraphPad Prism
Non covalent nature of PDZ-peptide interaction
Since our binding studies indicated that cysteine in the peptide drives high-affinity interaction,
we next investigated if the high affinity of cysteine peptides is due to the possibility of a
disulphide linkage between cysteine in the peptide and PDZ domain. In our model of PDZ
domain, the β5 strand which forms the floor for the peptide interactions harbours a cysteine
(Cys 216). We mutated this lone cysteine in PDZ domain to glycine and found that the
mutation did not alter peptide binding (KD 12.86±0.99µM) (Table 4.1). We also covalently
modified this cysteine with Ellman’s reagent (DTNB) as well as glutathione to prevent
disulphide bond formation. Both cysteine modifications did not affect peptide binding,
indicating that cysteine engages in non-covalent interactions, possibly through the hydrophobic
side chain of cysteine. These studies provide the first line of evidence on possible mode of high
affinity interactions of superbinding peptides to PSMD9 PDZ domain
The ability of superbinder to inhibit protein-protein interaction
The identification of a tight-binding motif prompted us to investigate whether this motif could
inhibit the interaction of PSMD9 with hnRNPA1. Both SCGF and GCRF inhibited PSMD9-
hnRNPA1 and PDZ-hnRNPA1 interaction (figure 4.2). For inhibition of PSMD9-hnRNPA1
interaction, the IC50 values were found to be 3.39 ± 1.16 M for GCRF (Figure 4.2), similar to
SCGF (5.47 ± 1.14 µM) (Sangith, Srinivasaraghavan et al. 2014). Additionally, this motif could
also inhibit PDZ-hnRNPA1 interaction with an IC50 of 6.01 ± 1.17 µM.

Figure 4.2. (A) Inhibition of (A) PSMD9-hnRNPA1 interaction and (B) PDZ-hnRNPA1
interaction by C-terminal peptides SCGF (blue) and GCRF (red). Data was collected from
sample run in duplicates and is represented as mean ± SEM (n=2). The data was fitted to dose
response for inhibition with variable slope (four parameters) in GraphPad Prism software.
P S M D 9 -h n R N P A 1 in h ib it io n
lo g S C G F c o n c e n tra t io n (µ M )
O.D
. 4
50
nm
-4 -2 0 2 4
0 .0
0 .5
1 .0G C R F
S C G F
P D Z -h n R N P A 1 in h ib it io n
lo g p e p tid e c o n c e n tra tio n (µ M )
O.D
. 4
50
nm
-4 -2 0 2 4
0 .0
0 .5
1 .0S C G F
G C R F
Peptide PSMD9-hnRNPA1 PDZ-hnRNPA1
GCRF 3.39 ± 1.16 6.01 ± 1.17
SCGF 5.47 ± 1.14 6.920 ± 1.27
A
B

Docking and molecular dynamic simulations
The ability of a tight binding tetrapeptide motif to inhibit protein-protein interaction indicates
that this motif could be utilized as a scaffold for development of specific inhibitors of PSMD9
PDZ domain. Further development of inhibitor design demands in-depth investigation of the
per residue contribution towards binding. In the absence of crystal of NMR solution structures
of PSMD9 PDZ domain, we collaborated with Dr. Chandra Verma, A*STAR institute,
Singapore, to understand the structural basis for the huge affinity differences between GRRF
and SCGF using extensive computational studies, which would aid in design of peptide-based
or small molecule inhibitors of IκBα degradation and NF-κB signalling by inhibition of PDZ-
peptide interaction. The structural model of PSDM9 PDZ domain was generated using the
PDZ domain of Nas2, the yeast ortholog of PSMD9 as (~42% sequence identity and 64%
sequence similarity) as the template (Singh, Lovell et al. 2014).
Homology model
The structural model of PSMD9 PDZ domain generated by homology modelling formed a
distinct beta sandwich fold consisting of five β sheets and two α helices. A peculiar aspect was
the peptide binding pocket was formed by the β5 instead of the β2 strand (figure 4.3). The
peptide binding site is primarily hydrophobic with the exception of a small positively charged
cluster at one end of the binding pocket.

Figure 4.3. Sequence of the PDZ domain of PSMD9 with secondary structures mapped onto
it. (A) Cartoon representation (B) surface electrostatic representation calculated using APBS
(Baker, Sept et al. 2001), where the blue and red refer to positive and negative potentials
respectively of the structure.
Ligand mapping simulations
All-atom simulations of the PSMD9 PDZ domain revealed that the structure was stable with a
RMSD of ~4.5Å (figure 4.4A). The α2 helix was highly flexible which resulted in deformations
and instabilities in the α/β binding pocket. Since both the α2 helix and β5 strand adopted a
closed conformation, the active site residues on the domain were occluded, which is evident
from the reduced distance between α2 and β5. In order widen the peptide binding pocket for
binding to peptides, the simulations were carried out with benzene molecules added to the
solvent. This is most commonly employed to widen and access closed pockets and is also
known as ligand-mapping simulations. PDZ domain did not unfold due to addition of benzene
molecules, as evinced by the RMSD of PDZ domain conformations during 100ns simulations
(figure 4E). The benzene molecules occupied the hydrophobic peptide-binding groove, which

resulted in widening of the peptide binding groove by 3Ao, thus preventing the structure from
adopting closed conformation.
Figure 4.4. Ligand mapping simulations of apo PDZ domain (A) RMSD (black, red and green
correspond to three triplicates) (RMSD was calculated by superimposing all the residues of
sampled structures on to the starting structure of the simulation). (B) RMSF of the
conformations of the PDZ domain of PSMD9 in its apo state (C) Cartoon representation of
apo-PDZ domain coloured according to the flexibility with blue to red corresponds low to high
flexibility. (D) Distance between the α2 helix and β5 sheet in the binding groove of the

conformations sampled during apo (black) and ligand mapping (red) simulations (E) RMSD of
conformations of apo PDZ domain during benzene mapping simulations.
Docking of tetrapeptides to PDZ domain
Peptides GRRF and SCGF were docked to PDZ domain using blind and rigid docking
programs ATTRACT and Haddock, respectively. Both programs predicted that the peptides
bind at the binding groove between α2 helix and β5 strand. After inspecting the docked poses,
a PDZ-peptide complex which was similar to other complexes harbouring phenylalanine at P0
position (Lee and Zheng 2010) was chosen for detailed analysis. In this conformation, the
peptide bound in an antiparallel fashion to the last β5 strand, extending the beta sheet by an
additional strand, which is observed in majority of PDZ domains. The side chain of P0
phenylalanine is buried in the hydrophobic pocket formed by Pro147, Ala148, Phe162, Ile 176,
Val180, Leu201, Leu203, Gly215 and Cys216. The peptide interacts with the β5 strand through
hydrogen bonds with the backbone or side chains of Gly215, Cys216, Asn217 and Ile218 in
the β5 strand (figure 4.5).

Figure 4.5. Cartoon representation of the PDZ domain of PSMD9 in complex with the (A)
GRRF and (B) SGCF peptide. Important residues in the binding site are shown in stick
representation. The peptide is bound in canonical mode and shown in stick representation
(labelled in red). Hydrogen bonds are highlighted in black dashed lines. (C, D) 2D diagram of
PDZ-peptide (GRRF(C), SCGF(D)) residue contacts calculated using Ligplot (Laskowski and
Swindells 2011).
Molecular dynamic simulations of PDZ-peptide complexes
The PDZ domain and PDZ-peptide complexes were subjected to MD simulations using the
Sander module of the AMBER 16 package in combination with ff14SB force field. The PDZ -
peptide complex remained stable during simulations with an RMSD of 4A as compared to the
docked models (figure 4.6A). The peptides were stabilized by various interactions and showed
reduced flexibility in bound state (figure 4.6B). The C-terminal phenylalanine was buried

deeply in SCGF but partially buried in GRRF. The peptides interacted though hydrogen bonds
with main chain/side chain of Gly215, Cys216, Asn217 and Ile218 of the β5 strand and Gln181
from the α2-helix of PDZ domain (figure 4.6F). In SCGF, the side chain of the P-2 cysteine
remains buried in the hydrophobic pocket formed by Ile159, Phe162, Leu173, Ile176 and
Ile218 (figure 4.6G). However, in GRRF, the positively side-chain does not occupy the binding
pocket, but is exposed to the solvent and interacts with the α2-helix. The longer side chain of
P0-2 arginine prevents P0 phenylalanine from burying deeply in the hydrophobic pocket, which
could readily explain the low affinity of GRRF peptide as compared to SCGF. Thus, SCGF is
held tightly due to the contribution of P0 phenylalanine and P-2 cysteine, while the same is not
possible in GRRF due to the tendency of P-2 arginine to remain exposed to the solvent. The
differential affinities were also evident in the extent and number of interactions in the PDZ-
peptide complexes. In The PDZ-SCGF complex, the peptide backbone is involved in five
hydrogen bond interactions, and three of these hydrogen bonds (N217-C2, C216-F0, G215-F0)
are preserved for >90% of the simulation time, and other two (I218-S3, Q181-F0) are preserved
for ~50% of the simulation time. However, in the PDZ-GRRF complex, only three hydrogen
bond interactions (I218-R2, I218-G3, C216-F0) with the backbone were observed, out of which
only one interaction (I218-R2) was preserved for 75% of the simulation time, while the other
two were less stable and present only of 40% of the simulation time. Thus, MD simulations
provided plausible explanations for differential affinities of SCGF and GRRF peptides, and the
crucial role of P-2 cysteine in PDZ-peptide interaction

Figure 4.6. Simulations of PDZ-GRRF and PDZ-SCGF complexes. RMSD (RMSD
calculated by superimposing all the residues of the sampled structures onto the starting
structure of the simulation) of (A) the peptide-bound PDZ domain and (B) the bound peptide.
(C) Root-mean-square fluctuation of the conformations of GRRF (black) and SCGF (red)
peptides in complex with PDZ, from the corresponding complex simulations. (D) Calculated
F G
GRRF SCGF

MMPBSA binding free energies (ΔGbind) for PDZ−GRRF (black) and PDZ−SCGF (red)
complexes. (E) Decomposition of the binding free energy on a per-residue basis for all four
residues in the GRRF (black) and SCGF (red) peptides from the corresponding complex
simulations. Ligplot analysis of (F) GRRF and (G) SCGF) in PDZ domain binding groovw
Determination of binding energies of PDZ-peptide complexes
The energetic parameters of PDZ-peptide interaction were analysed to better understand the
contribution of individual residues in binding energy. The interaction energies of the peptides
with PDZ domain were favourable (ΔG between -17.5 kcal/mol to -27.2 kcal/mol). The SCGF
peptide exhibited favourable binding energy (ΔG -27.2 kcal/mol) as compared to GRRF (ΔG -
17.5 kcal/mol).
Deciphering contribution of C-terminal hydrophobicity of peptide in binding
In majority of PDZ-peptide complexes studied, the c-terminal tetrapeptide motif of the
interacting partner is involved in direct binding with the binding pocket of the PDZ domain. In
PSMD9 PDZ domain, the overall PDZ fold adopted is different from conventional PDZ
domains due to the cyclic permutation in beta sheet arrangement. In order to study the effect
of the altered arrangement of PDZ domain on the affinity determinants, specifically the P0
hydrophobic residues, PDZ-peptide complexes were analysed by simulations. Variants of
GRRF and SCGF peptides were analysed for binding and stability during the course of
simulations. The peptide variants of GRRF harbouring hydrophobic residue at C-terminus,
namely, GRRL, GRRI and GRRC all remained bound to PDZ with an RMSD of <4o, with the
C-terminal region of peptide showing reduced flexibility as compared to the N-terminal region
(figure 4.7A). The peptides were stabilized by peptide-protein backbone interactions (I218-G3,
C216-I0/C0/C0, I218-R2), which were retained for 75% of the simulation time. Similar to our
previous observations, when the side chain of the C-terminal residue was removed, as in the

case of GRRG, the peptide dissociated from the binding pocket within 5-10ns of simulations
(figure 4.7E). This unstable binding of peptide is also recapitulated in our binding experiments,
where, mutant peptide GRRG is unable to inhibit PSMD9-hnRNPA1 interaction. However, the
SCGG peptide remained stably bound in the binding pocket with an RMSD of 3Ao during
simulations (figure 4.7F). The SCGG peptide interacted with the B5 strand of PDZ domain
mainly through backbone interactions (N217-C2, C216-G0, G215-G0, I218-S3, Q181-G0), but
the C-terminus showed increased flexibility as compared to N-terminus, which could be
attributed to the presence of two glycine residues at C-terminus in SCGG. The stable binding
of SCGG was also evident by the high affinity of SCGG peptide in binding experiments, where
affinity of SCGG is ≈44µM (Table 1)

Figure 4.7. Deciphering contribution of C-terminal hydrophobicity in binding. RMSD (RMSD
was calculated by superimposing all the residues of sampled structures onto the starting
structure of the simulation) of the bound peptide (A) RMSF (C) of the conformations of GRRL
(black) GRRI (red) GRRC (green) and SCGG (blue) peptides in complex with PDZ, from its
corresponding complex simulations. (B) Calculated MMPBSA binding free energies (ΔGbind)
for PDZ-peptide complexes (D) Decomposition of binding free energy on per residue basis for
all the four residues in the GRRL (black) GRRI (red) GRRC (green) and SCGG (blue) peptides
from the corresponding complex simulations. (E) Distance between binding pocket and
peptides GRRF (black) and GRRG (red) (F) RMSD of conformations of peptide in PDZ-SCGF
(black) and PDZ-SGGF (red) complexes.
Deciphering contribution of P-2 cysteine of peptide in binding
The previous studies revealed importance of P0 residue in binding and stability of peptides to
the PDZ domain. Since cysteine in the peptides was found to impart significant contribution to
the binding energy, the contribution of cysteine at P-2 position was investigated using MD
E
F

simulations. Our experimental data suggested that removal of cysteine in SCGF peptide i.e.,
SGGF, abrogated binding and concomitantly, this peptide was less stable during simulations.
However, SGGF peptide did not unbind completely form the binding pocket like GRRG, but
only the P0 phenylalanine was buried in the hydrophobic pocket and the rest of the peptide
moved away from the binding site. MD simulations also showed that cysteine at P-2 position
contributes favourable to binding energy (ΔG ≤ -3.0kcal/mol; (figure 4.7), while presence of
an arginine at P-2 position has unfavourable influence on occupancy of P0 phenylalanine.
These results provide conclusive explanation for high affinity of GCRF peptide, which was
evident by dramatic increase in affinity (from 439 µM to 5.6 µM) upon mutating the arginine
to cysteine in GRRF leads to 96-fold increase in affinity. MD simulations of GCRF peptide
showed that both P0 phenylalanine and P-2 cysteine remain deeply buried in the hydrophobic
pocket and the peptide was stabilized by hydrogen bonds with the backbone of peptide and β5
strand (C216-F0, I218-C2, I218-S3; stable for ~90% of the simulation time). The energetic
calculations also reveal tighter binding of GCRF peptide; the ΔG of GCRF is -26.8 kcal/mol
(Figure 8B), similar to that of SCGF (ΔG of -27.2 kcal/mol) (Figure 6D) but higher than GRRF
(ΔG of -17.5 kcal/mol) (Figure 6D). Extensive analysis of PDZ-peptide complexes in these
studies revealed that both serine and glycine at P-3 position in peptide do not contribute
significantly towards binding energy. For instance, ΔG for glycine (peptide GCGF) at P-3 is
around +1.5kcal/mol (Figure 8D) and serine at P-3 (peptides SCGF, SCGG) is around -
1.5kcal/mol (Figure 6E, 7D), which are within the range of error or measurements. Our binding
experiments were in accordance with the above results, and it was seen that GCGF and SCGF
bound to PDZ domain with nearly same affinities (KD of GCGF: 8.89±0.82µM; KD of
SCGF:11.06±0.75µM) (Table 1). Thus, our studies highlight the importance of cysteine in
mediating high-affinity interactions in the peptides and also indicate that presence of serine has
in the peptides has little or no effect. In addition, the position of cysteine in the peptides is also

crucial since introducing a cysteine at P0 position led to only 5-fold increase in binding affinity
(Kd of GRRC: 7µM) in comparison to the parent peptide GRRF (Kd of 439µM) (Table1).
Figure 4.8. Deciphering contribution of P-2 cysteine in binding (A) RMSD (RMSD was
calculated by superimposing all the residues of sampled structures onto the starting structure
of the simulation) of bound peptide, RMSF (C) of the conformations of GCRF (black) GCRG
(red) GCGF (green) peptides in complex with PDZ domain from the corresponding complex
simulations. (B) Calculated MMPBSA binding free energies (ΔGbind) for PDZ-peptide
complexes (D) Decomposition of binding free energy on per residue basis for all the four
residues in the GCRF (black) GCRG (red) GCGF (green) peptides from the corresponding
complex simulations
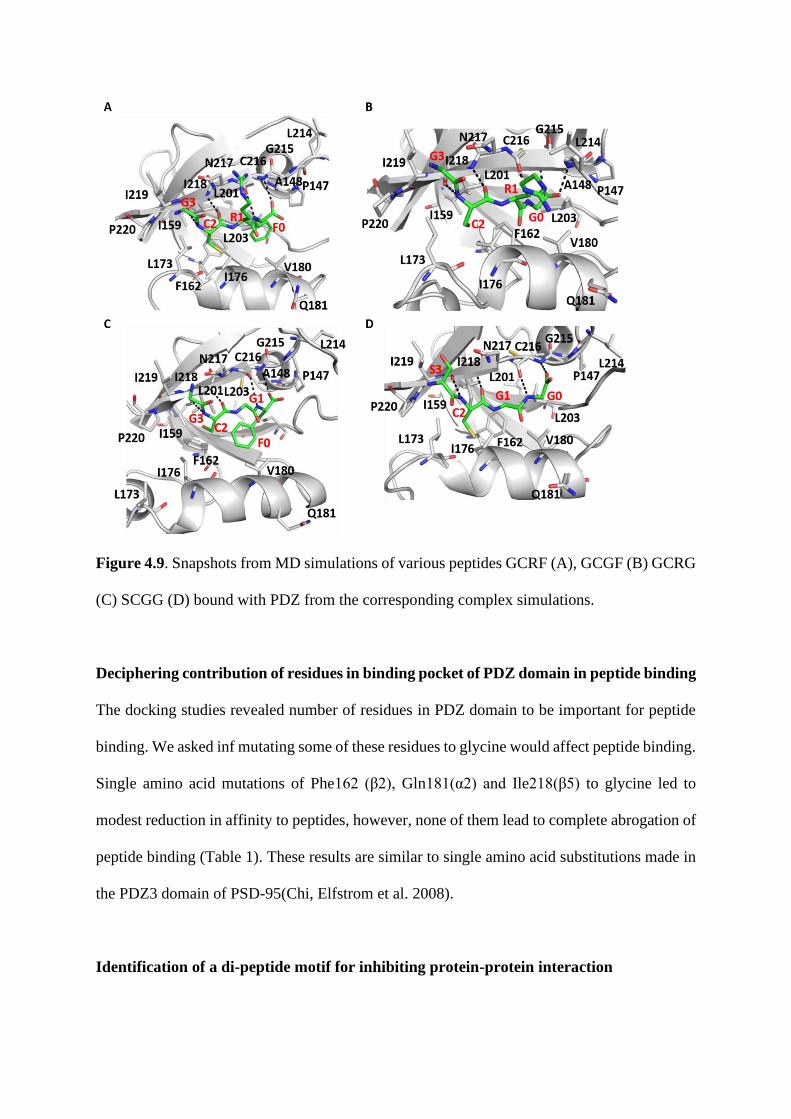
Figure 4.9. Snapshots from MD simulations of various peptides GCRF (A), GCGF (B) GCRG
(C) SCGG (D) bound with PDZ from the corresponding complex simulations.
Deciphering contribution of residues in binding pocket of PDZ domain in peptide binding
The docking studies revealed number of residues in PDZ domain to be important for peptide
binding. We asked inf mutating some of these residues to glycine would affect peptide binding.
Single amino acid mutations of Phe162 (β2), Gln181(α2) and Ile218(β5) to glycine led to
modest reduction in affinity to peptides, however, none of them lead to complete abrogation of
peptide binding (Table 1). These results are similar to single amino acid substitutions made in
the PDZ3 domain of PSD-95(Chi, Elfstrom et al. 2008).
Identification of a di-peptide motif for inhibiting protein-protein interaction

With the identification of a tight binding motif which could also inhibit PSMD9-hnRNPA1
interaction, we wanted to test the minimal determinants of tight binding in peptides, which
would be crucial for peptide or small molecule inhibitor design. We asked if removal of last
two residues would affect peptide binding, and tested binding of two dipeptides SC and GC to
PDZ domain. Surprisingly, both dipeptides showed same affinity for PDZ domain in our
binding experiments. The peptides also inhibited PSMD9-hnRNPA1 and PDZ-hnRNPA1
interaction effectively
Figure 4.10. Inhibition of PSMD9-hnRNPA1 interaction by di-peptides SC (blue) and GC
(red). Data was collected from sample run in duplicates and is represented as mean ± SEM
(n=2). The data was fitted to dose response for inhibition with variable slope (four parameters)
in GraphPad Prism software.
P S M D 9 -h n R N P A 1 in h ib it io n
lo g p e p tid e c o n c e n tra t io n (µ M )
O.D
. 4
50
nm
-1 0 1 2 3 4
0 .0
0 .2
0 .4
0 .6
0 .8
G C
S C
Peptide PSMD9-hnRNPA1
GCRF 3.39 ± 1.16
SCGF 5.47 ± 1.14

Deciphering binding and stability determinants on PDZ domain
Our biochemical and computational analysis of PDZ-peptide interaction led to identification
of positive contributors to binding in the interacting partner peptides. The contribution of core
binding pocket residues was also determined. The PDZ domain of PSMD9 differs in the overall
fold as compared to conventional PDZ domains in terms of its arrangement of beta sheets. The
crystal structure of Nas2 predicted the residues in the β5 strand and the loop preceding the beta
sheet and comprising of the conserved GLLG motif, a variation of the GLGF motif found in
conventional PDZ domains to be a part of the peptide binding pocket. The role of β5 strand in
peptide binding in Nas2 was also reported by Satoh et al, where chemical shifts were observed
in residues close to β5 strand upon addition of c-terminal peptide of Rpt5, the interacting
partner of Nas2. These recent reports highlight the role of residues in the c-terminal region of
PDZ domain of Nas2, which can also be extrapolated to PSMD9 PDZ. However, the role of
the other residues and regions on PDZ in peptide binding and function is still elusive. Previous
studies from our lab predicted the residues in the loop region preceding the PDZ domain of
PSMD9 to be important in binding (Sangith, Srinivasaraghavan et al. 2014). However, with
the new model of PSMD9 PDZ derived from Nas2 PDZ, these residues form a disordered loop
with no described function (Singh, Lovell et al. 2014). To decipher the role of each of these
determinants on the binding, stability and function of PSMD9, we devised a domain
engineering approach, guided by the available modelled structure of PSMD9 PDZ domain,
using a combination of deletion and single amino acid mutants.
To decipher the determinants of peptide binding in PDZ domain, three constructs were
designed; first construct (121-211) lacking the loop and c-terminal beta sheet, which forms the
groove and floor of the peptide binding pocket; second construct 121-196 encompasses the
boundaries of PDZ domain described in HPRD, therefore could indicate the conventional PDZ
domain boundaries similar to other PDZ domains; third construct 134-223, which lacks the N-

terminal loop region preceding PDZ domain, which harbours residues (GLQV motif,) that were
previously described to be important on peptide binding in PDZ domain (Sangith et al).
Figure 4.11. Generation of different PSMD9 PDZ domain constructs (numbers indicate
residue number)
The constructs lacking the c-terminal region of PDZ domain, namely PDZ 121-196 and PDZ
121-211 did not show expression across various bacterial expression hosts at different
temperatures and concentrations of IPTG in soluble fraction as well as inclusion bodies. In
contrast, the 134-223 construct showed expression in soluble fraction and could be purified to
homogeneity.
Figure 4.12. Purified PDZ 134-223 protein resolved on 15% SDS-PAGE

Binding of PDZ134-223 to C-terminal peptides SCGF and GRRF
The ability of the N-terminal deletion construct PDZ 134-223 to bind to c-terminal peptides
SCGF was tested by protein peptide ELISA. PDZ 134-223 bound to SCGF, however, the
affinity of PDZ 134-223 was 4-fold lower than affinity of wild type PDZ to SCGF.
Figure 4.13. Binding affinities of PDZ 134-223 to C-terminal peptide SCGF. Data was
collected from sample run in duplicates and is represented as mean ± SEM (n=2). The data was
fitted to one-site specific binding model in GraphPad Prism software.
Role of residues forming binding pocket
Our previous studies identified residues in PDZ domain which lie outside the binding pocket
but make extended contacts with the peptide. We generated mutations in residues in the binding
pocket (C216G, I218G) and outside the binding pocket (F162G, Q181G) to decipher the
contribution of individual residues in peptide binding. Interestingly, while C216G mutation did
not have any effect on peptide binding, the other three mutations led to modest reduction in
peptide binding of around one-fold (Table 4.1).
S C G F
C o n c e n tra t io n o f p e p tid e (µ M )
O.D
. 4
05
nm
0 .1 1 1 0 1 0 0 1 0 0 0
0
1
2
3
4
P D Z 1 3 4 -2 2 3
P D Z W T

Contribution of residues in the β5 strand towards stability of PDZ domain:
Our studies indicated that deletion of the last β5 strand had a drastic effect on the stability of
the protein and the PDZ domain failed to express. To further assess the detailed contribution
of residues in the β5 sheet, we mutated Ile218 in the last β5. Secondary structure analysis by
CD showed that I218G had reduced structure as compared to wild type PDZ domain. The
fluorescence spectrum of I218G also showed lower tryptophan emission intensity as compared
to wild type PDZ, indicating that this mutation led to structural perturbation in the PDZ domain,
leading to change in local environment of the only tryptophan at position 208 which lies close
to Ile218. Surprisingly, this residue is also important in peptide binding as I218G mutant shows
modest reduction in affinity. Mutation of other residues in the binding pocket i.e., F162G and
Q181G affected peptide binding, but did not perturb the structure of PDZ domain.
Figure 4.14. (A) CD spectra of wild type PDZ domain and mutants. (B) Fluorescence emission
spectra of wild type PDZ domain and mutants. Data is represented as a mean of three
acquisitions.
These studies, define a role for the loop region in modulating affinity of PDZ domain, either
by imparting structure or stability to the domain. The inability of the C-terminal deleted
constructs of PDZ domain to express, combined with the structural characterization of binding
-6000
-4000
-2000
0
2000
4000
6000
200 210 220 230 240 250 260 270
I218G
PDZ WT
Q181G
Mean
Resid
ue M
ola
r E
llipticity
Wavelength (nm)
0
1 106
2 106
3 106
4 106
5 106
6 106
320 340 360 380 400 420 440
PDZ WTPDZ F162G
PDZ Q181G
PDZ I218G
Flu
ore
sce
nce
un
its
Wavelength (nm)
B
A

pocket mutants reveals the importance of β5 strand in maintenance of the structural integrity
of PDZ domain.

Chapter 5:
Crystallization of PDZ domain

Introduction:
The full length PSMD9 protein has been resistant to crystallization so far. Previous attempts to
crystallize PSMD9 has met with limited success. The crystal structures of the N-domain and
PDZ domain of Nas2, the yeast ortholog of PSMD9 has yielded valuable structural information
on the probable structural architecture of PSMD9. However, PSMD9 and Nas2 differ
significantly in their sequence, therefore, even if overall fold can be assumed to be similar,
there may be subtle differences in the structure, which can be understood only by exploring or
solving the structure of PSMD9. Since crystallization of full-length PSMD9 met with limited
success previously in the lab, we decided to crystallize individual domains of PSMD9.
Individual domains may have more stability and could be amenable to crystallization. In the
full-length protein, the 30 amino acid-long linker sequence connecting the N-domain and PDZ
domain is flexible and may hinder crystal packing of PSMD9. Therefore, crystallization of
individual domains may be more suitable for crystallization. We set up crystallization trials for
the individual domains of PSMD9 and identified a few hits which looked promising for further
optimization.
Results:
Screening for crystallization conditions for PDZ domain
PDZ domain was purified to a concentration of 10 mg/ml and crystallization trials were set
with the help of crystallization robot in BARC (courtesy Dr. Gagan Deep Gupta). The initial
crystallization yielded small but well-shaped crystals in few screening conditions.

Figure 5.1. Crystallization hits for PDZ domain from initial screen
Optimization of initial crystallization conditions
The hits from the initial crystal screen were optimized for protein concentration, PEG
concentration and PEG strength. The optimization yielded small plates and cluster of crystals
which need to be further optimized.

Figure 5.2. Hits obtained after optimization of crystallization conditions for PDZ domain of
PSMD9
These results indicate promising crystallization conditions of the PSMD9 PDZ domain
which, if optimized can yield big and well-shaped crystals suitable for diffraction studies.

Chapter 6:
Conclusion and significance of the study

Protein-protein interactions play crucial role in maintenance of cellular homeostasis. These
interactions are primarily mediated by specialized and conserved domains in proteins, which
recognize and bind to specialized binding interfaces, often called as motifs. Any perturbation
in protein interaction network can have deleterious consequences to the cell or organism. While
structural and biophysical studies have identified the molecular basis of many domain-motif
interactions, these interactions are poorly understood in proteins with no crystal or solution
structure. In the current study, we chose to investigate the primary mediators of domain-motif
interaction in the atypical PDZ domain of PSMD9, using a combination of extensive
biochemical and computational approaches. Our studies led to the identification of a
superbinder peptide, which was capable of inhibiting PSMD9-hnRNPA1 interaction. This
signature motif could be utilized as a scaffold for designing small-molecule inhibitors to block
PSMD9 mediated NF-κB activation in cancers.
Computational approaches including molecular dynamic simulations and docking studies aided
in understanding the finer details and the molecular basis for the huge affinity differences
between high-affinity and low-affinity peptides, which informed us about how the preference
and position of cysteine in the peptide would lead to tight binding with the PDZ domain. It also
gave us information on per-residue contribution of the peptide towards binding energy, which
would be of great importance in inhibitor design to block NF-κB signalling. While PDZ-
peptide interaction is crucial for PSMD9-hnRNPA1 interaction, the vast differences in affinity
of C-terminal peptide of hnRNPA1 vis-à-vis full-length hnRNPA1 protein towards PSMD9
could only be understood by looking at the role of secondary binding sites in mediating the
interaction. Taking cue from parallel studies on the yeast ortholog Nas2, we decided to look
into the role of the uncharacterized N-terminal domain of PSMD9 in mediating interaction with
hnRNPA1. The domain boundaries of N domain of PSMD9 were identified, cloned, expressed
and purified as recombinant soluble proteins in bacteria. Analysis of the secondary structure of

N domain with PSMD9 indicated that it contributed to most of the structure in PSMD9 and
both showed nearly similar Tm during thermal denaturation. Our studies revealed a very
interesting structural property of N domain and PSMD9 to refold after thermal or chemical
denaturation, which highlights the role of N domain in the stability and structure of PSMD9.
The difference in the secondary structure of PSMD9 and the additive spectrum of domains
could indicate of conformational changes or structural rearrangements occurring when both
domains are a part of PSMD9. Interaction of N domain and PDZ domain with hnNRPA1
revealed a distinct role of domains in binding. While N-domain had high affinity but lower
occupancy, PDZ domain was a low binder in isolation, thus inferring that presence of both
domains in PSMD9 is essential for its binding functions. The lower binding potential of the
domains was also reflected in ex vivo immunoprecipitation studies in mammalian cell lines. In
addition, both domains were also unable to activate NF-κB in cells. Further kinetic analysis of
PSMD9-hnRNPA1 interaction by SPR revealed that the interaction was bi-phasic in nature and
indicated conformational changes during binding, as indicated by the two-state fit model.
Taken together, we propose a two-state model for binding and conformational changes, where
PDZ in isolation lacks the native fold and N domain in isolation lacks the interactions which
maximize hnRNPA1 binding. When both domains are present as a part of the full-length
protein, N domain drives the native fold of PDZ domain, while the PDZ domain reinforces the
interactions of N-domain with hnRNPA1, thereby leading to optimal interaction and hence
function of PSMD9. In summary, these studies established structure-function correlation and
potential role of inter-domain communication in driving the structure, stability and functions
of PSMD9, which could be crucial in understanding its biology in normal and diseased
conditions. Given the role of N-domain in binding to hnRNPA1, it will be interesting to
decipher the molecular details of tri-partite interaction between proteasome-bound PSMD9,
hnRNPA1 and proteasomal ATPase/other subunits. One of the major outcomes of this work is

the identification of a short sequence motif, which can be improvised for designing inhibitors
for IκBα degradation and therefore NF-κB activation in cancers. Such inhibitors are likely to
help in future drug development to overcome resistance in cancers that are dependent on
PSMD9 for stress induced NF-κB activation.
Figure 6.1. Model for concerted action of N-domain and PDZ domain in regulating binding
functions of PSMD9


List of figures
Sr.
no.
Fig.
no. Title
Page
no.
1 1.1 Structural architecture of proteasome 33
2 1.2 Cryo-EM reconstruction image of proteasome 36
3 1.3 Schematic representation of substrate degradation by
proteasome 39
4 1.4 Assembly process of the 20S proteasome 42
5 1.5 Schematic representation of the assembly process of the
19S proteasome 45
6 1.6 Cartoon representation of the third PDZ domain of PSD-95
in complex with peptide typical PDZ domain 53
7 2.1 DLS experimental setup 99
8 2.2 Crystallization plate setup for Mosquito™ crystallization
robot 100
2.3 Experimental setup and output of microscale
thermophoresis 104
7 3.1 Homology model of PSMD9 111
8 3.2 Cartoon representation of modelled structures of PSMD9,
N-domain and PDZ domain using Pymol 112
9 3.3 Expression of N-domain and PDZ domain in bacterial
expression system 113
10 3.4 Purification of N-domain 113
11 3.5 Purification of PDZ domain 114
12 3.6 Far UV CD spectra of N-domain and PDZ domain 116
13 3.7 Comparison of CD spectrum 117
14 3.8 Thermal denaturation and refolding of PSMD9 assessed by
CD spectroscopy 119
15 3.9 Thermal denaturation and refolding of N-domain assessed
by CD spectroscopy 120
16 3.10 Thermal denaturation of PDZ domain assessed by CD
spectroscopy 121

17 3.11 Urea denaturation and refolding of PSMD9 123
18 3.12 GuHCl denaturation and refolding of PSMD9 124
19 3.13 GuHCl denaturation and refolding of N-domain 125
20 3.14 Refolding of PSMD9 from urea and GuHCl denaturation 126
21 3.15 Refolding of N-domain from urea and GuHCl denaturation 126
22 3.16 Binding of N-domain to C-terminal peptides 128
23 3.17 ELISA for binding of PSMD9, N-domain and PDZ domain
to hnRNPA1 129
24 3.18 MST for binding of PSMD9, N-domain and PDZ domain
to hnRNPA1 130
25 3.19 Kinetics of PSMD9-hnRNPA1 interaction studied by SPR 132
26 3.20 Immunoprecipitation of purified recombinant proteins
PSMD9 and PDZ domain with hnRNPA1 133
27 3.21
Immunoprecipitation of FLAG-tagged PSMD9, N-domain
and PDZ domain with endogenous hnRNPA1 in HEK293
cells
134
28 3.22 Binding ability of denatured and refolded PSMD9 to
hnRNPA1 135
29 3.23 Binding ability of denatured and refolded N-domain to
hnRNPA1 135
30 3.24 Binding ability of denatured and refolded PSMD9 to
peptide SCGF 136
31 3.25 Luciferase assay for NF-κB activation 138
32 3.26 Interaction of PSMD9 and PDZ domain with C-terminal
peptides of proteasomal ATPases 139
33 3.27 Immunoprecipitation of FLAG-PSMCs with endogenous
PSMD9 in HEK293 probed with anti-PSMD9 antibody 140
34 4.1 Comparison of binding affinities of PSMD9 and PDZ
domain to C-terminal peptides 150
35 4.2 Inhibition of PSMD9-hnRNPA1 interaction and PDZ-
hnRNPA1 interaction by C-terminal peptides 153
36 4.3 Sequence of the PDZ domain of PSMD9 with secondary
structures mapped onto it 155

37 4.4 Ligand mapping simulations of apo PDZ domain 156
38 4.5 Cartoon representation of the PDZ domain of PSMD9 in
complex with C-terminal peptides 158
39 4.6 Simulations of PDZ-GRRF and PDZ-SCGF complexes. 160
40 4.7 Deciphering contribution of C-terminal hydrophobicity in
binding 163
41 4.8 Deciphering contribution of P-2 cysteine in binding 166
42 4.9 Snapshots from MD simulations of various peptides 167
43 4.10 Inhibition of PSMD9-hnRNPA1 interaction by di-peptides 168
44 4.11 Generation of different PSMD9 PDZ domain constructs 170
45 4.12 Purified PDZ 134-223 protein resolved on 15% SDS-
PAGE 171
46 4.13 Binding affinities of PDZ 134-223 to C-terminal peptide
SCGF. 172
47 4.14 CD and fluorescence spectra of wild type and mutants of
PDZ domain 173
48 5.1 Crystallization hits for PDZ domain from initial screen 176
49 5.2 Hits obtained after optimization of crystallization
conditions for PDZ domain of PSMD9 177
50 6.1 Model for concerted action of N-domain and PDZ domain
in regulating binding functions of PSMD9 182
List of tables
Sr.no. Table
no. Title
Page
no.
1 2.1 List of primers for cloning and site-directed
mutagenesis 80

2 3.1 Calculation of percent helicity of N-domain at three
different concentrations 117
3 3.2 Binding affinities of PSMD9, N-domain and PDZ
domain to hnRNPA1 computed from ELISA. 129
4 3.3 Binding affinities of PSMD9, N-domain and PDZ
domain to hnRNPA1 computed from MST experiments 130
5 3.4 Kinetic parameters of PSMD9-hnRNPA1 interaction. 132
6 3.5 Binding affinities of refolded PSMD9 to hnRNPA1
tested by ELISA 135
7 3.6 Binding affinities of refolded N-domain to hnRNPA1
tested by ELISA 136
8 3.7 Binding of refolded PSMD9 to peptide SCGF 136
9 3.8 Binding affinities of PSMD9 to C-terminal peptides of
proteasomal ATPases 139
10 4.1 Binding affinities of PDZ domain (wild type, mutant
and modified) and peptides 151
Top Related