


Languages
Pages
Legal


GLOBAL MARKET FORECAST
April 2014
Presentation by:
DAVID PREVOR
HEAD OF MARKET RESEARCH AND FORECASTS

© AIRBUS S.A.S. All rights reserved. Confidential and proprietary document.
Global Market Forecast 2013: Highlights
Market value of $4.4 trillion
Passenger aircraft ≥100 seats, Freight aircraft ≥10t
Source: Airbus GMF
GMF 2013 key numbers and 20-year change
World Fleet Forecast
RPK (trillions)
Total New Aircraft Deliveries 29,226
2012
5.5
2032
13.9
New passenger aircraft deliveries 28,355
New freighter aircraft deliveries 871
% Change
151%
Passenger aircraft fleet 16,094 33,651 109%
Dedicated freighters 1,645 2,905 77%

© AIRBUS S.A.S. All rights reserved. Confidential and proprietary document.
Airbus Global Market Forecast
Airlines • Business Models • Operations • Competition • Geopolitics
Trends Analysis • Consumer & Travel
Surveys • Tourism • Migration • Traffic flows • Passenger demands
Governments & Regulators
• Liberalization/ deregulation
• Investments and constraints
• Geopolitics
Market Research
Network Development
• Route planning • Origin and
destination demand • Population centers
Traffic • Economics and
Econometrics • Fuel costs • Yields • Load Factors • Trade and Value of
Goods
Fleet trends • Aircraft economics • Utilization • Fleet age and
retirements
Forecast
A 20 year aircraft demand and passenger traffic forecast
© AIRBUS S.A.S. All rights reserved. Confidential and proprietary document.
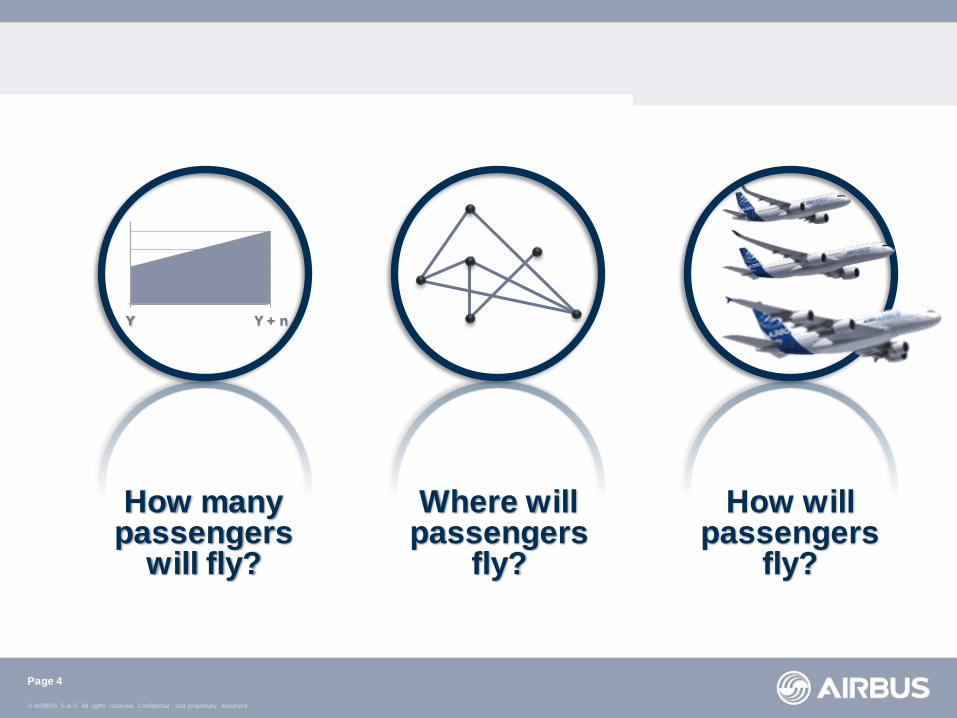
How many passengers
will fly?
Where will passengers
fly?
How will passengers
fly?
0
Y Y + n
Page 4
© AIRBUS S.A.S. All rights reserved. Confidential and proprietary document.
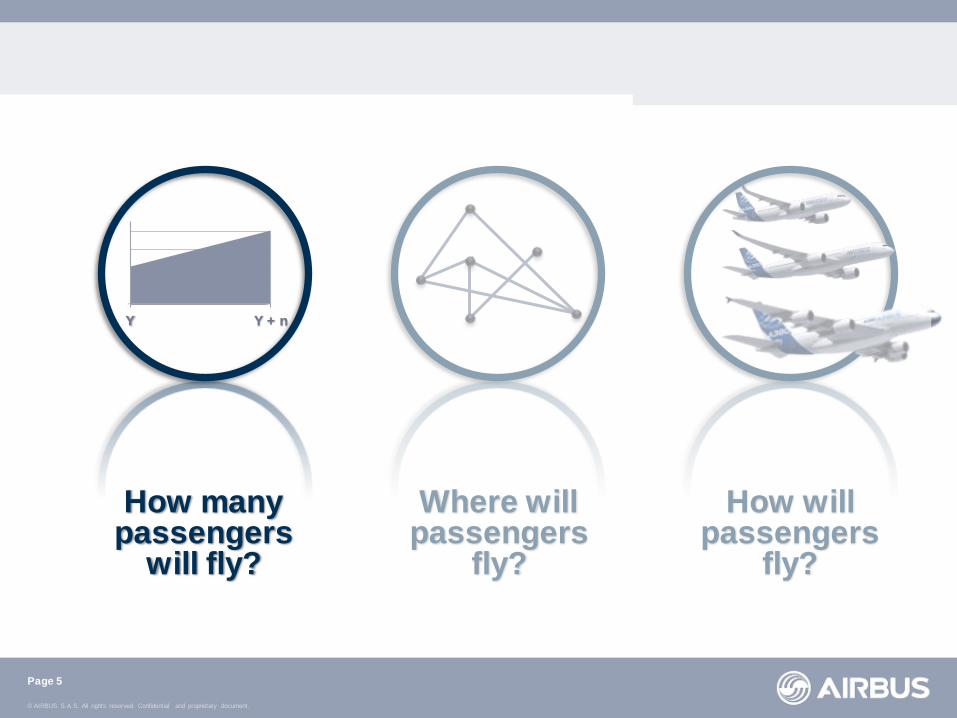
How many passengers
will fly?
Where will passengers
fly?
How will passengers
fly?
0
Y Y + n
Page 5

© AIRBUS S.A.S. All rights reserved. Confidential and proprietary document.
-4%
-2%
0%
2%
4%
6%
8%
J M M J S N J M M J S N J M M J S N J M M J S N J M M J S N J M M J S N J M M J S N
Passenger traffic is outperforming GDP growth
Percent growth (year-over-year)
2008 2009 2010 2011 2012 2013 2014
World real GDP and passenger traffic
-4%
-2%
0%
2%
4%
6%
8%
Q1 Q2 Q3 Q4 Q1 Q2 Q3 Q4 Q1 Q2 Q3 Q4 Q1 Q2 Q3 Q4 Q1 Q2 Q3 Q4 Q1 Q2 Q3 Q4 Q1 Q2 Q3 Q4
World real GDP
World passenger traffic (ASKs)
+6.4%
March 2014 Passenger Traffic
Source: IHS Global Insight, OAG, Airbus
April 14 Airbus Global Market Forecast 2013 - Presentation to ALC
© AIRBUS S.A.S. All rights reserved. Confidential and proprietary document.
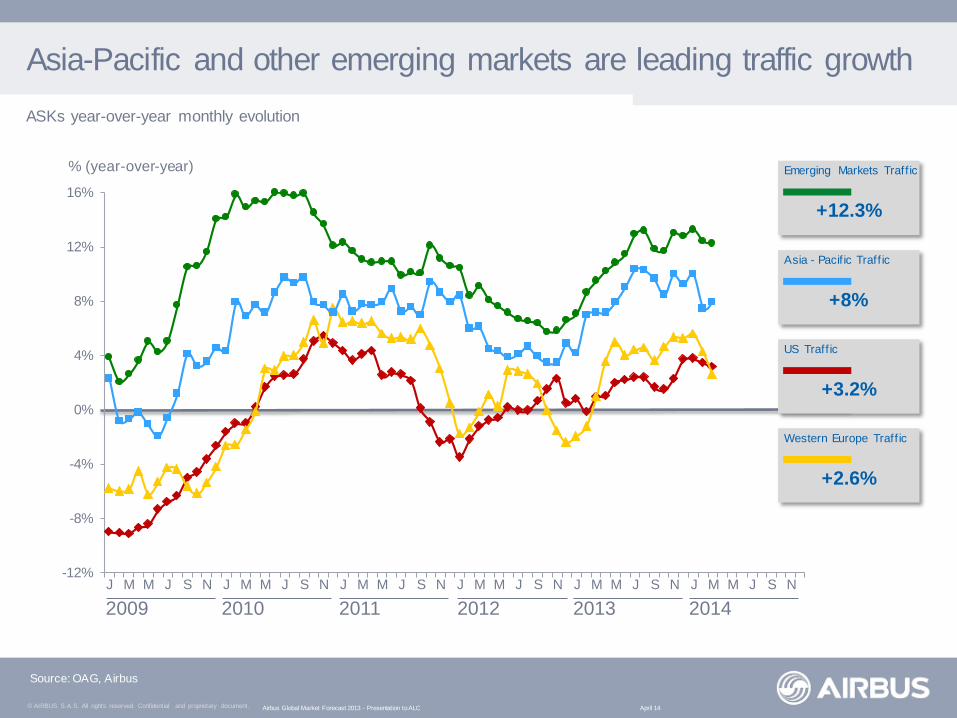
Asia-Pacific and other emerging markets are leading traffic growth
+8%
Asia - Pacif ic Traff ic
+2.6%
Western Europe Traff ic
+3.2%
US Traff ic
% (year-over-year)
+12.3%
Emerging Markets Traff ic
ASKs year-over-year monthly evolution
2009 2010 2011 2012 2013 2014
-12%
-8%
-4%
0%
4%
8%
12%
16%
J M M J S N J M M J S N J M M J S N J M M J S N J M M J S N J M M J S N
Source: OAG, Airbus
April 14 Airbus Global Market Forecast 2013 - Presentation to ALC

© AIRBUS S.A.S. All rights reserved. Confidential and proprietary document.
Diverse emerging economies globally distributed
Source: IHS Global Insight, Airbus
Africa 11 emerging economies 430 million people (2012)
Latin America 11 emerging economies 500 million people (2012)
Europe-CIS 14 emerging economies 380 million people (2012)
Middle East 8 emerging economies 60 million people (2012) Asia-Pacific
10 emerging economies 3,500 million people (2012)

© AIRBUS S.A.S. All rights reserved. Confidential and proprietary document.
Air travel has proved to be resilient to external shocks
Source: ICAO, Airbus
World annual traffic (RPKs - trillions)
0.0
1.0
2.0
3.0
4.0
5.0
6.0
1963 1968 1973 1978 1983 1988 1993 1998 2003 2008 2013
Gulf Crisis Oil Crisis Asian Crisis
WTC Attack Oil Crisis SARS
Financial Crisis
73% growth through multiple crises over the last ten years
73%
© AIRBUS S.A.S. All rights reserved. Confidential and proprietary document.
0.001
0.01
0.1
1
10
0 20,000 40,000 60,000 80,000 100,000 120,000
Trips* per capita - 2012
2012 GDP per capita ($US)
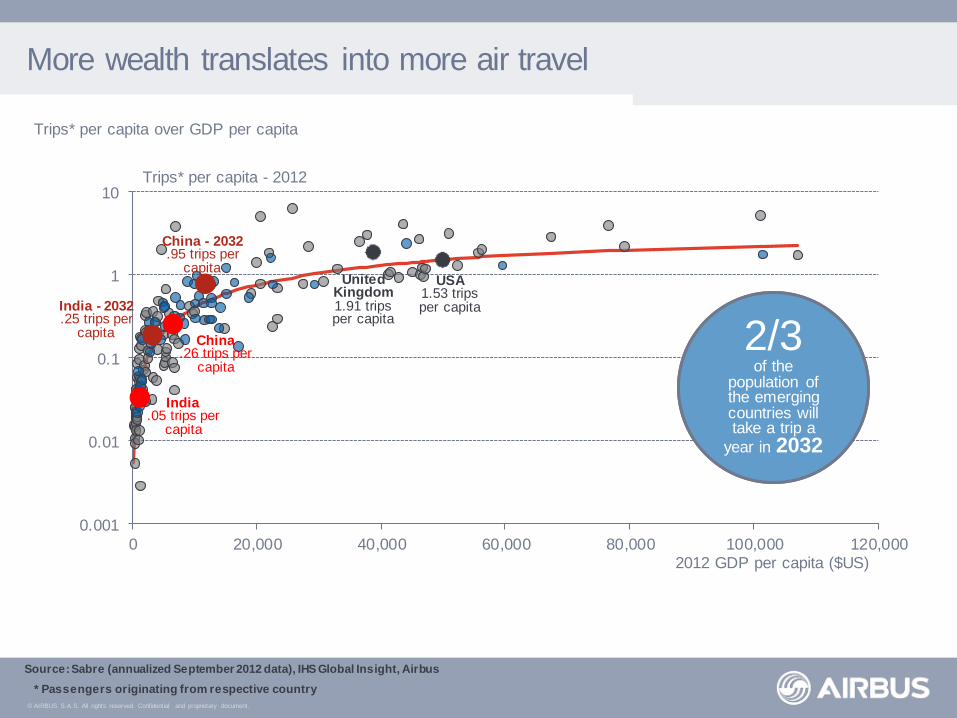
More wealth translates into more air travel
Source: Sabre (annualized September 2012 data), IHS Global Insight, Airbus
* Passengers originating from respective country
1/5
of the population of the emerging
countries took a
trip in 2012
2/3 of the
population of the emerging countries will take a trip a
year in 2032
Trips* per capita over GDP per capita
India .05 trips per
capita
China .26 trips per
capita
USA 1.53 trips per capita
United Kingdom 1.91 trips per capita
India - 2032 .25 trips per
capita
China - 2032 .95 trips per
capita
© AIRBUS S.A.S. All rights reserved. Confidential and proprietary document.
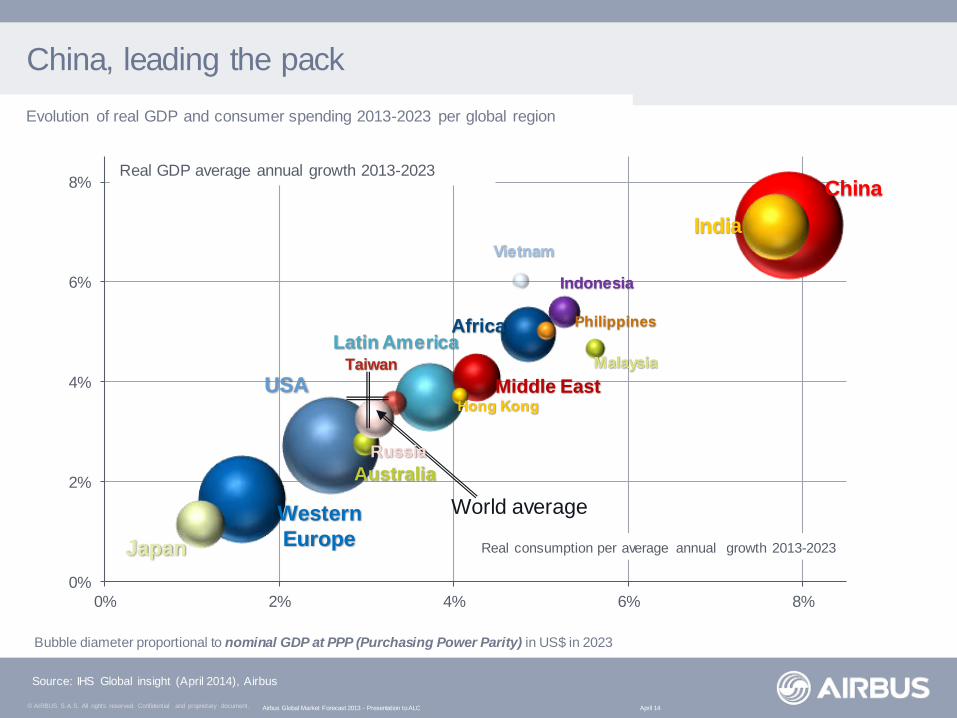
0%
2%
4%
6%
8%
0% 2% 4% 6% 8%
Real GDP average annual growth 2013-2023
Real consumption per average annual growth 2013-2023
Western
Europe
USA
Latin America Africa
India
China
World average
China, leading the pack
Bubble diameter proportional to nominal GDP at PPP (Purchasing Power Parity) in US$ in 2023
Vietnam
Indonesia
Philippines
Malaysia
Middle East
Japan
Australia
Hong Kong
Source: IHS Global insight (April 2014), Airbus
Taiwan
Russia
Evolution of real GDP and consumer spending 2013-2023 per global region
April 14 Airbus Global Market Forecast 2013 - Presentation to ALC

© AIRBUS S.A.S. All rights reserved. Confidential and proprietary document.
Global Middle Class to more than double
675 698 675
265 262 253
856
2,038
3,526
432
578
757
0
1,000
2,000
3,000
4,000
5,000
2012 2022 2032
Other Asia-Pacific North America Europe & CIS
3,576
2,228
5,211 x2.4
x4.1
World Population
% of world population
8,400 7,800 7,100
62% 46% 32%
Airbus Market Forecast for PIMS
Global Middle Class*(millions of people) Source: Kharas and Gertz, Airbus
*Households with daily expenditures between $10 and $100 per person (at PPP)

© AIRBUS S.A.S. All rights reserved. Confidential and proprietary document.
Traffic forecasting process: Dividing global air traffic into regional traffic flows
Page 13
Σ200 global traffic flows*
Selection of GMF traffic flows (200 in total)
Accuracy vs. validity: As many aggregations as possible, as many exceptions as necessary
W . Europe <> CIS Domestic CIS
W . Europe <> Middle East
W . Europe <> South Africa
Domestic South Africa
W . Europe <> S. America
Domestic South America
Domestic W . Europe
Domestic Brazil
S. America <> USA
W . Europe <> USA Domestic
USA
N. Africa <> USA
Domestic C. America
Domestic North Africa
Domestic W . Europe
W . Europe <> C. America
Europe <> N. Africa
Domestic Japan
Japan <> W . Europe
Domestic PRC
Domestic India
Middle East <> N. Africa
Domestic North Africa
Domestic W . Europe
Domestic Middle East
Indian Sub <> Middle East
W . Europe <> Middle East
Indian Sub <> PRC
Japan <> PRC
Source: Airbus GMF
© AIRBUS S.A.S. All rights reserved. Confidential and proprietary document.
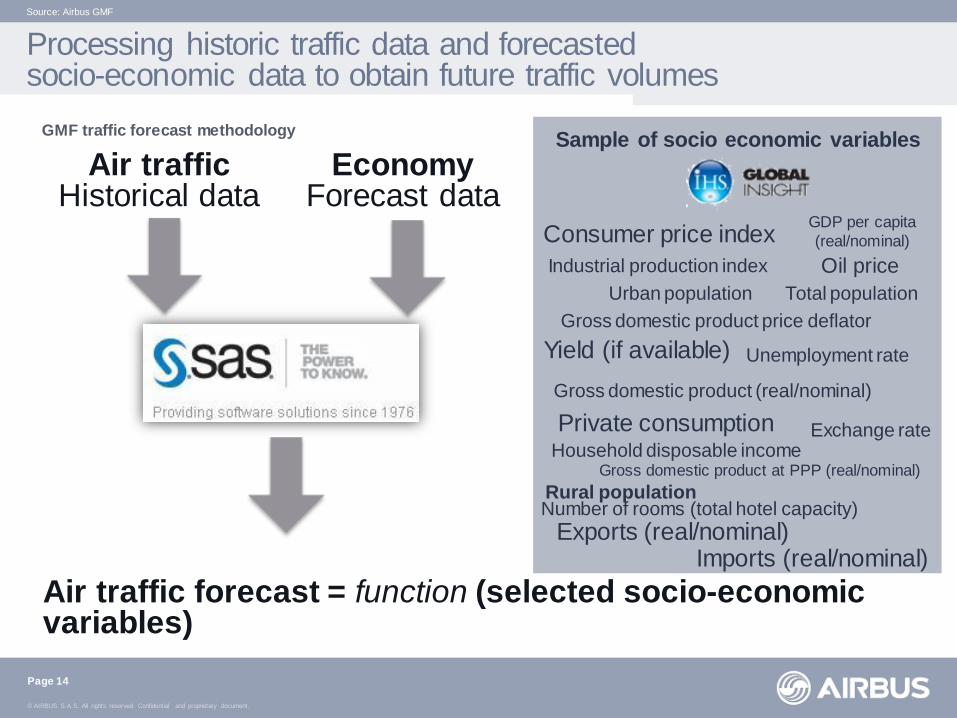
Air traffic Historical data
Air traffic forecast = function (selected socio-economic variables)
Processing historic traffic data and forecasted socio-economic data to obtain future traffic volumes
Page 14
GMF traffic forecast methodology
Source: Airbus GMF
Economy Forecast data
Consumer price index
Household disposable income
Industrial production index
Gross domestic product price deflator
Gross domestic product (real/nominal)
GDP per capita
(real/nominal)
Gross domestic product at PPP (real/nominal)
Exports (real/nominal) Imports (real/nominal)
Private consumption
Unemployment rate
Total population Urban population
Rural population Number of rooms (total hotel capacity)
Exchange rate
Oil price
Yield (if available)
Sample of socio economic variables

© AIRBUS S.A.S. All rights reserved. Confidential and proprietary document.
Month 200X
Traffic will double in the next 15 years
0
2
4
6
8
10
12
14
16
1972 1977 1982 1987 1992 1997 2002 2007 2012 2017 2022 2027 2032
Air traffic has doubled
every 15 years
Air traffic will double
in the next 15 years
Airbus
GMF 2013
ICAO
total traffic
Source: ICAO, Airbus
World annual RPK (trillion)
4.4%
2022-2032
5.1%
2012-2022
4.7%
2012-2032

© AIRBUS S.A.S. All rights reserved. Confidential and proprietary document.
Emerging markets will drive traffic growth
0%
10%
20%
30%
40%
50%
60%
70%
80%
90%
100%
Emerging - Emerging Advanced - Emerging Advanced - Advanced
Month 200X
Page 16
29%
43%
28%
30%
29%
41%
Share of world RPK, by type of flow
Source: Airbus
6.8%
Emerging – Emerging CAGR
4.9%
Emerging – Advanced CAGR
2.6%
Advanced – Advanced CAGR

© AIRBUS S.A.S. All rights reserved. Confidential and proprietary document.
Domestic PRC will be the largest flow in 2032
0 200 400 600 800 1000 1200 1400 1600
Indian Sub - USA
South America - USA
Central Europe - Western Europe
PRC - USA
Asia - USA
Indian Sub - Middle East
Western Europe - PRC
Asia - Middle East
Domestic Asia
Western Europe - South America
Western Europe - Middle East
Intra Asia
Domestic Brazil
Asia - PRC
Domestic India
Asia - Western Europe
Western Europe - USA
Intra Western Europe
Domestic USA
Domestic PRC
2012
2032
2012 – 2032 Billions RPK GMF 2013 (O&D)
7.0%
1.9%
2.9%
3.0%
4.3%
9.8%
6.2%
7.0%
6.1%
4.8%
4.8%
5.7%
8.0%
5.7%
6.1%
4.2%
6.5%
5.9%
5.3%
6.6%
Largest O&D flows in 2032

© AIRBUS S.A.S. All rights reserved. Confidential and proprietary document.
0 1,000 2,000 3,000 4,000 5,000
Asia-Pacific
Europe
North America
Middle East
Latin America
CIS
Africa
Asia-Pacific to lead in world traffic by 2032
2012 traffic 2012-2032 traffic 29%
26%
25%
8%
5%
4%
3%
20-year world annual traffic growth
4.7%
5.5%
3.8%
3.0%
7.1%
6.0%
5.8%
5.1%
% of 2012 world RPK
20-year growth
34%
22%
18%
12%
7%
4%
3%
% of 2032 world RPK
RPK traffic by airline domicile (billions)

© AIRBUS S.A.S. All rights reserved. Confidential and proprietary document.
How many passengers
will fly?
Where will passengers
fly?
How will passengers
fly?
0
Y Y + n
Page 19
© AIRBUS S.A.S. All rights reserved. Confidential and proprietary document.
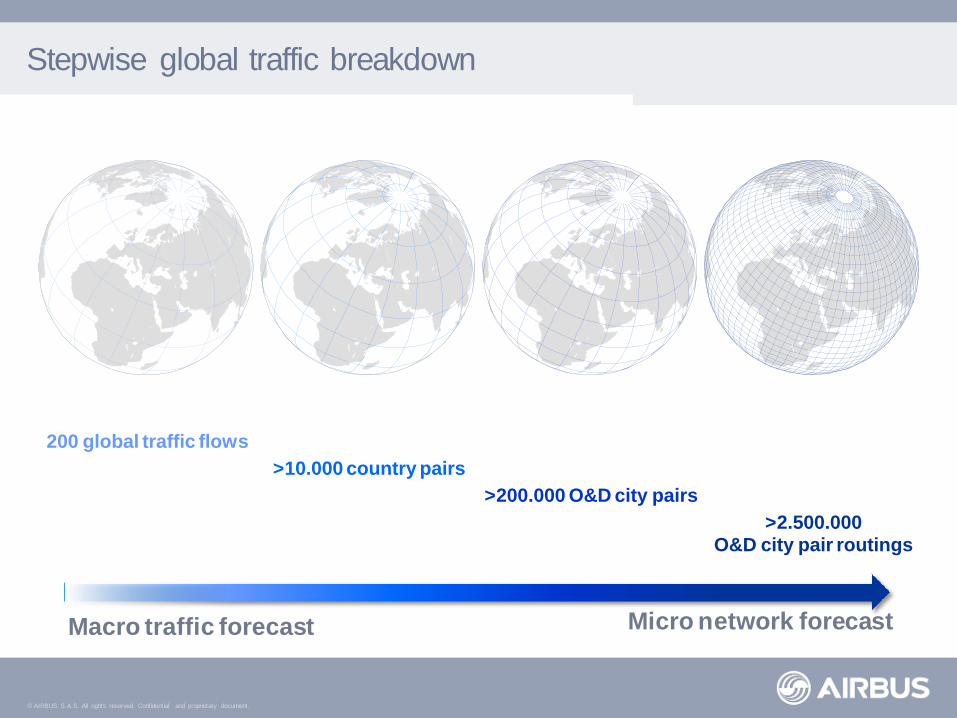
>200.000 O&D city pairs
>10.000 country pairs
200 global traffic flows
>2.500.000 O&D city pair routings
Macro traffic forecast Micro network forecast
Stepwise global traffic breakdown
© AIRBUS S.A.S. All rights reserved. Confidential and proprietary document.
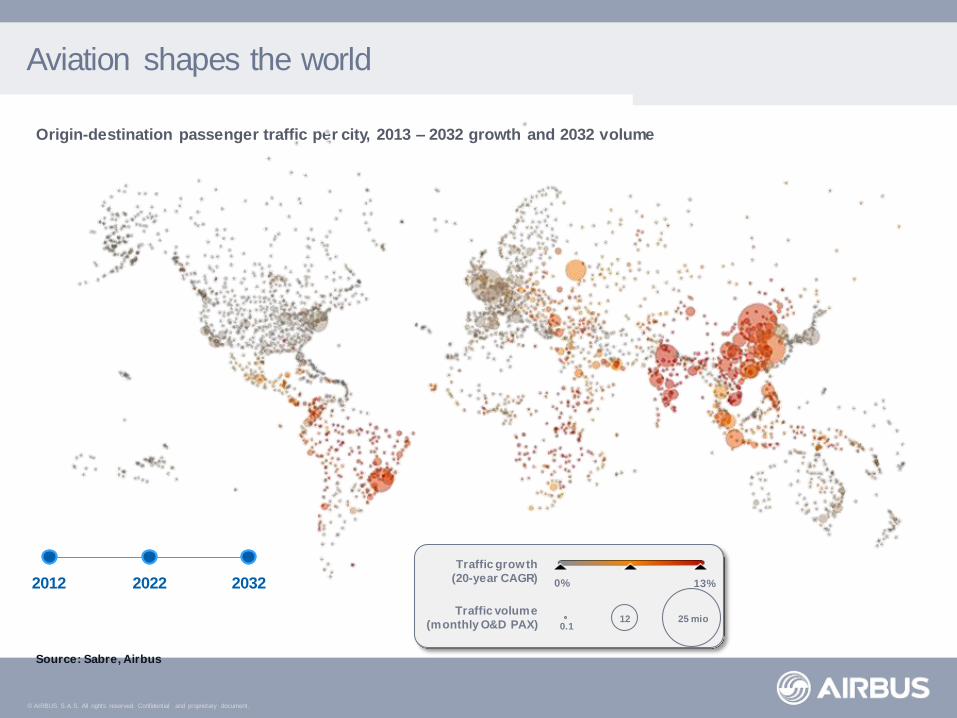
Aviation shapes the world
Origin-destination passenger traffic per city, 2013 – 2032 growth and 2032 volume
0% 13%
Traffic growth
(20-year CAGR)
25 mio 12 0.1
Traffic volume
(monthly O&D PAX)
2012 2022 2032
Source: Sabre, Airbus
© AIRBUS S.A.S. All rights reserved. Confidential and proprietary document.
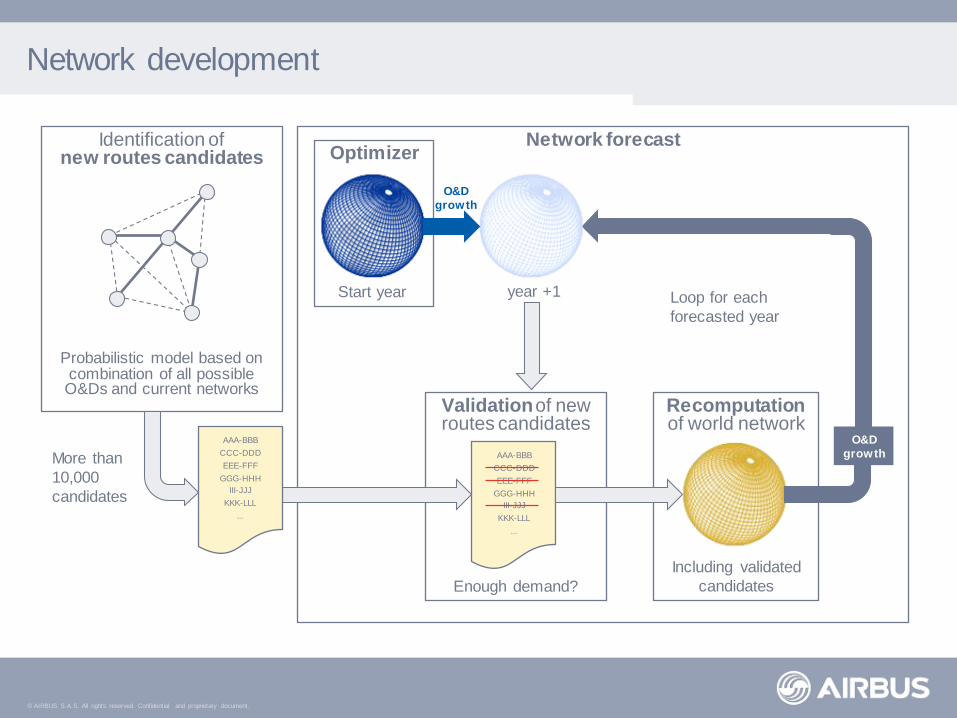
Network development
Identification of new routes candidates
Probabilistic model based on combination of all possible O&Ds and current networks
Network forecast
Start year
Optimizer
Validation of new routes candidates
AAA-BBB
CCC-DDD
EEE-FFF
GGG-HHH
III-JJJ
KKK-LLL
...
Enough demand?
AAA-BBB
CCC-DDD
EEE-FFF
GGG-HHH
III-JJJ
KKK-LLL
...
More than
10,000
candidates
Recomputation of world network
Including validated
candidates
O&D
growth
year +1
O&D
growth
Loop for each
forecasted year

© AIRBUS S.A.S. All rights reserved. Confidential and proprietary document.
Airbus does not only focus on consolidation
Source: Airbus Market Research and Forecasts
New airline/ airport-pairs, GMF 2013
4,100
April 14 Airbus Global Market Forecast 2013 - Presentation to ALC

© AIRBUS S.A.S. All rights reserved. Confidential and proprietary document.
2012 cities with more than 10,000 daily long-haul passengers
42 cities in the world handle more than 10,000 long haul passengers per day …
Long-haul traffic is concentrated on a few main aviation centres
Traffic as of month of September; Source: GMF 2013
Long haul traffic: flight distance >2,000nm, excl. domestic traffic;
• >50 000 daily long-haul passengers
• >20 000 daily long-haul passengers
• >10 000 daily long-haul passengers
93% of long-haul traffic
on routes to/from/via
42 cities
42 Aviation Mega-
cities
0.8M Daily Passengers:
Long Haul traffic to
/from/via Mega Cities
traffic
© AIRBUS S.A.S. All rights reserved. Confidential and proprietary document.
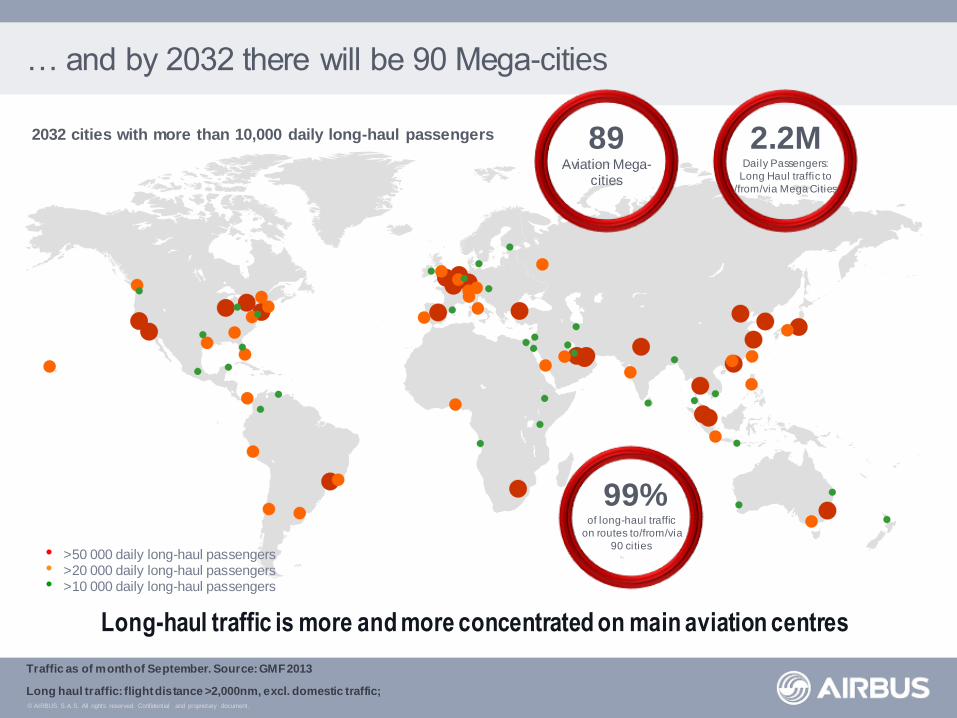
… and by 2032 there will be 90 Mega-cities
Long-haul traffic is more and more concentrated on main aviation centres
Traffic as of month of September. Source: GMF 2013
Long haul traffic: flight distance >2,000nm, excl. domestic traffic;
2032 cities with more than 10,000 daily long-haul passengers
• >50 000 daily long-haul passengers • >20 000 daily long-haul passengers • >10 000 daily long-haul passengers
99% of long-haul traffic
on routes to/from/via
90 cities
2.2M Daily Passengers:
Long Haul traffic to
/from/via Mega Cities
89 Aviation Mega-
cities

© AIRBUS S.A.S. All rights reserved. Confidential and proprietary document.
How many passengers
will fly?
Where will passengers
fly?
How will passengers
fly?
0
Y Y + n
Page 26

© AIRBUS S.A.S. All rights reserved. Confidential and proprietary document.
Growth can be accommodated by growth in frequency, capacity or both simultaneously
Frequency
Capacity Bubbles proportional to ASKs
Step 1: increase in Frequency only
Step 2: increase in both Frequency & Capacity
Step 3: increase in Capacity only Maximum service
level
Satisfactory service
level
Route
opening
Growth accommodation in Airbus forecasts
Source: Airbus Market Research and Forecasts
April 14 Airbus Global Market Forecast 2013 - Presentation to ALC

© AIRBUS S.A.S. All rights reserved. Confidential and proprietary document.
0
500
1,000
1,500
2,000
2,500
2000 2001 2002 2003 2004 2005 2006 2007 2008 2009 2010 2011 2012 2013
LCC Seats Offered
LCC Flights
LCCs in Asia-Pacific continue to boom
49%
Average aircraft capacity growth since 2000
LCC Seats Offered and Flights, base year 2000 = 100 Source: OAG, Airbus Market Research and Forecasts| Note: Includes all intra-regional and domestic traffic
Page 28

© AIRBUS S.A.S. All rights reserved. Confidential and proprietary document.
Demand for over 29,200 new aircraft
17,739
New aircraft
29,226
+ 3.7% per annum
Fleet in service evolution; 2013-2032
36,556
Source: Airbus
Note: Passenger aircraft ≥100 seats, Freighter aircraft ≥10 tonnes
Stay in service & Converted
Replaced
Growth
7,330
10,409
18,817
0
5,000
10,000
15,000
20,000
25,000
30,000
35,000
40,000
Beginning 2013 2032

© AIRBUS S.A.S. All rights reserved. Confidential and proprietary document.
0
4,000
8,000
12,000
16,000
20,000
Single-aisle Small twin-aisle Intermediate twin-aisle Very Large Aircraft
GMF 2012
GMF 2013
Single-aisle: 69% of units; Wide-bodies: 59% of value
Passenger aircraft (≥ 100 seats) and jet freight aircraft (>10 tons)
Source: Airbus
69% 17% 8% 6% % units
41% 26% 17% 16% % value
20-year new deliveries of passenger and freighter aircraft
29,226
New Deliveries 2013 -2032
© AIRBUS S.A.S. All rights reserved. Confidential and proprietary document.
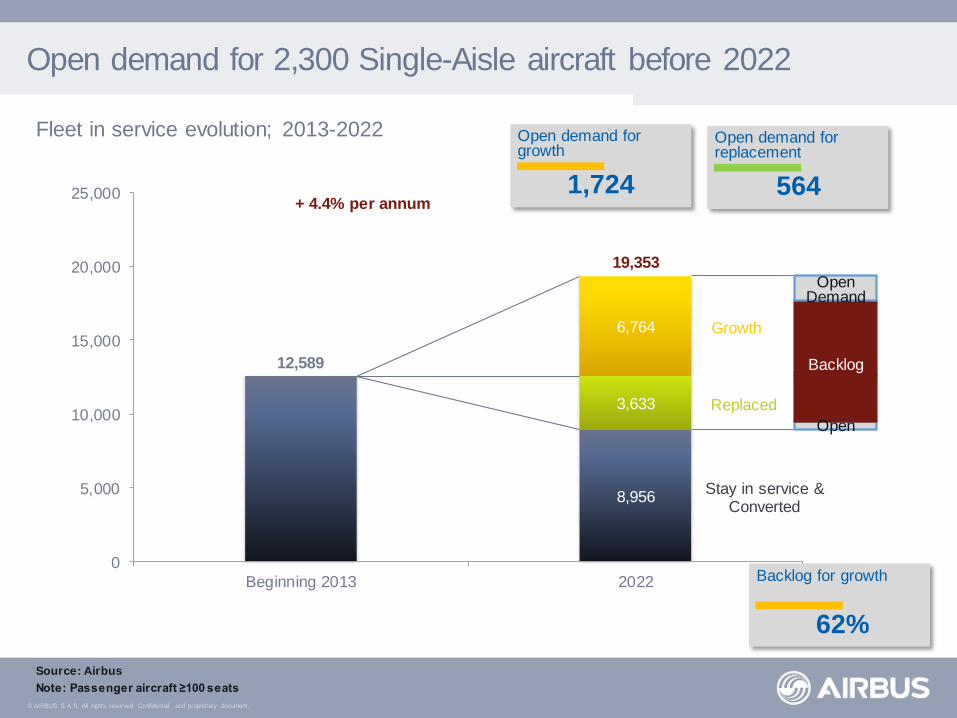
Open demand for 2,300 Single-Aisle aircraft before 2022
12,589
Fleet in service evolution; 2013-2022
Source: Airbus
Note: Passenger aircraft ≥100 seats
Stay in service & Converted
Replaced
Growth
8,956
3,633
6,764
0
5,000
10,000
15,000
20,000
25,000
Beginning 2013 2022
Open Demand
Backlog
Open
+ 4.4% per annum
19,353
1,724
Open demand for growth
564
Open demand for replacement
62%
Backlog for growth

© AIRBUS S.A.S. All rights reserved. Confidential and proprietary document.
Open demand for 1,200 Twin-Aisle aircraft before 2022
3,505
Fleet in service evolution; 2013-2022
Source: Airbus
Note: Passenger aircraft ≥100 seats
Stay in service & Converted
Replaced
Growth
2,034
1,471
2,109
0
1,000
2,000
3,000
4,000
5,000
6,000
Beginning 2013 2022
Open Demand
Backlog
Open Demand
+ 4.8% per annum 5,614 523
Open demand for growth
709
Open demand for replacement
68%
Backlog for growth

© AIRBUS S.A.S. All rights reserved. Confidential and proprietary document.
Summary
• Strong growth in passenger traffic – resilient growth through a difficult,
but improving economic period
• Demand for over 29,000 new aircraft by 2032 – ~28,300 passenger
aircraft and nearly 900 freighter aircraft
• Replacement of ageing fleets – 20 year demand for nearly 11,000 passenger aircraft for replacement, largely in the single-aisle segment
• Single-aisle aircraft represent 70% of demand in units, but wide-body
aircraft represent 60% of value
• VLA demand driven by aviation mega-cities – more than 99% of all long-
haul passengers will fly to, from or through these cities by 2032

Top Related