


Languages
Pages
Legal

CTBT Space-Based Monitoring:
Interferometric Synthetic Aperture Radar and
National Technical Means
David Hafemeister
Science Affiliate Center for International Security and Cooperation
Stanford University
Interferometric Synthetic Aperture Radar (InSAR) is a
promising new technology, which has detected and identified
explosions of 1 kton at a depth of 500 meters at the Nevada
Test Site. InSAR cannot detect all nuclear explosions under 1
kton at all locations, but if the test is roughly located by
seismic or other data to a general location, InSAR can
discriminate between explosions and earthquakes by the
shape of the interference pattern. In addition, InSAR can
determine absolute locations for on-site inspections to 100
meters, or 0.01 square kilometers. The larger the test the
more useful InSAR becomes.
National Technical Means can detect, discriminate and locate
nuclear tests at chosen sensitive locations with greater
accuracy than that obtained by the IMS. An unclassified
description of NTM technologies is included in this paper.
1
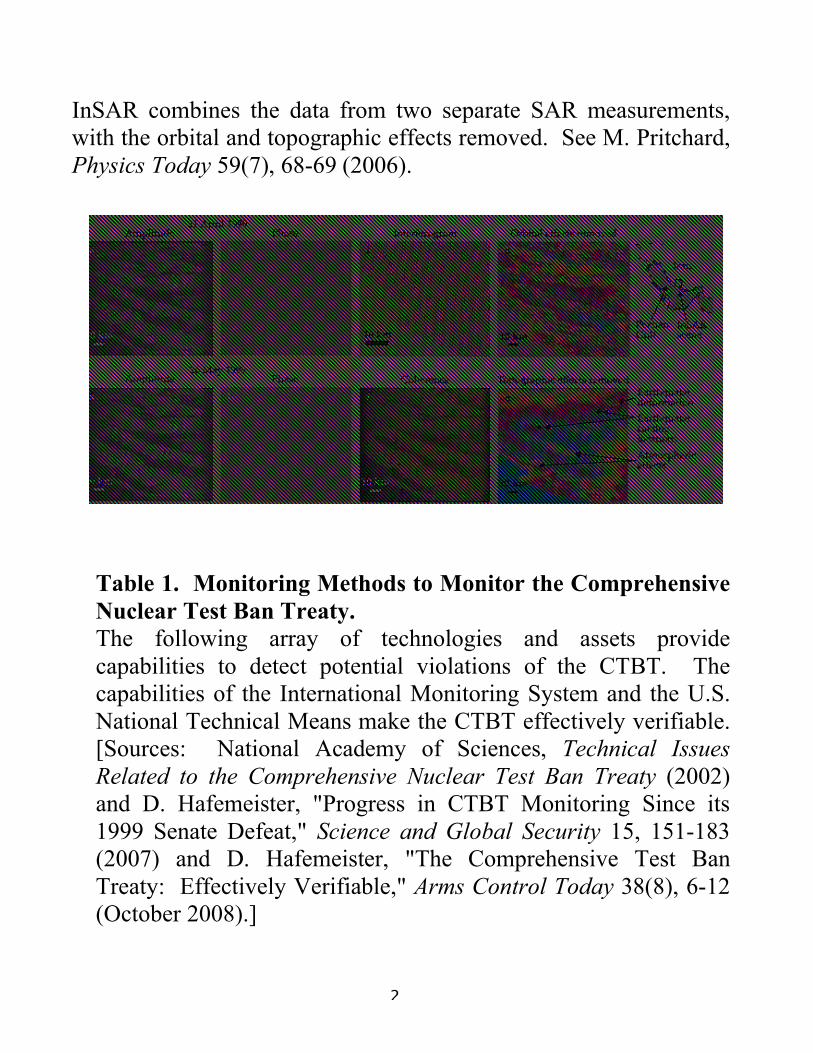
InSAR combines the data from two separate SAR measurements,
with the orbital and topographic effects removed. See M. Pritchard,
Physics Today 59(7), 68-69 (2006).
Table 1. Monitoring Methods to Monitor the Comprehensive
Nuclear Test Ban Treaty.
The following array of technologies and assets provide
capabilities to detect potential violations of the CTBT. The
capabilities of the International Monitoring System and the U.S.
National Technical Means make the CTBT effectively verifiable.
[Sources: National Academy of Sciences, Technical Issues
Related to the Comprehensive Nuclear Test Ban Treaty (2002)
and D. Hafemeister, "Progress in CTBT Monitoring Since its
1999 Senate Defeat," Science and Global Security 15, 151-183
(2007) and D. Hafemeister, "The Comprehensive Test Ban
Treaty: Effectively Verifiable," Arms Control Today 38(8), 6-12
(October 2008).]
2
Seismic
NAS concluded that explosions above 0.1 kton in hard rock can be detected in Asia, Europe, North America and North Africa. Tests in cavities can be detected above 1-2 kton for advanced nuclear weapon states, with risk of venting and excursion yields. This limit is perhaps 0.1 kt for new nuclear nations.
IMS will use 50 primary and 120 auxiliary seismic stations. Arrays of seismographs and regional seismographs can obtain lower threshold yields. In addition, thousands of non-IMS stations have data that could trigger an on-site inspection.
Hydroacoustic
NAS concluded that explosions above a few kilograms can be detected in Southern Hemisphere, and above 1 ton for all oceans.
IMS will use six hydrophone arrays and five T-physics monitoring stations.
Infrasound
NAS concluded that explosions above 1 kton in the atmosphere can be detected, and above 0.5 kton over continents.
IMS will use 60 infrasound monitoring stations.
Radionuclide
NAS concludes that explosions above 0.1–1 kton can be detected to identify the event as a nuclear explosion. The 0.6 kton North Korean test was detected at 7,000 km distance.
IMS will use 80 particulate monitoring stations, and 40 of these will also detect radioxenon. NTM sensors can also be placed on airplanes for close approaches to suspected test sites.
InSAR InSAR measures subsidence as low United States has four
(Interferometric as 0.2-0.5 cm in many locations, classified SAR satellites. Synthetic with yields above 1 kton at 500 m Europe, Canada and Japan sell
Aperture Radar) depth. InSAR can determine locations to 100 meters.
unclassified SAR data for as low as $3,000 each.
On-Site Inspections
Any CTBT party can request an OSI, which needs 30 of 51 votes in the Executive Council.
Photos and radioactivity obtained by air and ground. Mini seismic arrays can observe aftershocks. Magnetic anomalies, SAR, soil data obtained with GPS locations.
Confidence- After CTBT enters into force, Close-in sensors could detect
Building nuclear weapon states could seismic, infrasound,
Measures locate more sensors at test sites to lower thresholds further.
electromagnetic pulse, radionuclide and other data indicative of a test.
National Technical
Means
U.S. NTM technologies have considerable reach and precision.
NTM sensors are located in space, in the atmosphere, on the ground, in the oceans and underground.
3
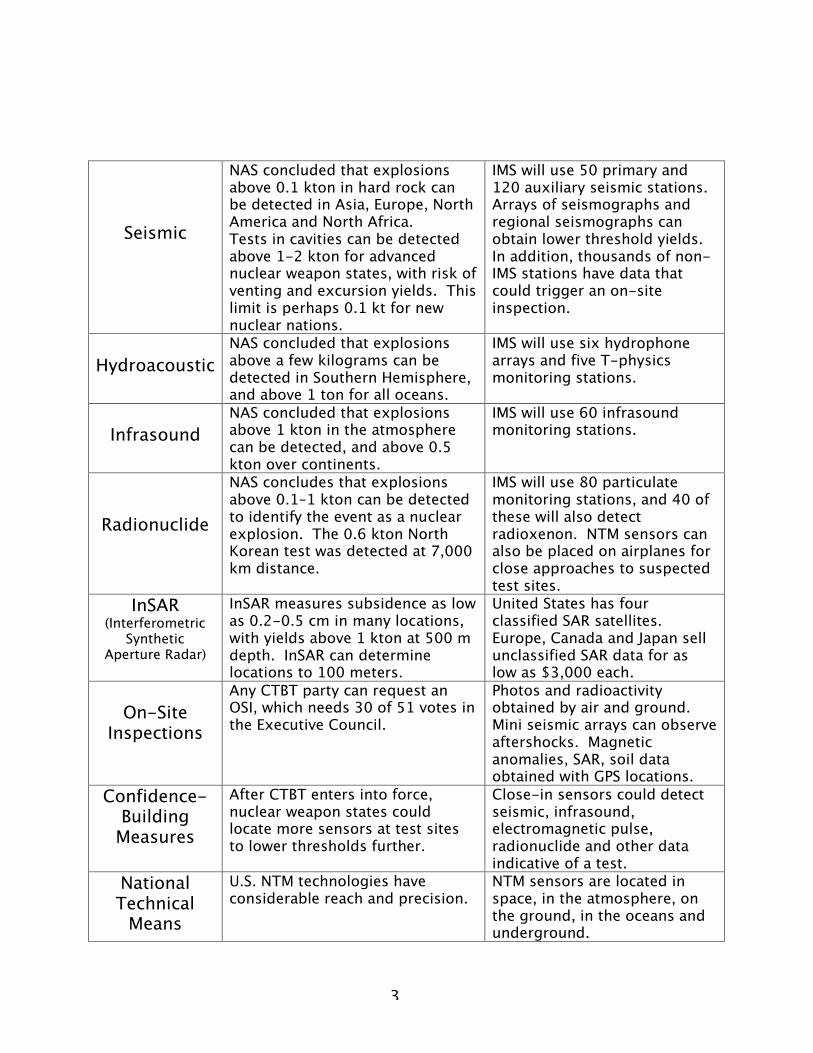
Nevada Test Site (NTS) InSAR Data from Paul
Vincent, et al, Geophysical Research Letters 30(22),
2141 (2003). The local magnitude of the tests are (left
to right) ML = 3.9, 4.4, 2.7 at depths of 340, 401 and
244 meters. The InSAR threshold detection level at
NTS is 1 kton at 500 m depth, based on the
Nonproliferation Experiment (ML = 4.06) with the 1.4
kton chemical explosion (2.8 kton effective nuclear
yield) and the NTS relation mb = 3.87 + 0.75 log(Y).
4
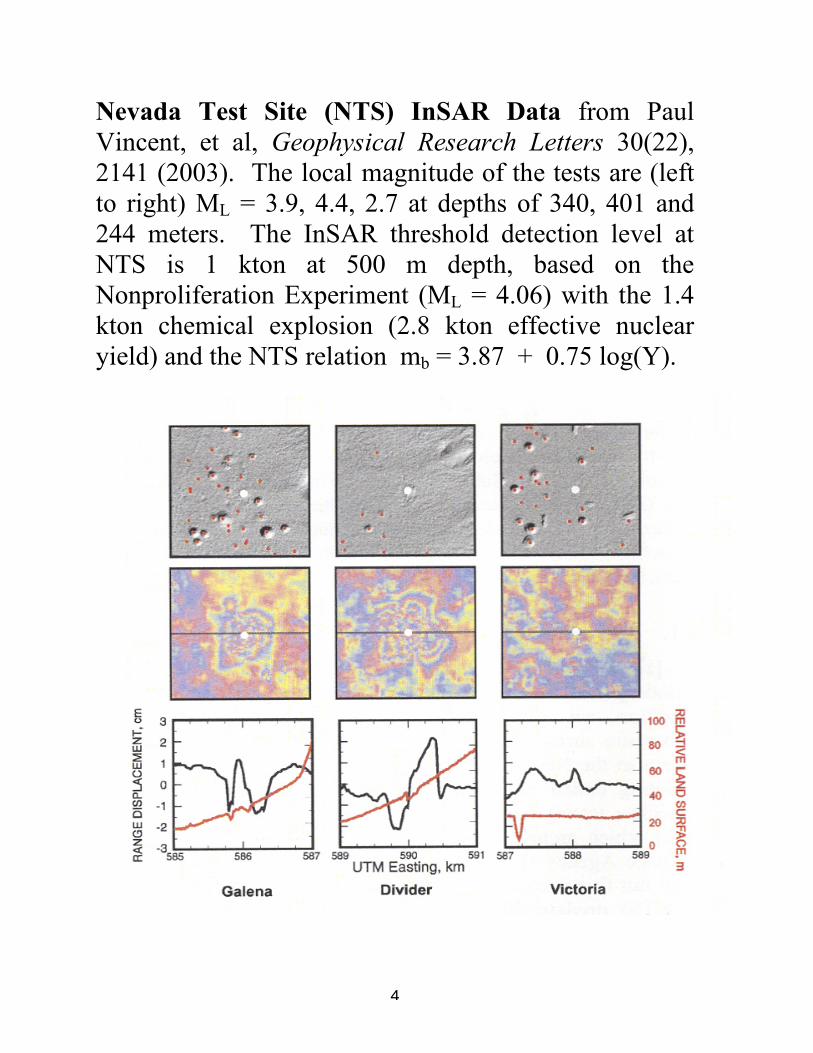
The Jubilee Tube (subway) commemorated Queen
Elizabeth II's Silver Jubilee. The tunnel is 20 meters
below the surface, and the surface subsided by 2.5 cm
from 1992 to 2001. The InSAR data shown below
shows a linear subsidence with time with individual
data points having an accuracy of better than 2 mm with
excellent location. See G. Rennie, Sci. Tech. Rev. 4-11
(April 2005).
5
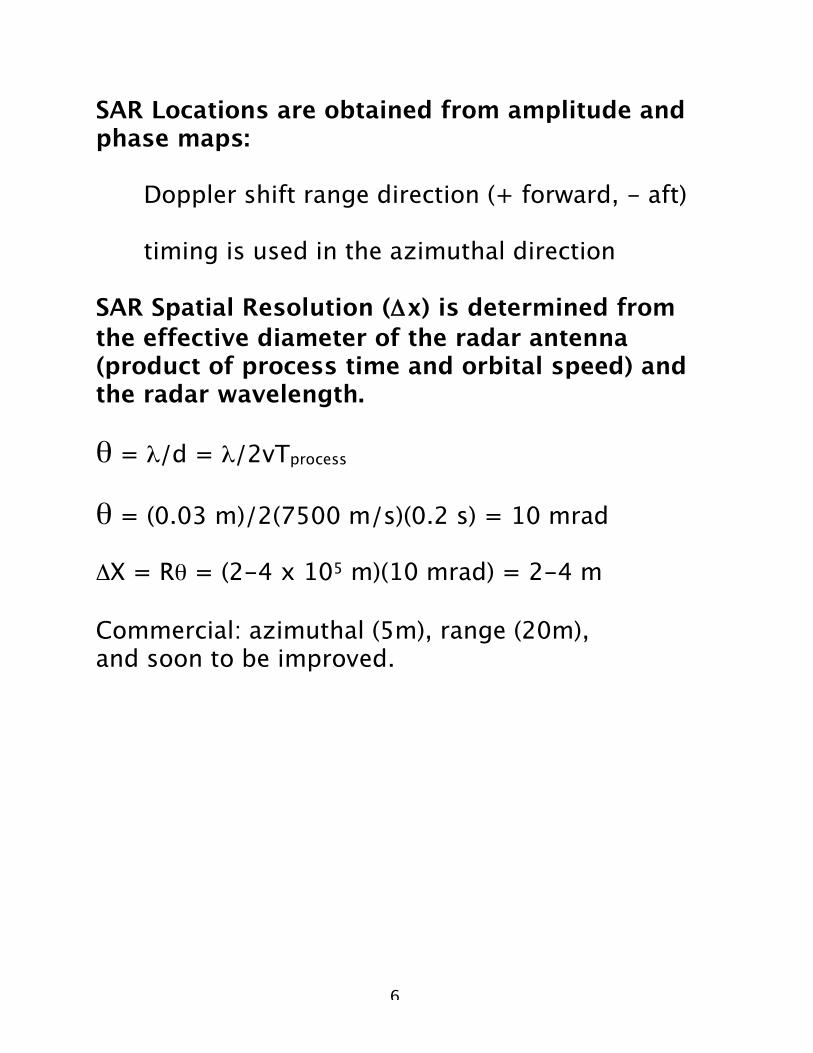
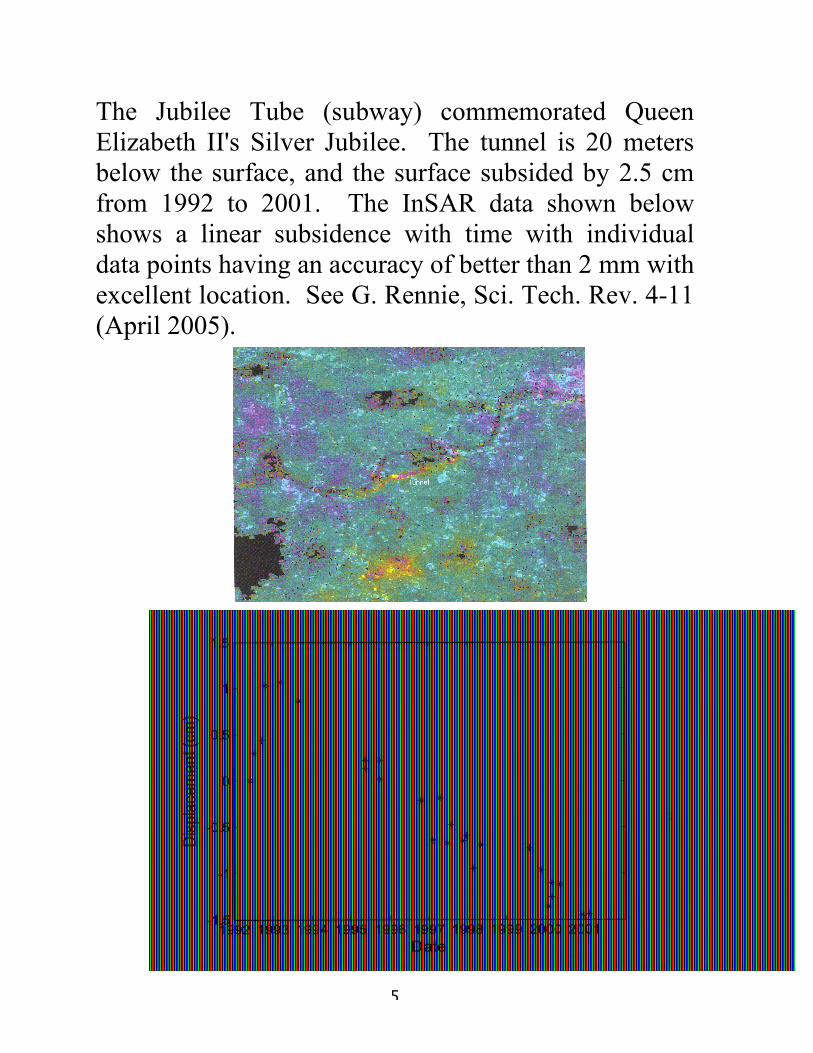
SAR Locations are obtained from amplitude and phase maps:
Doppler shift range direction (+ forward, - aft)
timing is used in the azimuthal direction
SAR Spatial Resolution (!x) is determined from
the effective diameter of the radar antenna (product of process time and orbital speed) and the radar wavelength.
" = #/d = #/2vTprocess
" = (0.03 m)/2(7500 m/s)(0.2 s) = 10 mrad
!X = R" = (2-4 x 10⁵ m)(10 mrad) = 2-4 m
Commercial: azimuthal (5m), range (20m), and soon to be improved.
6
InSAR Spatial Resolution
Double Difference Method (12 - 23).
Vincent (12 - Digital Elevation Model) = subsidence.
Can minimize atmospheric and vegetation phase shifts with many data sets.
Horizontal Resolution = 30 meters.
Vertical resolution = 2 mm at NTS, London and elsewhere and 5 mm or more at other locations.
Relevant Areas
Nuclear Ex. Crater = 100 m = 0.1 km
Nuclear Ex. Subsidence > 1 km
CTBT OSI = 1,000 km2
Radar Picture = 10,000 km2
INSAR absolute locations = 100 m = 0.1 km
InSAR Area = 0.01 km2
7
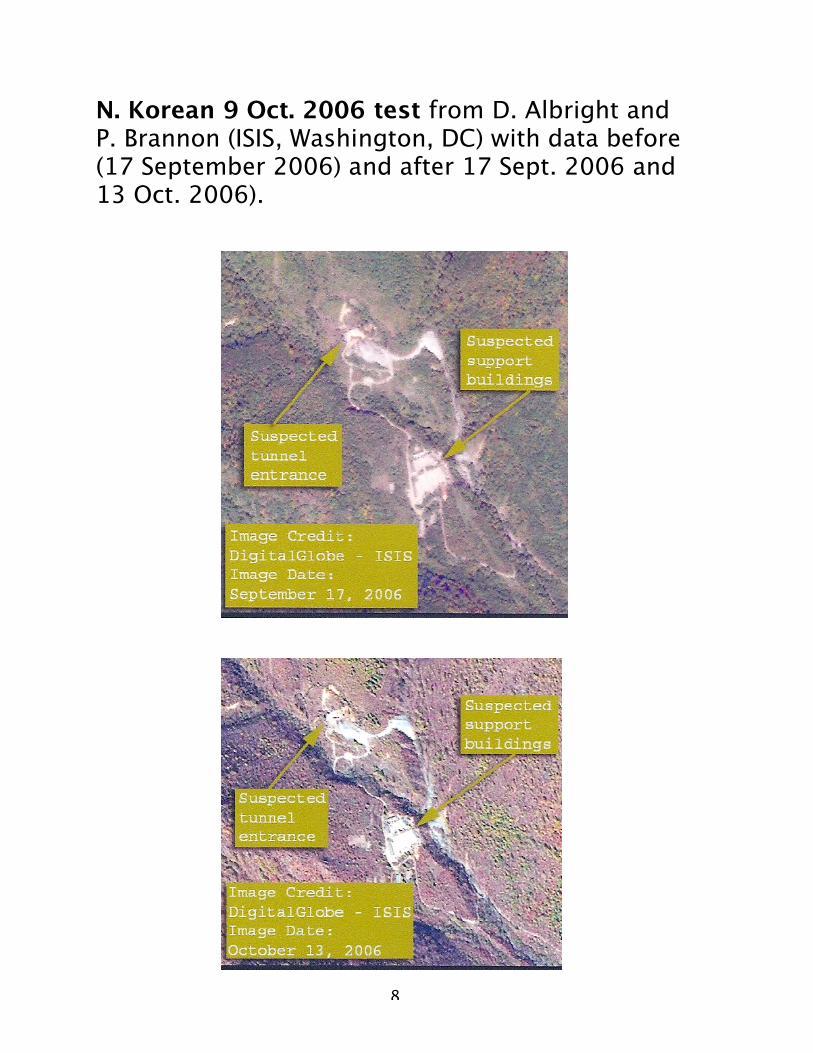
N. Korean 9 Oct. 2006 test from D. Albright and P. Brannon (ISIS, Washington, DC) with data before (17 September 2006) and after 17 Sept. 2006 and 13 Oct. 2006).
8
Google Earth and InSAR Earth
D. Albright locates DPRK test sites with satellite photos after cueing.
Frank Pabian (LANL) uses Google Earth on Iran at IAEA, UN (2005-6), following NCRI tips.
Pabian (“Commercial Satellite Imagery… NonProliferation Monitoring Toolkit” (LANL book, 2008) and Nonproliferation Rev. 1998) lists 20 attempts to locate tests etc.
35 satellite imaging companies (17 nations)
41-50 cm BW and 170 cm multi-spectral resolution
See: spare tire on a medium-truck hoop on a basketball court
5S’s: size, shape, shadow, shade, surrounding objects and signatures and timing
1992: V. Gupta spots PRC reactor, Algeria
1998/06: D. Albright spots 2 Pu reactors, Pakistan
2005: D. Sanger (NYT) spots DPRK test site
9
InSAR can be cued with seismic or other data.
Discriminate between Quakes (shear lobes) and Explosions (Circles).
Elastic finite–element calculations.
LOCATION, LOCATION, LOCATION, LOCATION.
Examine for tunnels, roads, etc.
Search for subsidence above man-made cavities in salt or hard rock.
"Google InSAR" Canadian Radarsat SAR data
($3-5,000 each, 8 m resolution, 50km x 50km) Software $20-40,000.
Many InSAR graduate students in geophysics.
10
NTM Assets
(2002): 33 GPS satellites with sensors:
bhangmeter, 5 x-ray, 2 gamma, neutron
Infrared: 23 DSP (last one 2007), 10-20 SBIRS
(BMD)?
EMP (LANL): ALEXIS, FORTE, CIBOLA (2007)
Locate with RF and optical, lightning research, 70o
Ionosphere distortions, RF noise
SAR: 4 U.S. Lacrosse, EU, Japan, Canada…..
NAS Footnote 33: “disagreements persists” on 1979 test, but “Today’s instrumentation …improved...to enable unambiguous interpretation of such events.”
Optical/IR Reconnaissance: KH12, CCD’s etc.
Particle Analyzers: SOPA and CEPPAD (polar orbit)
Computers in orbit: terraflop (40 pounds, 80 W)
11
Optical Bhangmeter. Double-peak signal from
atmospheric nuclear tests, by H. Argo (LANL) in D.
Hafemeister, Physics of Societal Issues, (Springer 2007)
pg. 92.
12
13
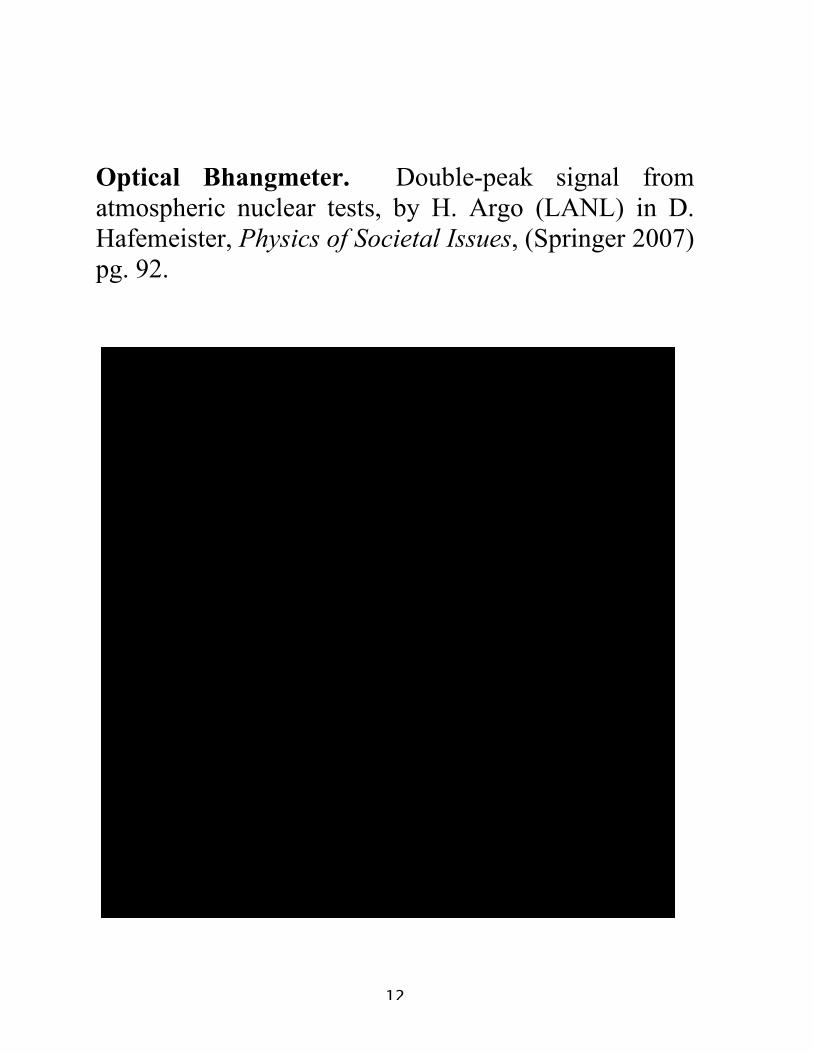
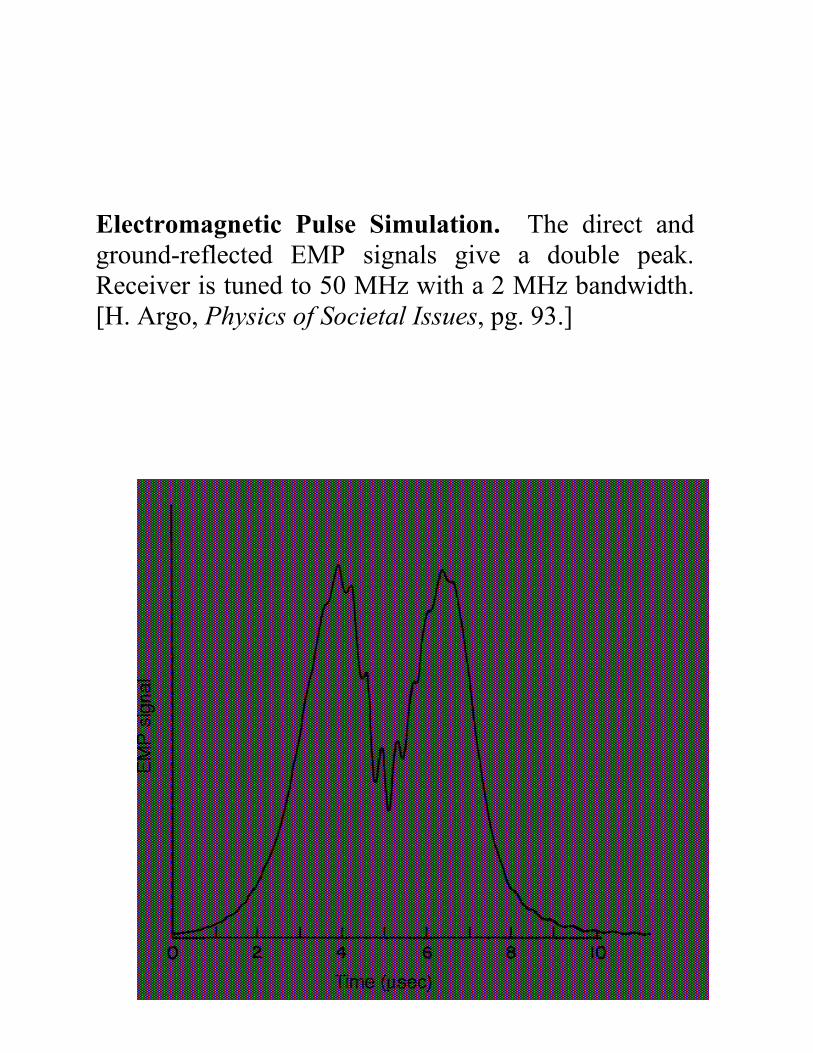
Electromagnetic Pulse Simulation. The direct and
ground-reflected EMP signals give a double peak.
Receiver is tuned to 50 MHz with a 2 MHz bandwidth.
[H. Argo, Physics of Societal Issues, pg. 93.]
Particle flux at a GPS satellite at 20,000 km. [H.
Argo, Physics of Societal Issues, pg. 91.]
Neutrons: 2500 n/cm2-kton
5-keV X-rays: 108 Y(kt)/cm2
Prompt gammas: 1500 Y(kt)/cm2
U.S. National Academy of Sciences (2002, pg. 53-5):
”X-rays from explosions of about 1 kiloton can be
detected at ranges exceeding 100 million kilometers,
comparable to the distance between Earth and the Sun.
Optical effects are observable from space from altitudes
between sea level to 100 kilometers over extended
ranges. … monitoring possibilities and unattractiveness
of space testing…..ban on space testing in LTBT of
1963.”
“To summarize, monitoring of space-based explosions
and of atmospheric explosions from space is based on
powerful technologies which provided they continue to
be deployed and maintained as needed for this mission,
will make it extremely unlikely that such testing can be
conducted without being detected and identified.
Attribution might require additional information, such
as from use of NTM to interpret missile-launch
activities.”
14
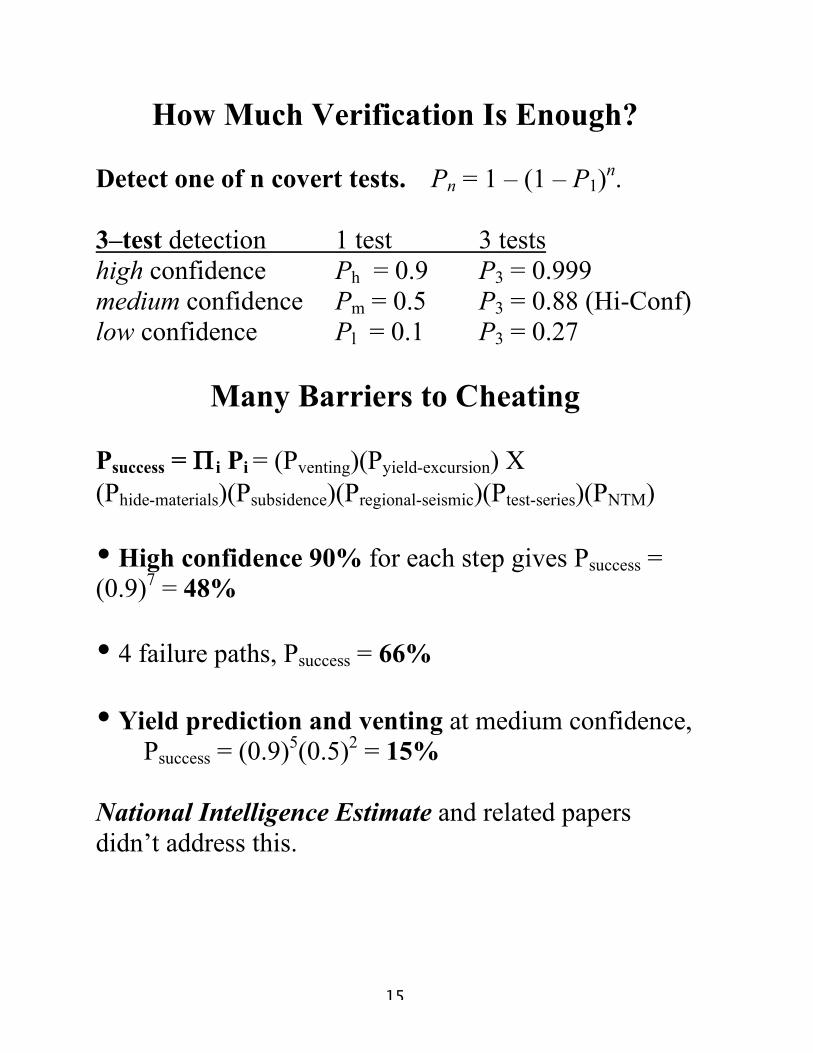
How Much Verification Is Enough?
Detect one of n covert tests. Pn = 1 – (1 – P1)n .
3–test detection 1 test 3 tests
high confidence Ph = 0.9 P3 = 0.999
medium confidence Pm = 0.5 P3 = 0.88 (Hi-Conf)
low confidence Pl = 0.1 P3 = 0.27
Many Barriers to Cheating
Psuccess = $ i Pi = (Pventing)(Pyield-excursion) X
(Phide-materials)(Psubsidence)(Pregional-seismic)(Ptest-series)(PNTM)
• High confidence 90% for each step gives Psuccess =
(0.9)7 = 48%
• 4 failure paths, Psuccess = 66%
• Yield prediction and venting at medium confidence,
Psuccess = (0.9)5(0.5)2 = 15%
National Intelligence Estimate and related papers
didn’t address this.
15
Top Related