


Languages
Pages
Legal


2016COMPREHENSIVE ANNUAL FINANCIAL REPORT
FOR YEAR ENDED DECEMBER 31, 2016

2016 Comprehensive Annual Financial ReportFor year ended Dec. 31, 2016Prepared through the combined efforts of OP&F staff
Prudence • Integrity • Empathy140 East Town StreetColumbus, Ohio 43215
Customer Service: 1-888-864-8363General Information: (614) 228-2975TTY: (614) 221-3846FAX: (614) 628-1777E-mail: [email protected]
www.op-f.org
Copyright © 2017 by Ohio Police & Fire Pension Fund. All Rights Reserved.

FOR YEAR ENDED DEC. 31 , 2016
COMPREHENSIVE ANNUAL FINANCIAL REPORT
PREPARED THROUGH THE COMBINED EFFORTS OF OHIO POLICE & FIRE PENSION FUND STAFF

Page ii • OP&F
TABLE OF CONTENTS
v
INTRODUCTION unaudited
vi Board of Trustees
vii Administrative Staff
vii Professional Consultants
viii Awards
x Letter of Transmittal
01
FINANCIAL02 Independent Auditor’s Report
04 Management’s Discussion and Analysis unaudited
BASIC FINANCIAL STATEMENTS
08 Statement of Fiduciary Net Position
09 Statement of Changes in Fiduciary Net Position
10 Notes to Basic Financial Statements
REQUIRED SUPPLEMENTARY INFORMATION unaudited
43 Schedule of Changes in the Employers’ Net Pension Liability
44 Schedule of Employers’ Net Pension Liability (Asset)
44 Schedule of Employer Contributions – Pension Trust Fund
45 Schedule of Investment Returns
45 Notes to Required Supplementary Information
46 Schedule of Funding Progress – Retiree Health Care Trust Fund
46 Schedule of Employer Contributions – Retiree Health Care Trust Fund
47 Schedule of OP&F’s Proportionate Share of the Net Pension Liability Ohio Public Employees Retirement Plan
48 Schedule of Contributions Ohio Public Employees Retirement Plan
ADDITIONAL INFORMATION
49 Schedule of Administrative Expenses
49 Schedule of Investment Expenses
50 Combining Statement of Changes in Assets and Liabilities – Public Safety Officers Death Benefit Fund

OP&F • Page iii
51
INVESTMENTS unaudited
52 Investment Report
59 Investment Portfolio Summary
59 Ten Largest Common Stocks
60 Ten Largest Bonds and Obligations
60 Ten Largest Real Estate Holdings
61 Schedule of Investment Results
62 Investment Consultants and Money Managers
63 Schedule of Brokers’ Fees Paid
64 Investment Policy and Guidelines
73
ACTUARIAL unaudited
74 Report of Actuary
77 Description of Actuarial Assumptions and Methods
82 Plan Summary
90 Analysis of Financial Experience – Pension Trust Fund
91 Short-Term Solvency Test – Pension Trust Fund
91 Active Member Valuation Data – Pension Trust Fund
91 Retirees and Beneficiaries Added to and Removed from Rolls – Pension Trust Fund
92 Calculation of Actuarial Value Assets
93 Employer Contribution Rates
93 Member Contribution Rates
94 Schedule of Funding Progress – Pension Trust Fund – Retiree Health Care Trust Fund
95 Short-Term Solvency Test – Retiree Health Care Trust Fund
95 Retirees and Beneficiaries Added to and Removed from Rolls - Retiree Health Care Trust Fund
96 Analysis of Financial Experience – Retiree Health Care Trust Fund

Page iv • OP&F
97
STATISTICAL unaudited
98 Statistical Objectives
FINANCIAL TRENDS
99 Changes in Fiduciary Net Position – Combined Trust Fund
100 Changes in Fiduciary Net Position – Pension Trust Fund
101 Changes in Fiduciary Net Position – Retiree Health Care Trust Fund
102 Revenues by Source
102 Expenses by Type
102 Benefit Expenses by Type
103 DROP Program Balances
REVENUE CAPACITY INFORMATION
104 Active Member and Total Payroll Base Statistics
104 Active Membership Data
105 Retired Membership by Type of Benefits
106 Retirees and Beneficiaries Statistics
106 Average Monthly Benefit Payments
107 Member Health Care Contributions
107 State of Ohio Subsidy Payments
108 Employer Contribution Rates
108 Member Contribution Rates
108 Health Care Allocation Rates from Employer Contributions
109 OP&F’s Cost of Living Allowance (COLA) History
111 Actuarial Interest Rates
111 DROP and Re-employed Interest Rates
112 DROP Member Count Roll Forward
112 Actuarial Valuation Information – Pension Trust Fund
113 Actuarial Valuation Information – Retiree Health Care Trust Fund
114 Historical Annual Investment Results
DEBT CAPACITY INFORMATION
DEMOGRAPHIC AND ECONOMIC INFORMATION
115 Number of Employer Units
OPERATING INFORMATION
116 Retired Membership by Type of Benefits and Average Annual Allowance
117 Schedule of Average Benefits
118 Principal Participating Employers
119 OP&F Employee Budgeted Position Counts
119 Personnel Salaries by Year
119 OP&F Budget
120 Other Operating Statistics
121 Death Benefit Fund
122 Economic Impact
LIST OF PROFESSIONAL ACRONYMNS AND SYMBOLS
TABLE OF CONTENTS(continued)

2016
CO
MP
REH
ENSI
VE A
NN
UA
L FI
NA
NC
IAL
REP
OR
T | O
HIO
PO
LIC
E &
FIR
E P
ENSI
ON
FU
ND
BOARD OF TRUSTEES
ADMINISTRATIVE STAFF
PROFESSIONAL CONSULTANTS
AWARDS
LETTER OF TRANSMITTAL

INTRODUC TION 2016 Comprehensive Annual Financial Report
Page vi • OP&F
BOARD OF TRUSTEES
About the Board of TrusteesOhio law provides for the Ohio Police & Fire Pension Fund (OP&F) Board of Trustees to be comprised of nine members. There are six employee members elected to four-year terms by their respective member groups: two active representatives of police departments, two active representatives of fire departments, one retired police officer and one retired firefighter. The Board of Trustees also includes three statutory members. Each statutory member – one appointed by the Governor of Ohio, one by the Ohio Treasurer of State and one appointed jointly by the Ohio Senate President and the Ohio Speaker of the House – must have professional investment expertise.
The OP&F Board of Trustees appoints the Executive Director, an actuary and other advisors necessary for the transaction of business. By law, the Ohio Treasurer of State is custodian of OP&F’s funds. The Board of Trustees meets monthly, except for one month each year. In 2016, the Board of Trustees did not meet in the month of July and in 2017 the Board of Trustees will not meet in the month of July. The Board of Trustees receives no compensation, but is reimbursed for necessary expenses.
William E. DeightonRetired, Cleveland Fire, term began on June 1, 2015, expires on June 2, 2019.
Daniel J. DesmondToledo Fire, term began on June 1, 2015, expires on June 2, 2019.
Edward L. MontgomeryChair, Columbus Police, term began on June 6, 2016, expires on May 31, 2020.
Jeffrey H. MooreChair Elect, West Chester Fire, term began on June 1, 2015, expires on June 2, 2019.
Timothy P. Patton, Jr.Cleveland Police, term began on June 1, 2015, expires June 2, 2019.
John L. WainscottVice Chair, Retired, Cincinnati Police, term began on June 6, 2016, expires on May 31, 2020.
J. David HellerInvestment Expert Member, appointed by the Ohio Senate and the Ohio House of Representatives, term began on Nov. 5, 2016, expires on Nov. 5, 2020.
Karin Maloney StiflerInvestment Expert Member, appointed by the Ohio Treasurer of State, term began March 4, 2015, expires on March 4, 2019.
Board of Trustee Members
William E. Deighton Jeffrey H. MooreDaniel J. Desmond
John L. Wainscott
Edward L. Montgomery
J. David HellerTimothy P. Patton, Jr. Karin Maloney Stifler

INTRODUC TION2016 Comprehensive Annual Financial Report
OP&F • Page vii
ADMINISTRATIVE STAFF
John J. Gallagher, Jr.Executive Director
Scott K. MillerDeputy Executive Director
Mary Beth FoleyGeneral Counsel
Theodore G. HallChief Investment Officer
Caren R. SparksChief Audit Executive/Privacy and Ethics Officer
Maureen L. GatewoodBusiness and Technology Solutions Director
Jennifer L. HarvilleMember Services Director
ActuaryConduent (Formally known as Buck Consultants, LLC)
Legal CounselOhio Attorney General, the Honorable Mike DeWine
Custodian of OP&F’s FundsOhio Treasurer of State, Josh Mandel
Custodial BanksHuntington National Bank - DomesticNorthern Trust Company - International
Independent AccountantsRSM US LLP(Under contract with the Ohio Auditor of State)
Medical AdvisorsGregory M. Jewell, M.D., M.S., M.M.M., OP&F Board Medical AdvisorJoel S. Steinberg, M.D., Disability Evaluation Panel Medical Advisor
Investment Consultants and Money Managers(See page 62)
Schedule of Brokers’ Fees Paid (See page 63)
Executive Staff Professional Consultants (not pictured)
Caren R. Sparks
John J. Gallagher, Jr. Scott K. Miller Mary Beth Foley Theodore G. Hall
Maureen L. Gatewood Jennifer L. Harville

INTRODUC TION 2016 Comprehensive Annual Financial Report
Page viii • OP&F
AWARDS
OP&F has been recognized by financial experts for their commitment to the highest possible fiscal standards. OP&F is honored to have been recognized with the following:
2015 Certificate of Achievement for Excellence in Financial ReportingFor 27 years, the Government Finance Officers Association of the United States and Canada (GFOA) awarded a Certificate of Achievement for Excellence in Financial Reporting to OP&F for its Comprehensive Annual Financial Report. In order to be awarded a Certificate of Achievement, a government must publish an easily readable and efficiently organized comprehensive annual financial report that satisfies both generally accepted accounting principles and applicable legal requirements.
2016 Distinguished Budget Presentation Award OP&F was again recognized by GFOA’s Distinguished Budget Presentation Award in 2016, representing the 15th consecutive year OP&F has achieved this distinction. OP&F has received the award annually since 2002. The GFOA established the Distinguished Budget Presentation Awards Program (Budget Awards Program) in 1984 to encourage and assist state and local governments to prepare budget documents of the very highest quality that reflect both the guidelines established by the National Advisory council on State and Local Budgeting and the GFOA’s best practices on budgeting and then to recognize individual governments that succeed in achieving that goal.

INTRODUC TION2016 Comprehensive Annual Financial Report
OP&F • Page ix
AWARDS
2015 Award for Outstanding Achievement in Popular Annual Financial ReportingFor 15 years, the GFOA has awarded a Certificate of Outstanding Achievement in Popular Annual Financial Reporting to OP&F for its Popular Annual Financial Report. This award is a prestigious national award recognizing conformance with the highest standards of creativity, presentation, understandability and reader appeal for preparation of governmental popular reports.
2016 Public Pension Standards Award Awarded to OP&F by the Public Pension Coordinating Council (PPCC). OP&F has received the award annually since 2009. This award recognizes OP&F’s professional standards attained for administration. The PPCC’s standards were established in 2002 to promote excellence in pension plan design and administration. These standards serve as a benchmark by which to measure current practices of defined benefit plans.
Public Pension Coordinating Council
Recognition Award for Administration
2016
Presented to
Ohio Police & Fire Pension Fund
In recognition of meeting professional standards for plan administration as
set forth in the Public Pension Standards.
Presented by the Public Pension Coordinating Council, a confederation of
National Association of State Retirement Administrators (NASRA) National Conference on Public Employee Retirement Systems (NCPERS)
National Council on Teacher Retirement (NCTR)
Alan H. Winkle
Program Administrator
P CP C
INTRODUC TION 2016 Comprehensive Annual Financial Report
Page x • OP&F
LETTER OF TRANSMITTAL
June 29, 2017 Dear Chair and Members of the Board of Trustees:
We are pleased to submit to you the Comprehensive Annual Financial Report (CAFR) of the Ohio Police & Fire Pension Fund (OP&F) for the fiscal year ending Dec. 31, 2016. This CAFR was prepared to aid interested parties in assessing OP&F’s financial status on Dec. 31, 2016 and its results for the year then ended.
Accounting System and Internal Controls
The financial statements were prepared in accordance with accounting principles generally accepted in the United States of America (U.S.) applicable to governmental units, including the pronouncements of the Governmental Accounting Standards Board (GASB). Additional information on OP&F’s significant accounting policies is contained in the Notes to the Basic Financial Statements in the Financial Section.
Management is responsible for establishing and maintaining an effective internal control structure designed to ensure that the assets of OP&F are protected from loss, theft, or misuse; and to ensure that adequate accounting data is compiled to allow for the preparation of Basic Financial Statements in conformity with accounting principles generally accepted in the U.S. The internal control structure is designed to provide reasonable, but not absolute, assurance that these objectives are met. The concept of reasonable assurance recognizes that:
(1) the cost of a control should not exceed the benefits likely to be derived; and
(2) the valuation of costs and benefits requires estimates and judgments by management.
Management believes its internal control structure meets these objectives.
OP&F History and Overview
OP&F is a cost-sharing, multiple–employer public employee retirement system and was created by the Ohio General Assembly in 1965, replacing 454 separate local police and firefighter relief and pension funds in Ohio. OP&F began operating as a statewide Retirement Fund on Jan. 1, 1967. On that date, the local pension funds transferred their assets and liabilities to OP&F. Assets transferred to OP&F totaled approximately $75 million, while OP&F’s actuary computed the liabilities accrued up to 1966 at approximately $490 million. Employers are paying the remaining unfunded accrued liability, which began in 1969, over a 67-year period. As of Dec. 31, 2016, the balance totaled nearly $22.8 million.
OP&F provides pension, disability, deferred retirement option plan (DROP) and health care benefits to qualified members. In addition, OP&F provides survivor benefits, death benefits and sponsors health care programs for eligible survivors, spouses, children and dependent parents. Please refer to the Plan Summary in the Actuarial Section for further information on plan benefits.
140 East Town Street / Columbus, Ohio 43215-5164 / Tel. (614) 228-2975 / www.op-f.org
INTRODUC TION2016 Comprehensive Annual Financial Report
OP&F • Page xi
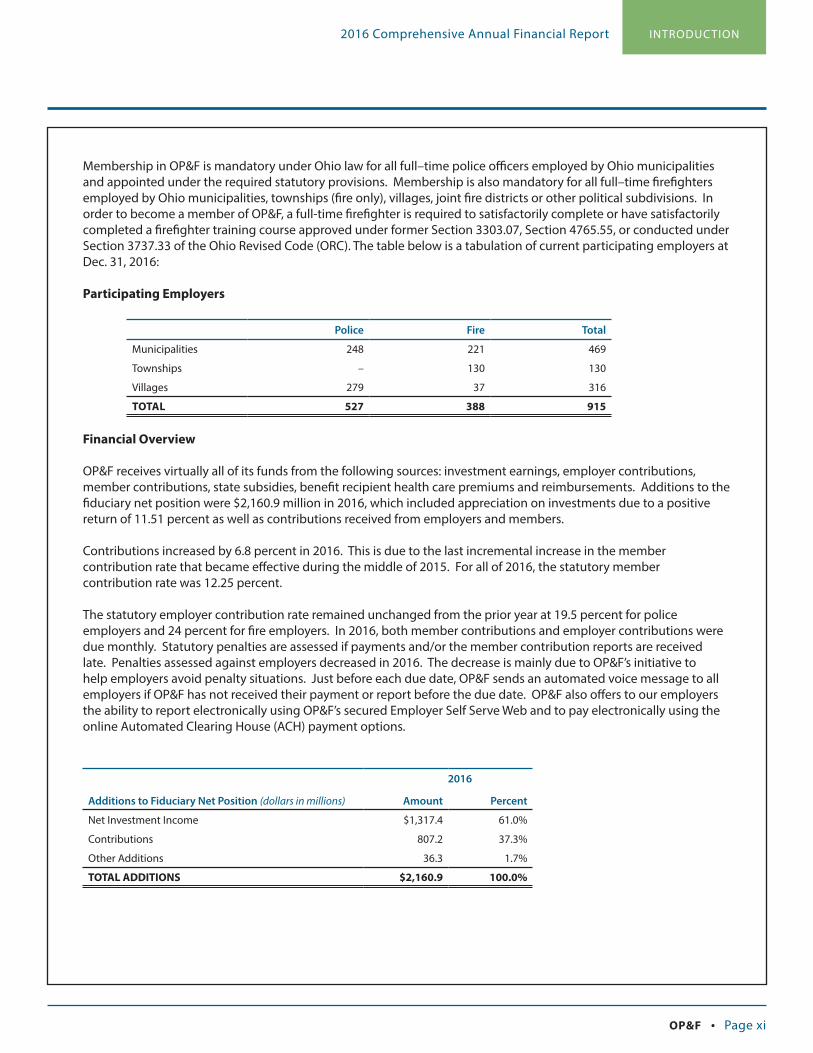
Membership in OP&F is mandatory under Ohio law for all full–time police officers employed by Ohio municipalities and appointed under the required statutory provisions. Membership is also mandatory for all full–time firefighters employed by Ohio municipalities, townships (fire only), villages, joint fire districts or other political subdivisions. In order to become a member of OP&F, a full-time firefighter is required to satisfactorily complete or have satisfactorily completed a firefighter training course approved under former Section 3303.07, Section 4765.55, or conducted under Section 3737.33 of the Ohio Revised Code (ORC). The table below is a tabulation of current participating employers at Dec. 31, 2016:
Participating Employers
Police Fire Total
Municipalities 248 221 469
Townships – 130 130
Villages 279 37 316
TOTAL 527 388 915
Financial Overview
OP&F receives virtually all of its funds from the following sources: investment earnings, employer contributions, member contributions, state subsidies, benefit recipient health care premiums and reimbursements. Additions to the fiduciary net position were $2,160.9 million in 2016, which included appreciation on investments due to a positive return of 11.51 percent as well as contributions received from employers and members.
Contributions increased by 6.8 percent in 2016. This is due to the last incremental increase in the member contribution rate that became effective during the middle of 2015. For all of 2016, the statutory member contribution rate was 12.25 percent.
The statutory employer contribution rate remained unchanged from the prior year at 19.5 percent for police employers and 24 percent for fire employers. In 2016, both member contributions and employer contributions were due monthly. Statutory penalties are assessed if payments and/or the member contribution reports are received late. Penalties assessed against employers decreased in 2016. The decrease is mainly due to OP&F’s initiative to help employers avoid penalty situations. Just before each due date, OP&F sends an automated voice message to all employers if OP&F has not received their payment or report before the due date. OP&F also offers to our employers the ability to report electronically using OP&F’s secured Employer Self Serve Web and to pay electronically using the online Automated Clearing House (ACH) payment options.
2016
Additions to Fiduciary Net Position (dollars in millions) Amount Percent
Net Investment Income $1,317.4 61.0%
Contributions 807.2 37.3%
Other Additions 36.3 1.7%
TOTAL ADDITIONS $2,160.9 100.0%

INTRODUC TION 2016 Comprehensive Annual Financial Report
Page xii • OP&F
2016
Deductions to Fiduciary Net Position (dollars in millions) Amount Percent
Benefits $1,396.4 97.6%
Refund of Member Contributions 14.2 1.0%
Administrative and Other Expenses 19.6 1.4%
TOTAL DEDUCTIONS $1,430.2 100.0%
Benefit payments represent the largest deduction and usage of the additions to fiduciary net position. In 2016, OP&F experienced a 1.9 percent increase in retirement benefits. This increase is due to a three percent cost-of-living allowance (COLA) for eligible benefit recipients and a 1.6 percent increase in the number of beneficiaries receiving pension benefits.
Service retirement benefits increased 6.5 percent, and survivor and disability benefits increased at a lower rate of 1.7 percent. In addition, DROP withdrawals decreased 15.5 percent. There was also a 4.8 percent increase in the amount of health care benefit payments due to normal cost trend increases and increased utilization of both the medical and prescription drug benefits.
Administrative and other expenses increased this year by 20.2 percent. This increase is primarily due to an increase in GASB 68 pension expense. In accordance with GASB 68, OP&F is required to recognize its proportionate share of OPERS net pension liability and also amortize certain changes in this liability as pension expense based on the amortization schedule. Refunds of member contributions increased slightly in 2016 and other deductions were not material to the overall change in plan assets.
Please refer to the Management’s Discussion and Analysis in the Financial Section for additional financial details.
Funding Practices and Actuarial Overview
Funds are derived from the excess of additions over deductions and are accumulated by OP&F in order to meet current and future benefit obligations to retirees and other beneficiaries. OP&F experienced a $730.7 million increase in the 2016 fiduciary net position primarily due to the appreciation of the fair value of investments. OP&F also administers a self-insured health care plan for its members. A portion of employer contributions and a portion of investment income are both set aside to operate the health care program.
The OP&F investment portfolio achieved a return of 11.51 percent in 2016. By adhering to the sound principles and strategies that are in place, OP&F is strategically positioned to weather market fluctuations. As of Dec. 31, 2016, total investments at fair value stood at $14.5 billion.
In 2016, OP&F achieved a 29-year amortization period and in 2015 OP&F achieved a 30-year amortization period on the annual actuarial valuations completed by Conduent. This is a direct reflection of the pension legislation changes enacted in 2012. The report also shows that OP&F’s pension funding ratio as of Jan. 1, 2016 was 71.3 percent based on the actuarial value of assets. The report confirms that OP&F continues to be able to meet its current and future pension obligations. As of the same date, OP&F’s health care funding ratio was 18.0 percent with a solvency period until the year 2025, or nine more years.

INTRODUC TION2016 Comprehensive Annual Financial Report
OP&F • Page xiii
A report by Wilshire, an independent investment consultant, showed that OP&F’s investment portfolio continues its exceptional performance. In 2016, OP&F’s performance ranked in the top one percent of its relevant peer group, with an 11.51 percent return. OP&F’s portfolio returns ranked in the top nine percent in the 10-year period and ranked in the top five percent in the five-year period ending December 2016. In the 10-year period, OP&F realized a 6.31 percent annualized return on investments while the five-year period realized 10.09 percent and the three-year period realized 6.25 percent. The three-year investment period lagged the assumed rate of return of 8.25 percent by 200 basis points (bps), but the five-year return outpaced OP&F’s assumed rate of return by 184 bps.
Please see the Notes to the Basic Financial Statements, the Statistical Section and the Required Supplementary Information (RSI) Sections of this report for more detailed information.
Investment Policy
OP&F invests all available funds in order to maximize both current income and long–term appreciation. The primary objective of OP&F’s investment policy is to ensure that OP&F meets its responsibilities for providing retirement and other benefits. The investment portfolio is diversified to provide adequate cash flow and to provide the highest possible total return for OP&F’s assets while maintaining an acceptable level of risk. OP&F’s total rate of return on its investment portfolio was favorable with a gain of 11.51 percent in 2016.
Details of portfolio composition, rates of return, analysis of significant economic conditions, and additional information concerning OP&F’s investment policy are provided in the Investment Section of this report.
Material Plan Amendments
There were no material plan amendments in 2016. See the Actuarial Section for the assumptions used within this report.
Independent Audit
RSM US LLP, independent certified public accountants, audited the financial statements of OP&F for the year ended Dec. 31, 2016, and their opinion thereon is included in the Financial Section.
Notes to Basic Financial Statements
The Notes to the Basic Financial Statements, which follow the Basic Financial Statements, contain additional information and are an integral part of such statements.
Certificate of Achievement
The Government Finance Officers Association of the United States and Canada (GFOA) awarded a Certificate of Achievement for Excellence in Financial Reporting to OP&F for its CAFR for the fiscal year ended Dec. 31, 2015. The Certificate of Achievement is the highest form of recognition for excellence in state and local government financial reporting.
In order to be awarded a Certificate of Achievement, a government unit must publish an easily readable and

INTRODUC TION 2016 Comprehensive Annual Financial Report
Page xiv • OP&F
efficiently organized CAFR, whose contents conform to program standards. Such reports must satisfy both accounting principles generally accepted in the U.S. and applicable legal requirements. A Certificate of Achievement is valid for a period of one year only. OP&F believes the current report continues to conform to the Certificate of Achievement Program requirements and is submitting it to the GFOA to determine its eligibility for another certificate.
Acknowledgments
The preparation and contents of this report reflect the combined efforts of OP&F’s staff under the direction of the Board of Trustees and are the responsibility of OP&F’s management staff. It is intended to provide complete and reliable information as a basis for making management decisions, to disclose compliance with legal provisions and as a means of demonstrating responsible stewardship for the assets contributed by the members and their employers.
The cooperation of OP&F’s employers is vital to our success and is greatly appreciated.
Respectfully submitted,
John J. Gallagher, Jr. Scott K. MillerExecutive Director Deputy Executive Director

2016
CO
MP
REH
ENSI
VE A
NN
UA
L FI
NA
NC
IAL
REP
OR
T | O
HIO
PO
LIC
E &
FIR
E P
ENSI
ON
FU
ND
INDEPENDENT AUDITOR’S REPORT
MANAGEMENT’S DISCUSSION AND ANALYSIS (UNAUDITED)
BASIC FINANCIAL STATEMENTSStatement of Fiduciary Net Position
Statement of Changes in Fiduciary Net Position
Notes to Basic Financial Statements
REQUIRED SUPPLEMENTARY INFORMATION (UNAUDITED)Schedule of Changes in the Employers’ Net Pension Liability
Schedule of Employers’ Net Pension Liability (Asset)
Schedule of Employer Contributions - Pension Trust Fund
Schedule of Investment Returns
Notes to Required Supplementary Information
Schedule of Funding Progress - Retiree Health Care Trust Fund
Schedule of Employer Contributions - Retiree Health Care Trust Fund
Schedule of OP&F’s Proportionate Share of the Net Pension Liability Ohio Public Employees Retirement Plan
Schedule of Contributions Ohio Public Employees Retirement Plan
ADDITIONAL INFORMATIONSchedule of Administrative Expenses
Schedule of Investment Expenses
Combining Statement of Changes in Assets and Liabilities - Public Safety Officers Death Benefit Fund

FINANCIAL SECTION 2016 Comprehensive Annual Financial Report
Page 2 • OP&F
INDEPENDENT AUDITOR’S REPORT
1
Independent Auditor’s Report The Board of Trustees Ohio Police & Fire Pension Fund and The Honorable Dave Yost Columbus, Ohio Report on the Financial Statements We have audited the accompanying basic financial statements of Ohio Police & Fire Pension Fund, which comprise the statement of fiduciary net position as of December 31, 2016, and the related statement of changes in fiduciary net position for the year ended December 31, 2016, and the related notes to the financial statements, (collectively, basic financial statements). Management’s Responsibility for the Financial Statements Management is responsible for the preparation and fair presentation of these financial statements in accordance with accounting principles generally accepted in the United States of America; this includes the design, implementation, and maintenance of internal control relevant to the preparation and fair presentation of financial statements that are free from material misstatement, whether due to fraud or error. Auditor’s Responsibility Our responsibility is to express an opinion on these financial statements based on our audit. We conducted our audit in accordance with auditing standards generally accepted in the United States of America and the standards applicable to financial audits contained in Government Auditing Standards, issued by the Comptroller General of the United States. Those standards require that we plan and perform the audit to obtain reasonable assurance about whether the financial statements are free from material misstatement. An audit involves performing procedures to obtain audit evidence about the amounts and disclosures in the financial statements. The procedures selected depend on the auditor’s judgment, including the assessment of the risks of material misstatement of the financial statements, whether due to fraud or error. In making those risk assessments, the auditor considers internal control relevant to the entity’s preparation and fair presentation of the financial statements in order to design audit procedures that are appropriate in the circumstances, but not for the purpose of expressing an opinion on the effectiveness of the entity’s internal control. Accordingly, we express no such opinion. An audit also includes evaluating the appropriateness of accounting policies used and the reasonableness of significant accounting estimates made by management, as well as evaluating the overall presentation of the financial statements. We believe that the audit evidence we have obtained is sufficient and appropriate to provide a basis for our audit opinion. Opinion In our opinion, the basic financial statements referred to above present fairly, in all material respects, the fiduciary net position of Ohio Police & Fire Pension Fund as of December 31, 2016, and the changes in fiduciary net position for the year then ended in accordance with accounting principles generally accepted in the United States of America.
Independent Auditor’s Report The Board of Trustees Ohio Police & Fire Pension Fund and The Honorable Dave Yost Columbus, Ohio Report on the Financial Statements We have audited the accompanying basic financial statements of Ohio Police & Fire Pension Fund, which comprise the statements of fiduciary net position as of December 31, 2015 and 2014, and the related statements of changes in fiduciary net position for the years ended December 31, 2015 and 2014, and the related notes to the financial statements, (collectively, basic financial statements). Management’s Responsibility for the Financial Statements Management is responsible for the preparation and fair presentation of these financial statements in accordance with accounting principles generally accepted in the United States of America; this includes the design, implementation, and maintenance of internal control relevant to the preparation and fair presentation of financial statements that are free from material misstatement, whether due to fraud or error. Auditor’s Responsibility Our responsibility is to express an opinion on these financial statements based on our audits. We conducted our audits in accordance with auditing standards generally accepted in the United States of America and the standards applicable to financial audits contained in Government Auditing Standards, issued by the Comptroller General of the United States. Those standards require that we plan and perform the audit to obtain reasonable assurance about whether the financial statements are free from material misstatement. An audit involves performing procedures to obtain audit evidence about the amounts and disclosures in the financial statements. The procedures selected depend on the auditor’s judgment, including the assessment of the risks of material misstatement of the financial statements, whether due to fraud or error. In making those risk assessments, the auditor considers internal control relevant to the entity’s preparation and fair presentation of the financial statements in order to design audit procedures that are appropriate in the circumstances, but not for the purpose of expressing an opinion on the effectiveness of the entity’s internal control. Accordingly, we express no such opinion. An audit also includes evaluating the appropriateness of accounting policies used and the reasonableness of significant accounting estimates made by management, as well as evaluating the overall presentation of the financial statements. We believe that the audit evidence we have obtained is sufficient and appropriate to provide a basis for our audit opinions. Opinions In our opinion, the basic financial statements referred to above present fairly, in all material respects, the fiduciary net position of Ohio Police & Fire Pension Fund as of December 31, 2015 and 2014, and the changes in fiduciary net position for the years then ended in accordance with accounting principles generally accepted in the United States of America. Emphasis of Matter As discussed in Note 14 to the basic financial statements, the 2014 financial statements, specifically certain disclosures and required supplementary information, have been restated to correct a misstatement. Our opinion is not modified with respect to this matter.

FINANCIAL SECTION2016 Comprehensive Annual Financial Report
OP&F • Page 3
Independent Auditor’s Report (Continued)
2
Other Matters Required Supplementary Information Accounting principles generally accepted in the United States of America require that management’s discussion and analysis and the schedules of funding progress and employer contributions and related notes, as listed in the table of contents, be presented to supplement the basic financial statements. Such information, although not a part of the basic financial statements, is required by the Governmental Accounting Standards Board who considers it to be an essential part of financial reporting for placing the basic financial statements in an appropriate operational, economic, or historical context. We have applied certain limited procedures to the required supplementary information in accordance with auditing standards generally accepted in the United States of America, which consisted of inquiries of management about the methods of preparing the information and comparing the information for consistency with management’s responses to our inquiries, the basic financial statements, and other knowledge we obtained during our audit of the basic financial statements. We do not express an opinion or provide any assurance on the information because the limited procedures do not provide us with sufficient evidence to express an opinion or provide any assurance. Other Information Our audit was conducted for the purpose of forming an opinion on the financial statements that collectively comprise Ohio Police & Fire Pension Fund’s basic financial statements. The additional information, including the schedule of administrative expenses, schedule of investment expenses, and the combining statement of changes in assets and liabilities – public officers’ death benefit fund, as listed in the table of contents, are presented for purposes of additional analysis and are not a required part of the basic financial statements. The additional information is the responsibility of management and was derived from and relates directly to the underlying accounting and other records used to prepare the basic financial statements. Such information has been subjected to the auditing procedures applied in the audit of the basic financial statements and certain additional procedures, including comparing and reconciling such information directly to the underlying accounting and other records used to prepare the basic financial statements or to the basic financial statements themselves, and other additional procedures in accordance with auditing standards generally accepted in the United States of America. In our opinion, the additional information is fairly stated, in all material respects, in relation to the basic financial statements as a whole. The introductory, investments, actuarial and statistical sections, as listed in the table of contents have not been subjected to the auditing procedures applied in the audit of the basic financial statements, and accordingly, we do not express an opinion or provide any assurance on them. Other Reporting Required by Government Auditing Standards In accordance with Government Auditing Standards, we have also issued our report dated June 28, 2017 on our consideration of Ohio Police & Fire Pension Fund's internal control over financial reporting and on our tests of its compliance with certain provisions of laws, regulations, contracts, and grant agreements and other matters. The purpose of that report is to describe the scope of our testing of internal control over financial reporting and compliance and the results of that testing, and not to provide an opinion on internal control over financial reporting or on compliance. That report is an integral part of an audit performed in accordance with Government Auditing Standards in considering Ohio Police & Fire Pension Fund’s internal control over financial reporting and compliance.
Columbus, Ohio June 28, 2017

FINANCIAL SECTION 2016 Comprehensive Annual Financial Report
Page 4 • OP&F
MANAGEMENT’S DISCUSSION AND ANALYSIS (UNAUDITED)This Management Discussion and Analysis (MD&A) of OP&F’s financial performance provides a narrative overview of financial activities for the fiscal year ended Dec. 31, 2016. The MD&A is designed to focus on the current year’s activities, resulting changes and currently known facts. OP&F encourages reading this in conjunction with the Basic Financial Statements, Notes to the Basic Financial Statements and the Letter of Transmittal included in the Introductory Section of this CAFR.
Historically, OP&F’s Comprehensive Annual Financial Report (CAFR) presented combined financial statements for two comparative years. Beginning in 2016, OP&F’s CAFR presents financial statements for the most recent year end only. Management elected to make the change due to the increased reporting requirements of the Governmental Accounting Standards Board (GASB). Management’s goal was to streamline the Financial Section of the CAFR to include only the required information. Users of this CAFR can refer to the Statistical Section for historical financial information.
FINANCIAL HIGHLIGHTS Additions are received primarily from investment income and employer and member pension contributions. For fiscal year 2016, these additions totaled $2,160.9 million compared to $774.9 million in 2015, which is a 178.9 percent increase.
Investment income can fluctuate dramatically because it includes realized and unrealized investment gains and losses based on performance of global capital markets.
The employer contribution rates of 19.5 percent for police and 24 percent for fire remained unchanged in both 2016 and 2015. The member contribution rate was 12.25 percent for both police and fire in 2016. From Jan. 1, 2015 to July 1, 2015 the member contribution rate was 11.5 percent. From July 2, 2015 to Dec. 31, 2015 the member contribution rate increased to 12.25 percent. This increase was part of S.B. 340 where member contributions gradually increased over a three year period by 0.75 percent each year from 10.0 percent to 12.25. This increase in the member contribution rate was the first since 1988.
Deductions are incurred primarily for the purpose for which OP&F was created; the payment of pension, disability and survivor benefits to qualified members and survivors. Included in the deductions from OP&F’s fiduciary net position for 2016 were benefits for retirement, DROP, disability, health care and survivors. Also included were contribution refunds, administrative and other expenses. Pension benefits are funded through a combination of investment earnings and employer and member contributions. Health care expenses are funded on a self insured basis through a portion of employer contributions, health care premiums and
$0Employer
Contributions21.5% or $465.4
Member Contributions
12.4% or $268.6
Health Care Contributions3.4% or $73.2
Investment Income
61.0% or $1,317.4
Other Income1.7% or $36.3
Bene�ts82.0% or $1,172.8
Health Care15.6% or $223.6
Refunds1.0% or $14.2
Administrativeand Other Expenses
1.4% or $19.6
$0
$200
$400
$600
$800
$1,000
$1,200
$200
$400
$600
$800
$1,000
$1,200
$1,400
$0Employer
Contributions21.5% or $465.4
Member Contributions
12.4% or $268.6
Health Care Contributions3.4% or $73.2
Investment Income
61.0% or $1,317.4
Other Income1.7% or $36.3
Bene�ts82.0% or $1,172.8
Health Care15.6% or $223.6
Refunds1.0% or $14.2
Administrativeand Other Expenses
1.4% or $19.6
$0
$200
$400
$600
$800
$1,000
$1,200
$200
$400
$600
$800
$1,000
$1,200
$1,4002016 ADDITIONS (DOLLARS IN MILLIONS) $2,160.9
2016 DEDUCTIONS (DOLLARS IN MILLIONS) $1,430.2

FINANCIAL SECTION2016 Comprehensive Annual Financial Report
OP&F • Page 5
investment income. Deductions totaled $1,430.2 million in 2016 and were $1,400.0 million in 2015, which is a 2.2 percent increase over 2015. Please refer to the Plan Summary in the Actuarial Section for further information on plan benefits.
OP&F administers the State of Ohio Public Safety Officers Death Benefit Fund. This program was established by the State of Ohio to provide monthly benefit payments to eligible surviving family members of Ohio public safety officers who have been killed in the line of duty or die of a duty-related injury or illness. Funds are disbursed to OP&F on a quarterly basis and are paid monthly by OP&F to eligible recipients. Annually the unused balance is returned to the State of Ohio. The Public Safety Officers Death Benefit Fund is considered to be an agency fund administered by OP&F and accordingly, its assets of $0.5 million and $0.7 million at Dec. 31, 2016 and 2015, respectively, and the related liability for unpaid benefits as of the same dates are included in the accompanying financial statements.
OVERVIEW OF FINANCIAL STATEMENTSFollowing the MD&A are the Statement of Fiduciary Net Position and the Statement of Changes in Fiduciary Net Position. OP&F’s financial statements are prepared using the accrual basis of accounting and are in compliance with applicable GASB Statements.
The Statement of Fiduciary Net Position provides a snapshot view at year–end for the amount OP&F has accumulated in assets to pay for benefits. The Statement of Changes in Fiduciary Net Position reflects what has happened to OP&F’s assets during the fiscal year. If the fiduciary net position increased, then additions were greater than the deductions. If the fiduciary net position decreased, then additions were less than the deductions.
In addition to the Basic Financial Statements and accompanying Notes to the Basic Financial Statements, certain Required Supplementary Information (RSI) is provided. The RSI consists of information pertaining to OP&F’s actuarial methods and assumptions and provides data on the net pension liability and the changes in net pension liability. Also included in the RSI is data on contributions from employers, data on the funding progress for the retiree health care trust fund, and other information useful in evaluating the financial condition of OP&F. Following the RSI are Schedules of Administrative Expenses and the Schedule of Investment Expenses.
In accordance with GASB Statement No. 68, Accounting and Financial Reporting for Pensions, which significantly revised accounting for pension costs and liabilities, OP&F recorded as a liability its proportionate share of the Ohio Public Employees
Retirement System (OPERS) Net Pension Liability (NPL). However, OP&F is not responsible for certain key factors affecting the balance of this liability. In Ohio, the employee shares the obligation of funding pension benefits with the employer. Both employer and employee contribution rates are set by state statute. Benefit provisions are also determined by state statute. Ohio law does not currently place responsibility for unfunded liabilities on the municipal employers who participate in OPERS. The pension system is responsible for the administration of the plan.
Most long-term liabilities have set repayment schedules or, in the case of compensated absences (i.e. sick and vacation leave) are satisfied through paid time-off or termination payments. There is no repayment schedule for the NPL. Changes in pension benefits, contribution rates and return on investments affect the balance of the NPL, but are outside the control of the public employer. In the event that contributions, investment returns and other changes are insufficient to keep up with required pension payments, state statute does not assign or identify the responsible party for the unfunded portion.
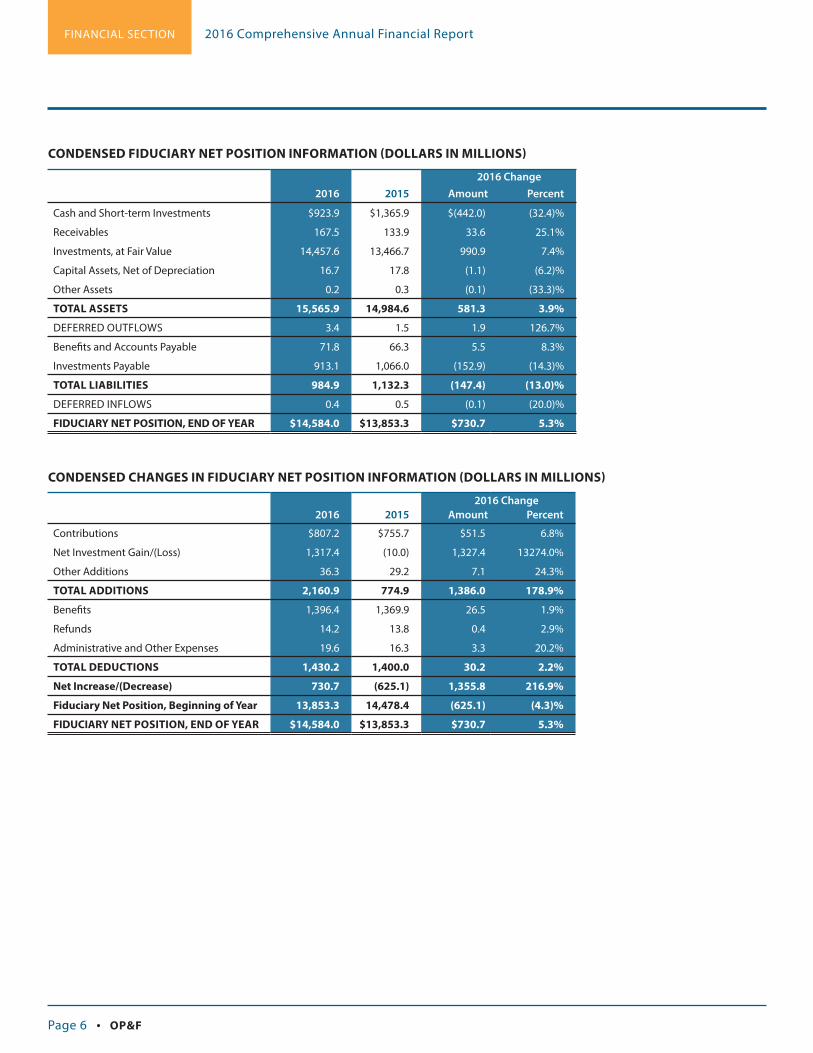
A condensed version of OP&F’s financial information is being provided as part of this discussion.
FINANCIAL SECTION 2016 Comprehensive Annual Financial Report
Page 6 • OP&F
CONDENSED CHANGES IN FIDUCIARY NET POSITION INFORMATION (DOLLARS IN MILLIONS)
2016 Change2016 2015 Amount Percent
Contributions $807.2 $755.7 $51.5 6.8%
Net Investment Gain/(Loss) 1,317.4 (10.0) 1,327.4 13274.0%
Other Additions 36.3 29.2 7.1 24.3%
TOTAL ADDITIONS 2,160.9 774.9 1,386.0 178.9%
Benefits 1,396.4 1,369.9 26.5 1.9%
Refunds 14.2 13.8 0.4 2.9%
Administrative and Other Expenses 19.6 16.3 3.3 20.2%
TOTAL DEDUCTIONS 1,430.2 1,400.0 30.2 2.2%
Net Increase/(Decrease) 730.7 (625.1) 1,355.8 216.9%
Fiduciary Net Position, Beginning of Year 13,853.3 14,478.4 (625.1) (4.3)%
FIDUCIARY NET POSITION, END OF YEAR $14,584.0 $13,853.3 $730.7 5.3%
CONDENSED FIDUCIARY NET POSITION INFORMATION (DOLLARS IN MILLIONS)
2016 Change2016 2015 Amount Percent
Cash and Short-term Investments $923.9 $1,365.9 $(442.0) (32.4)%
Receivables 167.5 133.9 33.6 25.1%
Investments, at Fair Value 14,457.6 13,466.7 990.9 7.4%
Capital Assets, Net of Depreciation 16.7 17.8 (1.1) (6.2)%
Other Assets 0.2 0.3 (0.1) (33.3)%
TOTAL ASSETS 15,565.9 14,984.6 581.3 3.9%
DEFERRED OUTFLOWS 3.4 1.5 1.9 126.7%
Benefits and Accounts Payable 71.8 66.3 5.5 8.3%
Investments Payable 913.1 1,066.0 (152.9) (14.3)%
TOTAL LIABILITIES 984.9 1,132.3 (147.4) (13.0)%
DEFERRED INFLOWS 0.4 0.5 (0.1) (20.0)%
FIDUCIARY NET POSITION, END OF YEAR $14,584.0 $13,853.3 $730.7 5.3%

FINANCIAL SECTION2016 Comprehensive Annual Financial Report
OP&F • Page 7
FINANCIAL ANALYSISFIDUCIARY NET POSITION
The fiduciary net position available for benefits and expenses in 2016 was $14,584.0 million versus $13,853.3 million in 2015, which represents a 5.3 percent net increase. The overall net increase in 2016 can be primarily attributed to net appreciation on the fair value of investments. Please refer to the Investment Section for additional information on OP&F’s investment activities in 2016.
REVENUE ADDITIONS TO FIDUCIARY NET POSITION
Based on the rounded numbers found on page six, overall contributions received by OP&F in 2016 increased 6.8 percent, or $51.5 million, compared to 2015. These changes are due to fluctuations in member increases in the member contribution rate, the average annual salary and in the total annual payroll.
Pension contributions from employers increased $26.8 million, or 6.1 percent, in 2016. Employer pension contribution increases are due to an increase in the average annual salary and an increase in the total annual payroll. Employer contributions are not impacted by DROP and the employer contributions associated with DROP participation are not allocated to the individual DROP accounts.
In 2016, pension contributions from members increased $22.8 million, or 9.3 percent. The increase in 2016 can be attributed to the 4.2 percent increase in the average annual salary, from $70,163 to $73,083, while the active member population, or contributing members, decreased slightly by 145 to 27,624, or by 0.5 percent.
In 2016, member purchased service credit increased by $1.1 million, or 24.0 percent compared to 2015. These purchases fluctuate year-to-year based on the number and amount of the service credit being purchased by the membership.
Contributions paid by members and beneficiaries for their share of health care costs increased by 2.8 percent from $71.2 million in 2015 to $73.2 million in 2016. The annual changes in the contributions can be attributed to the annual increase in the premiums paid by plan participants along with fluctuations in the number of members and beneficiaries selecting to participate in the OP&F health care program.
In 2016, contributions received through the state-subsidy decreased 10.9 percent, or $48,474 from $446,735 to $398,161. This trend is due to a normal decline in the population of survivors receiving this subsidized benefit.
Investment net appreciation totaled $1,005.6 million in 2016. The net appreciation of 2016 can be attributed to a positive return of 11.51 percent from OP&F’s portfolio of investments. In 2015, investment net depreciation totaled $361.4 million. The net depreciation of 2015 can be attributed to a decrease in the fair values of high yield bonds and master limited partnerships (MLPs) as well as a net negative cash flow resulting from benefit payments being greater than contributions. The overall gross return on OP&F’s investments was 0.65 percent.
EXPENSE DEDUCTIONS FROM NET POSITION
Benefit deductions for retirement, DROP, disability and survivors increased $16.1 million or 1.4 percent in 2016. Part of the increases in pension benefits is due to the increases in the number of retirees and beneficiaries. The benefit recipients increased by 439 individuals, or 1.6 percent in 2016 and there was also a three percent COLA for eligible recipients.
In 2016, health care benefits increased by 4.9 percent, gross health care payments totaled $223.6 million and represented 15.6 percent of all plan deductions. In 2015, health care benefits totaled $213.2 million and represented 15.2 percent of all plan deductions. These increases in health care benefits can be attributed to increased trends in health care costs and to an expansion in the number of members and beneficiaries selecting to participate in the OP&F health care program.
Refunds to members increased by $0.4 million, or 2.9 percent in 2016. These refunds include actual refunds of pension contributions and member contributions on deposit for inactive members.

FINANCIAL SECTION 2016 Comprehensive Annual Financial Report
Page 8 • OP&F
Pensions Post-employment
Health Care 2016 Total
Death Benefit Agency Fund
Assets:Cash and Short-term Investments $865,269,067 $58,602,834 $923,871,901 $517,051
Receivables:Employers’ Contributions 49,272,280 1,165,711 50,437,991 -
Members’ Contributions 27,879,411 - 27,879,411 -
Accrued Investment Income 30,500,374 2,065,725 32,566,099 -
Investment Sales Proceeds 31,640,034 2,142,912 33,782,946 -
Local Funds Receivable 22,828,681 - 22,828,681 -
TOTAL RECEIVABLES 162,120,780 5,374,348 167,495,128 - Investments, at fair value:
Domestic Bonds 2,682,774,220 181,698,593 2,864,472,813 -
Non-U.S. Bonds 436,426,505 29,558,239 465,984,744 -
Mortgage and Asset-Backed Securities 403,077,455 27,299,579 430,377,034 -
Domesitc Stocks 2,920,962,012 197,830,546 3,118,792,558 -
International Equities 2,559,263,042 173,333,444 2,732,596,486 -
Real Estate 1,483,136,336 100,449,670 1,583,586,006 -
Commercial Mortgage Funds 35,055,176 2,374,213 37,429,389 -
Private Debt 279,935,932 18,959,465 298,895,397 -
Private Equity 856,768,620 58,027,117 914,795,737 -
Timber 282,318,228 19,120,813 301,439,041 -
Master Limited Partnerships 868,662,778 58,832,683 927,495,461 -
Domestic Derivatives (64,224) (4,350) (68,574) -
Non-U.S. Derivatives (715,644) (48,469) (764,113) -
TOTAL INVESTMENTS 12,807,600,436 867,431,543 13,675,031,979 - Collateral on Loaned Securities 732,899,564 49,637,729 782,537,293 -Capital Assets, net of accumulated depreciation, where applicable:
Land 3,200,000 - 3,200,000 -
Building and Improvements 12,114,785 - 12,114,785 -
Furniture and Equipment 141,288 - 141,288 -
Computer Software and Hardware 1,281,680 - 1,281,680 -
TOTAL CAPITAL ASSETS, NET 16,737,753 - 16,737,753 - Prepaid Expenses and Other 215,977 - 215,977 -
TOTAL ASSETS 14,584,843,577 981,046,454 15,565,890,031 517,051 DEFERRED OUTFLOWS OF RESOURCES
Deferred Outflows - Pension 3,427,827 - 3,427,827 -
Liabilities: Health Care Payable - 21,470,736 21,470,736 -
Investment Commitments Payable 122,317,055 8,284,274 130,601,329 -
Accrued Administrative Expenses 25,310,686 - 25,310,686 -
Due to State of Ohio - - - 517,051
Obligations Under Securities Lending 732,899,564 49,637,729 782,537,293 -
Other Liabilities 24,971,287 - 24,971,287 -
TOTAL LIABILITIES 905,498,592 79,392,739 984,891,331 517,051 DEFERRED INFLOWS OF RESOURCES
Deferred Inflows - Pension 383,572 - 383,572 - FIDUCIARY NET POSITION HELD IN TRUST FOR PENSION AND POST-EMPLOYMENT HEALTH CARE BENEFITS $13,682,389,240 $901,653,715 $14,584,042,955 $-
See notes to Basic Financial Statements. The accompanying notes are an integral part of the financial statements.
BASIC FINANCIAL STATEMENTSSTATEMENT OF FIDUCIARY NET POSITION (AS OF DEC. 31, 2016)

FINANCIAL SECTION2016 Comprehensive Annual Financial Report
OP&F • Page 9
BASIC FINANCIAL STATEMENTS
Pensions Post-employment
Health Care2016 Total
Additions:
From Contributions:
Members’ $268,594,295 $- $268,594,295
Employers’ 454,745,371 10,708,739 465,454,110
State of Ohio–Subsidies 398,161 - 398,161
Health Care Premiums - 73,161,967 73,161,967
TOTAL CONTRIBUTIONS 723,737,827 83,870,706 807,608,533
From Investment Income:
Net Appreciation (Depreciation)
Value of Investments 940,788,275 64,801,146 1,005,589,421
Bond Interest 118,420,360 8,156,750 126,577,110
Dividends 82,460,225 5,679,830 88,140,055
Alternative Investment Income 58,389,693 4,021,860 62,411,553
Master Limited Partnerships Income 47,981,440 3,304,944 51,286,384
Other Investment Income (Loss) 24,571,071 1,692,446 26,263,517
Less Investment Expenses (42,726,835) (2,943,008) (45,669,843)
NET INVESTMENT INCOME 1,229,884,229 84,713,968 1,314,598,197
From Securities Lending Activities:
Securities Lending Income 5,262,174 362,457 5,624,631
Securities Lending Expense (2,577,295) (177,523) (2,754,818)
NET INCOME FROM SECURITIES LENDING 2,684,879 184,934 2,869,813
Interest on Local Funds Receivable 988,996 - 988,996
Other Income 7,022,384 27,855,788 34,878,172
TOTAL ADDITIONS 1,964,318,315 196,625,396 2,160,943,711
Deductions:
Retirement Benefits 672,597,970 - 672,597,970
Disability Benefits 248,879,989 - 248,879,989
Health Care Benefits - 223,535,753 223,535,753
Survivor Benefits 84,626,847 - 84,626,847
DROP Withdrawals 166,662,400 - 166,662,400
Contribution Refunds 14,253,260 - 14,253,260
Administrative Expenses 18,719,581 798,310 19,517,891
Other Expenses 132,184 - 132,184
TOTAL DEDUCTIONS 1,205,872,231 224,334,063 1,430,206,294
Change in Fiduciary Net Position 758,446,084 (27,708,667) 730,737,417
FIDUCIARY NET POSITION - BEGINNING OF YEAR 12,923,943,156 929,362,382 13,853,305,538
FIDUCIARY NET POSITION - END OF YEAR $13,682,389,240 $901,653,715 $14,584,042,955
STATEMENT OF CHANGES IN FIDUCIARY NET POSITION (FOR YEAR ENDED DEC. 31, 2016)
See notes to Basic Financial Statements. The accompanying notes are an integral part of the financial statements.

FINANCIAL SECTION 2016 Comprehensive Annual Financial Report
Page 10 • OP&F
NOTES TO BASIC FINANCIAL STATEMENTS (DEC. 31, 2016)
1 – SUMMARY OF SIGNIFICANT ACCOUNTING POLICIESThe following are the significant accounting policies followed by OP&F:
BASIS OF ACCOUNTING
OP&F’s financial statements have been prepared using the accrual basis of accounting. Revenues are recognized when earned and expenses are recorded when a liability is incurred. Contributions are earned based on statutory requirements under Chapter 742 of the ORC.
NEW ACCOUNTING PRONOUNCEMENTS
During the year ended Dec. 31, 2016, OP&F adopted the provision of GASB Statement No. 72, Fair Value Measurement and Application, which resulted in an additional disclosure to the financial statements. In addition, OP&F adobted GASB Statement No. 76, The Hierarchy of Generally Accepted Accounting Principles for State and Local Governments, GASB Statement No. 77, Tax Abatement Disclosures, GASB Statement No. 78, Pensions Provided through Certain Multiple-Employer Defined Benefit Pension Plans and GASB Statement No. 79, Certain External Investment Pools and Pool Participants. The adoption of these had no material impact on the financial statements.
The GASB also issued the following pronouncements: GASB Statement No. 74, Financial Reporting for Postemployment Benefit Plans Other than pension plans, is effective for fiscal years beginning after June 15, 2016. GASB Statement No. 75, Accounting and Financial Reporting for Postemployment Benefits Other Than Pensions, is effective for fiscal years beginning after June 15, 2017. GASB Statement No. 80, Blending Requirements for Certain Component Units–an amendment of GASB Statement No. 14, is effective for fiscal years beginning after June 15, 2016. GASB Statement No. 81, Irrevocable Split-Interest Agreements, is effective for fiscal years beginning after Dec. 15, 2016. GASB Statement No. 82, Pension Issues-an amendment of GASB Statements No. 67, No. 68 and No. 73, is effective for fiscal years beginning after June 15, 2016. GASB Statement No. 83, Certain Asset Retirement Obligations, is effective for fiscal years beginning after June 15, 2018. GASB Statement No. 84, Fiduciary Activities, is effective for fiscal years beginning after Dec. 15, 2018. GASB Statement No. 85, Omnibus 2017, is effective for fiscal years beginning after June 15, 2017. GASB Statement No. 86, Certain Debt Extinguishment Issues, is effective for fiscal years beginning after June 15, 2017. OP&F is also analyzing the impact that these GASB pronouncements will have on the financial statements.
MANAGEMENT USE OF ESTIMATES
The preparation of the financial statements requires management to make a number of estimates and assumptions relating to the reported amounts of assets and liabilities at the date of the financial statements and the reported amounts of revenues and expenses during the period. Significant items subject to estimates and assumptions include the fair value of certain investments, carrying amount of capital assets and assets and obligations related to employee and member benefits. Actual results could differ from those estimates.
INVESTMENTS
Investment purchases and sales are recorded on a trade-date basis. Dividend income is recognized on the ex-dividend date. Income on bonds, private equity, private debt, real estate funds and interest income are recognized when earned.
Investments are reported at fair value. Fair value is the amount reasonably expected to be received for an investment in a current sale between a willing buyer and a willing seller.Securities traded on a national or international exchange, including master limited partnerships, are valued at the last reported sales price at the then current exchange rates. Mortgages are valued on the basis of future principal payments discounted at prevailing interest rates for similar instruments. The fair value of real estate and timber are based on independent appraisals and internal valuations. Investments that do not have an established market are reported at estimated fair value received from the investment managers. The value of OP&F’s private equity interests are based on values established by each partnership’s valuation committee. Investments, for which no national exchanges or pricing services exist, such as private equity assets, are valued at fair value by the investment partnership based on the valuation methodology outlined in the partnership agreement. Real estate may be valued by the manager or independent appraisers. Commingled assets that are not traded on a national exchange are valued by the commingled manager. OP&F performs due diligence review of the investment pricing, process and infrastructure of private equity, commingled and real estate investments to assure that asset values provided by the managers are reasonable.
Net appreciation (depreciation) is determined by calculating the change in the fair value of investments between the end of the year and the beginning of the year, less the cost of investments purchased, plus reinvested proceeds from sales of investments at fair value. Investment expense consists of administrative expenses directly related to OP&F’s investment operations and a proportional amount of all other administrative expenses allocated based on the ratio of OP&F’s investment staff to total OP&F staff.

FINANCIAL SECTION2016 Comprehensive Annual Financial Report
OP&F • Page 11
FEDERAL INCOME TAX STATUS
OP&F was determined to be a qualified trust under section 401(a) of the Internal Revenue Code that is exempt from Federal income taxes under Section 501(a) of the Internal Revenue Service Code. OP&F’s DROP plan was also determined to be part of the 401(a) trust. A separate health care trust accrual account is maintained for health care benefits under Internal Revenue Service (IRS) Code Section 115, trust and Code Section 401(h), account is maintained for Medicare Part B reimbursements.
ADMINISTRATIVE COSTS
The cost of administering the plan is financed by investment income.
CONTRIBUTIONS, BENEFITS, AND REFUNDS
Employer and member contributions are recognized when due or in the period the related member salaries are earned. Benefits and refunds are recognized when due and payable in accordance with the terms of the plan.
PROPERTY AND EQUIPMENT
Property and equipment are recorded at cost. Depreciation is computed using the straight-line method over the estimated useful lives of the related assets. The range of estimated useful lives is as follows:
Buildings and Improvements: 40 years
Furniture and Equipment: 3 to 10 years
Computer Software and Hardware: 2 to 7 years
Non-Depreciable Capital Assets Land
Jan. 1, 2016$3,200,000
Increases$-
Decreases$-
Dec. 31, 2016$3,200,000
Depreciable Capital AssetsBuilding and Improvements 21,396,130 - - 21,396,130Furniture and Equipment 3,437,364 14,155 - 3,451,519Computer Software and Hardware 16,486,196 442,756 (3,927) 16,925,025TOTAL DEPRECIABLE CAPITAL ASSETS 41,319,690 456,911 (3,927) 41,772,674
Accumulated Depreciation
Building and Improvements 8,744,220 537,125 - 9,281,345
Furniture and Equipment 3,283,400 26,831 - 3,310,231Computer Software and Hardware 14,652,973 990,372 - 15,643,345TOTAL ACCUMULATED DEPRECIATION 26,680,593 1,554,328 - 28,234,921
TOTAL DEPRECIABLE CAPITAL ASSETS, NET $14,639,097 $(1,097,417) $(3,927) $13,537,753
CHANGES IN CAPITAL ASSETS YEAR ENDED DEC. 31, 2016

FINANCIAL SECTION 2016 Comprehensive Annual Financial Report
Page 12 • OP&F
2 – DESCRIPTION OF THE SYSTEMORGANIZATION
OP&F is a cost-sharing, multiple–employer public employee retirement system established by the ORC Chapter 742 in 1965 to consolidate the various individual local police and firefighter’s relief and pension funds into one statewide plan. OP&F is administered by a nine member Board of Trustees, consisting of two active representatives of police departments, two active representatives of fire departments, one retired police officer and one retired firefighter. The Board of Trustees also includes three statutory members. Each statutory member—one appointed by the Governor of Ohio, one appointed by the Ohio Treasurer of State and one appointed jointly by the Ohio Senate President and Ohio Speaker of the House of Representatives—must have professional investment expertise.
OP&F administers pension, disability, DROP and health care benefits to qualified members. In addition, OP&F administers survivor benefits, death benefits and sponsors health care programs for eligible survivors, spouses, children and dependent parents. OP&F is a separate financial reporting entity in accordance with criteria established by Governmental Accounting Standards Board Statement No.14. Because OP&F is a legally separate entity, a voting majority of the governing board is not appointed by the State and it is fiscally independent of other state and local governments. OP&F also has a variety of professional consultants and money managers as listed on page vii and page 66.
BENEFITS
Plan benefits are established under ORC Chapter 742. OP&F offers four types of service retirement: normal, service commuted, age/service commuted and actuarially reduced. Each type has different eligibility guidelines and is calculated using the member’s allowable average annual salary.
Allowable average annual salary is subject to certain statutory and administrative limitations. Not all salary, earnings, or compensation may be used in the calculation. OP&F calculates allowable average annual salary as follows:
• For members with less than 15 years of service credit as of July 1, 2013, allowable average annual salary is an average of the five years of highest allowable earnings; regardless of when in their career the highest years occurred. Allowable average annual salary means one-fifth of the total salary during the five years for which the total allowable earnings were greatest.
• For OP&F members with 15 or more years of service credit as of July 1, 2013, allowable average annual salary is an average of the three years of highest allowable earnings; regardless of when in their career the highest years occurred. Allowable average annual salary means one-third of the total salary during the three years for which the total allowable earnings were greatest.
2016 Employee Members Police Fire Total
Retirees and BeneficiariesCurrently receiving benefits 16,226 12,176 28,402Terminated employees entitled to benefits but not yet receiving them 151 85 236
TOTAL BENEFIT MEMBERS 16,377 12,261 28,638Current Members
Vested* 7,786 6,877 14,663Non-vested 7,060 5,901 12,961
TOTAL CURRENT MEMBERS 14,846 12,778 27,624TOTAL EMPLOYEE MEMBERS 31,223 25,039 56,262Employer Members
Municipalities 248 221 469Townships - 130 130Villages 279 37 316
TOTAL EMPLOYER MEMBERS 527 388 915
* Includes Rehired Retirees.
PLAN MEMBERSHIP
Employer and member data as of Jan. 1, 2016, based on the most recent actuarial valuation is as follows:
FINANCIAL SECTION2016 Comprehensive Annual Financial Report
OP&F • Page 13
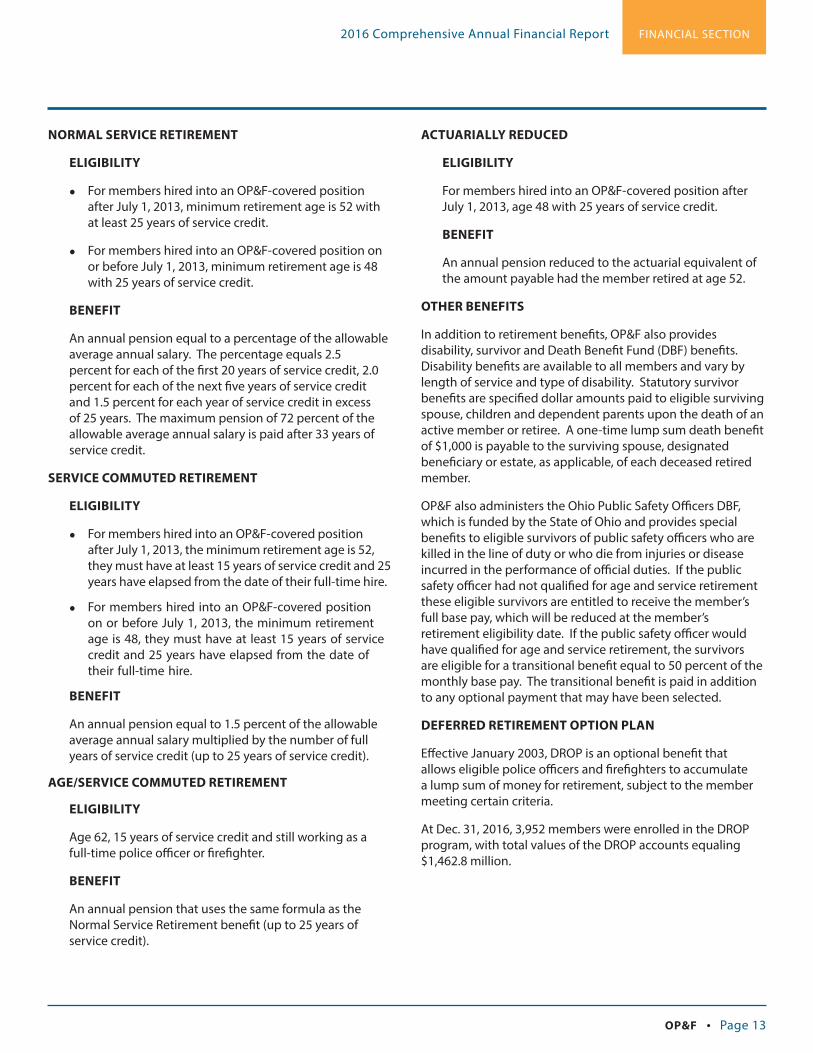
NORMAL SERVICE RETIREMENT
ELIGIBILITY
• For members hired into an OP&F-covered position after July 1, 2013, minimum retirement age is 52 with at least 25 years of service credit.
• For members hired into an OP&F-covered position on or before July 1, 2013, minimum retirement age is 48 with 25 years of service credit.
BENEFIT
An annual pension equal to a percentage of the allowable average annual salary. The percentage equals 2.5 percent for each of the first 20 years of service credit, 2.0 percent for each of the next five years of service credit and 1.5 percent for each year of service credit in excess of 25 years. The maximum pension of 72 percent of the allowable average annual salary is paid after 33 years of service credit.
SERVICE COMMUTED RETIREMENT
ELIGIBILITY
• For members hired into an OP&F-covered position after July 1, 2013, the minimum retirement age is 52, they must have at least 15 years of service credit and 25 years have elapsed from the date of their full-time hire.
• For members hired into an OP&F-covered position on or before July 1, 2013, the minimum retirement age is 48, they must have at least 15 years of service credit and 25 years have elapsed from the date of their full-time hire.
BENEFIT
An annual pension equal to 1.5 percent of the allowable average annual salary multiplied by the number of full years of service credit (up to 25 years of service credit).
AGE/SERVICE COMMUTED RETIREMENT
ELIGIBILITY
Age 62, 15 years of service credit and still working as a full-time police officer or firefighter.
BENEFIT
An annual pension that uses the same formula as the Normal Service Retirement benefit (up to 25 years of service credit).
ACTUARIALLY REDUCED
ELIGIBILITY
For members hired into an OP&F-covered position after July 1, 2013, age 48 with 25 years of service credit.
BENEFIT
An annual pension reduced to the actuarial equivalent of the amount payable had the member retired at age 52.
OTHER BENEFITS
In addition to retirement benefits, OP&F also provides disability, survivor and Death Benefit Fund (DBF) benefits. Disability benefits are available to all members and vary by length of service and type of disability. Statutory survivor benefits are specified dollar amounts paid to eligible surviving spouse, children and dependent parents upon the death of an active member or retiree. A one-time lump sum death benefit of $1,000 is payable to the surviving spouse, designated beneficiary or estate, as applicable, of each deceased retired member.
OP&F also administers the Ohio Public Safety Officers DBF, which is funded by the State of Ohio and provides special benefits to eligible survivors of public safety officers who are killed in the line of duty or who die from injuries or disease incurred in the performance of official duties. If the public safety officer had not qualified for age and service retirement these eligible survivors are entitled to receive the member’s full base pay, which will be reduced at the member’s retirement eligibility date. If the public safety officer would have qualified for age and service retirement, the survivors are eligible for a transitional benefit equal to 50 percent of the monthly base pay. The transitional benefit is paid in addition to any optional payment that may have been selected.
DEFERRED RETIREMENT OPTION PLAN
Effective January 2003, DROP is an optional benefit that allows eligible police officers and firefighters to accumulate a lump sum of money for retirement, subject to the member meeting certain criteria.
At Dec. 31, 2016, 3,952 members were enrolled in the DROP program, with total values of the DROP accounts equaling $1,462.8 million.

FINANCIAL SECTION 2016 Comprehensive Annual Financial Report
Page 14 • OP&F
ELIGIBILITY
When a member is eligible for a normal service retirement they can enter DROP by delaying retirement and continuing to work as a full-time police officer or firefighter.
• For members hired into an OP&F-covered position after July 1, 2013, normal service retirement eligibility is age 52 with at least 25 years of service credit.
• For members hired into an OP&F-covered position on or before July 1, 2013, normal service retirement eligibility is age 48 with at least 25 years of service credit.
BENEFIT
DROP is a cost neutral benefit offered by OP&F. Upon the DROP effective date, the member’s pension is calculated as if that were their date of retirement. While the member continues to work and draw their normal salary, the amount they would have received in retirement benefits, a portion of their ongoing OP&F employee contributions and interest, accumulates tax-deferred at OP&F on their behalf. Since the member’s pension has already been calculated:
• The years of DROP service do not apply towards the member’s normal service retirement.
• If a member earns a higher salary after their DROP effective date due to a raise, job promotion, etc., it will not be used to recalculate their pension and, therefore, will not result in that member receiving a higher pension upon retirement.
The DROP interest rate is set by administrative rule and is subject to change at any time. OP&F credits interest to all DROP balances each month at a rate equal to the 10-year United States Treasury Note Business Day Series, as published by the U.S. Department of the Treasury, with a cap of five percent. This variable interest rate is adjusted quarterly to match the published 10-year U.S. Treasury Note Business Day Series rate for the last trading business day of the preceding quarter and is in effect for the subsequent quarter.
Members whose election to participate in DROP is effective after July 1, 2013 do not qualify for annual cost-of-living allowances (COLA) at any time during DROP. Members whose election to participate in DROP is effective on or before July 1, 2013 will continue to receive a cost-of-living allowance during DROP, but only when they reach 55 years of age and have been participating in DROP for at least one year. Those members whose enrollment date into DROP qualifies them for a cost-of-
living allowance during DROP will receive three percent of their base pension.
Member contributions are credited to their DROP account based on the number of years of DROP service. For those members whose election to participate in DROP is effective after July 1, 2013, OP&F applies contributions to DROP in the following manner:
For this group of members, the minimum participation in DROP, without penalty, is five years and the maximum is eight years.
• If a member terminates employment within the first five years of joining DROP, then the member forfeits all of their DROP interest. In addition to losing their accumulated interest, members who choose to terminate employment before completing the required participation period cannot withdraw any of the funds in their DROP account until the minimum participation period has expired. The only exception to this rule is if the member dies during the DROP minimum participation period. The member’s surviving spouse, designated beneficiary or estate, as applicable, will receive the entire DROP account balance determined at time of death.
• If a member chooses to continue working after eight years in DROP, the member forfeits all DROP benefits and receives the Normal Service Retirement benefit upon retirement, which will be calculated to include the service credit and salary earned during the DROP participation period.
For those members whose election to participate in DROP was on or before July 1, 2013, member contributions are applied to DROP under the following schedule:
Years of DROP Service Percentage of Member Contributions
Years 1-2 50% of member’s contributions
Year 3 75% of member’s contributions
Years 4-8 100% of member’s contributions
Years of DROP Service Percentage of Member Contributions
Years 1-3 50% of member’s contributions
Years 4-5 75% of member’s contributions
Years 6-8 100% of member’s contributions

FINANCIAL SECTION2016 Comprehensive Annual Financial Report
OP&F • Page 15
For this group of members, the minimum participation in DROP, without penalty, is three years and the maximum is eight.
• If a member terminates employment within the first three years of joining DROP, then the member forfeits all of their DROP interest. In addition to losing their accumulated interest, members who choose to terminate employment before completing the required participation period cannot withdraw any of the funds in their DROP account until the minimum participation period has expired. The only exception to this rule is if the member dies during the DROP minimum participation period. The member’s surviving spouse, designated beneficiary or estate, as applicable, will receive the entire DROP account balance determined at time of death.
• If a member chooses to continue working after eight years in DROP, the member forfeits all DROP benefits and receives the Normal Service Retirement benefit upon retirement, which will be calculated to include the service credit and salary earned during the DROP participation period.
All DROP members retiring before the eight-year maximum participation period will receive their Normal Service Retirement benefit determined at the time of DROP entry, with the COLA adjustment (if applicable) to date of retirement when eligible. These members will also receive the DROP account balance as a lump sum or monthly annuity.
If a member dies while participating in DROP, the member’s surviving spouse, designated beneficiary or estate, as applicable, will receive the entire DROP account balance determined at the time of death. The surviving spouse or contingent dependent beneficiary will receive the greater of the retirement allowance made at the time of DROP entry or the Normal Service Retirement benefit paid with COLA adjustments (if applicable) to the date of death, paid as if the member had elected a 50 percent joint and survivor option at death. All other statutory death benefits will apply.
If the member becomes disabled while in DROP, and has not terminated employment, the member must choose between receiving a disability benefit or DROP and a service retirement benefit. If the member stays in DROP, the disability benefit is forfeited. If the member chooses the disability benefit, the member forfeits all DROP benefits and receives the disability benefit, with service credit during the DROP period included.
REFUNDS
Upon termination of active service in a police or fire department, members may withdraw their accumulated employee contributions on deposit with OP&F. Acceptance of a refund cancels the member’s rights and benefits in OP&F. Employer contributions to OP&F are not refundable. The refund of employee contributions cancels the member’s total service credit with OP&F.
HEALTH CARE
OP&F sponsors a comprehensive health care program for eligible benefit recipients and their eligible dependents administered by a third party provider. This program is not guaranteed and is subject to change at any time upon action of the Board of Trustees. The program includes medical, prescription drugs, dental, vision and reimbursement of Medicare Part B premiums. Benefit recipients pay a portion of the health care cost through a monthly contribution.
Under Ohio law, health care costs paid from the funds of the plan are included in the employer contribution rates, which are currently 19.5 percent and 24 percent of salaries for police and fire employers, respectively. During 2016, the Board of Trustees allocated employer contributions equal to 0.5 percent of annual covered payroll to the Health Care Stabilization Fund (HCSF). The HCSF is part of the Pension Reserve Fund.
OP&F maintains funds for health care in two separate accounts. There is one account for health care benefits and one account for Medicare Part B reimbursements. A separate health care trust accrual account is maintained for health care benefits under IRS Code Section 115, trust and Code Section 401(h), account is maintained for Medicare Part B reimbursements.
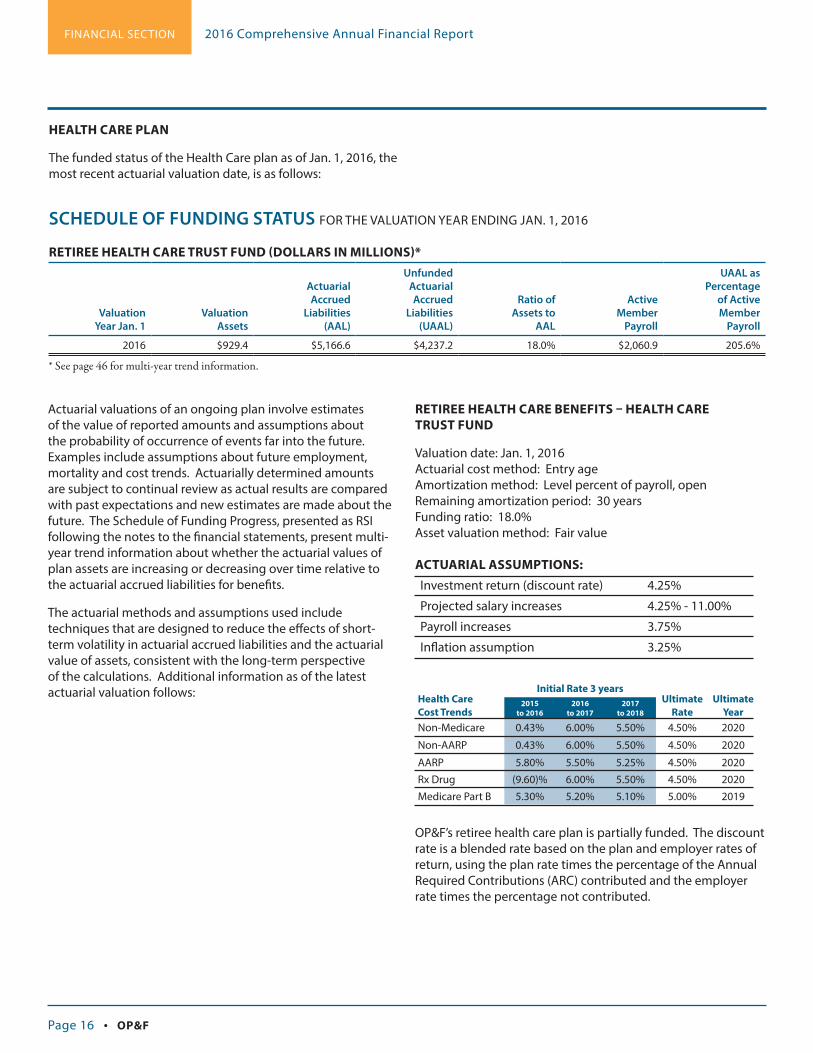
FINANCIAL SECTION 2016 Comprehensive Annual Financial Report
Page 16 • OP&F
SCHEDULE OF FUNDING STATUS FOR THE VALUATION YEAR ENDING JAN. 1, 2016
RETIREE HEALTH CARE TRUST FUND (DOLLARS IN MILLIONS)*
Valuation Year Jan. 1
Valuation Assets
Actuarial Accrued
Liabilities (AAL)
Unfunded Actuarial Accrued
Liabilities (UAAL)
Ratio of Assets to
AAL
Active Member
Payroll
UAAL as Percentage
of Active Member
Payroll
2016 $929.4 $5,166.6 $4,237.2 18.0% $2,060.9 205.6%
* See page 46 for multi-year trend information.
Actuarial valuations of an ongoing plan involve estimates of the value of reported amounts and assumptions about the probability of occurrence of events far into the future. Examples include assumptions about future employment, mortality and cost trends. Actuarially determined amounts are subject to continual review as actual results are compared with past expectations and new estimates are made about the future. The Schedule of Funding Progress, presented as RSI following the notes to the financial statements, present multi-year trend information about whether the actuarial values of plan assets are increasing or decreasing over time relative to the actuarial accrued liabilities for benefits.
The actuarial methods and assumptions used include techniques that are designed to reduce the effects of short-term volatility in actuarial accrued liabilities and the actuarial value of assets, consistent with the long-term perspective of the calculations. Additional information as of the latest actuarial valuation follows:
RETIREE HEALTH CARE BENEFITS – HEALTH CARE TRUST FUND
Valuation date: Jan. 1, 2016Actuarial cost method: Entry ageAmortization method: Level percent of payroll, openRemaining amortization period: 30 yearsFunding ratio: 18.0%Asset valuation method: Fair value
ACTUARIAL ASSUMPTIONS:
Investment return (discount rate) 4.25%
Projected salary increases 4.25% - 11.00%
Payroll increases 3.75%
Inflation assumption 3.25%
Health Care Cost Trends
Initial Rate 3 yearsUltimate
RateUltimate
Year2015
to 20162016
to 20172017
to 2018
Non-Medicare 0.43% 6.00% 5.50% 4.50% 2020
Non-AARP 0.43% 6.00% 5.50% 4.50% 2020
AARP 5.80% 5.50% 5.25% 4.50% 2020Rx Drug (9.60)% 6.00% 5.50% 4.50% 2020Medicare Part B 5.30% 5.20% 5.10% 5.00% 2019
OP&F’s retiree health care plan is partially funded. The discount rate is a blended rate based on the plan and employer rates of return, using the plan rate times the percentage of the Annual Required Contributions (ARC) contributed and the employer rate times the percentage not contributed.
HEALTH CARE PLAN
The funded status of the Health Care plan as of Jan. 1, 2016, the most recent actuarial valuation date, is as follows:

FINANCIAL SECTION2016 Comprehensive Annual Financial Report
OP&F • Page 17
3 – CONTRIBUTIONS AND RESERVESCONTRIBUTIONS
The ORC Chapter 742 requires contributions by active members and their employers. Contribution rates are subject to annual review by the Ohio Retirement Study Council (ORSC). Additionally, an actuary is used to determine the actuarial implications of the requirement. The adequacy of contribution rates is determined annually using the entry age normal actuarial cost method. Rates are at the statutory maximums and the maximum rates have been taken into consideration in the projection of pension benefits for financial accounting measurement purposes.
Rates established by the ORC Jan. 1, 2016 through Dec. 31, 2016:
Percent of active member payroll
Police
Fire
Percent Contributed
Member 12.25% 12.25% 100%
Employer 19.50% 24.00% 100%
TOTAL STATUTORY RATE * 31.75% 36.25% 100%
* Combined member and employer contributions as a percentage of the total active member payroll required and made Jan. 1, 2016 through Dec. 31, 2016.
The ORC establishes the length of the amortization period for unfunded pension liability as the primary measure of OP&F’s financial status, with a period of 30 years or less being considered satisfactory. This 30-year target was to be attained by Dec. 31, 2006 and maintained thereafter. As of Jan. 1, 2016, the amortization period was 29 years. On Sept. 26, 2012, Ohio signed into law the 30-year funding plan OP&F submitted to ORSC. This pension legislation increased the active member contribution rate from 10 percent to 12.25 percent in annual increments of 0.75 percent each year beginning on July 2, 2013 and the final scheduled increase occurred on July 2, 2015.
The chart below summarizes the member and employer contributions for 2016:
In accordance with the ORC, the State of Ohio is required to contribute additional amounts to finance the cost of certain state-legislated benefit improvements. The total amount contributed by the State of Ohio was $398,161 for the year ended Dec. 31, 2016.
LOCAL FUNDS RECEIVABLE
Local governments are required by state statute to pay the unfunded portion of the actuarially-determined liability of the local police and firefighter’s relief and pension funds that were merged to form OP&F in 1967. The ORC designates this obligation of the local governments to the Employers’ Accrued Liability. Interest on the outstanding balance is being accrued at the rate of 4.25 percent, compounded semi-annually. Local governments began repayment in 1969 and payments are required to be made until 2035. Between 1969 and 1973, payments of principal and interest were received at incremental semi-annual rates ranging from two percent to four percent of the original receivable balance. Between 1973 and 2035, semi-annual payments of principal and interest are required to be made by the local governments at a rate of five percent of the original receivable balance. The underpaid balance due at Dec. 31, 2016 includes $81,706 due from local governments, which had previously underpaid their semi-annual payment and from local governments that joined OP&F subsequent to 1967 according to a 20-year payment plan.
Year Ending Dec. 31
Police Member Contributions
Police Employer Contributions
Percent Contributed
Fire Member Contributions
Fire Employer Contributions
Percent Contributed
2016 $143,950,925 $223,299,745 100% $124,643,370 $242,154,365 100%
SUMMARY OF MEMBER AND EMPLOYER CONTRIBUTIONS
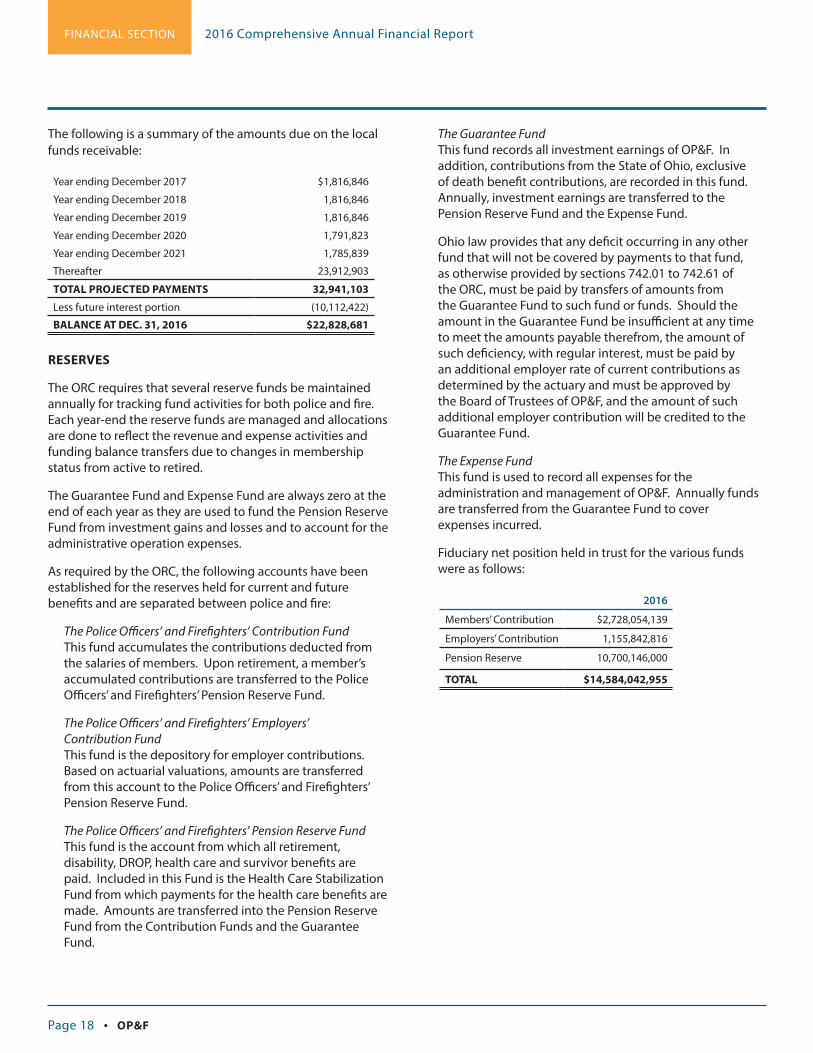
FINANCIAL SECTION 2016 Comprehensive Annual Financial Report
Page 18 • OP&F
The following is a summary of the amounts due on the local funds receivable:
Year ending December 2017 $1,816,846
Year ending December 2018 1,816,846
Year ending December 2019 1,816,846
Year ending December 2020 1,791,823
Year ending December 2021 1,785,839
Thereafter 23,912,903
TOTAL PROJECTED PAYMENTS 32,941,103
Less future interest portion (10,112,422)
BALANCE AT DEC. 31, 2016 $22,828,681
RESERVES
The ORC requires that several reserve funds be maintained annually for tracking fund activities for both police and fire. Each year-end the reserve funds are managed and allocations are done to reflect the revenue and expense activities and funding balance transfers due to changes in membership status from active to retired.
The Guarantee Fund and Expense Fund are always zero at the end of each year as they are used to fund the Pension Reserve Fund from investment gains and losses and to account for the administrative operation expenses.
As required by the ORC, the following accounts have been established for the reserves held for current and future benefits and are separated between police and fire:
The Police Officers’ and Firefighters’ Contribution Fund This fund accumulates the contributions deducted from the salaries of members. Upon retirement, a member’s accumulated contributions are transferred to the Police Officers’ and Firefighters’ Pension Reserve Fund.
The Police Officers’ and Firefighters’ Employers’ Contribution Fund This fund is the depository for employer contributions. Based on actuarial valuations, amounts are transferred from this account to the Police Officers’ and Firefighters’ Pension Reserve Fund.
The Police Officers’ and Firefighters’ Pension Reserve Fund This fund is the account from which all retirement, disability, DROP, health care and survivor benefits are paid. Included in this Fund is the Health Care Stabilization Fund from which payments for the health care benefits are made. Amounts are transferred into the Pension Reserve Fund from the Contribution Funds and the Guarantee Fund.
The Guarantee Fund This fund records all investment earnings of OP&F. In addition, contributions from the State of Ohio, exclusive of death benefit contributions, are recorded in this fund. Annually, investment earnings are transferred to the Pension Reserve Fund and the Expense Fund.
Ohio law provides that any deficit occurring in any other fund that will not be covered by payments to that fund, as otherwise provided by sections 742.01 to 742.61 of the ORC, must be paid by transfers of amounts from the Guarantee Fund to such fund or funds. Should the amount in the Guarantee Fund be insufficient at any time to meet the amounts payable therefrom, the amount of such deficiency, with regular interest, must be paid by an additional employer rate of current contributions as determined by the actuary and must be approved by the Board of Trustees of OP&F, and the amount of such additional employer contribution will be credited to the Guarantee Fund.
The Expense Fund This fund is used to record all expenses for the administration and management of OP&F. Annually funds are transferred from the Guarantee Fund to cover expenses incurred.
Fiduciary net position held in trust for the various funds were as follows:
2016
Members’ Contribution $2,728,054,139
Employers’ Contribution 1,155,842,816
Pension Reserve 10,700,146,000
TOTAL $14,584,042,955

FINANCIAL SECTION2016 Comprehensive Annual Financial Report
OP&F • Page 19
4 – FAIR VALUE MEASUREMENTOP&F measures and records its investments using fair value measurement guidelines established by generally accepted accounting principles. These guidelines categorize the inputs to valuation techniques into three hierarchal levels, as follows:
Level 1 Quoted (unadjusted) prices for identical investments in active markets.
Level 2 Inputs other than quoted prices that are observable for the investments directly or indirectly. These inputs are quoted prices for similar assets in active markets, quoted prices for identical or similar assets in markets that are not active and observable inputs other than quoted prices. Such inputs may include interest rates, yield curves, implied volatilities and credit spreads.
Level 3 Level 3 inputs are prices based on unobservable sources. Level 3 inputs include the best information available under the circumstances, which can include OP&F’s own data and takes into account all information about market participant assumptions.
The classification of the levels, within the hierarchy, is based on the asset type and the pricing transparency. Level 1 securities in Domestic Stocks, International Securities, Fixed Income and Derivatives are valued based on prices quoted in active markets for those securities.
Level 2 securities in Cash and Short-Term Investments primarily consist of commercial paper. These are reported at cost plus earned discount which approximates market or fair value. Equity securities in Level 2 are valued using quoted prices for similar assets in both active and non-active markets. The fair values for debt and derivative securities in Level 2 are based on bid evaluations or matrix pricing method. Bid evaluations are typically based on market quotations, yields, maturities, call features and ratings. Matrix pricing technique is used to value securities based on the securities relationship to benchmark quoted prices.
The Level 3 securities consists solely of investments in timberlands. Due to the significance of certain unobservable assumptions in the valuation of timberland, this investment is valued using Income Capitalization, Sales Comparison or Cost methods. Income capitalization method involves using a range of discount rates to determine the present value of the future income that can be produced over the holding period. Sales comparison approach is a method of estimating the fair value based on open market prices recently paid for similar timberland properties in the market
area. The cost approach is a method of estimating the fair value based on the concept that a market participant would pay no more for the timberland property than the cost to purchase and develop a comparable property having same utility.
The fair values of investments in certain equity, fixed income and marketable alternative funds are based on the investments’ net asset value provided by the investee. Investments that are measured at fair value using the net asset value as practical expedient are not calssified in the fair value hierarchy.

FINANCIAL SECTION 2016 Comprehensive Annual Financial Report
Page 20 • OP&F
Fair Value Measurements Using:
Dec. 31, 2016
Quoted Prices in Active Markets for
Identical Assets (Level 1)
Significant Other
Observable Inputs (Level 2)
Significant Unobservable
Inputs (Level 3)
Investments by fair value level
Corporate Bonds and Obligations 2,117,456 - 2,117,456 -
Domestic Stocks 309,219 297,353 11,866 -
International Equities 1,971,900 1,958,250 13,650 -
International Pooled Stocks 27,568 27,568 - -
Master Limited Partnership 927,496 927,496 - -
Mortgage and Asset-Backed Obligations 430,377 - 430,377 -
Municipal Bond Obligations 3,212 1,533 1,679 -
Non-U.S. Bonds 4,197 - 4,197 -
Timber 145,429 - - 145,429
U.S. Government Agencies 18,366 - 18,366 -
U.S. Government Treasury Obligations 120,767 - 120,767 -
U.S. Government Treasury STRIPS 107,001 - 107,001 -
TOTAL INVESTMENT BY FAIR VALUE LEVEL $6,182,988 $3,212,200 $2,825,359 $145,429
Investments measured at net asset value (NAV)
Commercial Mortgage $37,429
Domestic Commingled Bonds 497,670
Domestic Pooled Stocks 1,749,596
Domestic Stocks 1,059,978
International Pooled Stocks 733,128
Non-U.S. Bonds 461,788
Private Debt 298,895
Private Equity 914,796
Real Estate 1,583,586
Timber 156,010
TOTAL INVESTMENTS MEASURED AT NAV $7,492,876
Investments Derivatives
Futures $1 $1 $- $-
Options/Swaptions (114) - (114) -
Foreign Currency Forwards (764) - (764) -
Interest Rate Swaps 49 - 49 -
Credit Default Swaps (4) - (4) -
TOTAL INVESTMENTS DERIVATIVES $(832) $1 $(833) -
TOTAL INVESTMENTS $13,675,032
Securities not leveled in investment portfolio
Cash Equivalents $923,215
The following table shows the classification of OP&F fair value measurement for its investments as of Dec. 31, 2016 (Dollars in thousands):

FINANCIAL SECTION2016 Comprehensive Annual Financial Report
OP&F • Page 21
Dec. 31, 2016Unfunded
Commitments
RedemptionFrequency (If
Currently Eligible)1Redemption
Notice Period2
Bond/Credit Funds (1) $1,177,486 $189,123 Daily, Semi-annually, Not Eligible
0 days - Not Eligible
Domestic Equity Funds (2) 1,232,533 0 Daily 0 Days
Exchange Traded Funds (3) 321,190 0 Daily 0 Days
Hedge Funds (4)
Global Macro 556,661 0 Monthly 5-90 Days
Credit 41,803 0 Quarterly 60 Days
Relative Value 36,896 0 Monthly 30 Days
Hedge Fund of Funds (5)
Multi-Strategy 240,576 0 Daily 5 Days
Market Neutral 498,211 0 Daily, Quarterly 0-70 Days
International Equity Funds (6) 733,128 0 Daily 0-15 Days
Private Equity/Venture Capital Funds (7) 914,796 818,273 Not Eligible Not Eligible
Real Estate Funds
Open-End (8) 1,101,907 26,425 Quarterly 45-90 Days
Closed-End (9) 481,679 378,400 Not Eligible Not Eligible
Timberland Funds (10) 156,010 129,212 Not Eligible Not Eligible
TOTAL INVESTMENT MEASURED AT THE NAV $7,492,876
(1) Bond/Credit Funds: Consisting of five bond funds, four private debt funds, one commercial mortgage fund and one real estate investment fund are considered bond/credit funds. Each is valued at the net asset value at the end of the period based on the value of the underlying assets. Distributions from the private debt funds are received when the underlying assets are liquidated. This is estimated to occur between 5 to 8 years.
(2) Domestic Equity Fund: Consists of one fund, which tracks the Russell 1000 Index. It is valued at net asset value on a daily basis . The fund is eligible for redemption on a daily basis.
(3) Exchange Traded Funds: Consisting of the SPDR S&P 500 ETF Trust which is an exchange-traded fund incorporated in the U.S. It tracks the S&P 500 Index. The trust consists of a portfolio representing all stocks in the S&P 500 Index. The ETF is structured as a Unit Investment Trust and is valued at the net asset value on a daily basis.
(4) Hedge Funds: Consisting of three global macro, one credit and one relative value funds. These funds can be redeemed on a monthly to quarterly basis with five to ninety days’ notice.
(5) Hedge Fund of Funds: Consisting of one multi-strategy and two market neutral funds. The multi-strategy fund can be redeemed daily with five days notice while the market neutral can be redeemed daily to quarterly with 0 to 70 days notice.
(6) International Equity Funds: Consisting of four commingled funds which invest in international developed and emerging markets equity securities. These investments are valued at net asset value on a daily basis. These funds are eligible for redemption on a daily basis.
(7) Private Equity/Venture Capital Funds: Consisting of 88 commingled funds, fund-of-funds, and secondary funds involving domestic, international and global buyout, distressed debt, growth equity and venture capital funds. These are long-term lock-up vehicles, typically with 10-year terms plus available extensions. These investments are valued at net asset value, typically on a quarterly basis, as reported by the fund. The unfunded commitments can be called to make new investments or pay fees and expenses. Distributions are received when underlying assets are liquidated and this occurs from 5 to 15 years.
(8) Open-End Real Estate Funds: Consisting of 10 commingled funds which invest primarily in operating and substantially leased institutional quality properties located in the U.S. These investments are valued at net asset value, typically on a quarterly basis, as reported by the fund. The unfunded commitments can be called to make new investments or pay fees and expenses. These funds are eligible for redemption on a quarterly basis subject to available liquidity.
(9) Closed-End Real Estate Funds: Consisting of 40 commingled funds which invest in properties on a global basis having more risk and correspondingly higher expected returns than those in the Open-End Real Estate Funds. These are long-term lock-up vehicles, typically with 10-year terms plus available extensions. These investments are valued at net asset value, typically on a quarterly basis, as reported by the fund. The unfunded commitments can be called to make new investments or pay fees and expenses.
(10) Timberland Funds: Consisting of four commingled funds which invest in timberland markets on a global basis. These are long-term lock-up vehicles, typically with 10-year terms plus available extensions. These investments are valued at net asset value, typically on a quarterly basis, as reported by the fund. The unfunded commitments can be called to make new investments or pay fees and expenses. Distributions are received when underlying assets are liquidated and this occurs from 5 to 15 years.
INVESTMENTS MEASURED AT NET ASSET VALUE (NAV) (Dollars in thousands)
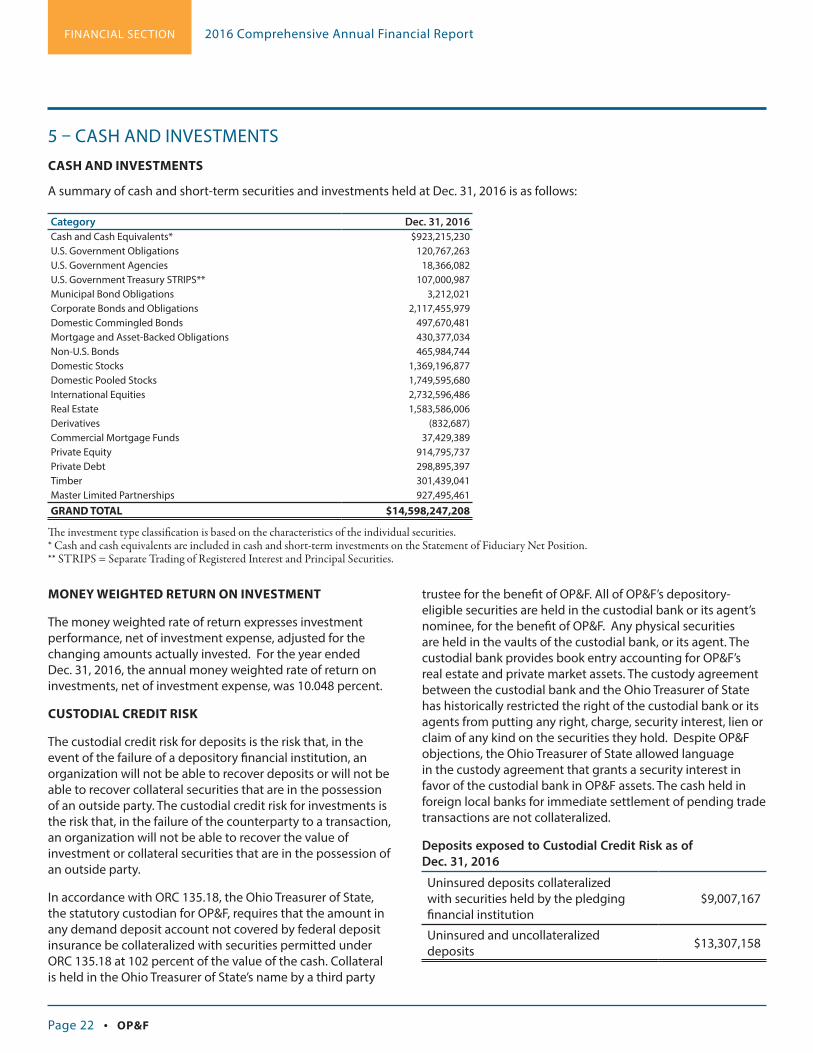
FINANCIAL SECTION 2016 Comprehensive Annual Financial Report
Page 22 • OP&F
5 – CASH AND INVESTMENTSCASH AND INVESTMENTS
A summary of cash and short-term securities and investments held at Dec. 31, 2016 is as follows:
Category Dec. 31, 2016Cash and Cash Equivalents* $923,215,230 U.S. Government Obligations 120,767,263U.S. Government Agencies 18,366,082U.S. Government Treasury STRIPS** 107,000,987Municipal Bond Obligations 3,212,021Corporate Bonds and Obligations 2,117,455,979Domestic Commingled Bonds 497,670,481Mortgage and Asset-Backed Obligations 430,377,034Non-U.S. Bonds 465,984,744Domestic Stocks 1,369,196,877Domestic Pooled Stocks 1,749,595,680International Equities 2,732,596,486Real Estate 1,583,586,006Derivatives (832,687)Commercial Mortgage Funds 37,429,389Private Equity 914,795,737Private Debt 298,895,397Timber 301,439,041Master Limited Partnerships 927,495,461GRAND TOTAL $14,598,247,208
The investment type classification is based on the characteristics of the individual securities. * Cash and cash equivalents are included in cash and short-term investments on the Statement of Fiduciary Net Position. ** STRIPS = Separate Trading of Registered Interest and Principal Securities.
MONEY WEIGHTED RETURN ON INVESTMENT
The money weighted rate of return expresses investment performance, net of investment expense, adjusted for the changing amounts actually invested. For the year ended Dec. 31, 2016, the annual money weighted rate of return on investments, net of investment expense, was 10.048 percent.
CUSTODIAL CREDIT RISK
The custodial credit risk for deposits is the risk that, in the event of the failure of a depository financial institution, an organization will not be able to recover deposits or will not be able to recover collateral securities that are in the possession of an outside party. The custodial credit risk for investments is the risk that, in the failure of the counterparty to a transaction, an organization will not be able to recover the value of investment or collateral securities that are in the possession of an outside party.
In accordance with ORC 135.18, the Ohio Treasurer of State, the statutory custodian for OP&F, requires that the amount in any demand deposit account not covered by federal deposit insurance be collateralized with securities permitted under ORC 135.18 at 102 percent of the value of the cash. Collateral is held in the Ohio Treasurer of State’s name by a third party
trustee for the benefit of OP&F. All of OP&F’s depository-eligible securities are held in the custodial bank or its agent’s nominee, for the benefit of OP&F. Any physical securities are held in the vaults of the custodial bank, or its agent. The custodial bank provides book entry accounting for OP&F’s real estate and private market assets. The custody agreement between the custodial bank and the Ohio Treasurer of State has historically restricted the right of the custodial bank or its agents from putting any right, charge, security interest, lien or claim of any kind on the securities they hold. Despite OP&F objections, the Ohio Treasurer of State allowed language in the custody agreement that grants a security interest in favor of the custodial bank in OP&F assets. The cash held in foreign local banks for immediate settlement of pending trade transactions are not collateralized.
Deposits exposed to Custodial Credit Risk as of Dec. 31, 2016
Uninsured deposits collateralized with securities held by the pledging financial institution
$9,007,167
Uninsured and uncollateralized deposits $13,307,158

FINANCIAL SECTION2016 Comprehensive Annual Financial Report
OP&F • Page 23
CREDIT RISK
Credit risk is the risk that an issuer or other counterparty to an investment will not fulfill its obligation to the holder of the investment. This risk is measured by the assignment of a rating by a nationally recognized statistical rating organization. OP&F’s policy over credit risk is based on the type of fixed income instruments. For credit risk purposes, OP&F classifies its fixed income securities into three main types: core, high yield and short-term fixed income. The credit risk policies related to these types are as follows:
CORE FIXED INCOME
OP&F’s four core fixed income portfolios, all managed externally, contain government, mortgage and asset-backed securities, U.S. Agency and corporate bonds. These external managers invest in securities based on guidelines provided by the OP&F Board of Trustees. It is the policy of OP&F that a security in the core fixed income portfolio shall be rated BBB- or better by two standard rating services at the time of purchase. OP&F allows some of its investment managers to purchase securities that are not rated as long as they deem these securities to be at least equivalent to the minimum ratings at the time of purchase.
• Government instruments include those issued by the U.S. Treasury as well as fixed income instruments, other than mortgage-backed securities, of an agency or instrumentality of the U.S. government.
• Mortgage-backed instruments include collateralized mortgage obligations and Real Estate Mortgage Investment Conduits (REMIC’s), whose payment of principal and interest is insured by the full faith and credit of the U.S. government, or an agency or instrumentality thereof. Also included in this category are secured assets issued by Government National Mortgage Association (GNMA) project loans, pools and participation certificates, Federal National Mortgage Association (FNMA) and Federal Home Loan Mortgage Corporation (FHLMC).
• U.S. Agency debt instruments include unsecured or uncollateralized securities issued by U.S. government agencies and government sponsored enterprises.
• Corporate bonds consist of debt instruments issued by domestic corporations or U.S. dollar-denominated debt issued by foreign entities and managed by a U.S. based investment manager.
• Global Inflation Protected Securities consist of bonds whose principal accrues with inflation during the life of the security and the entire accrued principal is paid out at maturity. Secondly, regular coupon payments are based on real rate of return since the interest payments are calculated on the inflation-accrued principal rather than on the nominal principal.

FINANCIAL SECTION 2016 Comprehensive Annual Financial Report
Page 24 • OP&F
The following tables show ratings by asset class in OP&F’s fixed income portfolio as of Dec. 31, 2016:
RATINGS BY ASSET CLASS – 2016
S&P Ratings
Corporate Bond
Obligations
Domestic Commingled
Bonds
Mortgage and Asset-Backed
Securities
Municipal Bond
Obligations Non-U.S.
Bonds
U.S. Government
Agencies
U.S. Government
Treasury STRIPS
U.S. Government
Treasury Obligations GRAND TOTAL
AAA $11,595,376 $- $39,718,263 $- $1,523,022 $772,790 $28,554,076 $11,650,748 $93,814,275
AA+ 25,349,583 374,568,453 129,977,985 98,496 461,787,694 3,016,495 92,213,187 - 1,087,011,893
AA 3,947,057 - 1,020,720 288,391 - - - - 5,256,168
AA- 16,163,855 - 1,390,591 642,895 - - - - 18,197,341
A+ 21,334,589 - 2,983,137 - - 382,227 - - 24,699,953
A 32,878,872 - 2,175,028 229,324 - - - - 35,283,224
A- 29,485,094 - 94,426 420,093 - - - - 29,999,613
BBB+ 61,804,359 - 894,319 - - - - - 62,698,678
BBB 39,229,152 - 1,384,783 736,261 - - - - 41,350,196
BBB- 120,348,872 - 1,703,022 796,561 - - - - 122,848,455
BB+ 223,927,531 - 938,043 - - - - - 224,865,574
BB 212,589,146 - 1,683,421 - 1,921,205 299,633 - - 216,493,405
BB- 327,280,193 - 2,578,227 - - - - - 329,858,420
B+ 328,658,947 - 1,972,713 - - - - - 330,631,660
B 205,206,833 - 1,383,250 - - - - - 206,590,083
B- 197,221,600 - 2,975,529 - - - - - 200,197,129
CCC+ 143,160,276 - 573,057 - - - - - 143,733,333
CCC 34,680,680 - 8,332,494 - - - - - 43,013,174
CCC- 24,687,029 - 5,676,953 - 357,407 - - - 30,721,389
CC 3,027,125 - 8,751,845 - - - - - 11,778,970
C - - 4,441,141 - - - - - 4,441,141
D 8,020,911 - 13,864,153 - - - - - 21,885,064
FFC* 2,506,166 - 163,831,119 - - 13,894,937 - 95,350,239 275,582,461
NR** 44,352,733 123,102,028 32,032,815 - 395,416 - - - 199,882,992
GRAND TOTAL
$2,117,455,979 $497,670,481 $430,377,034 $3,212,021 $465,984,744 $18,366,082 $120,767,263 $107,000,987 $3,760,834,591
* FFC = Full Faith and Credit.** NR = Not Rated.

FINANCIAL SECTION2016 Comprehensive Annual Financial Report
OP&F • Page 25
S&P/Moody's Rating Fair Value 2016 Percent 2016
A-1/P-1 $202,090,862 42.73%
A-2/P-1 51,997,383 11.00%
A-2/P-2 218,819,096 46.27%
GRAND TOTAL $472,907,341 100.00%
HIGH YIELD FIXED INCOME
As of Dec. 31 2016, OP&F had nine high yield fixed-income portfolios, of which five invested in publicly traded securities and four in private debt. All these portfolios were managed externally. The high yield bond asset class consists of the portion of the U.S. corporate bond market that is rated below BBB- by Standard & Poor’s 500 (S&P) or below Baa3 by Moody’s. Accordingly, credit risks associated with these bonds are greater than with core fixed income bonds. OP&F’s policy is to invest in high yield bonds issued by U.S. corporations with a minimum credit rating of CCC or equivalent. OP&F allows some of its investment managers to purchase securities that are not rated as long as they deem these securities to be at least equivalent to the minimum ratings at the time of purchase. It is possible after purchase that the security is downgraded. In the event of an investment guideline violation and in the event of a security downgrade, such that the ratings (Moody’s, S&P, or Fitch Investor’s Service) are below the allowable minimum security quality, the investment manager will inform OP&F in writing within five business days of such violation. Such notice will include the action the Manager intends to take with regard to the violation and over what time period that action will be taken. Both the method and timing of the violation resolution must be agreeable to OP&F.
SHORT-TERM INVESTMENTS
The short-term investment portfolio consists mainly of commercial paper. OP&F’s policy is that, at the time of purchase, the short-term instrument must be rated within the two highest classifications established by two standard rating services. However, it is possible that after the purchase the ratings could change. The following table lists the commercial paper ratings as of Dec. 31, 2016:

FINANCIAL SECTION 2016 Comprehensive Annual Financial Report
Page 26 • OP&F
INTEREST RATE RISK
Interest rate risk is the risk that changes in interest rates will adversely affect the fair value of fixed income investments. This relationship can be measured using duration, which shows the sensitivity of the price of a fixed-income investment to a change in interest rates. OP&F uses effective duration to measure the interest rate risk of the core fixed income portfolio. The effective duration takes into account that expected cash flows will fluctuate as interest rates change.
OP&F’s policy is that two of the four core fixed income managers are allowed a range of permissible durations around that of their benchmark index. One of the remaining managers, Western Asset Management, is required to have portfolio duration of one year or less. OP&F does not measure the duration of the other remaining core fixed income portfolio, managed by Russell Investments Implementation Services (Core Fixed Income Transition Account), as interest rate risk is constrained do to the fact that the portfolio tracking error shall not exceed 0.75 precent of the benchmark, Bloomberg Barclays Index. All the core fixed income managers are also required to monitor and report the effective duration of their portfolio(s) on a monthly basis.
As of Dec. 31 2016, the permissible ranges for the three core fixed income portfolio managers were:
Portfolio Benchmark2016 Benchmark Duration (years) Portfolio Manager Portfolio Permissible Range
Bloomberg Barclays Index 6.07 Pacific Investment Management Company -3 years to + 8 years
Barclays U.S. Government Inflation Linked Index 24.60
Bridgewater Associates U.S. Inflation Linked
Bond Fund*Replicate benchmark
Custom weighted-average mix of Barclays country indexes 24.08 Bridgewater Associates* Replicate benchmark
* These funds are levered 3:1

FINANCIAL SECTION2016 Comprehensive Annual Financial Report
OP&F • Page 27
COLLATERALIZED MORTGAGE OBLIGATIONS
In general, mortgage-backed securities entitle their holders to receive both principal and interest payments from the payments made by the borrowers of the underlying mortgages over the lives of those loans. The life of the mortgage that underlies a mortgage-backed security can be shortened by several economic events, including borrower refinancing. When interest rates fall and remain very low, a growing number of borrowers will refinance their existing loans causing mortgage-backed security holders to be repaid more quickly than anticipated. This early repayment is a form of market risk assumed by OP&F and other owners of mortgage-backed securities.
To the contrary, when interest rates begin to rise, the refinancing of existing mortgages begins to slow. If the rates remain high for long periods of time, fewer borrowers refinance their mortgages. This causes mortgage-backed security holders to be repaid over longer periods of time. This prolonged repayment is known as extension risk and is another form of market risk assumed by OP&F and other owners of mortgage-backed securities.
These securities are based on cash flows from interest payments on underlying loans. Therefore, they are sensitive to prepayments by the debtor, which may result from a decline in interest rates.
VARIABLE RATE SECURITIES
OP&F’s core fixed income and high yield managers are permitted to hold variable-rate coupons whose rates may vary directly or inversely with changes in a related interest rate. As of Dec. 31, 2016, OP&F did not hold any security with a variable-rate coupon that had a multiplier greater than one or any security with an inverse variable rate.
Since portfolio level duration is the best measure of interest rate risk, OP&F does not require its managers to measure or report on the duration of each security sector. OP&F does not measure the duration of their high yield portfolios because interest rate risk is a very small part of the total risk of high yield securities. The major risks for high yield bonds are credit risk and interest rate spread risk. The following table lists the effective duration for OP&F’s fixed-income portfolio as of Dec. 31, 2016:
Investment Type
Fair Value 2016
Effective Duration
2016 (years)
U.S. Government Treasury Obligations $120,767,263 8.19
U.S. Government STRIPS 107,000,987 5.98
U.S. Government Agencies 18,366,082 4.46
Mortgage and Asset-Backed Securities 430,377,034 3.04
Municipal Bond Obligations 3,212,021 10.99
Corporate Bond Obligations* 299,303,869 3.74
Non-U.S. Bonds 465,984,744 44.47
Domestic Commingled Bonds 497,670,481 19.03
TOTAL FIXED INCOME EFFECTIVE DURATION $1,942,682,481 17.69
* High yield bonds are excluded from duration.
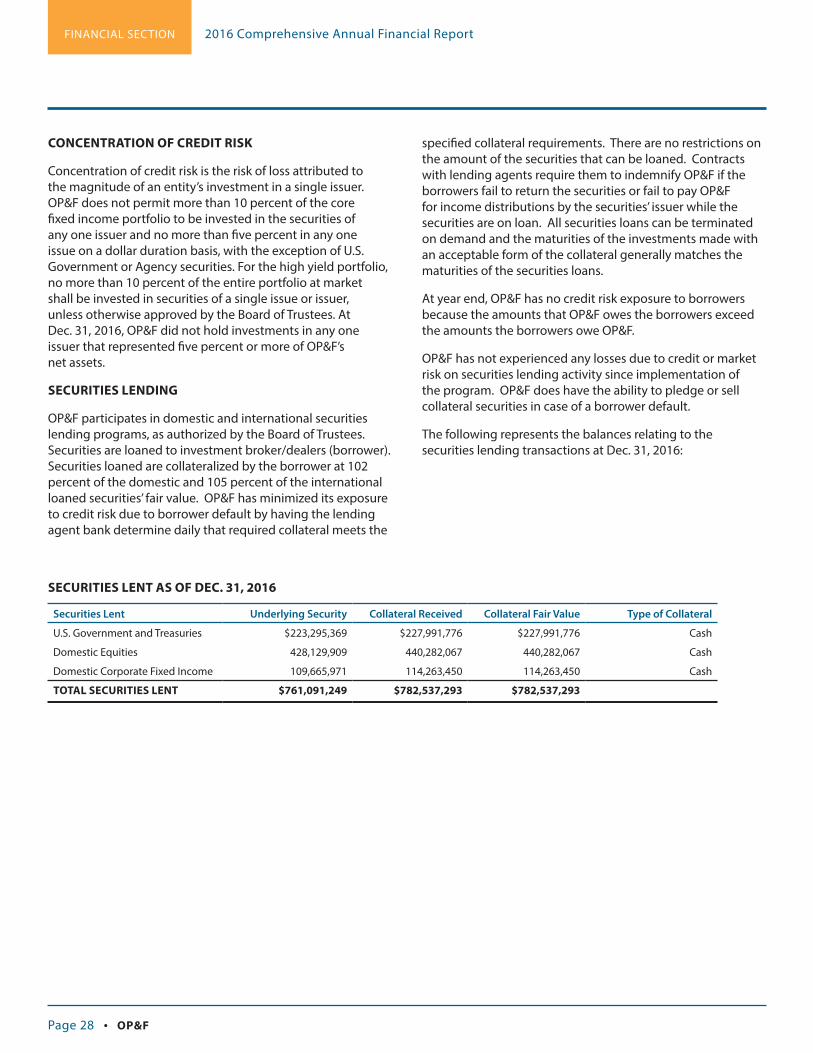
FINANCIAL SECTION 2016 Comprehensive Annual Financial Report
Page 28 • OP&F
SECURITIES LENT AS OF DEC. 31, 2016
Securities Lent Underlying Security Collateral Received Collateral Fair Value Type of Collateral
U.S. Government and Treasuries $223,295,369 $227,991,776 $227,991,776 Cash
Domestic Equities 428,129,909 440,282,067 440,282,067 Cash
Domestic Corporate Fixed Income 109,665,971 114,263,450 114,263,450 Cash
TOTAL SECURITIES LENT $761,091,249 $782,537,293 $782,537,293
CONCENTRATION OF CREDIT RISK
Concentration of credit risk is the risk of loss attributed to the magnitude of an entity’s investment in a single issuer. OP&F does not permit more than 10 percent of the core fixed income portfolio to be invested in the securities of any one issuer and no more than five percent in any one issue on a dollar duration basis, with the exception of U.S. Government or Agency securities. For the high yield portfolio, no more than 10 percent of the entire portfolio at market shall be invested in securities of a single issue or issuer, unless otherwise approved by the Board of Trustees. At Dec. 31, 2016, OP&F did not hold investments in any one issuer that represented five percent or more of OP&F’s net assets.
SECURITIES LENDING
OP&F participates in domestic and international securities lending programs, as authorized by the Board of Trustees. Securities are loaned to investment broker/dealers (borrower). Securities loaned are collateralized by the borrower at 102 percent of the domestic and 105 percent of the international loaned securities’ fair value. OP&F has minimized its exposure to credit risk due to borrower default by having the lending agent bank determine daily that required collateral meets the
specified collateral requirements. There are no restrictions on the amount of the securities that can be loaned. Contracts with lending agents require them to indemnify OP&F if the borrowers fail to return the securities or fail to pay OP&F for income distributions by the securities’ issuer while the securities are on loan. All securities loans can be terminated on demand and the maturities of the investments made with an acceptable form of the collateral generally matches the maturities of the securities loans.
At year end, OP&F has no credit risk exposure to borrowers because the amounts that OP&F owes the borrowers exceed the amounts the borrowers owe OP&F.
OP&F has not experienced any losses due to credit or market risk on securities lending activity since implementation of the program. OP&F does have the ability to pledge or sell collateral securities in case of a borrower default.
The following represents the balances relating to the securities lending transactions at Dec. 31, 2016:

FINANCIAL SECTION2016 Comprehensive Annual Financial Report
OP&F • Page 29
FOREIGN CURRENCY RISK
Foreign currency risk is the risk that changes in exchange rates will adversely affect the fair value of an investment or a deposit. OP&F’s target allocation to international equity holdings was 19.1 percent as of Dec. 31, 2016. While OP&F has no specific policy regarding the international custodial credit risk, OP&F limits its international investment managers
to hold five percent or less of their total portfolio in cash. Apart from cash needed for immediate settlement of pending trade transactions, (local cash awaiting repatriation), any excess cash received in OP&F’s trust accounts is invested in a U.S. Dollar denominated Short-Term Investment Fund (STIF). For the year ending Dec. 31, 2016, OP&F’s exposure to foreign currency risk is as follows:
2016 EXPOSURE TO FOREIGN CURRENCY RISK
Currency
Fair Value (Cash
Deposits)
Fair Value (Fixed
Income)
Fair Value (Currency
Contracts)Fair Value (Equities)
Fair Value (Private
Equities)
Total Fair Value (Cash Deposits and Securities)
Australian Dollar $938,126 $- $(164,508) $72,781,436 $- $73,555,054
Brazilian Real 33,896 1,921,205 35,369 20,951,380 - 22,941,850
British Pound 2,824,499 2,748,011 (420,136) 395,221,716 - 400,374,090
Canadian Dollar 418,227 - (70,728) 91,590,750 - 91,938,249
Chilean Peso 14,628 - - 6,990,659 - 7,005,287
Danish Kroner 39,801 10,662,097 567,829 22,302,785 - 33,572,512
Euro 496,058 5,089,196 (674,111) 535,835,572 76,072,862 616,819,577
Hong Kong Dollar 644,866 - (1,070) 75,328,356 - 75,972,152
Hungarian Forint - - - 678,613 - 678,613
Indonesian Rupiah 9,926 - - 7,756,019 - 7,765,945
Japanese Yen 875,492 - (497,828) 293,292,736 9,308,327 302,978,727
Malaysian Ringgit 68,250 - 16,641 4,356,013 - 4,440,904
Mexican Peso 10,774 - (34,216) 2,075,408 - 2,051,966
New Turkish Lira 137 - - 3,162,424 - 3,162,561
New Zealand Dollar - - 5,006 3,584,863 - 3,589,869
Norwegian Krone 223 - - 2,669,656 - 2,669,879
Philippine Peso - - - 465,710 - 465,710
Polish Zloty - - - 2,385,294 - 2,385,294
Russian Ruble - - 80,486 2,391,732 - 2,472,218
Singapore Dollar 10,001 - 52,357 20,117,695 - 20,180,053
South African Rand - - - 5,455,872 - 5,455,872
South Korean Won 2,625 - 234,082 42,657,947 - 42,894,654
Swedish Krona 61,244 - (3,001) 32,748,031 - 32,806,274
Swiss Franc 5 - (13,080) 192,082,301 - 192,069,226
Taiwanese New Dollar - - 122,795 20,359,282 - 20,482,077
Thailand Baht - - - 11,039,853 - 11,039,853
UAE Dirham - - - 1,351,411 - 1,351,411
GRAND TOTAL $6,448,778 $20,420,509 $(764,113) $1,869,633,514 $85,381,189 $1,981,119,877

FINANCIAL SECTION 2016 Comprehensive Annual Financial Report
Page 30 • OP&F
DERIVATIVES
Derivatives are generally defined as investment instruments whose value depends on, or is derived from, the value of an underlying asset, reference rate, or index.
OP&F has classified the following as derivatives:
• Mortgage and Asset-Backed Securities: OP&F invested in Planned Amortization Class and Sequential Pay Real Estate Mortgage Investment Conduit bonds issued by GNMA, FHLMC, and FNMA. Planned Amortization Class bonds are retired according to a payment schedule so as to have a stable average life and yield even if expected prepayment rates change within a specified broad range of prepayment possibilities. Sequential pay bonds begin to pay principal when classes with an earlier priority have paid to a zero balance. Such bonds enjoy uninterrupted payment of principal until paid to a zero balance. In terms of credit risk, the U.S. government explicitly backs GNMA mortgage securities programs and is viewed by the market as implicitly backing FHLMC and FNMA mortgage securities programs.
• Futures Contracts: Futures contracts are contracts to buy or sell units of an index or financial instrument on a specified future date at a price agreed upon when the contract is originated. OP&F had futures exposure
with seven external managers constituting $1.7 billion of notional value as of Dec. 31, 2016. This amount represented 11.8 percent of the total portfolio. OP&F uses this exposure to synthetics to maintain market exposure while also increasing liquidity and flexibility.
• Forward-Currency Contracts: Forward currency contracts are legal agreements between two parties to purchase and sell a foreign currency, for a price specified at the contract date, with delivery and settlement in the future. OP&F, through its external investment managers, enters into forward currency contracts to hedge underlying foreign currency exposure in its non-U.S. equity portfolios back to the U.S. dollar or to provide the quantity of foreign currency needed to settle trades.
All the contracts are valued at the spot foreign exchange rate at Dec. 31, 2016. The changes in the value of the open contracts are recognized as unrealized appreciation/depreciation. A realized gain or loss is recorded at the time of the delivery/closing of the contract. The realized gain or loss is the difference between the value of the original contract and the closing/delivery value of such contracts. Both realized and unrealized gains and losses are included in the Statement of Changes in Fiduciary Net Position as net appreciation/depreciation. The following table represents the balances of the outstanding currency transactions as of Dec. 31, 2016:
OPEN CURRENCY CONTRACTS AS OF DEC. 31, 2016
PurposeFair Value
(Outstanding Purchases)Fair Value
(Outstanding Sales)Unrealized Appreciation/
(Depreciation)
Trade Settlement $1,429,262 $1,423,131 $6,131
Position Hedging 89,436,869 90,207,113 (770,244)
GRAND TOTAL $90,866,131 $91,630,244 $(764,113)

FINANCIAL SECTION2016 Comprehensive Annual Financial Report
OP&F • Page 31
SWAP HOLDINGS AS OF DEC. 31, 2016
Type of Swap Notional Long Notional Short Net Notional Fair Value
Interest Rate Swap $28,473,349 $(213,262,314) $(184,788,965) $48,709
Credit Default Swap 9,100,000 (4,654,750) 4,445,250 (4,239)
GRAND TOTAL $37,573,349 $(217,917,064) $(180,343,715) $44,470
On delivered/closed currency contracts OP&F had a realized loss of $1,451,102 in 2016.
• Options: An option is the right, but not the obligation, to buy or sell a specific amount of a given security or other financial assets at a specified price during a specified period of time. OP&F invests in options as part of its portable alpha program. OP&F’s exposure represented less than one percent of the total portfolio fair value at year-end.
• Swaps: A swap is a derivative contract through which two parties exchange financial instruments that involve cash flows based on a notional principal amount to which both parties agree. Usually, the principal does not change hands but each cash flow comprises one leg of the swap. One cash flow is generally fixed, while the other is variable and based on a benchmark interest rate, floating currency exchange rate or index price.
In 2016, OP&F invested in interest rate and credit default swaps through one external manager. The notional principal and the fair value for both as of Dec. 31, 2016 were:
OP&F has not violated any legal, regulatory, or contractual provisions by its participation in these types of derivative instruments and there is no known undue credit, market, or legal risk. These instruments were purchased in order to enhance OP&F’s overall rate of return.
6 – DEFERRED COMPENSATION PLANOP&F does not sponsor a deferred compensation program. OP&F employees are eligible to participate in the deferred compensation plan sponsored by the State of Ohio. The state-sponsored plan was created in accordance with IRS Code Section 457. The plan is available to all OP&F employees and permits them to defer a portion of their salary until future years. Deferred compensation assets are not available to employees until termination, retirement, death, or unforeseeable emergency.
IRS Code Section 457 requires that the amount of compensation assets deferred under a plan, all property and rights and all income attributable to those amounts, property or rights, be held in trust for the benefit of the participants. This insulates IRS Code Section 457 benefits from the claims of an employer’s general creditors. Accordingly, OP&F does not include the deferred compensation assets or liabilities of the Ohio Deferred Compensation Plan in its financial statements.

FINANCIAL SECTION 2016 Comprehensive Annual Financial Report
Page 32 • OP&F
7 – DEFINED BENEFIT PENSION PLANNET PENSION LIABILITY
The net pension liability reported on the statement of fiduciary net position represents a liability to employees for pensions. Pensions are a component of exchange transactions, between an employer and its employees, of salaries and benefits for employee services. Pensions are provided to an employee on a deferred-payment basis as part of the total compensation package offered by an employer for employee services each financial period. The obligation to sacrifice recourses for pensions is a present obligation because it was created as a result of employment exchanges that already have occurred.The net pension liability represents OP&F’s proportionate share of each pension plan’s collective actuarial present value of projected benefit payments attributed to past periods of service, net of each pension plan’s fiduciary net position. The net pension liability calculation is dependent on critical long-term variables, including estimated average life expectancies, earnings on investments, cost of living adjustments and others. While these estimates use the best information available, unknown future events require this estimate to be adjusted annually.
ORC limits OP&F’s obligation for this liability to annually required payments. OP&F cannot control benefit terms or the manner in which pensions are financed; however, OP&F does receive the benefit of employees’ services in exchange for compensation including pension.
GASB No. 68 assumes the liability is solely the obligation of the employer, because (1) they benefit from employee services; and (2) state statute requires all funding to come from these employers. All contributions to date have come solely from these employers (which also includes costs paid in the form of withholdings from employees). State statute requires the pension plans to amortize unfunded liabilities within 30 years. If the amortization period exceeds 30 years, each pension plan’s board must propose corrective action to the state legislature. Any resulting legislative change to benefits or funding could significantly affect the net pension liability. Resulting adjustments to the net pension liability would be effective when the changes are legally enforceable.
The proportionate share of each plan’s unfunded benefits is presented as a long-term net pension liability on the accrual basis of accounting. Any liability for the contractually-required pension contribution outstanding at the end of the year is included in intergovernmental payable on the accrual basis of accounting.
PLAN DESCRIPTION – OHIO PUBLIC EMPLOYEES RETIREMENT SYSTEM (OPERS)
Public employees participate in OPERS, a cost-sharing multiple-employer public employee retirement system administered by OPERS. OPERS provides retirement and disability benefits to members and death and survivor benefits to beneficiaries. OPERS also provides health care benefits to some retirees and beneficiaries. OPERS issues a stand-alone financial report that includes financial statements, RSI and detailed information about OPERS’ fiduciary net position. That report can be obtained by writing to OPERS, 277 E. Town Street, Columbus, OH 43215, or by visiting the OPERS website: www.OPERS.org.
New members have a choice of three retirement plans: The Traditional Plan (defined benefit plan); the Combined Plan (combination of defined benefit and defined contributions plans); and the Member Directed Plan (defined contribution plan with the option upon retirement to use the defined contribution account balance to purchase a defined benefit annuity). Benefits are established by Chapter 145 of the ORC. The defined benefit (DB) plan offers an annual retirement allowance based on final average salary multiplied by a percentage that varies based on years of service.
Senate Bill (SB) 343 was enacted into law with an effective date of Jan. 7, 2013. In the legislation, members were categorized into three groups with varying provisions of the law applicable to each group. Members who were eligible to retire under law in effect prior to SB 343 or who will be eligible to retire no later than five years after Jan. 7, 2013 comprise transition Group A. Members who have 20 years of service credit prior to Jan. 7, 2013 or who will be eligible to retire no later than 10 years after Jan. 7, 2013 are included in transition Group B. Group C includes those members who are not in either of the other groups and members who were hired on or after Jan. 7, 2013.
Benefit payments vary in amount depending on years of service credit, final average salary (FAS), age and plan of payment selection. FAS is the average of the three highest years of earnable salary for Group A and B; and the average of the five highest years of earnable salary for members in Group C. The age-and-service formula benefit cannot exceed 100 percent of the FAS (Law Enforcement is 90 percent) or the limits under IRC Section 415 and may be subject to the contribution-based benefit cap. The base benefit amount calculated by the formula will be reduced if a member begins receiving a retirement benefit before reaching the age-and-service requirements for an unreduced benefit.

FINANCIAL SECTION2016 Comprehensive Annual Financial Report
OP&F • Page 33
In the Traditional Pension Plan (DB), the benefit formula for the state and local members in transition Group A and B applies a factor of 2.2 percent to the member’s FAS for the first 30 years of service. A factor of 2.5 percent is applied to years of service in excess of 30. The benefit formula for state and local members in transition Group C applies a factor of 2.2 percent to the member’s FAS for the first 35 years of service and a factor of 2.5 percent is applied to years of service in excess of 35.
In the Combined Plan, the benefit formula for the defined benefit component of the plan for state and local members in transition Group A and B applies a factor of one percent to the member’s FAS for the first 30 years of service. A factor of 1.25 percent is applied to years of service in excess of 30. The benefit formula for transaction Group C applies a factor of one percent to the member’s FAS and the first 35 years of service and a factor of 1.25 percent is applied to years in excess of 35.
When a benefit recipient has received benefits for 12 months, an annual COLA is provided. This COLA is calculated on the base retirement benefit at the date of retirement and is not compounded. For those retiring prior to Jan. 7, 2013, the COLA will continue to be three percent simple annual COLA. For those retiring after Jan. 7, 2013, beginning in calendar year 2019, the COLA will be based on the average percentage increase in the Consumer Price Index, capped at three percent.
A DB or Combined Plan member with five or more years of service credit who is determined to be disabled may qualify for a disability benefit.
FUNDING POLICY – OPERS
Employees covered by OPERS are required to contribute 10 percent of their salary to the plan and employers are required to contribute 14 percent. Both rates are at the statutory maximum.
OP&F’s contractually required contribution to OPERS was $2,358,670 for year end Dec. 31, 2016. Of this amount $1,200,689 is reported as a deferred outflow - contribution subsequent to the measurement date.
PENSION LIABILITIES, PENSION EXPENSE, DEFERRED OUTFLOWS OF RESOURCES AND DEFERRED INFLOWS OF RESOURCES RELATED TO PENSIONS
The net pension liability was measured as of Dec. 31, 2015 and the total pension liability used to calculate the net pension liability was determined by an actuarial valuation as of that date. OP&F’s proportion of the net pension liability was based on OP&F’s share of contributions to the pension plan relative to the contributions of all participating entities. Following is information related to the proportionate share and pension expense:
OPERS Traditional Combined Member Directed TOTAL
Proportionate Share of the Net Pension Asset $- $63,275 $837 $64,112
Proportionate Share of the Net Pension Liability $(10,779,540) $- $- $(10,779,540)
Proportion of the Net Pension Asset/Liability 0.06% 0.13% 0.22% 0.07%
Pension Expense $2,274,758 $41,060 $95 $2,315,913
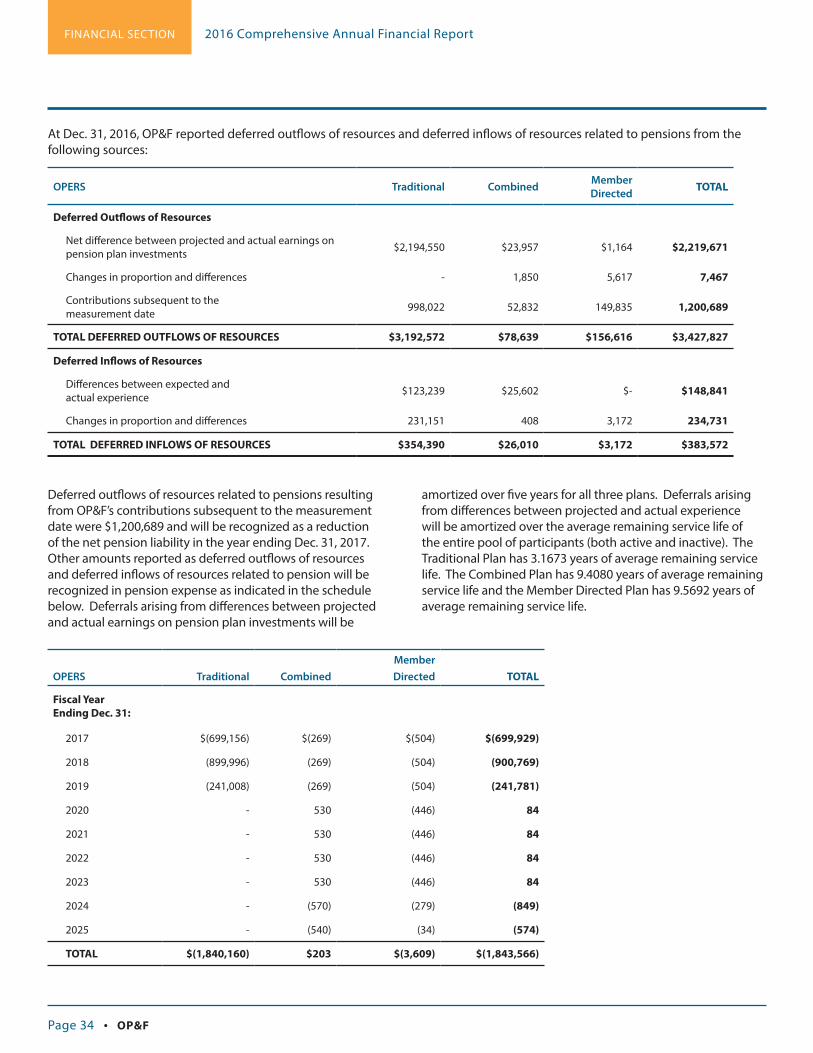
FINANCIAL SECTION 2016 Comprehensive Annual Financial Report
Page 34 • OP&F
OPERS Traditional CombinedMember Directed TOTAL
Fiscal Year Ending Dec. 31:
2017 $(699,156) $(269) $(504) $(699,929)
2018 (899,996) (269) (504) (900,769)
2019 (241,008) (269) (504) (241,781)
2020 - 530 (446) 84
2021 - 530 (446) 84
2022 - 530 (446) 84
2023 - 530 (446) 84
2024 - (570) (279) (849)
2025 - (540) (34) (574)
TOTAL $(1,840,160) $203 $(3,609) $(1,843,566)
At Dec. 31, 2016, OP&F reported deferred outflows of resources and deferred inflows of resources related to pensions from the following sources:
Deferred outflows of resources related to pensions resulting from OP&F’s contributions subsequent to the measurement date were $1,200,689 and will be recognized as a reduction of the net pension liability in the year ending Dec. 31, 2017. Other amounts reported as deferred outflows of resources and deferred inflows of resources related to pension will be recognized in pension expense as indicated in the schedule below. Deferrals arising from differences between projected and actual earnings on pension plan investments will be
amortized over five years for all three plans. Deferrals arising from differences between projected and actual experience will be amortized over the average remaining service life of the entire pool of participants (both active and inactive). The Traditional Plan has 3.1673 years of average remaining service life. The Combined Plan has 9.4080 years of average remaining service life and the Member Directed Plan has 9.5692 years of average remaining service life.
OPERS Traditional Combined Member Directed TOTAL
Deferred Outflows of Resources
Net difference between projected and actual earnings on pension plan investments $2,194,550 $23,957 $1,164 $2,219,671
Changes in proportion and differences - 1,850 5,617 7,467
Contributions subsequent to the measurement date 998,022 52,832 149,835 1,200,689
TOTAL DEFERRED OUTFLOWS OF RESOURCES $3,192,572 $78,639 $156,616 $3,427,827
Deferred Inflows of Resources
Differences between expected and actual experience $123,239 $25,602 $- $148,841
Changes in proportion and differences 231,151 408 3,172 234,731
TOTAL DEFERRED INFLOWS OF RESOURCES $354,390 $26,010 $3,172 $383,572

FINANCIAL SECTION2016 Comprehensive Annual Financial Report
OP&F • Page 35
ACTUARIAL ASSUMPTIONS – OPERS
OPERS’ total pension liability was determined by their actuaries in accordance with GASB Statement No. 67, as part of their annual actuarial valuation for each defined benefit retirement plan. Actuarial valuations of an ongoing plan involve estimates of the value of reported amounts (e.g., salaries, credited service) and assumptions about the probability of occurrence of events far into the future (e.g., mortality, disabilities, retirements, employment termination). Actuarially determined amounts are subject to continual review and potential modifications, as actual results are compared with past expectations and new estimates are made about the future.
Projections of benefits for financial reporting purposes are based on the substantive plan (the plan as understood by the employers and plan members) and include the types of benefits provided at the time of each valuation and the historical pattern of sharing benefit costs between the employers and plan members to that point. The projection of benefits for financial reporting purposes does not explicitly incorporate the potential effects of legal or contractual funding limitations.
Actuarial calculations reflect a long-term perspective. For a newly hired employee, actuarial calculations will take into account the employee’s entire career with the employer and also take into consideration the benefits, if any, paid to the employee after termination of employment until the death of the employee and any applicable contingent annuitant. In many cases actuarial calculations reflect several decades of service with the employer and the payment of benefits after termination.
Key methods and assumptions used in calculating the total pension liability in the latest actuarial valuation, prepared as of Dec. 31, 2015, are presented below:
KEY METHODS AND ASSUMPTIONS USED IN VALUATION OF TOTAL PENSION LIABILITY
Actuarial InformationTraditional Pension Plan
Combined Plan and Member Directed Plan
Valuation Date Dec. 31, 2015 Dec. 31, 2015
Experience Study 5-Year Period Ended Dec. 31, 2010 5-Year Period Ended Dec. 31, 2010
Actuarial Cost Method Individual entry age Individual entry age
Actuarial Assumptions
Investment Rate of Return 8.00% 8.00%
Wage Inflation 3.75% 3.75%
Projected Salary Increases 4.25%-10.05% (includes wage inflation at 3.75%)
4.25%-8.05% (includes wage inflation at 3.75%)
Cost-of-living Adjustments Pre Jan. 7, 2013 Retirees: 3.00% Simple Post Jan. 7, 2013 Retirees: 3.00% Simple Through 2018, then 2.80% Simple
Pre Jan. 7, 2013 Retirees: 3.00% Simple Post Jan. 7, 2013 Retirees: 3.00% Simple Through 2018, then 2.80% Simple

FINANCIAL SECTION 2016 Comprehensive Annual Financial Report
Page 36 • OP&F
Mortality rates are based on the RP-2000 mortality table projected 20 year using Projection Scale AA. For males, 105 percent of the combined healthy male mortality rates were used. For females, 100 percent of the combined healthy female mortality rates were used. The mortality rates used in evaluating disability allowances were based on the RP-2000 mortality table with no projection. For males, 120 percent of the disabled female mortality rates were used, set forward two years. For females, 100 percent of the disabled female mortality rates were used.
DISCOUNT RATE – OPERS
The discount rate used to measure the total pension liability was 8.0 percent for the Traditional Pension Plan, the Combined Plan and the Member Directed Plan. The projection of cash flows used to determine the discount rate assumed that contributions from plan members and those of the contributing employers are made at the contractually required rates, as actuarially determined. Based on those assumptions,
the pension plan’s fiduciary net position was projected to be available to make all projected future benefit payments of current plan members. Therefore, the long-term expected rates of return on pension plan investments for the Traditional Pension Plan, the Combined Plan and the Member Directed Plan were applied to all periods of projected benefit payments to determine the total pension liability. SENSITIVITY OF OP&F’S PROPORTIONATE SHARE TO THE NET PENSION LIABILITY TO CHANGES IN THE DISCOUNT RATE
The following table presents OP&F’s proportionate share of the net pension liability calculated using the current period discount rate assumption of 8.0 percent as well as what OP&F’s proportionate share of the net pension liability would be if it were calculated using a discount rate that is one-percentage-point lower, (7.0 percent), or one-percentage-point higher, (9.0 percent), than the current rate:
OP&F’s proportionate share of the Net Pension Liability (Asset)
One Percent Decrease
Current Discount Rate
One Percent Increase
Discount Rate 7.0% 8.0% 9.0%
Traditional Pension Plan $17,174,441 $10,779,540 $5,385,644
Combined Plan $(1,300) $(63,275) $(113,126)
Member Directed Plan $2,189 $(837) $(2,189)

FINANCIAL SECTION2016 Comprehensive Annual Financial Report
OP&F • Page 37
The following table displays OPERS’ Board-approved asset allocation policy of the Defined Benefit portfolio for 2015 and long-term expected real rates of return:
Asset ClassTarget Allocation
for 2015Weighted Average Long-Term Expected
Real Rate of Return (Arithmetic)
Fixed Income 23.00% 2.31%
Domestic Equities 20.70% 5.84%
Real Estate 10.00% 4.25%
Private Equity 10.00% 9.25%
International Equities 18.30% 7.40%
Other Investments 18.00% 4.59%
TOTAL 100.00% 5.27%
The long-term expected rate of return on defined benefit investment assets was determined using a building-block method in which best-estimate ranges of expected future real rates of return are developed for each major asset class. These ranges are combined to produce the long-term expected rate of return by weighting the expected future real rates of return by the target asset allocation percentage, adjusted for inflation.
OPERS manages investments in four investment portfolios: the DB Portfolio, the Health Care portfolio, the 115 Health Care Trust portfolio and the Defined Contribution portfolio. The DB portfolio includes the investment assets of the Traditional Pension Plan, the DB component of the Combined Plan, the annuitized accounts of the Member-Directed Plan and the Voluntary Employees’ Beneficiary Association Trust (VEBA Trust). Within the DB Portfolio, contributions into the plans are all recorded at the same time and benefit payments all occur on the first of the month. Accordingly, the money-weighted rate of return is considered to be the same for all plans within the portfolio. The money-weighted rate of return, net of investment expense, for the DB portfolio is 0.4 percent for 2015.

FINANCIAL SECTION 2016 Comprehensive Annual Financial Report
Page 38 • OP&F
8 – COMPENSATED ABSENCESAs of Dec. 31, 2016, $2.3 million were accrued for unused vacation and sick leave for OP&F employees. To help OP&F reduce and manage the vacation liability, all employees with at least one year of continuous service as of the beginning of the current calendar year are required to use five consecutive workdays of vacation leave each year. Upon termination of employment, employees will be paid for unused vacation time that has been earned through the last day of work. Three-fourths of accrued but unused sick leave will be paid at the employee’s base rate upon termination of employment.
9 – SELF-INSURED HEALTH CARE FOR EMPLOYEES OF OP&FOP&F is self-insured for employee benefits for medical, dental, vision and hospitalization. A third-party administrator manages the program. OP&F holds a stop-loss policy of $90,000 per employee per year.
10 – OTHER POST-EMPLOYMENT BENEFITS (OPEB)In addition to the pension benefits described in note seven, OPERS provides post-retirement health care coverage to age and service retirees with qualifying Ohio service credit. OPERS administers a cost-sharing, multiple-employer defined benefit post-employment healthcare plan, which includes a medical plan, prescription drug program and Medicare Part B premium reimbursement, to qualifying members of both the Traditional Pension and the Combined plans. Members of the Member-Directed Plan do not qualify for ancillary benefits, including post-employment health care coverage.
OPERS provides medical benefits to retired public employees of public employers who are subject to coverage under Chapter 145 of the ORC. Chapter 145 of the ORC assigns the authority to establish and amend benefit provisions to the OPERS Board of Trustees. OPERS issues a publicly available financial report that includes financial statements and RSI for OPERS. That report may be obtained by visiting www.opers.org/investments/cafr.shtml, by writing to OPERS, 277 East Town Street, Columbus, OH 43215-4642, or by calling (614) 222-5601 or 800-222-7377.
Chapter 145 of the ORC provides that contribution requirements of the participating employers and of plan members to the OPERS (defined benefit pension plan) are established and may be amended by the OPERS Board of Trustees. Participating employers and active pension plan members are required to contribute to the pension plan at rates expressed as percentages of the payroll of active pension plan members, currently 14 percent and 10 percent
of payroll, respectively. Chapter 145 of the ORC states that the employer contribution rate may not exceed 14 percent of payroll and that the employee contribution rate may not exceed 10 percent.
OPERS’ post employment health care plan was established under, and is administered in accordance with, IRS Code Section 401(h). Each year, the OPERS Board of Trustees determines the portion of the employer contribution rate that will be set aside for funding of post employment health care benefits. For the year ended Dec. 31, 2016, the employer contribution allocated to the retiree health care plan was 2.0 percent of employer contributions. The amount of employer contributions allocated to the health care plan each year is subject to the Trustees’ primary responsibility to ensure that pension benefits are adequately funded and also is limited by the provisions of Section 401(h).
The OPERS Board of Trustees is also authorized to establish requirements for contributions to the retiree health care plan by retirees or their surviving beneficiaries. Payment amounts vary depending on the number of covered dependents and the coverage selected.
The following chart lists OP&F’s employer contributions and the amounts allocated to health care.
ANNUAL REQUIRED PENSION AND HEALTH CARE CONTRIBUTIONS
Year Ended
Pension
Annual
Required
Contributions
Pension
Percent
Contributed
Health Care
Annual
Required
Contributions
Health Care
Percent
Contributed
2016 $1,356,608 100% $193,724 100%
2015* 1,301,933 100% 185,916 100%
2014 1,264,620 100% 180,664 100%
* Annual Required Health Care Contributions for 2015 were restated to re-flect 2.0 percent of employer contributions that were allocated to the retiree health care plan.

FINANCIAL SECTION2016 Comprehensive Annual Financial Report
OP&F • Page 39
11 – COMMITMENTS AND CONTINGENCIESOP&F is a defendant in a number of lawsuits pertaining to matters that are incidental to performing routine business functions. OP&F’s management is of the opinion that ultimate resolution of such claims will not result in a material, adverse effect on OP&F’s financial position as of Dec. 31, 2016.
OP&F is committed to making additional capital contributions to the following investment types as of Dec. 31, 2016:
Asset ClassUnfunded
CommitmentsFair Value
At Dec. 31, 2016
Private Equity* $818,273,464 $914,795,737
Private Debt 189,122,957 298,895,397
Real Estate 404,825,228 1,583,586,006
Timber 132,123,635 301,439,041
GRAND TOTAL $1,544,345,284 $3,098,716,181
* Included in the Private Equity are seven Euro based unfunded commitments totaling as of Dec. 31, 2016:
€ 93,176,050 (€ = Euro) ($98,277,435 U.S.D.)
12 – STATE OF OHIO PUBLIC SAFETY OFFICERS DEATH BENEFIT FUNDPursuant to ORC Section 742.62, the Board of Trustees of the OP&F administers the State of Ohio Public Safety Officers Death Benefit Fund. This program was established by the State of Ohio to provide monthly benefit payments to eligible surviving family members of Ohio public safety officers who have been killed in the line of duty or die of a duty–related injury or illness. Funds are disbursed to OP&F on a quarterly basis each state fiscal year (July 1-June 30) and are paid monthly by OP&F to eligible recipients. The unused balance at June 30 is returned to the State. The Public Safety Officers Death Benefit Fund is considered to be an agency fund administered by OP&F and, accordingly, its assets of $517,051 and the related liability for unpaid benefits are included in the accompanying financial statements as of Dec. 31, 2016.

FINANCIAL SECTION 2016 Comprehensive Annual Financial Report
Page 40 • OP&F
The total pension liability is determined by OP&F’s actuaries in accordance with GASB Statement No. 67, as part of their annual valuation. Actuarial valuations of an ongoing retirement plan involve estimates of the value of reported amounts and assumptions about probability of occurrence of events far into the future. Examples include assumptions about future employment mortality, salary increases, disabilities, retirements and employment terminations. Actuarially determined amounts are subject to continual review and potential modifications, as actual results are compared with past expectations and new estimates are made about the future.
The Schedule of Employers’ Net Pension Liability presents multi-year trend information about whether the fiduciary net positions are increasing or decreasing over time relative to the total pension liability. These schedules are presented in the RSI section. The total pension liability as of Dec. 31, 2016, is based on the results of an actuarial valuation date of Jan. 1, 2016 and rolled-forward using generally accepted actuarial procedures.
A summary of the actuarial assumptions as of the latest actuarial valuation is shown below:
ACTUARIAL ASSUMPTIONS
Valuation date Jan. 1, 2016
Actuarial cost method Entry age
Investment rate of return 8.25%
Projected salary increases 4.25% - 11.00%
Payroll increases 3.75%
Inflation assumptions 3.25%
Cost-of-living adjustments 2.60% and 3.00% simple
13 – EMPLOYERS’ NET PENSION LIABILITY (SURPLUS)
Year Ending Dec. 31
(a) Total Pension
Liability
(b) Plan Fiduciary
Net Position
(a)-(b)=(c) Net Pension
Liability (Surplus)
(b) / (a)
Plan Fiduciary Net Pension as a
Percentage of Total Pension Liability
(d) Covered
Employee Payroll
(c) / (d) Net Pension
Liability (Surplus) as a Percentage
of Covered Employee Payroll
2016 $20,016,288,888 $13,682,389,240 $6,333,899,648 68.36% $2,094,550,962 302.40%
THE COMPONENTS OF THE NET PENSION LIABILITY OF EMPLOYERS AS OF DEC. 31, 2016

FINANCIAL SECTION2016 Comprehensive Annual Financial Report
OP&F • Page 41
The long-term expected rate of return on pension plan investments was determined using a building-block approach and assumes a time horizon, as defined in the Statement of Investment Policy. A forecasted rate of inflation serves as the baseline for the return expected. Various real return premiums over the baseline inflation rate have been established for each asset class. The long-term expected nominal rate of return has been determined by calculating a weighted average of the expected real return premiums for each asset class, adding the projected inflation rate and adding the expected return from rebalancing uncorrelated asset classes. Best estimates of the long-term expected real rates of return for each major asset class included in OP&F’s target asset allocation as of Dec. 31, 2016 are summarized below:
Asset ClassTarget
Allocations10 Year Expected
Real Rate of Return**30 Year Expected
Real Rate of Return**
Cash and Cash Equivalents -% -% -%
Domestic Equity 16.0% 4.46% 5.21%
Non-U.S. Equity 16.0% 4.66% 5.40%
Core Fixed Income* 20.0% 1.67% 2.37%
Global Inflation Protected Securities* 20.0% 0.49% 2.33%
High Yield 15.0% 3.33% 4.48%
Real Estate 12.0% 4.71% 5.65%
Private Markets 8.0% 7.31% 7.99%
Real Assets 5.0% 6.87% 6.87%
Master Limited Partnerships 8.0% 6.92% 7.36%
TOTAL 120.0%
Note: Assumptions are geometric. * Levered 2x. ** Numbers are net of expected inflation.
TARGET ALLOCATIONS

FINANCIAL SECTION 2016 Comprehensive Annual Financial Report
Page 42 • OP&F
OP&F’s Board of Trustees has incorporated the risk parity concept into OP&F’s asset liability valuation with the goal of reducing equity risk exposure, which reduces overall Total Portfolio risk without sacrificing return and creating a more risk-balanced portfolio based on the relationship between asset classes and economic environments. From the notional portfolio perspective above, the Total Portfolio may be levered up to 1.20 times due to the application of leverage in certain fixed income asset classes.
Total pension liability was calculated using the discount rate of 8.25 percent. The projection of cash flows used to determine the discount rate assumed the contributions from employers and from members would be computed based on contribution requirements as stipulated by state statute. Projected inflows from investment earnings were calculated
using the longer-term assumed investment rate of return 8.25 percent. Based on those assumptions, OP&F’s fiduciary net position was projected to be available to make all future benefit payment of current plan members. Therefore, a long-term expected rate of return on pension plan investments was applied to all periods of projected benefits to determine the total pension liability.
Net pension liability is sensitive to changes in the discount rate. To illustrate the potential impact, the following table presents the net pension liability calculated using the discount rate of 8.25 percent, as well as what the net pension liability would be if it were calculated using a discount rate that is one percentage point lower, 7.25 percent, or one percentage point higher, 9.25 percent, than the current rate:
One Percent Decrease Current Discount Rate One Percent Increase
Discount Rate 7.25% 8.25% 9.25%
Total Pension Liability $22,118,393,001 $20,016,288,888 $18,234,727,093
Plan Fiduciary Net Position $13,682,389,240 $13,682,389,240 $13,682,389,240
NET PENSION LIABILITY (SURPLUS) $8,436,003,761 $6,333,899,648 $4,552,337,853
CHANGES IN DISCOUNT RATESensitivity of the Net Pension Liability to Changes in the Discount Rate at Dec. 31, 2016
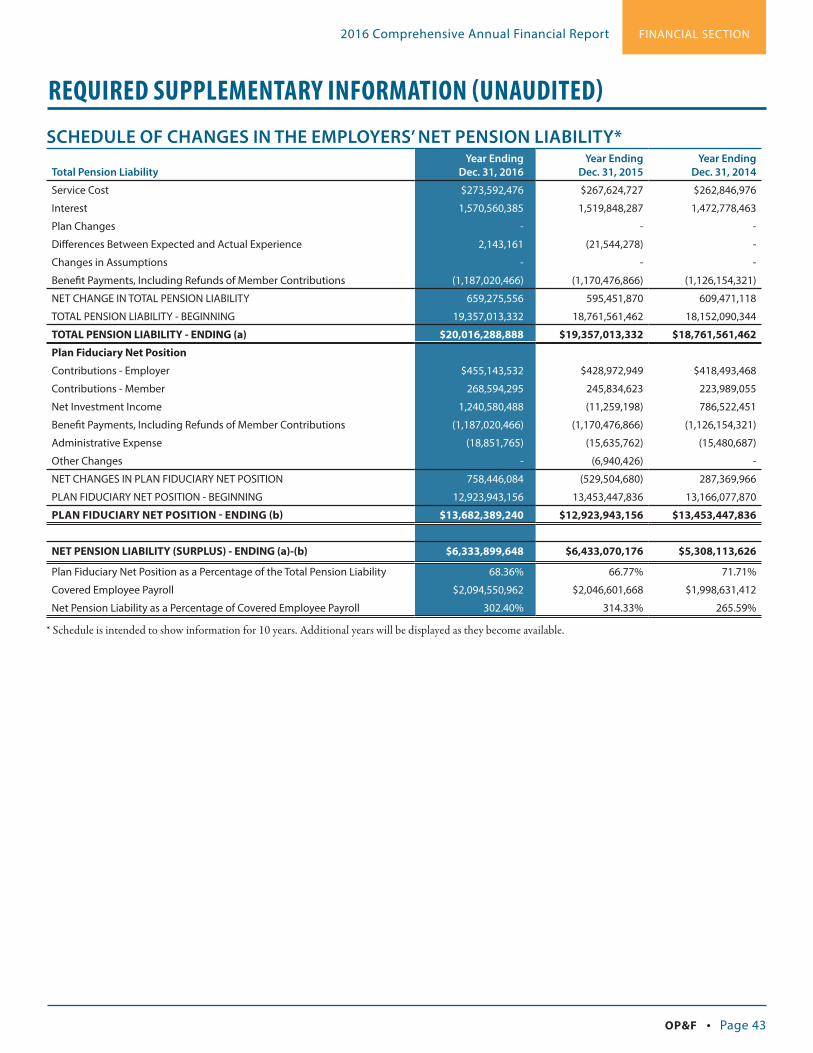
FINANCIAL SECTION2016 Comprehensive Annual Financial Report
OP&F • Page 43
REQUIRED SUPPLEMENTARY INFORMATION (UNAUDITED)
SCHEDULE OF CHANGES IN THE EMPLOYERS’ NET PENSION LIABILITY*
Total Pension LiabilityYear Ending
Dec. 31, 2016Year Ending
Dec. 31, 2015Year Ending
Dec. 31, 2014
Service Cost $273,592,476 $267,624,727 $262,846,976
Interest 1,570,560,385 1,519,848,287 1,472,778,463
Plan Changes - - -
Differences Between Expected and Actual Experience 2,143,161 (21,544,278) -
Changes in Assumptions - - -
Benefit Payments, Including Refunds of Member Contributions (1,187,020,466) (1,170,476,866) (1,126,154,321)
NET CHANGE IN TOTAL PENSION LIABILITY 659,275,556 595,451,870 609,471,118
TOTAL PENSION LIABILITY - BEGINNING 19,357,013,332 18,761,561,462 18,152,090,344
TOTAL PENSION LIABILITY - ENDING (a) $20,016,288,888 $19,357,013,332 $18,761,561,462
Plan Fiduciary Net Position
Contributions - Employer $455,143,532 $428,972,949 $418,493,468
Contributions - Member 268,594,295 245,834,623 223,989,055
Net Investment Income 1,240,580,488 (11,259,198) 786,522,451
Benefit Payments, Including Refunds of Member Contributions (1,187,020,466) (1,170,476,866) (1,126,154,321)
Administrative Expense (18,851,765) (15,635,762) (15,480,687)
Other Changes - (6,940,426) -
NET CHANGES IN PLAN FIDUCIARY NET POSITION 758,446,084 (529,504,680) 287,369,966
PLAN FIDUCIARY NET POSITION - BEGINNING 12,923,943,156 13,453,447,836 13,166,077,870
PLAN FIDUCIARY NET POSITION - ENDING (b) $13,682,389,240 $12,923,943,156 $13,453,447,836
NET PENSION LIABILITY (SURPLUS) - ENDING (a)-(b) $6,333,899,648 $6,433,070,176 $5,308,113,626
Plan Fiduciary Net Position as a Percentage of the Total Pension Liability 68.36% 66.77% 71.71%
Covered Employee Payroll $2,094,550,962 $2,046,601,668 $1,998,631,412
Net Pension Liability as a Percentage of Covered Employee Payroll 302.40% 314.33% 265.59%
* Schedule is intended to show information for 10 years. Additional years will be displayed as they become available.
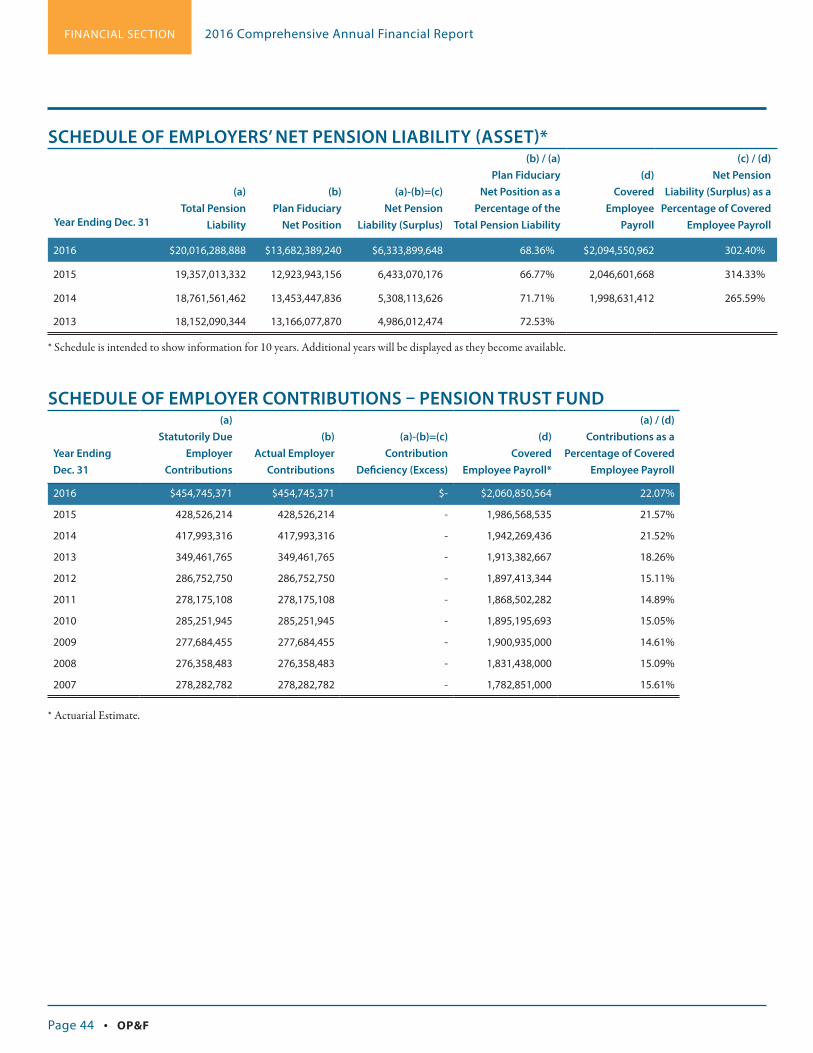
FINANCIAL SECTION 2016 Comprehensive Annual Financial Report
Page 44 • OP&F
SCHEDULE OF EMPLOYERS’ NET PENSION LIABILITY (ASSET)*
Year Ending Dec. 31
(a) Total Pension
Liability
(b) Plan Fiduciary
Net Position
(a)-(b)=(c) Net Pension
Liability (Surplus)
(b) / (a) Plan Fiduciary
Net Position as a Percentage of the
Total Pension Liability
(d)
Covered Employee
Payroll
(c) / (d) Net Pension
Liability (Surplus) as a Percentage of Covered
Employee Payroll
2016 $20,016,288,888 $13,682,389,240 $6,333,899,648 68.36% $2,094,550,962 302.40%
2015 19,357,013,332 12,923,943,156 6,433,070,176 66.77% 2,046,601,668 314.33%
2014 18,761,561,462 13,453,447,836 5,308,113,626 71.71% 1,998,631,412 265.59%
2013 18,152,090,344 13,166,077,870 4,986,012,474 72.53%
* Schedule is intended to show information for 10 years. Additional years will be displayed as they become available.
SCHEDULE OF EMPLOYER CONTRIBUTIONS – PENSION TRUST FUND Year Ending Dec. 31
(a) Statutorily Due
Employer Contributions
(b)
Actual Employer Contributions
(a)-(b)=(c)
Contribution Deficiency (Excess)
(d)
Covered Employee Payroll*
(a) / (d) Contributions as a
Percentage of Covered Employee Payroll
2016 $454,745,371 $454,745,371 $- $2,060,850,564 22.07%
2015 428,526,214 428,526,214 - 1,986,568,535 21.57%
2014 417,993,316 417,993,316 - 1,942,269,436 21.52%
2013 349,461,765 349,461,765 - 1,913,382,667 18.26%
2012 286,752,750 286,752,750 - 1,897,413,344 15.11%
2011 278,175,108 278,175,108 - 1,868,502,282 14.89%
2010 285,251,945 285,251,945 - 1,895,195,693 15.05%
2009 277,684,455 277,684,455 - 1,900,935,000 14.61%
2008 276,358,483 276,358,483 - 1,831,438,000 15.09%
2007 278,282,782 278,282,782 - 1,782,851,000 15.61%
* Actuarial Estimate.
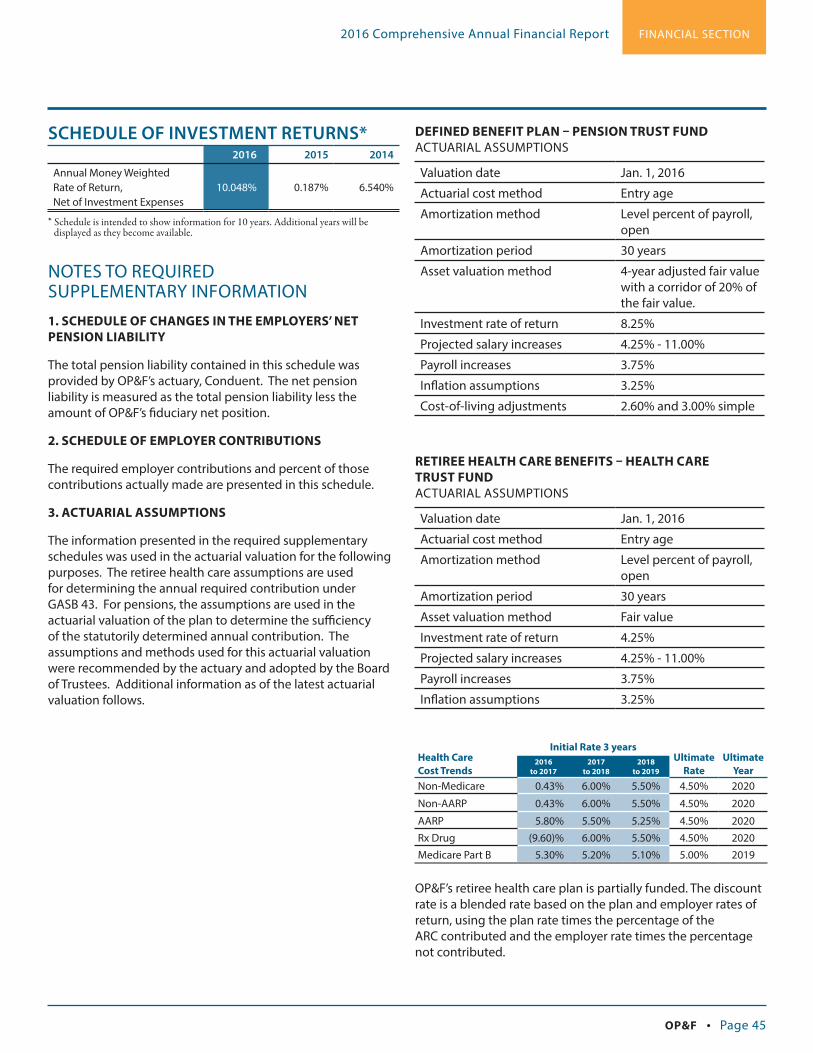
FINANCIAL SECTION2016 Comprehensive Annual Financial Report
OP&F • Page 45
SCHEDULE OF INVESTMENT RETURNS*2016 2015 2014
Annual Money Weighted Rate of Return, Net of Investment Expenses
10.048% 0.187% 6.540%
* Schedule is intended to show information for 10 years. Additional years will be displayed as they become available.
NOTES TO REQUIRED SUPPLEMENTARY INFORMATION1. SCHEDULE OF CHANGES IN THE EMPLOYERS’ NET PENSION LIABILITY
The total pension liability contained in this schedule was provided by OP&F’s actuary, Conduent. The net pension liability is measured as the total pension liability less the amount of OP&F’s fiduciary net position.
2. SCHEDULE OF EMPLOYER CONTRIBUTIONS
The required employer contributions and percent of those contributions actually made are presented in this schedule.
3. ACTUARIAL ASSUMPTIONS
The information presented in the required supplementary schedules was used in the actuarial valuation for the following purposes. The retiree health care assumptions are used for determining the annual required contribution under GASB 43. For pensions, the assumptions are used in the actuarial valuation of the plan to determine the sufficiency of the statutorily determined annual contribution. The assumptions and methods used for this actuarial valuation were recommended by the actuary and adopted by the Board of Trustees. Additional information as of the latest actuarial valuation follows.
DEFINED BENEFIT PLAN – PENSION TRUST FUND ACTUARIAL ASSUMPTIONS
Valuation date Jan. 1, 2016
Actuarial cost method Entry age
Amortization method Level percent of payroll, open
Amortization period 30 years
Asset valuation method 4-year adjusted fair value with a corridor of 20% of the fair value.
Investment rate of return 8.25%
Projected salary increases 4.25% - 11.00%
Payroll increases 3.75%
Inflation assumptions 3.25%
Cost-of-living adjustments 2.60% and 3.00% simple
RETIREE HEALTH CARE BENEFITS – HEALTH CARE TRUST FUND ACTUARIAL ASSUMPTIONS
Valuation date Jan. 1, 2016
Actuarial cost method Entry age
Amortization method Level percent of payroll, open
Amortization period 30 years
Asset valuation method Fair value
Investment rate of return 4.25%
Projected salary increases 4.25% - 11.00%
Payroll increases 3.75%
Inflation assumptions 3.25%
Health Care Cost Trends
Initial Rate 3 yearsUltimate
RateUltimate
Year2016
to 20172017
to 20182018
to 2019
Non-Medicare 0.43% 6.00% 5.50% 4.50% 2020
Non-AARP 0.43% 6.00% 5.50% 4.50% 2020
AARP 5.80% 5.50% 5.25% 4.50% 2020Rx Drug (9.60)% 6.00% 5.50% 4.50% 2020Medicare Part B 5.30% 5.20% 5.10% 5.00% 2019
OP&F’s retiree health care plan is partially funded. The discount rate is a blended rate based on the plan and employer rates of return, using the plan rate times the percentage of the ARC contributed and the employer rate times the percentage not contributed.

FINANCIAL SECTION 2016 Comprehensive Annual Financial Report
Page 46 • OP&F
SCHEDULE OF FUNDING PROGRESS FOR THE VALUATION YEAR ENDING JAN. 1, 2016
RETIREE HEALTH CARE TRUST FUND (DOLLARS IN MILLIONS)
Valuation Year Jan. 1
Valuation Assets
Actuarial Accrued
Liabilities (AAL)
Unfunded Actuarial Accrued
Liabilities (UAAL)
Ratio of Assets to
AAL
Active Member
Payroll
UAAL as Percentage
of Active Member
Payroll
2016 $929.4 $5,166.6 $4,237.2 18.0% $2,060.9 205.6%
2015 1,031.9 5,399.5 4,367.6 19.1% 1,986.6 219.9%
2014 1,053.5 5,244.5 4,191.0 20.1% 1,942.3 215.8%
2013 935.6 4,234.8 3,299.2 22.1% 1,913.4 172.5%
2012 780.1 3,698.7 2,918.6 21.1% 1,897.4 153.8%
2011 717.7 3,295.3 2,577.6 21.8% 1,868.5 137.9%
DESCRIPTION OF SCHEDULE OF FUNDING PROGRESS
Actuarial valuations of an on-going plan involve estimates of the value of reported amounts and assumptions about the probability of occurrence of events far into the future. Examples include assumptions about future mortality and cost trends.
Each time there is a loss due to demographic changes, claims experience or a discount rate change, an unfunded accrued liability is created. Also, if actual investment returns are less favorable than assumed investment returns, the difference
is added to the unfunded accrued liabilities. Actuarially determined amounts are subject to continued review as actual results are compared with past expectations and new estimates are made about the future.
The Schedule of Funding Progress includes two ratios that provide information about whether the financial strength of OP&F is improving or deteriorating over time. An improvement is indicated when the funded ratio (assets expressed as a percentage of the actuarial accrued liability) is increasing and the ratio of the unfunded actuarial liability to payroll is decreasing.
SCHEDULE OF EMPLOYER CONTRIBUTIONS – RETIREE HEALTH CARE TRUST FUND Year Ending Dec. 31
(a)
Statutorily Due* Employer Contributions
(b)
Actual Employer Contributions
(a)-(b)=(c)
Contribution Deficiency (Excess)
(d)
Covered Employee Payroll**
(a) / (d) Contributions as a
Percentage of Covered Employee Payroll
2016 $10,708,739 $10,708,739 $- $2,060,850,584 0.52%
2015 10,211,723 10,211,723 - 1,986,568,535 0.51%
2014 9,895,274 9,895,274 - 1,942,269,436 0.51%
2013 68,720,879 68,720,879 - 1,913,382,667 3.59%
2012 130,285,935 130,285,935 - 1,897,413,344 6.87%
2011 129,297,720 129,297,720 - 1,868,502,282 6.92%
2010 128,774,894 128,774,894 - 1,895,195,693 6.79%
2009 126,649,859 126,649,859 - 1,900,935,000 6.66%
2008 129,544,343 129,544,343 - 1,831,438,000 7.07%
2007 121,721,828 121,721,828 - 1,782,851,000 6.83% * Retiree health care allocation is established by OP&F’s Board of Trustees. ** Actuarial Estimate.

FINANCIAL SECTION2016 Comprehensive Annual Financial Report
OP&F • Page 47
OPERS RELATED REQUIRED SUPPLEMENTARY PENSION INFORMATION
SCHEDULE OF OP&F’S PROPORTIONATE SHARE OF THE NET PENSION LIABILITY OHIO PUBLIC EMPLOYEES RETIREMENT PLAN - TRADITIONAL PENSION PLAN LAST 10 FISCAL YEARS *
2016 2015
OP&F's proportion of the net pension liability (asset) $10,779,540 $7,534,305
OP&F's proportionate of the net pension liability (asset) 0.062233% 0.062468%
OP&F's covered-employee payroll $7,745,508 $7,649,967
OP&F's proportionate share of the net pension liability (asset) as a percentage of its covered-employee payroll
139.17% 98.49%
Plan fiduciary net position as a percentage of the total pension liability 81.08% 86.45%
SCHEDULE OF OP&F’S PROPORTIONATE SHARE OF THE NET PENSION LIABILITY OHIO PUBLIC EMPLOYEES RETIREMENT PLAN - COMBINED PENSION PLAN LAST 10 FISCAL YEARS *
2016 2015
OP&F's proportion of the net pension liability (asset) $(63,275) $(52,363)
OP&F's proportionate of the net pension liability (asset) 0.130030% 0.135973%
OP&F's covered-employee payroll $473,208 $478,275
OP&F's proportionate share of the net pension liability (asset) as a percentage of its covered-employee payroll
(13.37)% (10.95)%
Plan fiduciary net position as a percentage of the total pension liability 116.90% 114.83%
SCHEDULE OF OP&F’S PROPORTIONATE SHARE OF THE NET PENSION LIABILITY OHIO PUBLIC EMPLOYEES RETIREMENT PLAN - MEMBER DIRECTED PLAN LAST 10 FISCAL YEARS *
2016 2015
OP&F's proportion of the net pension liability (asset) $(837) $(1,441)
OP&F's proportionate of the net pension liability (asset) 0.218912% 0.244781%
OP&F's covered-employee payroll $1,045,000 $1,076,864
OP&F's proportionate share of the net pension liability (asset) as a percentage of its covered-employee payroll
(0.08)% (0.13)%
Plan fiduciary net position as a percentage of the total pension liability 103.91% N/A
* The amounts presented were determined as of Dec. 31 of the prior calendar year. GASB 68 was implemented in 2015. This schedule is intended to show information for 10 years. Additional years will be displayed as they become available.
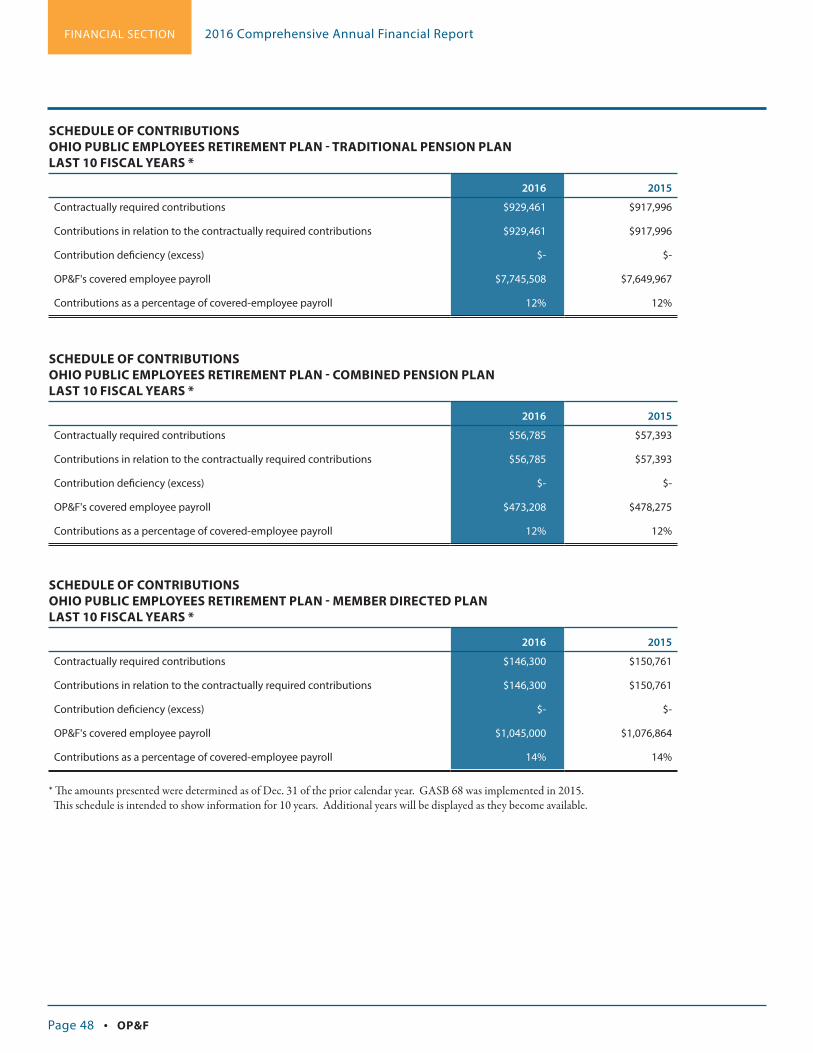
FINANCIAL SECTION 2016 Comprehensive Annual Financial Report
Page 48 • OP&F
SCHEDULE OF CONTRIBUTIONS OHIO PUBLIC EMPLOYEES RETIREMENT PLAN - TRADITIONAL PENSION PLAN LAST 10 FISCAL YEARS *
2016 2015
Contractually required contributions $929,461 $917,996
Contributions in relation to the contractually required contributions $929,461 $917,996
Contribution deficiency (excess) $- $-
OP&F's covered employee payroll $7,745,508 $7,649,967
Contributions as a percentage of covered-employee payroll 12% 12%
SCHEDULE OF CONTRIBUTIONS OHIO PUBLIC EMPLOYEES RETIREMENT PLAN - COMBINED PENSION PLAN LAST 10 FISCAL YEARS *
2016 2015
Contractually required contributions $56,785 $57,393
Contributions in relation to the contractually required contributions $56,785 $57,393
Contribution deficiency (excess) $- $-
OP&F's covered employee payroll $473,208 $478,275
Contributions as a percentage of covered-employee payroll 12% 12%
SCHEDULE OF CONTRIBUTIONS OHIO PUBLIC EMPLOYEES RETIREMENT PLAN - MEMBER DIRECTED PLAN LAST 10 FISCAL YEARS *
2016 2015
Contractually required contributions $146,300 $150,761
Contributions in relation to the contractually required contributions $146,300 $150,761
Contribution deficiency (excess) $- $-
OP&F's covered employee payroll $1,045,000 $1,076,864
Contributions as a percentage of covered-employee payroll 14% 14%
* The amounts presented were determined as of Dec. 31 of the prior calendar year. GASB 68 was implemented in 2015. This schedule is intended to show information for 10 years. Additional years will be displayed as they become available.
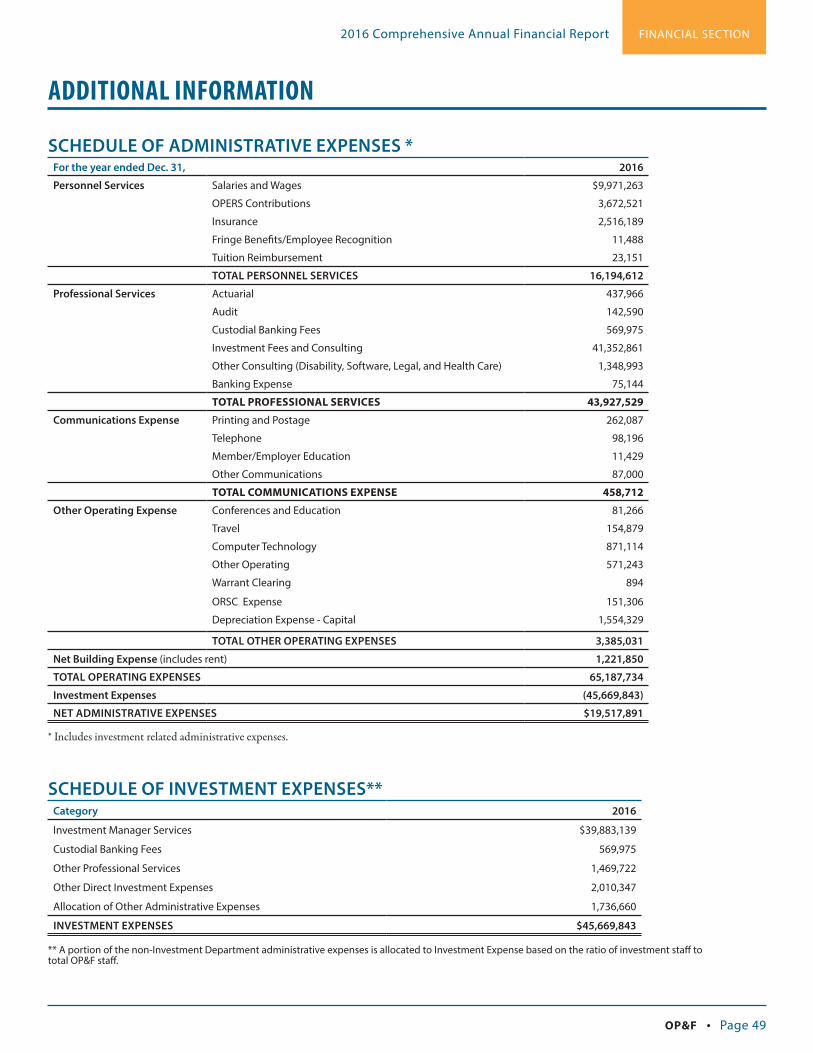
FINANCIAL SECTION2016 Comprehensive Annual Financial Report
OP&F • Page 49
SCHEDULE OF ADMINISTRATIVE EXPENSES *For the year ended Dec. 31, 2016
Personnel Services Salaries and Wages $9,971,263
OPERS Contributions 3,672,521
Insurance 2,516,189
Fringe Benefits/Employee Recognition 11,488
Tuition Reimbursement 23,151
TOTAL PERSONNEL SERVICES 16,194,612
Professional Services Actuarial 437,966
Audit 142,590
Custodial Banking Fees 569,975
Investment Fees and Consulting 41,352,861
Other Consulting (Disability, Software, Legal, and Health Care) 1,348,993
Banking Expense 75,144
TOTAL PROFESSIONAL SERVICES 43,927,529
Communications Expense Printing and Postage 262,087
Telephone 98,196
Member/Employer Education 11,429
Other Communications 87,000
TOTAL COMMUNICATIONS EXPENSE 458,712
Other Operating Expense Conferences and Education 81,266
Travel 154,879
Computer Technology 871,114
Other Operating 571,243
Warrant Clearing 894
ORSC Expense 151,306
Depreciation Expense - Capital 1,554,329
TOTAL OTHER OPERATING EXPENSES 3,385,031
Net Building Expense (includes rent) 1,221,850
TOTAL OPERATING EXPENSES 65,187,734
Investment Expenses (45,669,843)
NET ADMINISTRATIVE EXPENSES $19,517,891
* Includes investment related administrative expenses.
SCHEDULE OF INVESTMENT EXPENSES**Category 2016
Investment Manager Services $39,883,139
Custodial Banking Fees 569,975
Other Professional Services 1,469,722
Other Direct Investment Expenses 2,010,347
Allocation of Other Administrative Expenses 1,736,660
INVESTMENT EXPENSES $45,669,843
** A portion of the non-Investment Department administrative expenses is allocated to Investment Expense based on the ratio of investment staff to total OP&F staff.
ADDITIONAL INFORMATION

FINANCIAL SECTION 2016 Comprehensive Annual Financial Report
Page 50 • OP&F
PUBLIC SAFETY OFFICERS DEATH BENEFIT FUND FOR THE YEAR ENDING DEC. 31, 2016Balance
Dec. 31, 2015 Additions SubtractionsBalance
Dec. 31, 2016
Assets:Cash and Short-term Investments $721,580 $20,000,000 $20,204,529 $517,051 TOTAL ASSETS 721,580 20,000,000 20,204,529 517,051
Liabilities:
Due to State of Ohio 721,580 20,000,000 $20,204,529 517,051 TOTAL LIABILITIES $721,580 $20,000,000 $20,204,529 $517,051
COMBINING STATEMENT OF CHANGES IN ASSETS AND LIABILITIES - PUBLIC SAFETY OFFICERS DEATH BENEFIT FUND

2016
CO
MP
REH
ENSI
VE A
NN
UA
L FI
NA
NC
IAL
REP
OR
T | O
HIO
PO
LIC
E &
FIR
E P
ENSI
ON
FU
ND
INVESTMENT REPORT
INVESTMENT PORTFOLIO SUMMARY
TEN LARGEST COMMON STOCKS
TEN LARGEST BONDS AND OBLIGATIONS
TEN LARGEST REAL ESTATE HOLDINGS
SCHEDULE OF INVESTMENT RESULTS
INVESTMENT CONSULTANTS AND MONEY MANAGERS
SCHEDULE OF BROKERS’ FEES PAID
INVESTMENT POLICY AND GUIDELINES
INVESTMENT SECTION 2016 Comprehensive Annual Financial Report
Page 52 • OP&F
INVESTMENT REPORT (PREPARED THROUGH A COMBINED EFFORT WITHIN THE INVESTMENT DEPARTMENT)
INTRODUCTIONThe investment authority of OP&F is specified in Chapter 742 of the ORC. Importantly, the ORC requires that the Board of Trustees and other fiduciaries discharge their duties solely in the interest of the participants and beneficiaries, for the exclusive purpose of providing benefits to participants and their beneficiaries and defraying reasonable expenses of administering OP&F. Within the guidelines of the ORC, OP&F has developed an Investment Policy and Guideline statement that provides for appropriate diversification of assets and an acceptable expected return on investments after consideration of investment risks. Investment performance returns are prepared by Wilshire Associates. Investment activities are presented on a trade date basis and measurements are calculated using time weighted rates of return consistent with investment industry standards.
SIGNIFICANT DEVELOPMENTS IN 2016For strategic, tactical, and practical reasons, OP&F converted its 5.0 percent timber allocation target to a real assets allocation consisting of timber, infrastructure and agriculture. Strategically, the broader allocation of real assets will continue to provide an inflation-linked allocation consistent with the risk parity framework of OP&F’s asset allocation policy. Tactically, OP&F sees greater opportunity today in infrastructure and agriculture/farmland than in timberland. From a practical perspective, sourcing adequate, attractive opportunities in timber has been challenging in today’s market environment. In conjunction, OP&F expanded The Townsend Group’s investment consulting services to include infrastructure and agriculture/farmland, along with real estate and timber. In addition to these accomplishments, other significant noteworthy investment endeavors and issues addressed last year include the following:
• Added a complementary alpha strategy to Bridgewater Associates and Grosvenor Capital Management within OP&F’s U.S. equity portable alpha program.
• Hired Delaware Investment Advisors for a U.S. active small-cap mandate.
• Hired Loomis Sayles and Prudential for Levered Core Fixed Income mandates.
• Approved investment guidelines for Delaware Investment Advisors and Loomis Sayles Levered Core Fixed Income.
• Amended investment guidelines for Delaware Investment Advisors, Harvest Fund Advisors, Russell ACWI ex-U.S., Loomis Sayles and MacKay Shields High Yield.
• Completed the annual evaluation of OP&F’s real estate strategic portfolio for possible rebalancing.
• Continued to work toward the target allocation in private markets:
• Made commitments to Cinven Sixth Fund, MBK Partners Fund IV, Montauk Triguard Fund VII, Trident VII, The Veritas Capital Fund VI, Vista Equity Partners Fund VI and Vista Foundation Fund III.
• Continued to work toward the target allocation in real estate:
• Made commitments to Asana Partners Fund I, Brookfield Premier Real Estate Partners, Exeter Industrial Fund IV and Greystar Equity Partners IX.
• Shifted non-U.S. custody to Northern Trust.
• Approved the 2016 Private Markets Investment Plan.
• Approved the 2017 Real Estate Investment Plan.
• Amended OP&F’s Derivatives Policy Statement.
• Amended OP&F’s Proxy Voting Policy.
• Amended OP&F’s Investment Policy and Guidelines Statement.
• Amended OP&F’s Timberland Investment Policy.
• Amended OP&F’s Investment Manager Monitoring & Evaluation Policy.
• Amended OP&F’s Investment Manager Search Policy.
• Developed an Annual Consultant Satisfaction Survey.
• Continued to shift toward long-term allocation targets by rebalancing between overweight/underweight asset classes.
ECONOMIC ENVIRONMENTDespite a year full of surprises and capital market gyrations, the global economy was relatively steady in 2016. In the U.S., real gross domestic product (GDP) advanced 1.6 percent. Oil prices, having dropped to a multi-year low in the first quarter, rebounded to finish the year in the mid-$50 a barrel range. Having remained relatively stable during the first half of the year, consumer confidence increased during the back half of the year, with a clear bounce after the U.S. presidential election on the prospects of higher economic growth. The

INVESTMENT SECTION2016 Comprehensive Annual Financial Report
OP&F • Page 53
U.S. unemployment rate finished the year near a nine-year low as the demand for workers and higher wages brought more workers into the labor force. Despite the higher wages, home prices continued to advance much faster causing many Americans to be priced out of the real estate market. The homeownership rate hit its lowest level in decades during 2016. Despite the rise in home prices as well as continued increases in medical care costs, U.S. inflation remained relatively tame in 2016, with a year-over-year increase of 2.1 percent in 2016.
The Federal Reserve (Fed) came into 2016 with an expectation of four interest rate increases but only raised the federal funds rate once, by 25 basis points (bps), in December. This was only their second interest rate increase in the last decade. Given the prospects of higher short-term interest rates, the U.S. dollar continued to strengthen throughout the year.
Elsewhere in the world, Europe’s economic growth remained subdued despite ongoing central bank stimulus via accommodative monetary policy. In addition to the uncertainty over the potential impact of the U.K. referendum, or so-called Brexit vote, banking sector concerns remained prevalent, especially in Italy. In China, real GDP growth was about 6.7 percent in line with the government’s target. China continues its balancing act of trying to support economic growth while finding the right balance between easy or tight monetary conditions. Despite fiscal stimulus and accommodative monetary policy, Japan continued to muddle along in a deflationary environment due to very weak domestic consumption. In another significant economic hotspot, Brazil continued to climb its way out of a two-year recession with the aid of the central bank lowering interest rates and the prospects for economic reform.
Early in 2017, the Fed continued to tighten monetary conditions by raising short-term interest rates by 25 bps in March to a range of 0.75 percent to 1.00 percent and indicated additional rate increases are in store. Oil prices have stabilized while consumer confidence continues to climb. The U.S. unemployment rate continued to fall with a reading in March of 4.5 percent. Market participants are watching intently to see if any of President Trump’s policy initiatives are approved as they could lead to higher economic growth and rising inflationary pressures. Every word out of the Federal Reserve is being heavily scrutinized for possible clues about the timing and number of potential rate increases as well as any move to reduce the size of the Fed’s balance sheet. Meanwhile, the Bank of England, the European Central Bank and the Bank of Japan continue their easy monetary policies as political uncertainty remains with upcoming elections in France and Germany this year while the U.K. Brexit process continues.
TOTAL FUNDThe total portfolio, on a trade date basis, was valued at $14.53 billion at the end of 2016, up from $13.82 billion at the end of 2015. Within OP&F’s portfolio, exceptionally strong returns in MLPs and global inflation protected securities and very good results in U.S. equity, private markets, real estate and high yield combined to pull up the overall portfolio return in 2016. On the weaker, yet still positive, side were returns registered by core fixed income, non-U.S. equity and timber. For calendar year 2016, the total portfolio’s investment return was 11.51 percent gross of fees (10.90 percent net) compared to a policy index return of 11.45 percent. This slight outperformance of the total portfolio’s policy index by six bps represents a very strong second half comeback by the total portfolio relative to its policy index. OP&F’s investments in MLPs, U.S. equity, private markets, core fixed income and global inflation protected securities all significantly outperformed their respective asset class benchmarks over the final two quarters of 2016.
In late 2014, OP&F adopted an updated asset allocation policy, which included a series of transitional policy benchmarks and asset class targets that laid out a roadmap to reach the new asset allocation benchmark over the course of several years. New target weights for each asset class kick in on Jan. 1 and July 1 each year. Generally, these six-month steps are de-risking the portfolio but in a risk parity sense. Public equity is slowly being reduced as fixed income, MLPs and alternative assets exposures are ramping up. The increasing fixed income exposures include growing an already 2x levered global inflation protected securities mandate and converting traditional core fixed income into a 2x levered core fixed income mandate. Over the course of the year, persistent underweights to MLPs and global inflation protected securities hurt the portfolio’s performance versus the policy index while overweights to public and private equity helped the portfolio’s performance relative to the policy index. The relative performance of asset classes versus their individual benchmarks also played a role in determining the total portfolio’s performance versus its policy benchmark. Outperformance of managers in U.S equity, core fixed income, inflation protected bonds, MLPs and real estate versus their respective benchmarks was nearly offset by the underperformance of managers in high yield, private equity, non-U.S. equity and timber relative to their benchmarks.
Last year’s strong absolute performance also translated into excellent relative peer group performance with OP&F’s portfolio return placing in the 1st percentile of Wilshire’s Master Trusts – All Plans Universe. With 2016’s result, OP&F’s three-year annualized gross of fees return now stands at 6.25 percent (5.66 percent net), while the five-year annualized gross of fees return is 10.09 percent (9.56 percent net) and
INVESTMENT SECTION 2016 Comprehensive Annual Financial Report
Page 54 • OP&F
the 10-year gross of fees return is 6.31 percent (5.89 percent net). The 2016 results versus the policy index still kept OP&F’s three-year relative return above the policy index return of 5.23 percent for the same period, while OP&F’s five-year return also beat the policy return of 8.95 percent and the 10-year return bested the policy return of 5.27 percent. As mentioned earlier, the total portfolio’s 2016 results ranked in the 1st percentile of Wilshire’s Master Trusts – All Plans Universe, while the three-year, five-year and 10-year results ranked in the 6th, 5th and 9th percentiles, respectively, of that same peer universe.
Through the first quarter of 2017, all of OP&F’s asset classes have registered positive returns. However, returns from asset classes in which OP&F invests are a mixed bag relative to their early 2016 results. Returns from MLPs and both U.S. and non-U.S. equities are easily outdistancing their results through the first quarter of last year. Meanwhile, global inflation protected securities, core fixed income, private markets, real estate and high yield are performing worse than at this point last year. With the U.S. economy expected to continue its steady, subpar growth, OP&F’s 2017 full year results are likely to hinge on the strength of European economies and markets, the outcome of European elections, a hopefully uneventful geopolitical environment and central bank actions, especially whether the Federal Reserve raises the federal funds rate more than is discounted by the markets.
The Board of Trustees and staff believe that a well-diversified portfolio will serve OP&F well over the long-term. As mentioned in prior reports, the Board of Trustee’s 2010 adoption of and continued reaffirmation of risk parity and the ongoing implementation of that approach demonstrate that OP&F is committed to creating and maintaining a well-diversified portfolio. A combination of lower long-term equity targets inherent in risk parity and a generally rising stock market over the past several years have kept the equity portfolio above its allocation target; thus, making it a natural source of funds to diversify into rising target allocations for fixed income, MLPs and alternatives exposures. This ongoing shift out of equities has generally kept OP&F from any forced rebalancing efforts, but staff closely monitors the portfolio’s status relative to asset class allocation ranges and occasional periods of extreme valuation. For example, as the late June Brexit surprise occurred during a typical cash raising timeframe, staff turned to a strengthening fixed income market as a source of funds rather than the suddenly weak equity markets. This disciplined deviation from typical practice played out well as equities rebounded strongly in relatively short order. In addition to forcing OP&F to sell high and buy low, a disciplined rebalancing policy removes human emotion from the decision making process. As evident in the Board of Trustee’s risk parity approach and recent asset class structure decisions, OP&F has and will continue to evaluate
non-correlated, non-traditional strategies and asset classes in its search for optimal risk-adjusted returns.
EQUITIES - U.S. AND NON-U.S.Unlike 2015 when equity returns were flat to negative, stocks in 2016 were up virtually across the board. Once again, U.S. equities outperformed non-U.S. developed markets, though emerging market (EM) returns were strong. The U.S. dollar was higher against other major developed country currencies, which was, on balance, a 3.0 to 4.0 percent headwind to U.S.-based investors in overseas markets.
Though world stock markets, as measured by the Morgan Stanley Capital International (MSCI) All Country World Index (ACWI), rose 8.4 percent in 2016, much of this was driven by U.S. and EM stocks. In the U.S., for example, the Wilshire 5000 increased 13.4 percent with small cap stocks leading the way (up 22.4 percent as measured by the Wilshire Small Cap Index), beating both mid and large-caps, which rose 17.2 and 12.5 percent, respectively. Emerging market stocks tacked on a solid 11.2 percent for the year, reversing several years of weak performance. Conversely, non-U.S., developed market returns, as measured by the MSCI Europe, Australasia, Far East (EAFE) index, were up an uninspiring 1.0 percent in 2016 (in U.S. dollar terms).
Equity markets were weak in the last four to five months of 2015 and into the first six weeks of 2016 due to several concerns including: 1) falling oil and some other commodity prices, 2) soft global economic growth, especially overseas, 3) uncertainty about Federal Reserve monetary policy, 4) U.S. dollar strength, 5) widening credit spreads and 6) weak U.S. corporate sales and earnings. The political environment was likely also at least a small factor as well given concerns about the Brexit vote slated for late June and the U.S presidential election later in 2016.
However, in the first quarter of 2016 some of these negative factors began to reverse. Oil (and many commodities) troughed in February as U.S. oil production declines were helping to gradually improve the supply/demand balance. This led to lessened concerns about energy and other cyclical companies, which helped narrow credit spreads in those sectors specifically and in high yield credit generally. The dollar, which peaked in late-2015/early-2016 continued to slide into May and June which helped alleviate some concerns that a strong dollar would continue to pressure sales and earnings growth of large U.S. multi-national companies. The weaker dollar was also seen as a potential benefit to EM countries who have large dollar denominated sovereign debt and have commodity-focused economies.

INVESTMENT SECTION2016 Comprehensive Annual Financial Report
OP&F • Page 55
Equity markets rebounded significantly off of the mid-February lows into mid-late spring, rising 15 percent in the case of U.S. large-caps to 25 percent for U.S. small-caps. There was a pause prior to the June 23 Brexit vote. This was followed by a sharp, but short-lived, several day drop in global stocks after the United Kingdom (U.K.) voted to leave the European Union (EU). Although the vote was initially viewed as a significant negative for the U.K. and the EU, investors’ concerns gradually eased, driving improved investor sentiment and a sharp rebound in global stocks. Similarly, concerns regarding the U.S. presidential election caused a modest pullback in equities over the September to early November time frame, though after the election, investors quickly became bullish on the prospects for tax reform and infrastructure spending favored by the new administration.
OP&F’s U.S. Equity Composite for 2016 appreciated a strong 15.60 percent gross of fees (15.34 percent net of fees). This compared favorably to the Wilshire 5000 and S&P 500 indices, which returned 13.37 percent and 11.96 percent, respectively, for the calendar year.
The OP&F Total International Equity Composite in 2016 returned 2.75 percent gross of fees (2.40 percent net). Unlike the domestic portion of the portfolio, the International Equity Composite underperformed the benchmark MSCI ACWI ex-U.S. Iran/Sudan Free Index (includes developed and emerging international markets), which rose 4.45 percent.
MASTER LIMITED PARTNERSHIPS (MLPs)MLPs had a strong 2016 rebounding from an extremely difficult year in 2015. The Alerian MLP Index rose 18.31 percent in 2016, partially reversing a decline of 32.59 percent in 2015. Similar to U.S. equities, which reversed in quarter one (Q1), MLPs troughed on the heels of the factors mentioned earlier, namely improving oil supply/demand, narrowing credit spreads, and very attractive valuation and distribution yields.
MLP returns and oil prices were more correlated than is normal at certain times in the last two to three years due to the dramatic 70 percent decline in crude prices from mid-2014 into the lows of early 2016. Historically, the two have not been highly correlated. This is because MLPs and their midstream operations (pipeline transmission, distribution and related businesses) tend to have a business model that is relatively stable and not particularly dependent on changes in or levels of oil or natural gas prices. This business model stability stems from the fact that MLP/pipeline companies 1) sign very long term (ten years or more) customer contracts, 2) have contracts that obligate their E&P (exploration and production) customers to pay the MLP (pipeline company) regardless of the volumes pushed through the pipelines,
and 3) MLPs have a history of positive cash flow and increasing distributions.
In mid-2016, MLPs and oil prices began to trade more independently of each other as investors believed the MLP business model was not broken and the relatively stable nature of the cash flows would not be impaired. Subsequently, MLP returns continued to be fairly strong even though oil prices peaked in the middle of the year.
In 2016, the OP&F MLP Composite returned 20.42 percent gross of fees (19.69 percent net) outperforming the Alerian MLP Index, which appreciated 18.31 percent. OP&F’s managers have provided positive absolute and relative returns since the inception of the program (Dec. 31, 2012), generating a 7.11 percent gross of fee annualized return (6.62 percent net) compared to the Alerian MLP Index at 1.62 percent. The outlook for midstream-focused MLPs continues to look strong as they provide a service needed by any developed economy, i.e. the movement of energy commodities.
FIXED INCOME – CORE AND INFLATION PROTECTED BONDSFor fixed income investors, the first half of the year was starkly different from the second. Long dated Treasury bonds returned roughly 16 percent in the first half of the year as bond investors believed economic growth would remain tepid, keeping a lid on inflation. In addition, German, Japanese and other developed country bond yields actually went negative, helping pull down U.S. interest rates as well. However, after bottoming in July at 1.36 percent, the 10 year Treasury sold off harshly in the back half of the year as the 10 year rate rose to 2.45 percent at year end. Long Treasuries declined roughly 13 percent in the second half of the year leaving the full year slightly positive. OP&F’s fixed income portfolio was positioned more in intermediate maturity bonds and thus did not experience the same level of volatility as long Treasuries.
The bond market selloff began in early July as rates had fallen sharply and the proliferation of negative rates around the world seemed to reach extreme levels. The rise was gradual going into the U.S. presidential election but accelerated afterwards as talk of tax cuts, infrastructure and other deficit spending by the new administration created fears for bond investors that growth and inflation would rise more than had been previously expected.
The OP&F Core Fixed Income Composite returned 4.14 percent gross of fees (3.76 percent net) for the year, outperforming the Barclays Aggregate Bond Index return of 2.65 percent. The Global Inflation Protected Securities (GIPS) Composite was up significantly in 2016, generating a gross of

INVESTMENT SECTION 2016 Comprehensive Annual Financial Report
Page 56 • OP&F
fee return of 18.76 percent (17.63 percent net). This compared favorably to the GIPS Policy Benchmark, which advanced 16.76 percent.
HIGH YIELDHigh yield (HY) bond returns were one of the strongest areas of the financial markets in 2016 as the Barclay’s High Yield Bond Index rose 17.1 percent. This followed a poor showing in 2015 when high yield indices fell roughly mid-single digits. Strong high yield bond returns were driven by the factors previously mentioned, namely rebounding oil and other commodity prices. In addition, high yield interest rates relative to U.S. Treasury bond yields had widened to a point that investors found more attractive as compared to very narrow spreads available in quarter two (Q2) of 2014.
High yield spreads tend to decline during periods of economic strength and widen when bond investors fear deteriorating economic conditions, either for the broad economy or in certain sectors. Deteriorating conditions typically lead to lower corporate earnings and risks that HY corporate debt issuers may have difficulty repaying their debt.
The OP&F High Yield Composite performed well on an absolute basis last year, rising 12.80 percent gross of fees (12.39 percent net), but lagged relative to OP&F’s High Yield Policy Index, which was up 17.96 percent. The underperformance can be broadly attributed to two factors: 1) OP&F managers tend to have higher quality portfolios relative to the benchmark, holding relatively higher levels of better credit BB and B rated bonds and lower percentages of the lowest quality CCC credits and 2) the inclusion in the OP&F High Yield Composite of dedicated bank loan portfolios, which tend to be higher quality and shorter maturity and did not perform as strongly coming out of the trough in Q1 of 2016 through the end of the year.
Recall also that OP&F made its initial investments to the direct lending space in 2014. These direct lending commitments are included in the HY allocation and returns. The overall high yield allocation, including the bank loan and direct lending portfolios, is generally of higher quality and shorter duration/maturity than the benchmark and thus should provide a more defensive profile, doing well during normal and/or more challenging market environments, but likely lagging during extremely strong, risk-seeking time periods.
REAL ESTATE Real estate markets delivered solid returns in 2016. Performance was driven by favorable capital market conditions and by continued improvement in demand from tenants.
In 2016, OP&F’s total Real Estate Portfolio delivered a 13.14 percent gross of fees return (11.10 percent net), exceeding the Open End Diversified Core Equity (ODCE) index net of fees by 201 bps. Figures in this section are presented as of Sept. 30, 2016 due to the fact that private market reporting lags public market reporting.
The portfolio is designed to exceed the ODCE index by 50 bps per year on a net basis over full market cycles, and has accomplished that goal over most long-term and short-term measurement periods. The trailing 10-year period is an exception, with the portfolio delivering an annualized net return of 5.32 percent over that period, exceeding the ODCE index by only 27 bps. This result is due, in large part, to the fact the starting point for the 10-year measurement period is near the prior market peak.
Looking forward, returns in the lower risk Strategic Portfolio are expected to be driven by current income, rather than by the broad capital market uplift that drove appreciation returns for the past several years. Rising interest rates may operate as a headwind. The Strategic Portfolio is designed to deliver steady cash distributions throughout market cycles.
In its Tactical Portfolio, OP&F seeks to generate higher returns over full market cycles by investing in assets that could benefit from improvement in their operations, physical structure, capital structure, or tenant base, and by accepting other calculated risks. While OP&F continues to see and pursue attractive opportunities in this space, those opportunities have been less abundant over the past few years, as markets have been operating fairly efficiently. OP&F has responded by investing at a measured pace, by reducing the overall risk profile of its Tactical Portfolio, and by seeking unique opportunities to add value. For example, during the year, OP&F helped launch an open-end core-plus vehicle in exchange for meaningful founding investor benefits.
In addition to seeking to achieve its return target, OP&F remains focused on Real Estate’s other strategic objectives: diversifying OP&F’s broader portfolio and serving as a partial inflation hedge. Each investment is selected based on its risk/return profile and on its perceived ability to advance these other goals.
OP&F’s market exposure to Real Estate slightly decreased during the 12 months ended Sept. 30, 2016 from 11.1 percent to 10.9 percent. Exposure was increased by nearly $128 million of new contributions and over $160 million in investment profit, net of fees. The impact of these drivers was moderated by nearly $240 million in distributions. Current exposure is below the 12 percent target allocation, but well within the targeted range for Real Estate. OP&F is maintaining its philosophy of investing patiently and prioritizing attractive risk-adjusted returns over capital deployment.
INVESTMENT SECTION2016 Comprehensive Annual Financial Report
OP&F • Page 57
PRIVATE MARKETSFor the year ending Sept. 30, 2016 (private market returns are lagged by one quarter), OP&F’s private markets portfolio provided a net return, on a time weighted basis, of 14.37 percent. It should be noted that evaluating private markets performance over short-time periods can be misleading. With that stated, for the ten-year period ending Sept. 30, 2016, the portfolio provided an annualized net return of 10.82 percent.
In 2014, OP&F adopted changes to how it evaluates the performance of the private markets portfolio. The methodology evaluates the performance of the private markets program by developing a Public Markets Equivalent (PME) comparison of the program’s history. A PME comparison uses an Internal Rate of Return (IRR) calculation of all historical cash flows, on a dollar-weighted basis, and compares the resulting performance to a public market proxy index by assuming that all of the same cash flows were invested on the same dates in the public market index. This methodology allows for the purest comparison of the private markets program performance to that of a public market alternative. Secondarily, the performance of the private markets program is evaluated relative to the Cambridge Associates Private Equity Pooled Horizon IRR: Net to Limited Partners peer universe, or equivalent. The Cambridge Associates peer universe data allows OP&F to compare the private markets program to other private markets programs and managers over specified periods. For the ten-year period ending Sept. 30, 2016, OP&F’s private markets program provided a net IRR of 10.0 percent, outperforming the Wilshire 5000 PME by 1.5 percent annualized. Relative to the Cambridge Associates Private Equity Pooled Horizon IRR: Net to Limited Partners peer universe, OP&F’s private markets program’s net of fee IRR ranks above median across all time periods measured as of Sept. 30, 2016.
With respect to the state of private markets, assessing metrics such as fundraising, investment activity and exit environments across various strategies provides insights on the health of the industry as a whole. Across most strategies, fundraising continues to be strong. Fundraising remains strong given the continued level of healthy distributions returned to investors and no better alternatives for allocating the capital elsewhere. Investment levels remain steady across most of the strategies within the industry. On the exit front, the initial public offerings (IPO) market remains challenging for private equity and venture-backed companies. The merger and acquisitions (M&A) market remains the most viable exit route for private equity or venture-backed companies. In the U.S., looking forward, favorable prospects for the majority of strategies within the private markets industry include the continued strength in equity markets and higher GDP growth expectations. Conditions dampening these prospects
include a high level of un-invested capital, a competitive deal environment, and high purchase price multiples or valuation levels (i.e. pricing). In Europe, looking forward, favorable prospects for the private markets industry include improving economic conditions and continued monetary accommodation. Similar to the U.S., concerns for the private markets industry within Europe include a high level of dry powder, a competitive deal environment, and high pricing.
OP&F continues to work prudently toward its eight percent target allocation to the private markets asset class. On an invested basis, private markets comprised approximately 6.2 percent of OP&F’s total assets as of year-end. In the future, OP&F will continue to work toward its eight percent target by targeting domestic and global direct partnerships, and on an opportunistic basis, fund-of-funds (both U.S. and non-U.S.) and secondary partnerships. OP&F believes that implementing its private markets exposure mainly through direct partnerships on a going forward basis will allow OP&F to achieve better risk-adjusted, net of fees, returns for the program, reduce costs and successfully implement its annual investment plans. OP&F and its dedicated private markets investment consultant will prudently recommend commitments that will seek to keep the private markets portfolio compliant with its policies and guidelines.
REAL ASSETSDuring 2016, OP&F established a 5.0 percent allocation to real assets. The allocation currently covers timberland, agriculture, and infrastructure, and is distinct from the separate allocations that OP&F has established for real estate and MLPs. The program is designed to provide diversification, to hedge against inflation, to preserve capital, and to generate attractive risk-adjusted returns through a combination of income and appreciation.
The real assets program replaces the timberland program that OP&F initiated in 2012. Recognizing that the market for timberland was competitive, OP&F sought to build its exposure in that space gradually and deliberately, conserving capital to be deployed at a more opportune time. As a result, at Sept. 30, 2016, OP&F’s timberland program represented only 2.0 percent of OP&F’s total portfolio, relative to a 5.0 percent target. The timber exposure is not expected to grow significantly, leaving nearly 60 percent of the allocation available for future deployment.
For 2016, OP&F’s timberland portfolio delivered a gross of fees time-weighted return of 2.99 percent (1.99 percent net). For the trailing three-year period, the gross return was 4.28 percent (3.22 percent net). Five year returns are not yet available. The timberland portfolio is lagging its initial performance objective, which was to exceed inflation by 5.0

INVESTMENT SECTION 2016 Comprehensive Annual Financial Report
Page 58 • OP&F
percent net of fees. This under-performance, driven largely by the modest performance of the asset class in general, helps validate OP&F’s decision to move slowly and conserve capital. Figures in this section are presented as of Sept. 30, 2016 due to the fact that private market reporting lags public market reporting.
In the near term, OP&F is focusing on permanent crop investments in the U.S. and on infrastructure investments in developed markets globally. Within infrastructure, OP&F has a preference for U.S. investments, but will accept significant non-U.S. exposure, particularly in developed markets where currency exposures are at least partially hedged. OP&F is generally focusing on infrastructure investments that fall toward the middle of the risk/return spectrum, where risk-adjusted returns are generally attractive and investments are capable of advancing all of OP&F’s strategic objectives for the real assets program.
2017 DEVELOPMENTS AND CHALLENGES AHEADIn conjunction with OP&F reviewing its investment return assumption as part of its five-year actuarial experience review in 2017, OP&F, working with Wilshire Associates, has commenced an asset liability study to determine if its current long-term asset allocation policy is still the best policy for meeting its objectives. As part of this study, OP&F continues to incorporate factor-based asset allocation techniques to provide a clearer understanding of the economic drivers of asset class performance and to construct better, truly diversified portfolios. Building on these techniques in this year’s study, OP&F has begun to group asset classes into macro-asset class buckets that play similar roles in a portfolio and allow for a better understanding of risk and diversification. The goal is to bring several policy portfolios to OP&F’s Board in the hopes of adopting a more efficient policy portfolio that will better meet OP&F’s objectives going forward. Early work shows several reasonable asset mixes that would improve the portfolio’s risk/reward profile. Below are some of the other items already addressed in 2017 and many that still lie ahead:
• Amended OP&F’s Investment Policy and Guidelines Statement.
• Amended OP&F’s Proxy Voting Policy.
• Amended OP&F’s Private Markets Investment Policy.
• Amended OP&F’s Derivatives Policy Statement.
• Amended OP&F’s Investment Manager Monitoring and Evaluation Policy.
• Adopted a Real Assets Investment Policy replacing OP&F’s Timberland Investment Policy.
• Approved investment guidelines for Prudential Levered Core Fixed Income mandate.
• Amended investment guidelines for Franklin Templeton International Small-Cap.
• Approved the 2017 Private Markets Investment Plan.
• Continued to work toward the target allocation in private markets:
• Made commitments to KKR Asia Fund III, Marlin Equity V and Marlin Heritage II.
• Continued to work toward the target allocation in real estate:
• Made commitment to Hancock U.S. Real Estate Fund.
• Implement the 2017 Private Markets Investment Plan.
• Implement the 2017 Real Estate Investment Plan.
• Adopt 2017 Real Assets Investment Plan.
• Implement the 2017 Real Assets Investment Plan.
• Evaluate the Real Estate Strategic Portfolio for possible rebalancing.
• Amend OP&F’s Investment Manager Search Policy and Ohio-Qualified Investment Manager Policy.
• Approved Northern Trust for international securities lending.
• Continue to evaluate liquidity management options to maintain market exposure while more efficiently meeting increasing cash needs.
Other initiatives that may come to fruition in 2017 are an updated non-U.S. equity investment structure analysis as well as a High Yield investment structure analysis. From an operational standpoint, OP&F continues to look for ways to reduce the costs of its operations as well as to compare its current procedures to other approaches or best practices for areas of improvement or better efficiencies.

INVESTMENT SECTION2016 Comprehensive Annual Financial Report
OP&F • Page 59
INVESTMENT PORTFOLIO SUMMARY - AS OF DEC. 31, 2016Investment Type Percent of Net Investment Value Fair Value
Cash and Cash Equivalents 6.35% $923,215,230
U.S. Government Obligations 0.83% 120,767,263
U.S. Government Agencies 0.13% 18,366,082
U.S. Government Treasury STRIPS 0.74% 107,000,987
Municipal Bond Obligations 0.02% 3,212,021
Corporate Bonds and Obligations 14.58% 2,117,455,979
Domestic Commingled Bonds 3.42% 497,670,481
Mortgage and Asset-Backed Obligations 2.96% 430,377,034
Non-U.S. Inflation Linked Bonds 3.21% 465,984,744
Domestic Stocks 9.42% 1,369,196,877
Domestic Pooled Stocks 12.04% 1,749,595,680
International Equities 18.80% 2,732,596,486
Real Estate 10.90% 1,583,586,006
Derivatives (0.01)% (832,687)
Commercial Mortgage Funds 0.26% 37,429,389
Private Equity 6.29% 914,795,737
Private Debt 2.06% 298,895,397
Timber 2.07% 301,439,041
Master Limited Partnerships 6.38% 927,495,461
TOTAL FAIR VALUE – CASH AND SECURITIES 100.45% $14,598,247,208 Accrued Income 0.22% 32,566,099
Sales Receivable 0.23% 33,782,946
Purchases Payable (0.90)% (130,601,329)TOTAL INVESTMENT NET ASSET VALUE* 100.00% $14,533,994,924
INVESTMENT PORTFOLIO SUMMARY
TEN LARGEST COMMON STOCKS (BY FAIR VALUE)Stock Shares Fair Value
Royal Dutch Shell 1,321,740 $38,445,715
Williams Cos. 1,186,902 36,960,128
Roche Holdings AG-Genusschein 149,541 34,223,679
Novartis AG-Reg Shs 423,017 30,841,304
British American Tobacco PLC 482,030 27,529,572
Nestle SA-Registered 322,630 23,188,982
KDDI Corp. 882,600 22,395,130
Aviva PLC 3,669,570 22,054,854
Akzo Nobel N.V. 345,864 21,665,474
Renaissancere Holdings LTD 153,600 20,923,392
* Trade Date Basis.
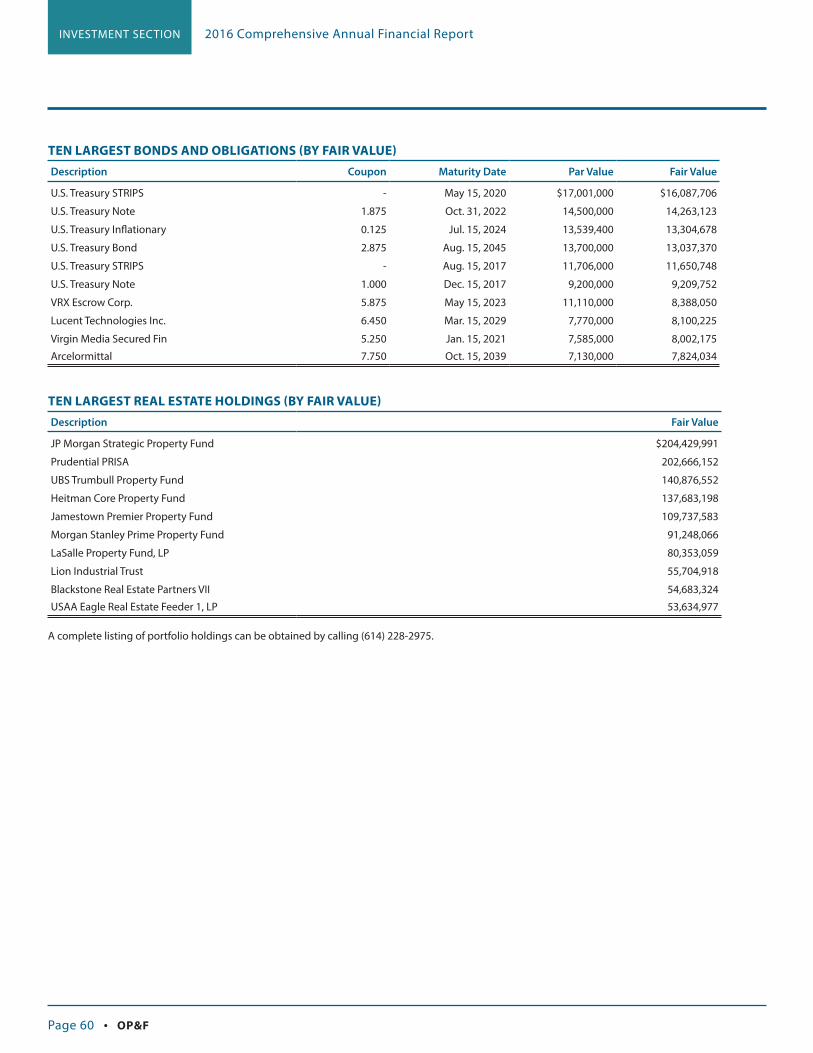
INVESTMENT SECTION 2016 Comprehensive Annual Financial Report
Page 60 • OP&F
TEN LARGEST BONDS AND OBLIGATIONS (BY FAIR VALUE)Description Coupon Maturity Date Par Value Fair Value
U.S. Treasury STRIPS - May 15, 2020 $17,001,000 $16,087,706
U.S. Treasury Note 1.875 Oct. 31, 2022 14,500,000 14,263,123
U.S. Treasury Inflationary 0.125 Jul. 15, 2024 13,539,400 13,304,678
U.S. Treasury Bond 2.875 Aug. 15, 2045 13,700,000 13,037,370
U.S. Treasury STRIPS - Aug. 15, 2017 11,706,000 11,650,748
U.S. Treasury Note 1.000 Dec. 15, 2017 9,200,000 9,209,752
VRX Escrow Corp. 5.875 May 15, 2023 11,110,000 8,388,050
Lucent Technologies Inc. 6.450 Mar. 15, 2029 7,770,000 8,100,225
Virgin Media Secured Fin 5.250 Jan. 15, 2021 7,585,000 8,002,175
Arcelormittal 7.750 Oct. 15, 2039 7,130,000 7,824,034
TEN LARGEST REAL ESTATE HOLDINGS (BY FAIR VALUE)Description Fair Value
JP Morgan Strategic Property Fund $204,429,991
Prudential PRISA 202,666,152
UBS Trumbull Property Fund 140,876,552
Heitman Core Property Fund 137,683,198
Jamestown Premier Property Fund 109,737,583
Morgan Stanley Prime Property Fund 91,248,066
LaSalle Property Fund, LP 80,353,059
Lion Industrial Trust 55,704,918
Blackstone Real Estate Partners VII 54,683,324
USAA Eagle Real Estate Feeder 1, LP 53,634,977
A complete listing of portfolio holdings can be obtained by calling (614) 228-2975.

INVESTMENT SECTION2016 Comprehensive Annual Financial Report
OP&F • Page 61
Annualized Rates of Return1-Year 3-Year 5-Year
U.S. EquityOP&F 15.60% 8.99% 14.93%Wilshire 5000 13.37% 8.76% 14.71%International EquityOP&F 2.75% (1.25)% 6.93%International Equity Policy Benchmark * 4.45% (1.20)% 5.52%Fixed IncomeOP&F - Core 4.14% 3.29% 3.00%Barclays Aggregate 2.65% 3.03% 2.23%OP&F - High Yield (HY) 12.80% 4.74% 7.12%CS First Boston High Yield * 17.96% 4.57% 7.13%OP&F - GIPS 18.76% 12.45% 7.88%Barclays Global Inflation Linked Bond Index 16.76% 10.63% 5.95%OP&F - Commercial Mortgages ** 5.63% 5.78% 5.87%Barclays Mortgage Index ** 3.61% 3.61% 2.65%
Master Limited Partnerships
OP&F 20.42% (0.16)% N/A Alerian MLP Index 18.31% (5.80)% N/A Real Estate **OP&F 13.14% 16.16% 15.32%NCREIF ODCE Index 9.09% 11.42% 11.34%Private Markets **OP&F 14.37% 14.89% 13.13%Wilshire 5000 + 3% 18.82% 13.99% 19.81%Timber **OP&F 2.99% 4.28% N/A CPI + 5% 7.17% 6.24% N/A TOTAL PORTFOLIOOP&F 11.51% 6.25% 10.09%Policy Index*** 11.45% 5.23% 8.95%
* a) International Equity benchmark is a blend of the MSCI ACWI ex U.S. (Net) through June 30, 2011, the MSCI ACWI ex U.S. Iran/Sudan Free (I/S Free) from July 1, 2011 through Sept. 30, 2012 and the MSCI ACWI ex U.S. Iran/Sudan Free IMI Index from Oct. 1, 2012 forward. b) High Yield benchmark is a blend of the CS First Boston Dev. Countries HY through Aug. 31, 2016 and the CS First Boston High Yield from Sept. 1, 2016 forward.
** One quarter in arrears.
*** Interim Policy Index: 19.8 percent Wilshire 5000, 19.1 percent MSCI ACWI ex-U.S. Iran/Sudan Free IMI Index, 10.2 percent Barclays Aggregate, 14.1 percent CS First Boston High Yield, 9.4 percent Global Treasury Inflation Protected Securities (TIPS) Custom, 11.2 percent NCREIF ODCE Index (Net) Lagged, 5.6 percent Wilshire 5000 + 3 percent Lagged, 3.1 percent CPI + 5 percent (Net), 7.5 percent Alerian MLP Index.
Long-Term Policy: 16 percent Wilshire 5000, 16 percent MSCI ACWI ex-U.S. Iran/Sudan Free IMI Index, 20 percent Barclays Aggregate, 15 percent CS First Boston High Yield, 20 percent Global TIPS Custom, 12 percent NCREIF ODCE Index (Net) Lagged, 8 percent Wilshire 5000 + 3 percent Lagged, 5 percent NCREIF Timberland Lagged, 8 percent Alerian MLP Index (adds to 120 percent as “Risk Parity” approach uses 2x levered Global Inflation-Protected Securities and 2x levered Core Fixed Income).
Time Weighted methodology, based upon fair market values, is used when calculating performance.
SCHEDULE OF INVESTMENT RESULTS (FOR THE YEAR ENDED DEC. 31, 2016)

INVESTMENT SECTION 2016 Comprehensive Annual Financial Report
Page 62 • OP&F
INVESTMENT CONSULTANTS AND MONEY MANAGERS (FOR THE YEAR ENDED DEC. 31, 2016)
INVESTMENT CONSULTANTSTorreyCove Capital Partners(The) Townsend GroupWilshire Associates
INVESTMENT MANAGERS U.S. EQUITYAQR Capital ManagementBridgewater Associates, LPDelaware InvestmentsGrosvenor Capital Management, LP N.A. Investcorp, LLCRussell Investments Implementation
Services, LLCState Street Global Advisors
INVESTMENT MANAGERS INTERNATIONAL EQUITYCauseway Capital Management, LLCDimensional Fund AdvisorsFidelity Institutional Asset Management
Trust Co. Franklin TempletonRussell Investments Implementation
Services, LLC
INVESTMENT MANAGERS REAL ESTATEAEW Capital ManagementAermont Capital LLP(The) Blackstone GroupBrookfield Asset Management, Inc.CB Richard Ellis Investors, LLC Clarion Partners Colony Capital, LLCDivcoWest Real Estate Services, LLCExeter Property GroupFortress Japan Opportunity
Management, LLCFremont Realty Capital, LP(The) Gerrity GroupGreystar Investment Group, LLCHeitman Capital Management, LLC Hunt Investment ManagementJamestown Premier GP, LPJP Morgan Investment Management, Inc. LaSalle Investment Management Lone Star FundsLubert-Adler Management Co., LLCMorgan Stanley Real Estate Advisors, Inc.Prudential Real Estate InvestorsSavanna Investment Management, LLCStarwood Capital Group Stockbridge Real Estate FundTA Realty AssociatesTricon Capital Group, Inc.TriGate CapitalUBS Realty Investors, LLCUSAA Eagle Real Estate GP, LLCVBI Real Estate
Walton Street Capital, LLCWestbrook Partners, LLC
INVESTMENT MANAGERS MASTER LIMITED PARTNERSHIPSHarvest Fund Advisors, LLCSalient Capital Advisors, LLCTortoise Capital Advisors, LLC
INVESTMENT MANAGERS TIMBERBrookfield Timberlands ManagementForest Investment AssociatesGlobal Forest PartnersHancock Timber Resources Group
INVESTMENT MANAGERS FIXED INCOMEBridgewater Associates, LPGSO Capital Partners LPJPMorgan Investment Advisors, Inc.Kohlberg Kravis Roberts & Co. LPLoomis Sayles & Company, LPMC Credit Partners, LP MacKay Shields, LLC Neuberger BermanPacific Investment Management Company,
LLCPENN CapitalPrima Capital Advisors, LLCRussell Investments Implementation
Services, LLCTennenbaum Capital Partners, LLCWestern Asset Management
INVESTMENT MANAGERS PRIVATE EQUITYAbbott Capital Management, LLCAdams Street PartnersAdvent International Athenian Venture PartnersBlackstone Capital PartnersBlue Chip Venture Partners, LPBlue Point Capital Partners, LPCinvenColler CapitalConway MacKenzie EQT Francisco PartnersGlendon Capital Management, LPGTCR, LLCHarbourVest Partners, LLCHarvest PartnersHorsley Bridge Partners, LLC(The) Jordan Company Kirtland Capital PartnersLandmark Equity Partners Leonard Green & Partners, LPLexington Capital PartnersLinsalata Capital Partners
Montauk TriGuard Management, Inc.Morgenthaler Venture PartnersNGP Energy Capital ManagementNorthgate Capital GroupPark Street CapitalPeppertree Partners, LLCPrimus Venture PartnersRhône Capital LLC(The) Riverside CompanyRiverstone Investment Group, LLCRRJ CapitalStonepoint Capital Summit PartnersTA Associates, LPTenex Capital Management, LPVista Equity PartnersWarburg PincusWilshire Private Markets, LLC
SECURITIES LENDING AGENTSKey Bank Securities LendingJP Morgan Chase
OTHER PROFESSIONAL CONSULTANTS(see page vii)

INVESTMENT SECTION2016 Comprehensive Annual Financial Report
OP&F • Page 63
SCHEDULE OF BROKERS’ FEES PAID (FOR THE YEAR ENDED DEC. 31, 2016)
Broker Name Fees Paid Units Traded Average Cost
Per Unit
Goldman Sachs $404,838 4,204,278 $0.0963
Merrill Lynch Pierce Fenner Smith 142,272 21,844,043 0.0065
Morgan Stanley 136,582 35,558,127 0.0038
Citigroup 128,887 42,575,541 0.0030
UBS Securities 123,316 7,613,175 0.0162
Credit Suisse First Boston 106,080 12,999,585 0.0082
JP Morgan 100,853 18,920,108 0.0053
Investment Technology Group 67,572 6,249,078 0.0108
Barclays Securities Inc. 60,121 3,888,403 0.0155
Deutsche Bank 59,233 5,572,082 0.0106
Jefferies & Co., Inc. 45,544 5,020,966 0.0091
RBC Capital Markets 44,056 2,780,282 0.0158
Frank Russell Securities/Broadcort Capital Clearing 37,703 3,770,311 0.0100
Macquarie Securities, Inc. 37,407 2,870,949 0.0130
Wells Fargo Securities 36,494 3,011,329 0.0121
BMO Capital Markets 23,465 1,008,710 0.0233
Instinet 22,912 4,125,872 0.0056
Nomura Securities International Co. 20,784 8,333,581 0.0025
Sanford C. Bernstein 20,537 1,571,689 0.0131
Brokers Less than $20,000 353,409 28,607,460 0.0124
TOTAL $1,972,065 220,525,569 $0.0089

INVESTMENT SECTION 2016 Comprehensive Annual Financial Report
Page 64 • OP&F
INVESTMENT POLICY AND GUIDELINESMinor formatting edits have been made to the Board of Trustee approved investment policy and guidelines in order to provide style consistency throughout the CAFR.
1. INTRODUCTIONThe purpose of this Investment Policy and Guidelines (Policy or Statement) is to define the framework for investing the assets (Total Portfolio) of the Ohio Police & Fire Pension Fund (OP&F or Plan). This Statement is intended to provide general principles for establishing the goals of OP&F, the allocation of assets and the employment of outside asset management. The statutory investment authority of the Investment Committee/Board of Trustees (the Board of Trustees or the Board) is set forth in Sections 742.11 to 742.113 and Sections 742.114, 742.116 of the Ohio Revised Code (ORC), as amended from time to time.
The objectives of OP&F have been established in conjunction with a comprehensive review of the current and projected financial requirements. These objectives are:
• To have the ability to pay all benefit and expense obligations when due.
• To maintain the purchasing power of the current assets and all future contributions by maximizing the rate of return on OP&F’s assets at a reasonable level of risk.
• To maintain 30-year funding and achieve full funding on an actuarial accrued liability basis.
• To control the costs of administering OP&F and managing the investments.
The investment objectives of the Total Portfolio are:
• Long-term returns on Plan investments, in addition to contributions received from members and employers, should satisfy any current funding obligations of the Plan when and as prescribed by law and, once the Plan is fully funded, should keep pace with the growth of Plan liabilities.
• The investment performance goal for the Total Portfolio is to meet or exceed the return of the Total Portfolio policy benchmark over a full market cycle, generally measured over three to five years, without taking on additional risk as measured by standard deviation of returns. The Total Portfolio policy benchmark is a weighted average, based on the allocation target defined in Section 3 below, of each asset class benchmark.
In order to achieve these objectives, the Board of Trustees will conduct itself in accordance with ORC Section 742.11, which provides “The Board and other Fiduciaries shall discharge
their duties with respect to OP&F solely in the interest of the participants and beneficiaries.” These duties shall also be carried out “with care, skill, prudence, and diligence under the circumstances then prevailing that a prudent person acting in a like capacity and familiar with such matters would use in the conduct of an enterprise of a like character and like aims”, as referenced in ORC Section 742.11. All aspects of this Statement should be interpreted in a manner consistent with OP&F’s objectives. At least annually, the Board shall review and adopt policies, objectives or criteria for the operation of the investment program and make such changes as appropriate.
Investment policies and Investment Manager(s) guidelines referenced in this document are separate policies governing specific aspects of managing the Total Portfolio and are not reproduced in this Statement, but are incorporated by reference as governing documents of the Plan.
2. DEFINITION OF RESPONSIBILITIES A. INVESTMENT COMMITTEE/BOARD OF TRUSTEES
The statutory investment authority of the Board with regard to the Plan is set forth in Chapter 742, as described above, provides that in its capacity as a fiduciary, the Investment Committee/Board of Trustees must discharge its duties in a prudent manner and for the exclusive benefit of the participants and beneficiaries of the Plan.
In discharging its duties, the responsibilities of the Investment Committee/Board of Trustees pursuant to this Policy include the following:
• Establish the strategic investment policy (Asset Allocation Policy) for OP&F in accordance with the above goals, and periodically review Asset Allocation Policy in light of any changes in actuarial variables and/or market conditions.
• Approve the investment structure for applicable asset classes identified in the Asset Allocation Policy.
• Select qualified Investment Consultant(s) and Investment Manager(s) to advise on and manage OP&F’s assets recognizing the goals set forth in ORC Sections 742.11 and 742.116.
• Monitor and review the performance of selected Investment Manager(s) to determine achievement of goals and compliance with policy guidelines.
• Monitor the costs of the investment operations at least annually.
• Review, at least annually, the current investment policies of OP&F and make such changes as appropriate.
INVESTMENT SECTION2016 Comprehensive Annual Financial Report
OP&F • Page 65
• Review applicable annual investment plan(s) prepared by the staff and/or Investment Consultant(s). As conditions warrant, revise the annual investment plan(s) as the year progresses.
• Monitor investment activity for compliance with Board policies and adherence by Investment Manager(s) to strategy and direction.
• Review the overall investment performance to determine whether it meets established benchmarks.
• Evaluate and assign all Investment Manager(s) to a rating category as outlined in OP&F’s Investment Manager Monitoring and Evaluation Policy.
• Review suggested changes or additions to the functions and operations regarding the investment operations of similar institutional investors.
• Review the proposed investment department annual operating budget and report its recommendations to the Finance Committee.
• Fulfill any other responsibilities as provided in the ORC and Investment Committee Charter.
The Investment Committee/Board of Trustees may authorize others such as OP&F staff, and may utilize the services of external advisors, such as actuaries, auditors, consultants and legal counsel, to implement decisions made by the Board. The comments and recommendations of such parties will be considered by the Board in conjunction with Board discussion of the issues for the purpose of making informed and prudent decisions.
B. STAFF
Staff will be the primary liaison between the Investment Committee/Board of Trustees and the Investment Consultant(s), the Investment Manager(s), and the custodial bank(s). In doing so, the staff will:
• Manage OP&F assets under its care and/or control in accordance with this Policy’s objectives and guidelines set forth herein.
• Implement Board decisions regarding asset allocation, investment structure, Investment Manager(s) selection, and portfolio rebalancing procedures.
• Coordinate the Investment Manager(s) selection, evaluation, and retention decisions for the Plan’s investments, consistent with OP&F’s Investment Manager Search Policy.
• Monitor both internally and externally managed assets to ensure compliance with guidelines set forth in this Policy.
• Establish a process to promptly vote all proxies and related actions in a manner consistent with OP&F’s long-term interests and objectives set forth herein and OP&F’s Proxy Voting Policy. Maintain detailed records of said voting of proxies and related actions and comply with all regulatory objectives related thereto.
• Manage the overall liquidity in the Total Portfolio to ensure timely payment of member benefit payments and Plan expenses and the investment of contributions consistent with established asset allocation and portfolio rebalancing policies.
• Report to the Board at least quarterly regarding the status of the Total Portfolio and its performance for various time periods. Meet with the Board at least annually to report on Investment Manager(s) performance and compliance with goals and objectives.
• Acknowledge and agree in writing to their fiduciary responsibility to fully comply with this Policy set forth herein, and as modified in the future.
C. INVESTMENT CONSULTANT(S)
The Investment Committee/Board of Trustees may retain an investment consulting organization or organizations (the Investment Consultant(s)) to assist in the overall strategic investment direction of the Total Portfolio, or specific asset classes, and its implementation. Each such Investment Consultant(s), in recognition of its role as a fiduciary of the Plan, will assume specific duties. These duties shall generally include the following:
• Provide independent and unbiased information.
• Assist in the development of this Policy and other policies that govern the Plan investments.
• Assit in monitoring compliance with this Policy.
• Assist in the development and recommendation of strategic asset allocation targets, investment structure, and rebalancing procedures, for the total portfolio or for a specified asset class.
• Assist in development of performance measurement standards.
• Assist in the Investment Manager(s) search and selection process consistent with OP&F’s Investment Manager Search Policy.
• Monitor, evaluate and report to the Board on Total

INVESTMENT SECTION 2016 Comprehensive Annual Financial Report
Page 66 • OP&F
Portfolio and/or Asset Class and Investment Manager(s) performance on an ongoing basis.
• Conduct due diligence when an Investment Manager(s) fails to meet a standard.
• Establish a procedural due diligence search process.
D. INVESTMENT MANAGER(S)
The Investment Committee/Board of Trustees may, from time to time, cause the Plan to retain one or more qualified investment managers (Investment Manager(s)) to manage a portion of the Plan assets. When applicable, the Investment Committee/Board of Trustees shall approve each Investment Manager(s) guidelines, which may set forth the purpose, Investment Manager(s) philosophy and approach, authorized investments, prohibitions, typical portfolio characteristics, performance objectives and evaluation, and Investment Manager(s) communications. The Investment Manager(s) have certain responsibilities that include the following:
• Manage OP&F assets under its care, custody, where applicable, and/or control in accordance with this Policy’s objectives and guidelines set forth herein and its governing agreement with OP&F.
• Exercise full investment discretion over the assets in their care within the guidelines set forth in this Policy and, where applicable, the specific guidelines established for the Investment Manager(s) in the governing agreements with OP&F.
• Constructing a portfolio of securities that reflects the execution of a specific investment strategy.
• Promptly inform the Board and staff in writing regarding all changes of a material nature pertaining to the firm’s organization and professional staff.
• If directed, promptly vote all proxies and related actions in a manner consistent with OP&F’s long-term interests and objectives set forth herein and OP&F’s Proxy Voting Policy. Each Investment Manager(s) designated to vote shall keep detailed records of said voting of proxies and related actions and will comply with all regulatory obligations related thereto.
• Provide reporting to the Board or staff or Investment Consultant(s) quarterly regarding the status of the portion of the Total Portfolio managed by the Investment Manager(s) and its performance for various time periods. Meet or participate via teleconference or webcast with the Board or staff or Investment Consultant(s) annually or as needed to report on their performance and compliance with goals and objectives.
• Acknowledge and agree in writing to their fiduciary responsibility to fully comply with this Policy set forth herein, and as modified in the future.
E. OFFICE OF THE OHIO TREASURER/BOARD OF DEPOSIT/CUSTODIAN(S)
Per Section 742.11 of the ORC, the Treasurer of the State of Ohio (the Treasurer of State) is designated as custodian of investment assets. As custodian, the Treasurer of State or its designee (as described below) will be responsible for holding and safekeeping Plan assets, settling purchases and sales of securities; and identifying and collecting income which becomes due and payable on assets held. The Treasurer of State may engage a qualified bank or trust company, as authorized agent of the Treasurer of State, to perform certain services on behalf of the Treasurer of State to fulfill its responsibilities as custodian.
3. ASSET ALLOCATION AND REBALANCING It is the responsibility of the Board to determine the allocation of assets among distinct public and private market asset classes. The allocation will be completed in a manner consistent with commonly recognized financial principles. Application of these principles is expected to lead to a portfolio with the highest level of return consistent with the risk tolerance of OP&F.
The procedure for determining the allocation will consider the relevant characteristics of the liabilities and potential assets of OP&F. The liability considerations shall include, but not be limited to, current and expected future values of the benefits, and future contributions. These factors are important for identifying the investment horizon of OP&F and its cash flow requirements. The asset characteristics considered shall include, but not be limited to, current asset value, the potential return relative to the potential risk, and diversification characteristics.
The asset allocation must be consistent with the investment standards specified in ORC Section 742.11.
The risk/return characteristics of OP&F shall be reviewed on a periodic basis (no less than every five years) through a comprehensive asset liability valuation study. The goal of the study shall be to formulate an Asset Allocation Policy which maximizes return while minimizing overall risk through the most efficient combination of acceptable asset classes under the prudent person standard.
Based on an asset liability valuation study, which analyzed the expected returns, risk and correlations of various asset classes, projected liabilities, and the risks associated with alternative asset mix strategies, the Board has established the following Asset Allocation Policy:

INVESTMENT SECTION2016 Comprehensive Annual Financial Report
OP&F • Page 67
Asset Class
Long-Term Target Allocation–
Notional Exposure RangeDomestic Equity 16.0% ± 5.5%Non-U.S. Equity 16.0% ± 5.5%TOTAL EQUITY 32.0% ± 5.5%Core Fixed Income 20.0% ± 7.0%Global Inflation Protected Securities 20.0% ± 4.0%High Yield 15.0% ± 4.5%TOTAL FIXED INCOME 55.0% ± 7.5%Real Estate 12.0% ± 3.5%Private Markets 8.0% ± 2.5%Real Assets 5.0% ± 2.0%Master Limited Partnerships (MLP or MLPs)
8.0% ± 1.5%
TOTAL ALTERNATIVES 33.0% ± 6.0%Cash Equivalents -% ± 0.5%TOTAL 120.0%
Asset ClassLong-Term Target
Allocation–Market ValueDomestic Equity 16.0%Non-U.S. Equity 16.0%Core Fixed Income 10.0%Global Inflation Protected Securities 10.0%High Yield 15.0%Real Estate 12.0%Private Markets 8.0%Real Assets 5.0%MLPs 8.0%Cash Equivalents -%TOTAL 100.0%
The most recent study has shown that this is a favorable asset mix for meeting longer-term goals under multiple market conditions. In addition, this study incorporates the “risk parity” concept into OP&F’s asset liability valuation with the goal of reducing equity risk exposure, which reduces overall Total Portfolio risk without sacrificing return, and creates a more risk-balanced portfolio based on the relationship between asset classes and economic environments . From the notional portfolio perspective above, the Total Portfolio may be levered up to 1.20 times due to the application of leverage in certain fixed income asset classes.
The Asset Allocation Policy represents a long-term strategy and thus, the Total Portfolio should strategically meet its performance objectives in the long term but not necessarily every year.
Short-term market shifts may cause the asset mix to drift from the allocation targets. Should the target percentage fall out of
the indicated range for a particular asset class, the staff shall direct rebalancing transactions to reallocate assets from the over-allocated asset class to the under-allocated asset class. This rebalancing discipline is intended to encourage “buying low” and “selling high” and to keep the Total Portfolio invested at an appropriate overall risk level. Except when there is a perceived extraordinary downside risk in a particular asset class, movement outside the normal ranges should be avoided.
Investments in private markets, private credit, private real estate and private real assets (infrastructure, timberland and agriculture/farmland, ) are generally less liquid than investments in public markets securities and are typically implemented via periodic commitments to funds with limited partnership structures. As a result, actual allocations to these asset classes may deviate from their strategic targets for extended periods. Actual vs. target deviations for these asset classes shall not be considered in violation of the Asset Allocation Policy. Under/overweights to these asset classes shall be invested in public markets securities with the most similar risk/return characteristics as a short-term proxy for the private asset classes. To assist in rebalancing, OP&F may retain a derivative overlay Investment Manager(s) which may provide several benefits including: (1) reduce OP&F’s tracking error relative to our target allocations; (2) improve Total Portfolio returns; (3) enhance liquidity, and (4) reduce the administrative burden associated with management of monthly cash flows.
The Board may adopt interim Asset Allocation Policy target allocations to reflect the transition from previous policy target allocations to new policy target allocations. The interim target allocations will reflect dollar cost averaging and/or opportunistic implementation to most prudently reach the new policy target allocations over time.
4. INVESTMENT IMPLEMENTATION The implementation of an investment portfolio designed to achieve the Total Portfolio objectives must be consistent with governing statutes as specified in Sections 742.11 to 742.113, 742.114, 742.116 and with the Ohio-Qualified Investment Manager Policy, the Ohio-Qualified Broker Policy, and OP&F’s Broker Policy.
Where appropriate, OP&F will invest assets through the use of qualified Investment Manager(s). The allocations to these Investment Manager(s) will be made in accordance with the results of the asset liability valuation study, investment struc-ture analysis, and established procedures.
For a complete description of the selection of Investment Manager(s), please see OP&F’s Investment Manager Search Policy.

INVESTMENT SECTION 2016 Comprehensive Annual Financial Report
Page 68 • OP&F
5. ASSET CLASS OBJECTIVES, CHARACTERISTICS AND INVESTMENT STRUCTUREInvestment structure targets will be established within applicable asset classes to address risk and return factors present in the respective asset class. For example, the domestic equity composite portfolio structural targets will be established to ensure style (growth vs. value) and market capitalization neutrality relative to the overall market, and to address active versus passive implementation decisions. External Investment Manager(s) will be hired to implement the structural targets in a diversified manner and will therefore have derived target weightings within the overall investment program. Where applicable, these are set forth below.
A. DOMESTIC EQUITY
Investment Objectives
Total return of the domestic equity composite portfolio should exceed the return of the Wilshire 5000 Index over a full market cycle on an annualized basis. Total return of each Investment Manager(s) portfolio should rank above the median when compared to their peer group, if applicable, over a full market cycle on an annualized basis and should exceed their benchmark return as specified in each Investment Manager(s) guidelines or applicable documentation.
Investment Characteristics
The main focus of investing will be on companies headquartered and/or domiciled in the United States. The domestic equity composite portfolio shall have similar portfolio characteristics as that of the Wilshire 5000 Index, and should not exhibit size (market capitalization) or style (value vs. growth) bias.
Investment Structure
The structure of the domestic equity composite portfolio will be diversified among passive and active investment strategies as follows:
1. Passive Large Capitalization Core Exposure The passive large capitalization core component has a target allocation of 40 percent of the domestic equity composite portfolio. This passive portfolio is intended to provide broad market exposure for and diversification to OP&F’s domestic equity composite portfolio through holdings in large - and mid - capitalization equities or futures and is to be
constructed so as to match the characteristics and return of the Russell 1000 Index.
2. Active Large Capitalization Portable Alpha Exposure The active large capitalization portable alpha component has a target allocation of 50 percent of the domestic equity composite portfolio, comprised of 18 percent to global macro strategies, 22 percent to market neutral strategies, and 10 percent to multi-strategy. The overall objective is to provide risk-adjusted returns greater than the return of the Standard & Poor’s (S&P) 500 Index. S&P 500 market exposure, obtained through the use of derivatives and/or physicals, will be combined with strategies that represent diversified sources of alpha with a broad range of risk characteristics. For a complete description of the appropriate use of derivatives, please see OP&F’s Derivatives Policy Statement.
3. Active Small Capitalization Core Exposure The active small capitalization core component has a target allocation of 7.5 percent of the domestic equity composite portfolio.
4. Synthetic Small Capitalization Exposure The synthetic small capitalization component has a target allocation of 2.5 percent of the domestic equity composite portfolio.
B. NON-U.S. EQUITY
Investment Objectives
Total return of the Non-U.S. equity composite portfolio should exceed the return of the Morgan Stanley Capital International All Country World Index ex-U.S. Investible Market Index – Iran and Sudan Free (MSCI ACWI-ex U.S. IMI I/S Free) over a full market cycle on an annualized basis. Total return of each Investment Manager(s) portfolio should rank above the median when compared to their peer group, if applicable, over a full market cycle on an annualized basis and should exceed their benchmark return as specified in each Investment Manager(s) guidelines or applicable documentation.
Investment Characteristics
The main focus of investing will be on companies headquartered or domiciled in the MSCI ACWI-ex U.S. IMI countries, which includes both developed and emerging markets. The Non-U.S. Equity composite portfolio shall have similar portfolio characteristics as that of the MSCI ACWI-ex U.S. IMI I/S Free Index.
INVESTMENT SECTION2016 Comprehensive Annual Financial Report
OP&F • Page 69
Investment Structure
Non-U.S. equity assets will be managed on an active basis in order to exploit the perceived inefficiencies in the Non-U.S. equity markets. The structure of the Non-U.S. equity composite portfolio will be diversified among active ACWI-ex U.S. strategies and dedicated ACWI-ex U.S. small capitalization strategies as follows:
1. Active ACWI-ex U.S. Exposure The Active ACWI-ex U.S. component has a target allocation of 75 percent of the Non-U.S. equity composite portfolio.
2. Active ACWI-ex U.S. Small Capitalization Exposure The dedicated Active ACWI-ex U.S. Small Capital-ization component has a target allocation of 25 percent of the Non-U.S. equity composite portfolio.
C. FIXED INCOME
1. Core
Investment Objectives
Total return of the core fixed income composite should exceed the applicable levered return of the Barclays Aggregate Index over a full market cycle on an annualized basis. Total return of each Investment Manager(s) portfolio should rank above the median when compared to their peer group, if applicable, over a full market cycle on an annualized basis and exceed their benchmark return as specified in each Investment Manager(s) guidelines or applicable documentation.
Investment Characteristics
The main focus of investing will be a diversified mix of traditional and non-traditional fixed income securities and/or strategies. Each Investment Manager(s) portfolio shall have similar portfolio characteristics as that of their respective benchmark, however, certain Investment Manager(s) may have broad investment guidelines to allow for greater flexibility in expressing each Investment Manager(s) core investment themes and therefore, the core fixed income portfolio, as well as each Investment Manager(s) portfolio, may exhibit different portfolio characteristics as that of the Bloomberg Barclays Aggregate Index and respective benchmark, respectively.
Investment Structure
Core fixed income assets will be managed on an active basis in order to exploit the perceived inefficiencies in traditional
and non-traditional fixed income markets. Given the core fixed income allocation target set forth in the Asset Allocation Policy above, the core fixed income composite portfolio may be levered up to 2.0x
2. Global Inflation Protected Securities (GIPS)
Investment Objectives
Total return of the GIPS composite portfolio should exceed the levered return of a custom weighted-average mix of the Bloomberg Barclays country indexes within the Global Inflation-Linked Bond Index over a full market cycle on an annualized basis. Total return of each Investment Manager(s) portfolio should exceed their benchmark return as specified in each Investment Manager(s) guidelines or applicable documentation. In addition, there is a portable alpha component to the GIPS composite portfolio whereas the overall objective is to provide risk-adjusted returns greater than the return of the custom weighted-average mix of the Bloomberg Barclays country indexes within the Global Inflation-Linked Bond Index.
Investment Characteristics
The main focus of investing will be a diversified mix of global inflation-linked securities. The GIPS composite portfolio, as well as each Investment Manager(s) portfolio, shall have similar portfolio characteristics as that of a custom weighted-average mix of the Bloomberg Barclays country indexes within the Global Inflation-Linked Bond Index.
Investment Structure
GIPS assets will be managed on an active basis. Given the GIPS allocation target set forth in the Asset Allocation Policy above, the GIPS composite portfolio will be levered approximately 2.0x. GIPS exposure, obtained through the use of derivatives and/or physical bonds, may be combined with a strategy that provides a diversified source of alpha with customized risk tolerances. Implementation of the GIPS composite portfolio will be consistent with OP&F’s Derivatives Policy Statement, which provides a complete description of the appropriate use of derivatives in the Plan.
3. Commercial Mortgages
Investment Objectives
While in existence, the total return of the commercial mortgage composite portfolio should exceed the return of the Bloomberg Barclays Mortgage Index; both the returns for the commercial mortgage composite portfolio and Bloomberg Barclays Mortgage Index are lagged one quarter.

INVESTMENT SECTION 2016 Comprehensive Annual Financial Report
Page 70 • OP&F
Investment Characteristics
While in existence, the main focus of investing will be on commercial mortgage whole loans which provide for fixed income payments derived from underlying property cash flows. Risk shall be controlled through diversification strategies and the retention of qualified Investment Manager(s) with acceptable loan underwriting and/or commercial mortgage acquisition experience.
Investment Structure
While in existence, commercial mortgage assets will be managed solely on an active basis in order to exploit the perceived inefficiencies in the commercial mortgage market. OP&F will utilize commingled fund investments to manage its commercial mortgage allocation.
D. HIGH YIELD
Investment Objectives
Total return of the high yield fixed income composite portfolio should exceed the return of the B of AMLUS High Yield Constrained Index, over a full market cycle on an annualized basis. Total return of each Investment Manager(s) portfolio should rank above the median when compared to their peer group, if applicable, over a full market cycle on an annualized basis and should exceed their benchmark return as specified in each Investment Manager(s) guidelines or applicable documentation.
Investment Characteristics
The main focus of investing will be on below investment grade fixed income securities, those securities rated below BBB- or equivalent. Positions may include publicly traded high yield bonds as well as public and private bank loans and private credit strategies. The high yield fixed income composite portfolio shall have similar portfolio characteristics as that of the B of AMLUS High Yield Constrained Index, or a blended benchmark of the aforementioned index, leveraged loan indices and private credit strategies. Each Investment Manager(s) portfolio shall have similar portfolio characteristics as that of their respective benchmark.
Investment Structure
High yield fixed income assets will be managed solely on an active basis in order to exploit the perceived inefficiencies in the high yield fixed income markets and to minimize the probability of exposure to securities in default.
E. REAL ESTATE
Investment Objectives
The primary role of real estate in the Total Portfolio is to provide: (1) an inflation hedge, (2) diversify the Total Portfolio by providing a return that has a low or negative correlation with stock and bond returns and (3) provide a total return that is competitive on a risk–adjusted basis with stocks and bonds and is accretive to OP&F achieving its long-term target rate of return. The return target for the real estate composite portfolio is set forth in OP&F’s Real Estate Strategic Plan. Both the returns for the real estate composite portfolio and respective benchmark(s) are lagged one quarter.
Investment Characteristics
Investments will adhere to certain risk management and diversification criteria set forth in OP&F’s Real Estate Strategic Plan.
Investment Structure
The target allocation of Total Portfolio assets to real estate will be established by OP&F’s long-term Asset Allocation Policy. In order to meet this allocation target, it will generally be necessary to make commitments in excess of the target because of the contribution and distribution cash flow characteristics inherent in the underlying real estate investments.
F. PRIVATE MARKETS
Investment Objectives
The private markets composite portfolio is designed to provide an attractive risk-adjusted rate of return to OP&F. The performance objective for the private markets composite portfolio and for individual investments is set forth in OP&F’s Private Markets Investment Policy. Both the returns for the private markets composite portfolio and respective benchmark are lagged one quarter.
Investment Characteristics
Investments will be diversified by certain criteria as set forth in OP&F’s Private Markets Investment Policy.
Investment Structure
OP&F may utilize any of the following types of vehicles in implementing the private markets composite portfolio: fund-of-funds, partnerships, limited liability companies or group trusts. OP&F may also participate in secondary offerings or purchase private markets placements from other investors on the secondary market. Annual commitment targets

INVESTMENT SECTION2016 Comprehensive Annual Financial Report
OP&F • Page 71
to such investments will be established by OP&F’s Private Markets Investment Plan. As stated in OP&F’s Private Markets Investment Policy, in order to meet the target allocation of Total Portfolio assets to private markets investments, it will generally be necessary to make commitments in excess of the target because of the contribution and distribution cash flow characteristics inherent in the underlying individual private markets investments.
G. REAL ASSETS
Investment Objectives
The real assets program will consist of infrastructure, timberland and agriculture/farmland. The primary performance objective, along with the strategic goals, of the real assets program will be set forth in OP&F’s Real Assets Investment Policy. Both the returns for the real assets program and respective benchmark are lagged one quarter.
Investment Characteristics
Real assets investments will seek to adhere to certain risk controls and diversification criteria set forth in OP&F’s Real Assets Investment Policy.
Investment Structure
The target allocation of Total Portfolio assets to real assets will be established by OP&F’s long-term Asset Allocation Policy. OP&F will allow an over commitment to the real assets program, up to 35 precent, to achieve the targeted allocation due to the fact that certain real assets investments, in particular closed-ended funds, draw capital gradually, may not draw their full commitments and generally begin to return capital long before they are liquidated.
H. MASTER LIMITED PARTNERSHIPS (MLP)
Investment Objectives
Total return of the MLP composite portfolio should exceed the return of the Alerian MLP Index over a full market cycle on an annualized basis. Total return of each Investment Manager(s) portfolio should rank above the median when compared to their peer group, if applicable, over a full market cycle on an annualized basis and should exceed their benchmark return as specified in each Investment Manager(s) guidelines or applicable documentation.
Investment Characteristics
The main focus of investing will be on publicly traded partnership units of energy-focused MLP companies. The MLP composite portfolio as well as each Investment Manager(s) portfolio shall have similar portfolio characteristics as that of the Alerian MLP Index.
Investment Structure
MLP assets will be managed solely on an active basis in order to exploit the perceived inefficiencies in the MLP publicly-traded partnership markets.
I. CASH EQUIVALENTS
Investment Objectives
Total return of the cash equivalents composite portfolio should exceed the 91-day Treasury Bill rate of return over rolling twelve-month periods. To provide effective cash management when investing cash balances, emphasis is placed on the protection of principal through the purchase of higher quality money market instruments, while at the same time attempting to achieve the highest available return.
Investment Characteristics
Authorized investments, minimum short-term credit ratings, portfolio concentration limits and maturity limits for the short-term investment fund (STIF) shall be set forth in OP&F’s Short-Term Cash Management Policy. In addition, the frequency of credit reviews of approved issuers of commercial paper will be based on the short-term credit rating of the issuer and set forth in OP&F’s Short-Term Cash Management Policy.
Investment Structure
Staff is responsible for the cash management function, which is described in OP&F’s Short-Term Cash Management Policy.
6. PROXY VOTING OP&F’s Board of Trustees believes that common stock proxies are valuable and should be voted in the long-term interests and objectives of the Plan set forth herein and OP&F’s Proxy Voting Policy. Common stock proxies may be executed by the Sr. Investment Officer or the Chief Investment Officer, or their designees. Staff or their designee that exercises a proxy vote shall keep detailed records of said voting of proxies and related actions and will comply with all regulatory obligations related thereto and the policies set forth in OP&F’s Proxy Voting Policy. Staff shall provide a semi-annual summary report of proxy voting actions to the Investment Committee/Board of Trustees.
7. SECURITIES LENDING The investment objective for the securities lending program is to generate incremental income within a high quality investment program that safeguards the return of principal, maintains adequate daily liquidity, ensures diversification and tightly controls exposure to fluctuating interest rates. The program may be operated by a bank trustee or a third party

INVESTMENT SECTION 2016 Comprehensive Annual Financial Report
Page 72 • OP&F
lending agent. Marking to market shall be performed daily by the agent(s) and a minimum average of at least 102 percent for domestic, and 105 percent for Non-U.S. collateral shall be diligently maintained. Securities lending reports shall be provided monthly by the agent(s) to staff. Staff will present a semi-annual summary report to the Investment Committee/Board of Trustees.
8. INVESTMENT MANAGER MONITORING AND EVALUATION POLICYThe purpose of OP&F’s Investment Manager Monitoring and Evaluation Policy is to establish the process and discipline for managing the Investment Manager(s) relationship. The policy states the process, responsibilities and important factors for consideration in the monitoring and evaluation process. For a complete description of the monitoring and evaluation process, please see OP&F’s Investment Manager Monitoring and Evaluation Policy.
9. COMMUNICATIONS Each Investment Manager(s) will provide hard copy reports at least quarterly, including performance measurement, asset inventories, transaction summaries, market commentary or anything else deemed significant at the time of reporting. Each Investment Manager(s) is expected to meet or participate via teleconference or webcast with OP&F’s Board or staff or Investment Consultant(s) annually or as needed.
10. INVESTMENT MANAGER SEARCH POLICYWhen applicable, the selection of Investment Manager(s) will be conducted under a Request for Proposal (RFP) process and the search may be on a closed or open manager universe basis. For a complete description of the selection of Investment Manager(s), please see OP&F’s Investment Manager Search Policy.
11. SECURITIES LITIGATION POLICYThe Securities Litigation Policy has been adopted to ensure that OP&F takes prudent, effective, appropriate, and efficient actions to protect and increase the value of OP&F investments and to ensure that OP&F receives all money or assets which are due it as a result of the resolution of class action suits in a cost effective manner consistent with the Board’s fiduciary duties. For a complete description of the policy objectives, monitoring, reporting requirements and procedures, please see OP&F’s Securities Litigation Policy.
12. IRAN AND SUDAN DIVESTMENT POLICYAs required by uncodified provisions of Chapter 742 of the ORC, OP&F has adopted an Iran and Sudan Divestment Policy, the purpose of which is to divest and restrict the purchase of stocks and bonds issued by a publicly traded company with scrutinized business operations in Iran and Sudan, subject to the fiduciary responsibilities of the Board of Trustees, as set forth in Chapter 742 of the ORC. For a complete description of the responsibilities, process, reporting requirements, etc., please see OP&F’s Iran and Sudan Divestment Policy.

2016
CO
MP
REH
ENSI
VE A
NN
UA
L FI
NA
NC
IAL
REP
OR
T | O
HIO
PO
LIC
E &
FIR
E P
ENSI
ON
FU
ND
REPORT OF ACTUARY
DESCRIPTION OF ACTUARIAL ASSUMPTIONS AND METHODS
PLAN SUMMARY
ANALYSIS OF FINANCIAL EXPERIENCE – PENSION TRUST FUND
SHORT-TERM SOLVENCY TEST – PENSION TRUST FUND
ACTIVE MEMBER VALUATION DATA – PENSION TRUST FUND
RETIREES AND BENEFICIARIES ADDED TO AND REMOVED FROM ROLLS – PENSION TRUST FUND
CALCULATION OF ACTUARIAL VALUE ASSETS
EMPLOYER CONTRIBUTION RATES
MEMBER CONTRIBUTION RATES
SCHEDULE OF FUNDING PROGRESS – PENSION TRUST FUND
SCHEDULE OF FUNDING PROGRESS – RETIREE HEALTH CARE TRUST FUND
SHORT-TERM SOLVENCY TEST – RETIREE HEALTH CARE TRUST FUND
RETIREES AND BENEFICIARIES ADDED TO AND REMOVED FROM ROLL – RETIREE HEALTH CARE TRUST FUND
ANALYSIS OF FINANCIAL EXPERIENCE – RETIREE HEALTH CARE TRUST FUND
AC TUARIAL SEC TION 2016 Comprehensive Annual Financial Report
Page 74 • OP&F
October 2016
Board of Trustees Ohio Police & Fire Pension Fund 140 East Town Street Columbus, Ohio 43215
Members of the Board:
Ohio Police & Fire retained Buck Consultants, LLC (Buck) to complete this actuarial valuation of the Ohio Police & Fire Pension Fund (OP&F). This report presents the results of the annual actuarial valuation of the assets and liabilities of OP&F as of Jan. 1, 2016, prepared in accordance with Chapter 742 of the Ohio Revised Code (ORC), as amended by Senate Bill No. 340. The valuation takes into account all of the promised benefits to which members are entitled, including pension and survivor benefits.
The principal results of the valuation do not take into account Medicare Part B premium reimbursements or any other health care benefits. However, at the request of the Ohio Retirement Study Council (ORSC), supplemental results have been prepared that do take into account the liability for Medicare Part B premium reimbursements and are presented in Table 1A in the report.
The purpose of the valuation is to determine the financial status of OP&F on an actuarial basis. Use of this report for any other purpose may not be appropriate and may result in mistaken conclusions due to failure to understand applicable assumptions, methodologies, or inapplicability of the report for that purpose. Buck will not accept any liability for any statement made about the report without prior review by Buck.
Where presented, references to “funded ratio” and “unfunded accrued liability” typically are measured on an actuarial value of assets basis. It should be noted that the same measurements using market value of assets would result in different funded ratios and unfunded accrued liabilities. Moreover, the funded ratio presented is appropriate for evaluating the need and level of future contributions but makes no assessment regarding the funded status of the plan if the plan were to settle (i.e. purchase annuities) for a portion or all of its liabilities.
This report does not include accounting disclosure information under Governmental Accounting Standards Board (GASB) Statement Nos. 67 and 68. Buck will provide disclosure information under Statement Nos. 67 and 68 in a separate report after OP&F’s 2016 year- end. Buck prepares a separate valuation of OP&F retiree health care benefits in accordance with and in compliance with the parameters set forth in Statement No. 43.
The valuation was based on the actuarial assumptions and methods that have been adopted by the Board of Trustees, including a valuation interest rate of 8.25 percent per annum compounded annually. The assumptions were effective Jan. 1, 2012 and recommended by the actuary based on a five-year experience review covering the period 2007-2011. The next experience review will cover the five-year period 2012-2016. Actuarial Standards of Practice require that the likelihood and extent of future mortality improvements be considered. We have reflected future mortality improvement in the valuation. Additional assumptions related to the benefit provision changes under Senate Bill No. 340 were employed for this valuation.
REPORT OF ACTUARY
123 North Wacker Drive, Suite 1000 • Chicago, IL 60606 312.846.3000 • 312.846.3999 (fax)
19428/ C7220RET01-2011-Pension-Val.doc
OHIO POLICE & FIRE PENSION FUND
January 1, 2011 Actuarial Valuation of
Pension Benefits
October 2011
AC TUARIAL SEC TION2016 Comprehensive Annual Financial Report
OP&F • Page 75
Assets and Membership DataOP&F reported to the actuary the individual data for members as of the valuation date. While we did not verify the data at their source, we did perform tests for internal consistency and reasonableness. The amount of assets in the pension trust fund taken into account in the valuation was based on financial statements prepared for us by OP&F.
An assumption is made by Buck to account for salary adjustments reported by employers assumed to occur after the census information has been provided to Buck by OP&F. For the Jan. 1, 2016 actuarial valuation, Buck increased all reported salaries by an assumed 1.246 percent.
Funding Objectives and ProgressThe actuary uses an actuarial cost method to determine the portion of OP&F’s liabilities accrued by the members as of the valuation date and the portion that is attributable to future years of service. The rate of contribution necessary to systematically fund the future service liabilities, the normal cost rate, is calculated under the cost method to be a level percentage of active member payroll. The portion of the liabilities accrued as of the valuation date, the actuarial accrued liability (AAL), is compared to a market-related, actuarial value of OP&F’s assets. The amount of liabilities in excess of the assets is called the unfunded actuarial accrued liability (UAAL).
The actuary determines how many years are required by OP&F to completely amortize the UAAL (the funding period), using the member and employer contributions reduced by the amount allocated to health care and the amount of normal cost for the year. For 2003-2012, the funding period was infinite years, meaning the annual contribution toward the unfunded when compared to the unfunded amount was not sufficient to pay it off. As a result of benefit and member contribution changes under Senate Bill No. 340, changes to the DROP program, and a reduction in the contribution allocation to the Health Care Stabilization Fund by the Board of Trustees, and favorable asset investment gains, the pension funding period has decreased to 47 years, 33 years and 30 years for 2013, 2014 and 2015, respectively. As of Jan. 1, 2016, the funding period is 29 years.
Section 742.16 of the ORC, as adopted by Senate Bill No. 82, sets forth an objective that the funding period is no more than 30 years. If the funding period exceeds 30 years, a plan shall be developed and presented by the Board of Trustees to the ORSC to reduce the funding period to not more than 30 years. Section 742.14 of the ORC, as amended by Senate Bill No. 340, sets forth that the 30-year funding analysis be performed every three years and the 30- year funding plan, if necessary, be developed and presented not later than 90 days after the Board of Trustees’ receipt of the actuarial valuation and 30-year funding analysis. The current triennial analysis is based on this Jan. 1, 2016 actuarial valuation, which shows the funding period is 29 years, so no 30-year funding plan is required. The next analysis will be performed based on the Jan. 1, 2019 actuarial valuation. The funded ratio (i.e., the ratio of actuarial assets to the AAL) determined as of Jan. 1, 2016 is 71.3 percent, compared to 70.8 percent determined as of Jan. 1, 2015. If measured using the market value of assets, the funded ratio would be lower at 67.5 percent on account of net investment losses not yet reflected in the actuarial assets. Taking into account the AAL for Medicare Part B premium reimbursements, the funded ratio would be 69.5 percent using the actuarial assets and 65.8 percent using the market value of assets. The funded ratio is not intended to measure the adequacy of funding in any analysis of a possible settlement of plan liabilities.
Supporting Schedules and CertificationThe valuation report show detailed summaries of the financial results of the valuation and membership data used in preparing this valuation. The actuary prepared the following supporting schedules for inclusion in the Actuarial and Statistical Sections of the OP&F Comprehensive Annual Financial Report: Analysis of Financial Experience, Short-Term Solvency Test, Schedule of Funding Progress, Calculation of Actuarial Value of Assets, and Retirees and Beneficiaries Added to and Removed from the Rolls.
123 North Wacker Drive, Suite 1000 • Chicago, IL 60606 312.846.3000 • 312.846.3999 (fax)
AC TUARIAL SEC TION 2016 Comprehensive Annual Financial Report
Page 76 • OP&F
The valuation assumptions were chosen by the Board of Trustees with the advice of the actuary. The assumptions used to develop the Jan. 1, 2016 valuation are individually reasonable and in combination represent our best estimate of anticipated experience under the plan.
Future actuarial measurements may differ significantly from current measurements due to plan experience differing from that anticipated by the economic and demographic assumptions, increases or decreases expected as part of the natural operation of the methodology used for these measurements, and changes in plan provisions or applicable law. Because of limited scope, Buck performed no analysis of the potential range of such future differences.
This report was prepared under the supervision of Larry Langer and Paul Wilkinson who are pension actuaries, Enrolled Actuaries, Associates of the Society of Actuaries and Members of the American Academy of Actuaries and meet the Qualification Standards of the American Academy of Actuaries to render the pension actuarial opinions contained in this report. Bob Besenhofer is a health care actuary, Associate of the Society of Actuaries and Member of the American Academy of Actuaries and meets the Qualification Standards of the American Academy of Actuaries to render the actuarial opinions contained in this report regarding the liability adjustments provided in Table 1A for Medicare Part B reimbursements. This report has been prepared in accordance with all Applicable Actuarial Standards of Practice. We are available to answer any questions on the material contained in the report, or to provide explanations or further details as may be appropriate.
Buck is completely independent of OP&F and its officers and key personnel. Neither we, nor anyone closely associated with us, has any relationship with them that would impair our independence.
Respectfully submitted,
Larry Langer, FCA, ASA, EA, MAAA Paul R. Wilkinson, ASA, EA, MAAAPrincipal, Consulting Actuary
Bob Besenhofer, ASA, MAAA Director, Health and Productivity
Director, Consulting Actuary
123 North Wacker Drive, Suite 1000 • Chicago, IL 60606 312.846.3000 • 312.846.3999 (fax)

AC TUARIAL SEC TION2016 Comprehensive Annual Financial Report
OP&F • Page 77
DESCRIPTION OF ACTUARIAL ASSUMPTIONS AND METHODSASSUMPTIONSThe actuarial assumptions were adopted as of Jan. 1, 2012, based on a five-year experience review covering the period 2007-2011. The next review of the actuarial assumptions is to be completed for adoption with the Jan. 1, 2017 valuation. INTEREST RATE: 8.25 percent per annum, compounded annually. SALARY INCREASE RATES: Assumed annual salary increases are as follows:
Years of Service Salary Increase Rate
Less than 1 11.00%
1 9.50%
2 8.50%
3 6.50%
4 5.00%
5 or more 4.25%
DROP INTEREST RATE: 4.5 percent per annum, compounded annually.
COLA: Three percent simple; 2.6 percent simple for increases based on the lesser of the increase in CPI and three percent.
WITHDRAWAL RATES: The following sample withdrawal rates are based on age and service (for causes other than death, disability, or retirement):
POLICE
Age
Years of Service
0 1 2 3 4 5 6 7 8 9 10+
25 10.3% 6.3% 3.5% 4.4% 3.9% 2.2% 2.1% 2.0% 1.8% 1.8% 1.5%
30 10.4% 5.8% 4.4% 3.5% 3.2% 3.0% 2.9% 2.5% 2.2% 1.8% 1.5%
35 13.0% 5.3% 3.2% 3.8% 3.5% 3.4% 3.2% 3.1% 2.5% 1.7% 1.3%
40 14.0% 6.0% 4.6% 4.5% 4.1% 3.9% 3.3% 3.2% 1.8% 1.5% 0.9%
45 16.0% 6.3% 6.1% 5.9% 5.2% 4.3% 3.5% 3.5% 2.1% 1.2% 0.8%
50 18.0% 8.3% 8.1% 7.5% 6.5% 5.3% 4.1% 4.0% 3.9% 3.1% 1.5%
55 20.0% 12.0% 10.0% 9.4% 8.0% 6.5% 5.2% 5.1% 4.9% 4.5% 1.7%
60 20.0% 12.0% 10.0% 9.4% 8.0% 6.5% 5.2% 5.1% 4.9% 4.5% 1.7%
FIREFIGHTERS
Age
Years of Service
0 1 2 3 4 5 6 7 8 9 10+
25 2.8% 2.2% 1.6% 1.5% 1.2% 1.1% 1.0% 1.0% 0.9% 0.9% 0.8%
30 3.8% 1.6% 1.8% 1.7% 1.6% 1.3% 1.2% 1.1% 1.0% 1.0% 0.9%
35 4.2% 3.4% 2.1% 2.0% 1.9% 1.4% 1.3% 1.25% 1.1% 0.9% 0.8%
40 4.5% 3.6% 2.2% 2.1% 2.0% 1.5% 1.4% 1.3% 1.2% 1.0% 0.6%
45 4.6% 3.8% 2.7% 2.6% 2.5% 1.9% 1.6% 1.4% 1.3% 1.1% 0.5%
50 6.1% 4.4% 4.0% 3.8% 3.5% 2.7% 2.4% 2.2% 2.1% 1.5% 0.7%
55 6.1% 5.0% 5.0% 5.0% 4.0% 3.5% 2.4% 2.2% 2.0% 1.5% 1.1%
60 6.1% 5.0% 5.0% 5.0% 4.0% 3.5% 2.4% 2.2% 2.0% 1.5% 1.1%

AC TUARIAL SEC TION 2016 Comprehensive Annual Financial Report
Page 78 • OP&F
RATES OF DISABILITY
The following are sample rates of disability and occurrence of disability by type:
Age Police Firefighters20 .002% .004%30 .255% .063%40 .732% .454%50 1.126% .891%55 .933% 1.350%60 .966% 1.331%64 1.441% 3.126%
On duty permanent and total 23% On duty partial 61% Off duty ordinary 16%
RETIREMENT RATES
The following rates of retirement apply to members not in DROP:
Age Police Firefighters48 10% 10%49-52 5% 5%53-54 11% 5%55-57 11% 10%58-59 5% 13%60 15% 20%61 25% 20%62 25% 50%63 25% 20%64 25% 25%65-69 35% 25%70 100% 100%
DEFERRED RETIREMENT OPTION PLAN ELECTIONS
90 percent of members who do not retire when first eligible are assumed to elect DROP.

AC TUARIAL SEC TION2016 Comprehensive Annual Financial Report
OP&F • Page 79
DROP RETIREMENT RATES
The following rates of retirement apply to members in DROP on or before July 1, 2013:
Age
Police - Years in DROP
0 1 2 3 4 5 6 7 8
48 5%
49 5% 5%
50 4% 5% 5%
51 4% 5% 5% 10%
52 4% 5% 5% 10% 10%
53 4% 5% 5% 10% 10% 12%
54 4% 5% 5% 10% 10% 12% 14%
55 5% 5% 5% 15% 15% 12% 17% 30%
56 5% 5% 5% 15% 15% 12% 17% 30% 100%
57 5% 5% 5% 15% 15% 12% 17% 30% 100%
58 5% 5% 5% 15% 15% 12% 17% 30% 100%
59 16% 5% 5% 15% 16% 15% 18% 32% 100%
60 16% 5% 5% 15% 16% 15% 18% 32% 100%
61 16% 5% 5% 15% 16% 15% 18% 32% 100%
62 16% 5% 5% 15% 16% 15% 18% 32% 100%
63 16% 5% 5% 15% 16% 15% 18% 32% 100%
64 19% 5% 5% 17% 17% 16% 19% 35% 100%
65-69 19% 5% 5% 17% 17% 16% 19% 35% 100%
70 100% 100% 100% 100% 100% 100% 100% 100% 100%
Age
Firefighters - Years in DROP
0 1 2 3 4 5 6 7 8
48 2%
49 4% 3%
50 4% 3% 3%
51 4% 3% 3% 10%
52 4% 3% 3% 10% 12%
53 4% 3% 3% 10% 12% 13%
54 4% 3% 3% 10% 12% 13% 15%
55 5% 3% 3% 12% 12% 13% 17% 27%
56 5% 3% 3% 12% 12% 13% 17% 27% 100%
57 5% 3% 3% 12% 12% 13% 17% 27% 100%
58 5% 3% 3% 17% 16% 15% 20% 35% 100%
59 6% 3% 3% 17% 16% 15% 20% 35% 100%
60 6% 3% 3% 17% 16% 15% 20% 35% 100%
61 6% 3% 3% 17% 16% 15% 20% 35% 100%
62 6% 3% 3% 17% 16% 15% 20% 35% 100%
63 30% 3% 3% 20% 20% 20% 20% 40% 100%
64 30% 3% 3% 20% 20% 20% 20% 40% 100%
65-69 30% 3% 3% 20% 20% 20% 20% 40% 100%
70 100% 100% 100% 100% 100% 100% 100% 100% 100%
The same rates apply for members entering DROP after July 1, 2013, except the rates for years three and four are replaced with the rates for year two.
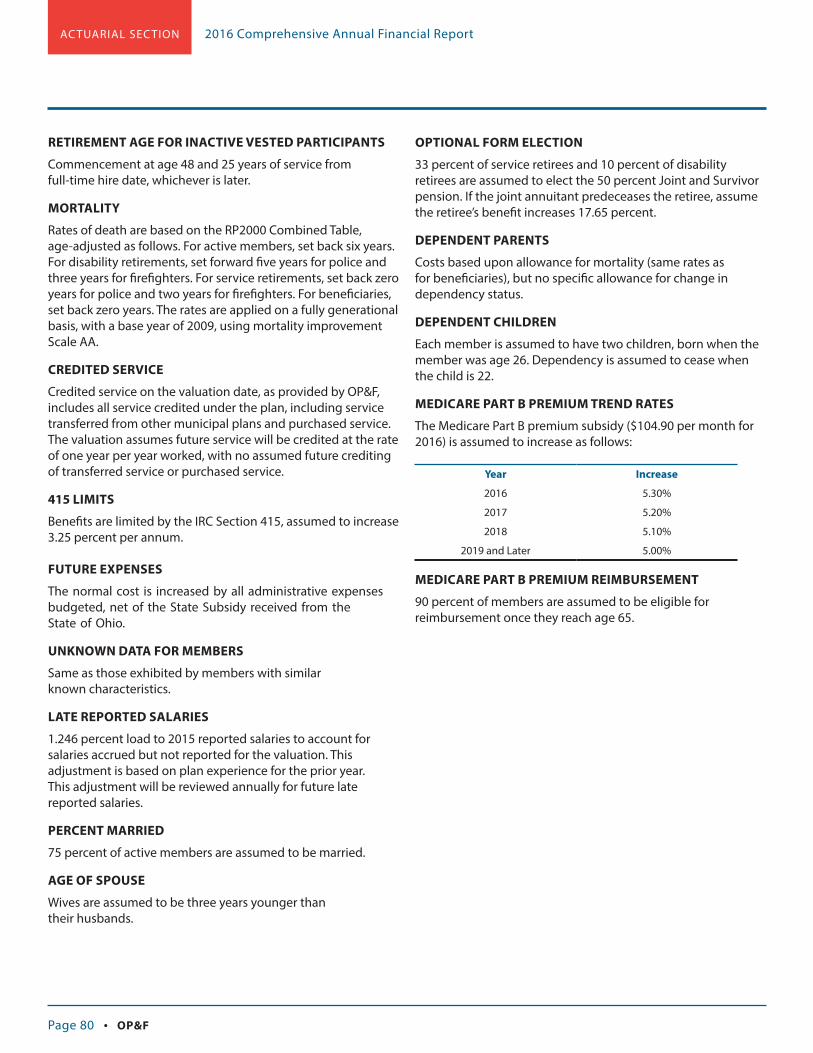
AC TUARIAL SEC TION 2016 Comprehensive Annual Financial Report
Page 80 • OP&F
RETIREMENT AGE FOR INACTIVE VESTED PARTICIPANTS
Commencement at age 48 and 25 years of service from full-time hire date, whichever is later.
MORTALITY
Rates of death are based on the RP2000 Combined Table, age-adjusted as follows. For active members, set back six years. For disability retirements, set forward five years for police and three years for firefighters. For service retirements, set back zero years for police and two years for firefighters. For beneficiaries, set back zero years. The rates are applied on a fully generational basis, with a base year of 2009, using mortality improvement Scale AA.
CREDITED SERVICE
Credited service on the valuation date, as provided by OP&F, includes all service credited under the plan, including service transferred from other municipal plans and purchased service. The valuation assumes future service will be credited at the rate of one year per year worked, with no assumed future crediting of transferred service or purchased service.
415 LIMITS
Benefits are limited by the IRC Section 415, assumed to increase 3.25 percent per annum. FUTURE EXPENSES
The normal cost is increased by all administrative expenses budgeted, net of the State Subsidy received from the State of Ohio.
UNKNOWN DATA FOR MEMBERS
Same as those exhibited by members with similar known characteristics.
LATE REPORTED SALARIES
1.246 percent load to 2015 reported salaries to account for salaries accrued but not reported for the valuation. This adjustment is based on plan experience for the prior year. This adjustment will be reviewed annually for future late reported salaries.
PERCENT MARRIED
75 percent of active members are assumed to be married.
AGE OF SPOUSE
Wives are assumed to be three years younger than their husbands.
OPTIONAL FORM ELECTION
33 percent of service retirees and 10 percent of disability retirees are assumed to elect the 50 percent Joint and Survivor pension. If the joint annuitant predeceases the retiree, assume the retiree’s benefit increases 17.65 percent.
DEPENDENT PARENTS
Costs based upon allowance for mortality (same rates as for beneficiaries), but no specific allowance for change in dependency status.
DEPENDENT CHILDREN
Each member is assumed to have two children, born when the member was age 26. Dependency is assumed to cease when the child is 22.
MEDICARE PART B PREMIUM TREND RATES
The Medicare Part B premium subsidy ($104.90 per month for 2016) is assumed to increase as follows:
Year Increase
2016 5.30%
2017 5.20%
2018 5.10%
2019 and Later 5.00%
MEDICARE PART B PREMIUM REIMBURSEMENT
90 percent of members are assumed to be eligible for reimbursement once they reach age 65.
AC TUARIAL SEC TION2016 Comprehensive Annual Financial Report
OP&F • Page 81
METHODSACTUARIAL COST METHOD
Projected benefit method with individual level percentage entry age normal cost and AAL. Gains and losses are reflected in the accrued liability.
ADJUSTMENT FOR RE-EMPLOYED RETIREES
The present value of future benefits and the actuarial accrued liability are increased by an amount for the re-employed retirees’ defined contribution plan benefit equal to two times the re-employed retirees’ post-retirement contribution balances on the valuation date.
ADJUSTMENT FOR EMPLOYER ACCRUED LIABILITY
The actuarial accrued liability is reduced by the present value of special employer contributions - referred to as “Local Funds.” Local governments are required by state statute to pay the unfunded portion of the actuarially-determined liability of the local police and firefighter’s relief and pension funds that were merged to form OP&F in 1967. The ORC designates this obligation of the local governments to the Employers’ Accrued Liability. Interest on the outstanding balance is being accrued at the rate of 4.25 percent, compounded semiannually. Local governments began repayment in 1969 and payments are required to be made until 2035. The present value of the remaining payments on the valuation date is determined using the valuation interest rate.
ASSET VALUATION METHOD
A four-year moving average market value of assets that spreads the difference between the actual investment income and the expected income on the market value (based on the valuation interest rate) over a period of four years. The actuarial value shall not be less than 80 percent or more than 120 percent of market value.
PAYROLL GROWTH
Inflation rate of 3.25 percent plus productivity increase rate of 0.5 percent.
DATA
CENSUS AND ASSETS
The valuation was based on members of OP&F as of the valuation date and does not take into account future members. All census and asset data was supplied by OP&F. Salaries and benefits tabulated in the tables in this report were summed to pennies, but displayed to whole dollars, thus, totals may not be consistent with amounts displayed due to rounding.

AC TUARIAL SEC TION 2016 Comprehensive Annual Financial Report
Page 82 • OP&F
SUMMARY OF BENEFITS AND CONTRIBUTION PROVISIONS
The following is intended to summarize the key provisions valued in this valuation. Members of OP&F and other parties should not rely on this summary as a substitute for or legal interpretation of the laws and rules covering this retirement plan.
MEMBERSHIP
Membership in OP&F is mandatory under Ohio law for all full–time police officers employed by Ohio municipalities and appointed under the required statutory provisions. Membership is also mandatory for all full-time firefighters employed by Ohio municipalities, townships, villages, joint fire districts or other political subdivisions. In order to become members of OP&F, full-time firefighters are required to satisfactorily complete, or have satisfactorily completed, a firefighter training course approved under former Section 3303.07, Section 4765.55 or conducted under Section 3737.33 of the ORC.
ELIGIBILITY FOR MEMBERSHIP
Full-time police officers or firefighters are eligible for membership in OP&F immediately upon commencement of employment as a full-time police officer or firefighter.
CONTRIBUTIONS
Employer and member contributions are established by statute and both are due monthly. Employers of police officers pay 19.5 percent of salary; employers of firefighters pay 24 percent of salary. Members contributed 10 percent of salary through July 1, 2013. On July 2, 2013, the member contribution rate increased by 0.75 percent to 10.75 percent. The member contribution rate increased annually by 0.75 percent until it reached the current 12.25 percent on July 2, 2015.
Employer Contribution Rates - Percentage of Active Member Payroll
Time Frame of Rates Police Fire
Jan 1, 1986 thru Present 19.50% 24.00%
Member Contribution Rates - Percentage of Active Member Payroll
Time Frame of Rates Police Fire
July 2, 2015 and Thereafter 12.25% 12.25%
July 2, 2014 thru July 1, 2015 11.50% 11.50%
July 2, 2013 thru July 1, 2014 10.75% 10.75%
Sept. 9, 1988 thru July 1, 2013 10.00% 10.00%
BENEFITSSERVICE RETIREMENT
Upon attaining a qualifying age with sufficient years of service, a member of OP&F may retire and receive a lifetime monthly pension. OP&F offers four types of service retirement: normal, service commuted, age/service commuted and actuarially reduced. Each type has different eligibility guidelines and is calculated using the member’s average annual salary.
Since average annual salary is subject to certain statutory and administrative limitations, not all salary, earnings, or compensation may be used in the calculation. OP&F calculates allowable average annual salary as follows:
• For OP&F members with 15 or more years of service credit as of July 1, 2013, average annual salary is an average of the three years of highest allowable earnings, regardless of when in their career the highest years occurred.
• For OP&F members with less than 15 years of service credit as of July 1, 2013, average annual salary is an average of the five years of highest allowable earnings, regardless of when in their career the highest years occurred.
• A salary benchmark is established for members with 15 or more years of service credit as of July 1, 2013, under which certain increases are excluded from salary for the purpose of determining allowable average annual salary. This benchmarking does not apply to members with less than 15 years of service credit as of July 1, 2013.
NORMAL SERVICE RETIREMENT
ELIGIBILITY
• For members hired into an OP&F-covered position after July 1, 2013, minimum retirement age is 52 with at least 25 years of service credit.
• For members hired into an OP&F-covered position on or before July 1, 2013, minimum retirement age is 48 with 25 years of service credit.
BENEFIT
An annual pension equal to a percentage of the allowable average annual salary. The percentage equals 2.5 percent for each of the first 20 years of service, 2.0 percent for each of the next five years of service, and 1.5 percent for each year of service in excess of 25 years. The maximum pension of 72 percent of the allowable average annual salary is paid after 33 years of service.
PLAN SUMMARY

AC TUARIAL SEC TION2016 Comprehensive Annual Financial Report
OP&F • Page 83
SERVICE COMMUTED RETIREMENT
ELIGIBILITY
• For members hired into an OP&F-covered position after July 1, 2013, the minimum retirement age is 52, they must have at least 15 years of service credit and 25 years have elapsed from the date of their full-time hire.
• For members hired into an OP&F-covered position on or before July 1, 2013, the minimum retirement age is 48, they must have at least 15 years of service credit and 25 years have elapsed from the date of their full-time hire.
BENEFIT
An annual pension equal to 1.5 percent of the allowable average annual salary multiplied by the number of full years of service credit (up to 25 years of service credit).
AGE/SERVICE COMMUTED RETIREMENT
ELIGIBILITY
Age 62, 15 years of service credit and still working as a full-time police officer or firefighter.
BENEFIT
An annual pension that uses the same formula as the Normal Service Retirement benefit (up to 25 years of service credit).
ACTUARIALLY REDUCED
ELIGIBILITY
For members hired into an OP&F-covered position after July 1, 2013, age 48 with 25 years of service credit.
BENEFIT
An annual pension reduced to the actuarial equivalent of the amount payable had the member retired at age 52.
RIGHTS UPON SEPARATION FROM SERVICE
DEFERRED PENSION
If a member meets the years of service credit requirement for any of the service retirement pension benefits but leaves service before attaining the minimum retirement age, a pension becomes payable upon attainment of the qualifying age and filing the appropriate paperwork with OP&F.
REFUND OF EMPLOYEE CONTRIBUTIONS
Upon termination of active service in a police or fire department, a member may withdraw their accumulated employee contributions on deposit with OP&F. Acceptance
of a refund cancels the member’s rights and benefits in OP&F. Employer contributions are not refundable. The refund of employee contributions cancels the member’s total service credit with OP&F.
TERMINATION BEFORE RETIREMENT WITH 25 YEARS SERVICE CREDIT
BENEFIT
Same as the Normal Service Retirement benefit, except benefit commences once the member reaches minimum retirement age.
• For members hired into an OP&F-covered position after July 1, 2013, minimum retirement age is 52.
• For members hired into an OP&F-covered position on or before July 1, 2013, minimum retirement age is 48.
TERMINATION BEFORE RETIREMENT WITH 15 YEARS SERVICE CREDIT
BENEFIT
Same as the Service Commuted Retirement, except benefit commences once the member reaches minimum retirement age and 25 years have elapsed from the date of full-time hire.
• For members hired into an OP&F-covered position after July 1, 2013, the minimum retirement age is 52.
• For members hired into an OP&F-covered position on or before July 1, 2013, the minimum retirement age is 48.
TERMINATION BEFORE RETIREMENT WITH LESS THAN 15 YEARS SERVICE CREDIT
BENEFIT
A lump sum amount equal to the sum of the member’s contributions to OP&F.
DEFERRED RETIREMENT OPTION PLAN
ELIGIBILITY
When a member is eligible for a normal service retirement they can enter DROP by delaying retirement and continuing to work as a full-time police officer or firefighter.
• For members hired into an OP&F-covered position after July 1, 2013, normal service retirement eligibility is age 52 with at least 25 years of service credit.
• For members hired into an OP&F-covered position on or before July 1, 2013, normal service retirement eligibility is age 48 with at least 25 years of service credit.

AC TUARIAL SEC TION 2016 Comprehensive Annual Financial Report
Page 84 • OP&F
BENEFIT
DROP is a cost neutral benefit offered by OP&F. Upon the DROP effective date, the member’s pension is calculated as if that were their date of retirement. While the member continues to work and draw their normal salary, the amount they would have received in retirement benefits accumulates tax-deferred at OP&F on their behalf, as well as a portion of their OP&F employee contributions and interest. Since the member’s pension has already been calculated:
• The years of DROP service do not apply towards the member’s normal service retirement.
• If a member earns a higher salary after their DROP effective date due to a raise, job promotion, etc., it will not be used to recalculate their pension and, therefore, will not result in that member receiving a higher pension upon retirement.
The DROP interest rate is set by administrative rule and is subject to change at any time. OP&F credits interest to all DROP balances each month at a rate equal to the 10-year United States Treasury Note Business Day Series, as published by the U.S. Department of the Treasury, with a cap of five percent. This variable interest rate is adjusted quarterly to match the published 10-year U.S. Treasury Note rate for the last trading business day of the preceding quarter and is in effect for the subsequent quarter.
Members whose election to participate in DROP is effective after July 1, 2013 do not qualify for annual COLA at any time during DROP. Members whose election to participate in DROP is effective on or before July 1, 2013 will continue to receive a COLA during DROP, but only when they reach 55 years of age and have been participating in DROP for at least one year. Those members whose enrollment date into DROP qualify them for a COLA during DROP will receive three percent of their base pension.
Member contributions are credited to their DROP account based on the number of years of DROP service. For those members whose election to participate in DROP is effective after July 1, 2013, OP&F applies contributions to DROP in the following manner:
Years of DROP Service Percentage of Member Contributions
Years 1-3 50% of member’s contributions
Years 4-5 75% of member’s contributions
Years 6-8 100% of member’s contributions
For this group of members, the minimum participation in DROP, without penalty, is five years and the maximum is eight years.
• If a member terminates employment within the first five years of joining DROP, then the member forfeits all of their DROP interest. In addition to losing their accumulated interest, members who choose to terminate employment before completing their required participation period cannot withdraw any of the funds in their DROP account until the minimum participation period has expired. The only exception to this rule is if the member dies during the minimum participation period. The member’s surviving spouse, designated beneficiary or estate, as applicable, will receive the entire DROP account balance determined at the time of death.
• If a member chooses to continue working after eight years in DROP, the member forfeits all DROP benefits and receives the Normal Service Retirement benefit upon retirement, which will be calculated to include the service credit earned during the DROP participation period.
For those members whose election to participate in DROP was on or before July 1, 2013, member contributions are applied to DROP under the following schedule:
Years of DROP Service Percentage of Member Contributions
Years 1-2 50% of member’s contributions
Year 3 75% of member’s contributions
Years 4-8 100% of member’s contributions
For this group of members, the minimum participation in DROP, without penalty, is three years and the maximum is eight.
• If a member terminates employment within the first three years of joining DROP, then the member forfeits all of their DROP interest. In addition to losing their accumulated interest, members who choose to terminate employment before completing their required participation period cannot withdraw any of the funds in their DROP account until the minimum participation period has expired. The only exception to this rule is if the member dies during the minimum participation period. The member’s surviving spouse, designated beneficiary or estate, as applicable, will receive the entire DROP account balance determined at the time of death.

AC TUARIAL SEC TION2016 Comprehensive Annual Financial Report
OP&F • Page 85
• If a member chooses to continue working after eight years in DROP, the member forfeits all DROP benefits and receives the Normal Service Retirement benefit upon retirement, which will be calculated to include the service credit earned during the DROP participation period.
All DROP members retiring before the eight-year max receive their Normal Service Retirement benefit determined at the time of DROP entry, with the COLA adjustment (if applicable) to date of retirement when eligible. These members will also receive the DROP account balance as a lump sum or monthly annuity.
If a member dies while participating in DROP, the member’s surviving spouse, designated beneficiary or estate will receive the entire DROP account balance determined at the time of death. The surviving spouse or contingent dependent beneficiary will receive the greater of the retirement allowance made at the time of DROP entry or the Normal Service Retirement benefit paid with COLA adjustments (if applicable) to the date of death, paid as if the member had elected a 50 percent joint and survivor option at death. All other statutory death benefits will apply.
If the member becomes disabled while in DROP and has not terminated employment, the member must choose either to receive a disability benefit or a service retirement with DROP. If the member chooses the disability benefit, the member forfeits all DROP benefits and receives the disability benefit, with service credit during the DROP period included.
DISABILITY BENEFITS
Members who become unable to perform their official duties and whose earning capacities are impaired may qualify for disability benefits. Disability benefits are classified as either service-incurred (on-duty) or non-service-incurred (off-duty) and differ in eligibility requirements and benefit formulas. Annual medical evaluations are required for disability benefit recipients who would not have met the age and service requirements for a Normal Service Retirement, unless the Board of Trustee waives this requirement based upon an OP&F physician’s certification that the disability is ongoing and further evaluation would not be cost effective. Annual earnings statements are also required to be submitted to OP&F.
PERMANENT AND TOTAL DISABILITY (ON-DUTY)
ELIGIBILITY
No age or service requirement.
BENEFIT
An annual benefit equal to 72 percent of the allowable average annual salary.
PARTIAL DISABILITY (ON-DUTY)
ELIGIBILITY
No age or service requirement.
BENEFIT
If the member has less than 25 years of service credit an annual benefit fixed by the Board of Trustees to be a certain percent up to 60 percent of the allowable average annual salary. If the member has 25 or more years of service credit, the annual disability benefit is equal to the Normal Service Retirement amount.
NON-SERVICE INCURRED DISABILITY (OFF-DUTY)
ELIGIBILITY
Any age and five years of service credit.
BENEFIT
An annual amount is the percent awarded by the Board of Trustees and may not exceed 60 percent of the allowable average annual salary. Service credit over 25 years cannot be used in calculating an off-duty disability award.
PRE–RETIREMENT SURVIVOR ANNUITY
ELIGIBILITY
Upon death before retirement, but after having satisfied the requirements for a Normal Service Retirement or an Age/Service Commuted retirement.
BENEFIT
The surviving spouse or contingent dependent beneficiary will receive the equivalent of a 50 percent joint and survivor annuity, calculated under the assumption that the decedent had retired effective the day following his/her death.

AC TUARIAL SEC TION 2016 Comprehensive Annual Financial Report
Page 86 • OP&F
STATUTORY SURVIVOR BENEFITS
ELIGIBILITY
Upon death of any active or retired member of OP&F.
BENEFIT
Surviving Spouse’s Benefit An annual amount equal to $6,600 ($550 monthly), plus an annual COLA of three percent of the original base benefit, paid each July 1, beginning July 1, 2000. The benefit is paid to the surviving spouse for life.
If the spouse is receiving a full death benefit under the Death Fund Benefit statute, the spouse’s statutory survivor benefit is $4,920 ($410 monthly). The Death Benefit Fund is funded by the State of Ohio and provides special benefits to eligible survivors of public safety officers who are killed in the line of duty or who die from injuries or disease incurred in the performance of official duties. These eligible survivors are entitled to receive the member’s full monthly salary, which will be reduced at the member’s retirement eligibility date. These death benefit payments are in addition to any optional payment plan benefits elected by the member.
Surviving Child’s Benefit An annual amount equal to $1,800 ($150 monthly), payable until such child attains age 18 or marries, whichever occurs first. The payment can continue to an unmarried full–time student until age 22. A dependent disabled child, regardless of age at time of member’s death, is entitled to a benefit until death or recovery from disability. A COLA of three percent of the original base is payable each July 1.
Dependent Parents’ Benefit If there is no surviving spouse or dependent children, an annual amount of $2,400 ($200 monthly) is payable to one dependent parent or $1,200 ($100 monthly) each to two dependent parents for life or until dependency ceases or remarriage. A COLA of three percent of the original base is payable each July 1.
LUMP SUM DEATH BENEFIT
ELIGIBILITY
Upon death of any service or disability retiree of OP&F.
BENEFIT
A lump sum payment of $1,000 is paid to the member’s surviving spouse or, if no surviving spouse, to a designated beneficiary. If there is no surviving spouse or beneficiary, then it is paid to the member’s estate.

AC TUARIAL SEC TION2016 Comprehensive Annual Financial Report
OP&F • Page 87
Survivors Monthly Benefit Causes of Termination
Widow / Widower current amount + future COLA • Death
Minor child current amount + future COLA• Death • Marriage • Attainment of age 18
Dependent disabled child current amount + future COLA• Death • Recovery from disability
Student current amount + future COLA
• Death • Marriage • Attainment of age 22 • Loss of student status
One dependent parent current amount + future COLA• Death • Re-marriage • Termination of dependencyTwo dependent parents 1/2 current amount (each)
+ future COLA
Benefit TypeBase Monthly
Benefit Amount
Base Monthly Benefit Amount Plus Increases
Through July 1, 2015
Monthly Increase Effective
July 1, 2015
Spouse * $550 $809.60**** $16.50Child 150 220.80**** 4.50One Parent 200 294.40**** 6.00Two Parents 100 147.20**** 3.00
* Spouse’s benefit is $410 if spouse is receiving a full death benefit under the Death Fund Benefit statute. There is no annual increase on this benefit payment.
** On July 1, 2000 The Statutory Surviving Spouse Benefit increased by $12.10 per month. This increase was a percentage of the original benefit amount, equaling the percentage increase in the CPI plus unused prior increases, to a maximum of three percent. Every year after 2000, the monthly increase was $16.50 or three percent of the base benefit.
*** On July 1, 2000 The Statutory Surviving Child Benefit increased by $3.30 per month. This increase was a percentage of the original benefit amount, equaling the percentage increase in the CPI plus unused prior increases, to a maximum of three percent. Every year after 2000, the monthly increase was $4.50 or three percent of base benefit.
**** On July 1, 2000 The Statutory Surviving One Parent Benefit increased by $4.40 per month. This increase was a percentage of the original benefit amount, equaling the percentage increase in the CPI plus unused prior increases, to a maximum of three percent. Every year after 2000, the monthly increase was $6.00 or three percent of base benefit.

AC TUARIAL SEC TION 2016 Comprehensive Annual Financial Report
Page 88 • OP&F
ANNUITIESEffective Feb. 28, 1980, for those members who are retiring on either a service pension or a disability benefit, optional annuity plans can be chosen, subject to certain limitations. The member can elect actuarially reduced benefits under a joint and survivor annuity, life annuity certain and continuous, or multiple beneficiary annuity plan. The optional annuity plans allow the member’s beneficiary(ies) to receive a lifetime payment upon the member’s death.
ANNUITY TYPES
SINGLE LIFE ANNUITY
This plan pays the maximum retirement allowance that the member is entitled to receive and, upon the member’s death, none of the pension or benefit is continued to any beneficiary. For unmarried members, this is the standard annuity plan. Married members may elect this plan only if the spouse consents to the selection in writing.
JOINT AND SURVIVOR ANNUITY (JSA)
Under this plan, a member designates that, upon his or her death, a certain percentage of the member’s actuarially reduced benefit is continued to a surviving designated beneficiary for life. Any percentage between one percent and 100 percent of the member’s reduced pension may be continued to the surviving designated beneficiary, but the percent continued may be limited based on the beneficiary’s age.
If a member is married at the time benefits are elected, the standard plan is a 50 percent JSA continuing one-half of the member’s reduced monthly benefit to his or her surviving spouse. If the member wants to select a plan which provides for the continuation of benefits for someone other than the spouse or less than 50 percent JSA to the spouse, the spouse must consent in writing to this choice. This plan automatically terminates upon death of the beneficiary, to be effective the month following OP&F’s receipt of notice of death, or it may be cancelled upon divorce with the consent of the member’s spouse or a specific court order, at which point the annuity reverts to the single life annuity to the member. Elected option may be cancelled within one year after benefits commence, with the consent of the beneficiary.
MULTIPLE BENEFICIARY ANNUITY
Under the multiple beneficiary annuity plan, a member may designate up to four beneficiaries at the time of retirement so that, upon death, a certain percentage of the member’s actuarially reduced benefit is continued to the surviving designated beneficiaries for their lives.
If the member is married at the time of retirement, the spouse must consent in writing for an annuity selection that provides for less than 50 percent JSA payable to the spouse.
LIFE ANNUITY CERTAIN AND CONTINUOUS (LACC)
This plan provides a lifetime allowance to the member and will only be paid to a designated beneficiary if the member dies and the period elected by the member has not expired. The minimum guarantee period is five years and the maximum is 20 years. 100 percent of the member’s reduced pension continues to the beneficiary for the guarantee period selected. The elected option may be cancelled within one-year after benefits commence, with the consent of the beneficiary. If the member is married at the time of retirement, the spouse must consent in writing for an annuity selection that provides for less than a 50 percent JSA payable to the spouse.
TIERED RETIREMENT PLAN – COLA OR TERMINAL PAY (NON-COLA)
Members retiring on or after July 24, 1986, who had 15 or more years of service credit as of Jan. 1, 1989, are eligible to select between two different pension calculation plans. Under the terminal pay method, a member’s monthly pension benefit is calculated using terminal payouts at the time of retirement such as accrued sick leave and vacation compensation to increase the amount of the average annual salary, but subject to certain limitations, and these members are not eligible to receive cost-of-living allowance adjustments. Under the COLA method, terminal payments are not included in the calculation of a member’s average annual salary, but the member is eligible to receive COLA increases. The COLA method is the automatic calculation method for any active member with fewer than 15 years of service as of Jan. 1, 1989.
Under the COLA method, members who are at least 55 years old and have been receiving OP&F pension benefits for at least one year are eligible for cost-of-living allowance adjustments. The age 55 provision for receiving a COLA does not apply to those who are receiving a permanent and total disability benefit, surviving beneficiaries under optional plans and statutory survivors.
The COLA amount for members who have 15 or more years of service credit as of July 1, 2013 and members who are receiving a pension benefit that became effective before July 1, 2013 will be equal to three percent of the member’s base pension benefit.

AC TUARIAL SEC TION2016 Comprehensive Annual Financial Report
OP&F • Page 89
The COLA amount for members who have less than 15 years of service credit as of July 1, 2013, and members whose pension benefit became effective on or after July 1, 2013, will be equal to a percentage of the member’s base pension benefit where the percentage is the lesser of three percent or the percentage increase in the consumer price index, if any, over the 12 month period that ends on the thirtieth day of September of the immediately preceding year, rounded to the nearest one-tenth of one percent.
Members who retired prior to July 24, 1986 or their surviving beneficiaries under optional plans are entitled to cost-of-living allowance increases. The annual increase is paid on July 1 each year. The annual COLA increase is $360 under a Single Life Annuity Plan with proportional reductions for optional payment plans.
RE-EMPLOYED RETIREE’S DEFINED CONTRIBUTION PLAN BENEFIT
Effective June 30, 1991, every person who is retired under an Ohio public pension plan and who is re-employed in an OP&F covered position must contribute to OP&F at the same rate as other police officers or firefighters. The employer pays the normal rate as well. If the re-employed member terminates employment before age 60, Ohio law allows the member to receive a lump sum payment of post-retirement employee contributions made during the period of re-employment, plus interest. If the member waits until age 60 to receive this benefit, he or she can choose to receive either a lump sum payment in an amount equal to twice his or her contributions, plus interest, or a lifetime annuity paid monthly. If, after calculation, the member’s lifetime monthly annuity is less than $25, the member may only select the lump sum payment option. If the member is married, spousal consent is required before payment can occur.
GROUP HEALTH INSURANCE AND MEDICARE
Commencing Jan. 1, 1974, the Board of Trustees may contract for group health insurance on the basis of part or all of the cost of the premium for the coverage to be paid by OP&F. Medical and prescription drug coverage sponsored by OP&F are not vested rights and are subject to change at any time upon action of the Board of Trustees.
Effective Jan. 1, 1977, OP&F is mandated to pay the premium for supplemental Medicare (Part B) up to the statutory maximum provided the benefit recipient is not eligible for reimbursement from any other sources. By law, OP&F is required to pay monthly to each recipient of service benefits, disability benefits and survivor benefits not less than $96.40, with the exception that OP&F cannot pay an amount that exceeds the amount paid by the recipient for the coverage. Once OP&F obtains the proper documentation from the service retiree, disability retiree or surviving beneficiary of their enrollment in the Medicare program, Medicare (Part B) premium payments begin. Note: This benefit is not included in the principal valuation results, but is included in the retiree health care valuation results.
Effective July 1992, retirees and survivors make monthly medical benefit contributions, which are credited to the Health Care Stabilization Fund. These contributions are reviewed on an annual basis to determine adequacy with the rising cost of health care. In 2004, a new contribution strategy was implemented. Retirees and survivors now pay a percentage of the full cost of the benefit. The percentage ranges from 25 percent to 100 percent for themselves and dependents based on the year of retirement.

AC TUARIAL SEC TION 2016 Comprehensive Annual Financial Report
Page 90 • OP&F
GAINS AND LOSSES AS OF JAN. 1, 2016
Type of Activity
Experience Gain (Loss) 2016
Plan Experience:
Turnover
If more liabilities are released by withdrawal separations from active membership than assumed, there is a gain. If smaller releases, there is a loss. $(1,786,735)
Retirement
If members retire at older ages than assumed, there is a gain. If younger, there is a loss. (4,939,352)
Death among retired members and beneficiaries
If more deaths occur than assumed, there is a gain. If fewer deaths than assumed, there is a loss. (16,176,502)
Disability Retirees
If disability claims are less than assumed, there is a gain. If more claims, there is a loss. 25,587,040
Salary increase/decrease
If there are smaller pay increases than assumed, there is a gain. If greater increases, there is a loss. 40,251,935
Return to work
If participants return to work with previous service restored, there is a loss. (1,215,348)
New Entrants
If new entrants join OP&F, there is a loss. (5,043,837)
Deaths among actives
If claims costs are less than assumed, there is a gain. If more claims costs, there is a loss. (2,396,203)
Investments
If there is a greater investment return than assumed, there is a gain. If less return, there is a loss. 81,193,240
Other Experience and Payroll Growth
If other experience, including less than expected payroll growth, increases the unfunded liability, there is a loss. Otherwise, there is a gain. (2,481,749)
NET GAIN (OR LOSS) DURING THE YEAR DUE TO PLAN EXPERIENCE $112,992,489
ANALYSIS OF FINANCIAL EXPERIENCE - PENSION TRUST FUND
SHORT-TERM SOLVENCY TESTA short-term solvency test is one means of checking a system’s progress under its funding program. In a short-term solvency test, the plan’s valuation assets are compared with: 1) Active member contributions on deposit; 2) The liabilities for future benefits to present retired lives; 3) The liabilities for service already rendered by active members. In a system that has been following the discipline of level percent of payroll financing, the
liabilities for active member contributions on deposit (liability 1) and the liabilities for future benefits to present retired lives (liability 2) will be fully covered by present assets (except in rare circumstances). In addition, the liabilities for service already rendered by active members (liability 3) will be partially covered by the remainder of present assets. Generally, if the system has been using level cost financing, the funding portion of liability 3 will increase over time. Liability 3 being fully funded is very rare.

AC TUARIAL SEC TION2016 Comprehensive Annual Financial Report
OP&F • Page 91
ACTIVE MEMBER VALUATION DATA - PENSION TRUST FUNDValuation as of Jan. 1
Number of Employers
Number of Active Members*
Average Annual Salary
Percentage of Average Annual Salary Increases
Annual Payroll
(Millions)
Police Fire Police Fire Police Fire Police Fire2016 527 388 14,846 12,778 $72,976 $74,229 4.2%** 4.2%** $2,060.9 2015 529 388 14,919 12,850 70,033 71,228 1.9% 1.6% 1,986.6 2014 532 386 14,841 12,764 68,724 70,087 0.8% 1.0% 1,942.3 2013 531 380 14,745 12,699 68,163 69,360 1.6% 1.0% 1,913.4 2012 537 380 14,854 12,769 67,094 68,663 2.2% 1.6% 1,897.4
2011 533 384 15,293 12,929 65,649 67,559 2.0% 2.0% 1,868.5
Valuation
(1) Active
Member
(2) Retirees
and
(3) Active Members
(Employer Valuation
Portion of Accrued Liabilities Covered by Valuation Assets
as of Jan. 1 Contributions Beneficiaries Financed Portion) Assets (1) (2) (3)
Police 2016 $1,386,649 $6,085,896 $3,002,889 $7,473,979 100% 100% -%Fire 2016 1,213,330 4,614,250 2,832,862 6,179,025 100% 100% 12%
Police 2015 1,210,400 5,857,146 3,015,390 7,141,575 100% 100% 2%Fire 2015 1,062,097 4,337,819 2,912,741 5,887,716 100% 100% 17%
Police 2014 1,171,496 5,368,637 2,583,711 6,088,816 100% 92% -%Fire 2014 1,028,465 3,924,388 2,501,058 4,974,383 100% 100% 1%
Police 2013 1,131,664 5,166,808 2,532,580 5,670,069 100% 88% -%Fire 2013 974,362 3,751,279 2,451,195 4,607,962 100% 97% -%
Police 2012 1,100,146 4,960,051 2,969,900 5,694,783 100% 93% -%Fire 2012 965,598 3,581,800 2,769,204 4,614,176 100% 100% 2%
Police 2011 1,100,251 4,368,659 3,008,219 5,885,449 100% 100% 14%Fire 2011 956,559 3,132,521 2,818,228 4,795,563 100% 100% 25%
* Includes rehired retirees. ** Beginning in 2016 salary includes an assumed 1.246 precent increase adjustment for anticipated late reported 2015 salaries that were not applied for prior years.
SHORT-TERM SOLVENCY TEST - PENSION TRUST FUND (DOLLARS IN THOUSANDS)
RETIREES AND BENEFICIARIES ADDED TO AND REMOVED FROM ROLLS - PENSION TRUST FUND (DOLLARS IN THOUSANDS)
Added to rolls Removed from rolls Rolls end of year
Year Ended Dec. 31 Number
Annual Allowances Number
Annual Allowances Number
Annual Allowances
Percentage Change in Allowance
Average Annual
Allowances
Percentage Change in
Membership
2015 1,450 $48,864 1,011 $22,141 28,402 $975,929 4.81% $34.36 1.57%
2014 1,261 41,378 859 17,204 27,963 931,176 4.59% 33.30 1.46%
2013 1,362 44,842 1,044 23,851 27,561 890,288 4.42% 32.30 1.17%
2012 1,390 48,249 1,225 19,469 27,243 852,602 5.58% 31.30 0.61%
2011 1,783 65,572 779 16,397 27,078 807,550 8.52% 29.82 3.85%
2010 1,165 34,553 803 15,721 26,074 744,144 4.74% 28.54 1.41%
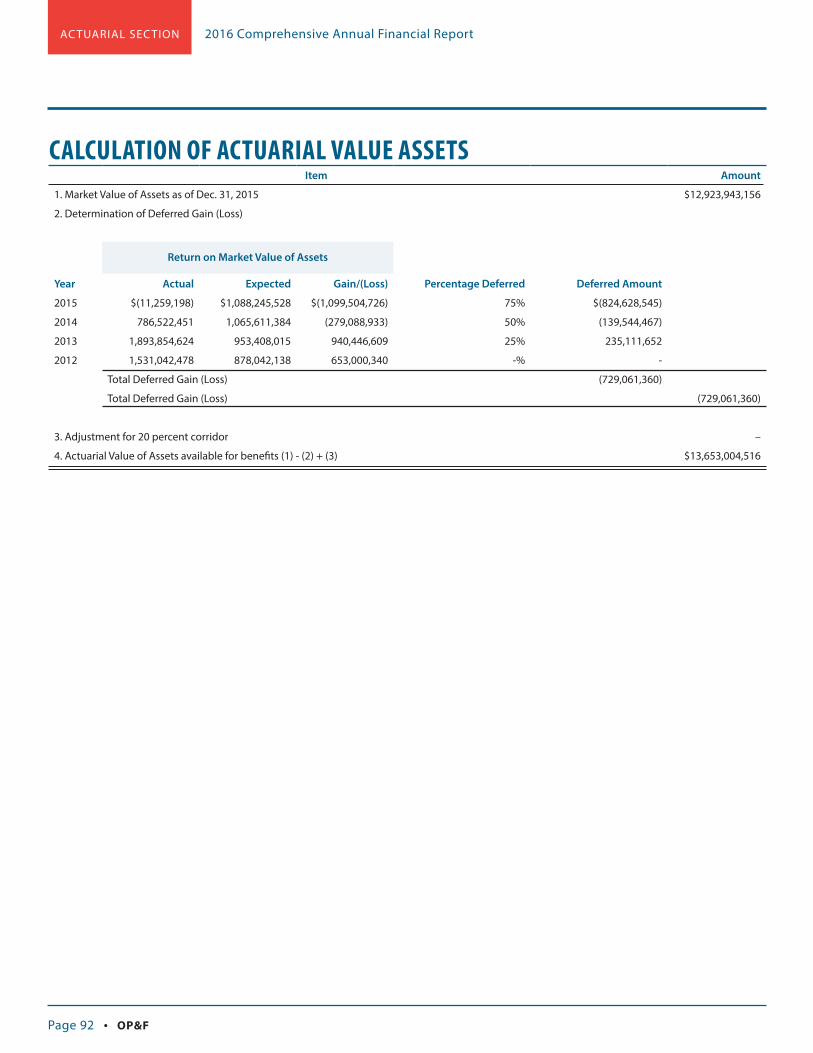
AC TUARIAL SEC TION 2016 Comprehensive Annual Financial Report
Page 92 • OP&F
CALCULATION OF ACTUARIAL VALUE ASSETSItem Amount
1. Market Value of Assets as of Dec. 31, 2015 $12,923,943,156
2. Determination of Deferred Gain (Loss)
Return on Market Value of Assets
Year Actual Expected Gain/(Loss) Percentage Deferred Deferred Amount
2015 $(11,259,198) $1,088,245,528 $(1,099,504,726) 75% $(824,628,545)
2014 786,522,451 1,065,611,384 (279,088,933) 50% (139,544,467)
2013 1,893,854,624 953,408,015 940,446,609 25% 235,111,652
2012 1,531,042,478 878,042,138 653,000,340 -% -
Total Deferred Gain (Loss) (729,061,360)
Total Deferred Gain (Loss) (729,061,360)
3. Adjustment for 20 percent corridor –
4. Actuarial Value of Assets available for benefits (1) - (2) + (3) $13,653,004,516
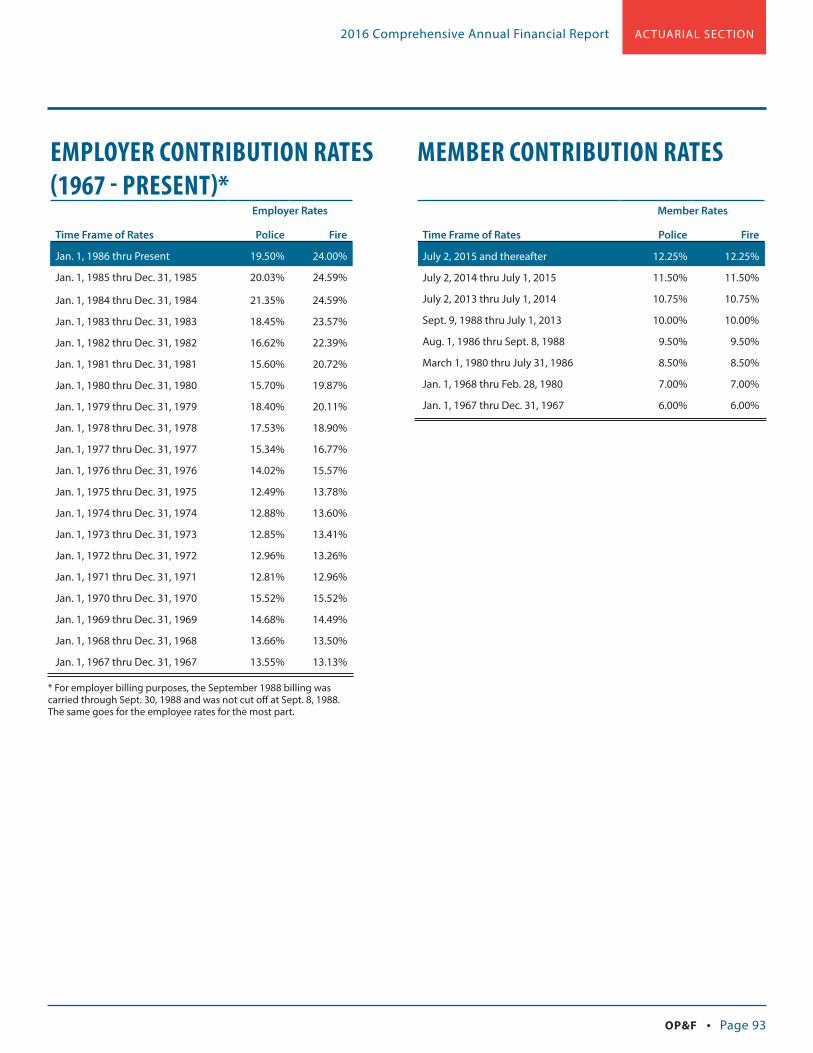
AC TUARIAL SEC TION2016 Comprehensive Annual Financial Report
OP&F • Page 93
EMPLOYER CONTRIBUTION RATES (1967 - PRESENT)*
Employer Rates
Time Frame of Rates Police Fire
Jan. 1, 1986 thru Present 19.50% 24.00%
Jan. 1, 1985 thru Dec. 31, 1985 20.03% 24.59%
Jan. 1, 1984 thru Dec. 31, 1984 21.35% 24.59%
Jan. 1, 1983 thru Dec. 31, 1983 18.45% 23.57%
Jan. 1, 1982 thru Dec. 31, 1982 16.62% 22.39%
Jan. 1, 1981 thru Dec. 31, 1981 15.60% 20.72%
Jan. 1, 1980 thru Dec. 31, 1980 15.70% 19.87%
Jan. 1, 1979 thru Dec. 31, 1979 18.40% 20.11%
Jan. 1, 1978 thru Dec. 31, 1978 17.53% 18.90%
Jan. 1, 1977 thru Dec. 31, 1977 15.34% 16.77%
Jan. 1, 1976 thru Dec. 31, 1976 14.02% 15.57%
Jan. 1, 1975 thru Dec. 31, 1975 12.49% 13.78%
Jan. 1, 1974 thru Dec. 31, 1974 12.88% 13.60%
Jan. 1, 1973 thru Dec. 31, 1973 12.85% 13.41%
Jan. 1, 1972 thru Dec. 31, 1972 12.96% 13.26%
Jan. 1, 1971 thru Dec. 31, 1971 12.81% 12.96%
Jan. 1, 1970 thru Dec. 31, 1970 15.52% 15.52%
Jan. 1, 1969 thru Dec. 31, 1969 14.68% 14.49%
Jan. 1, 1968 thru Dec. 31, 1968 13.66% 13.50%
Jan. 1, 1967 thru Dec. 31, 1967 13.55% 13.13%
MEMBER CONTRIBUTION RATES
Member Rates
Time Frame of Rates Police Fire
July 2, 2015 and thereafter 12.25% 12.25%
July 2, 2014 thru July 1, 2015 11.50% 11.50%
July 2, 2013 thru July 1, 2014 10.75% 10.75%
Sept. 9, 1988 thru July 1, 2013 10.00% 10.00%
Aug. 1, 1986 thru Sept. 8, 1988 9.50% 9.50%
March 1, 1980 thru July 31, 1986 8.50% 8.50%
Jan. 1, 1968 thru Feb. 28, 1980 7.00% 7.00%
Jan. 1, 1967 thru Dec. 31, 1967 6.00% 6.00%
* For employer billing purposes, the September 1988 billing was carried through Sept. 30, 1988 and was not cut off at Sept. 8, 1988. The same goes for the employee rates for the most part.

AC TUARIAL SEC TION 2016 Comprehensive Annual Financial Report
Page 94 • OP&F
SCHEDULE OF FUNDING PROGRESS FOR THE VALUATION YEAR ENDING JAN. 1, 2016
PENSION TRUST FUND (DOLLARS IN MILLIONS)*
Valuation Year Jan. 1
Valuation Assets*
Actuarial Accrued
Liabilities (AAL)
Unfunded Actuarial Accrued
Liabilities (UAAL)
Ratio of Assets to
AAL
Active Member
Payroll
UAAL as Percentage
of Active Member
Payroll
2016 $13,653.0 $19,135.9 $5,482.9 71.3% $2,060.9 266.1%
2015 13,029.3 18,395.6 5,366.3 70.8% 1,986.6 270.1%
2014 11,063.2 16,577.8 5,514.6 66.7% 1,942.3 283.9%
2013 10,278.0 16,007.9 5,729.9 64.2% 1,913.4 299.5%
2012 10,309.0 16,346.7 6,037.7 63.1% 1,897.4 318.2%
2011 10,681.0 15,384.4 4,703.4 69.4% 1,868.5 251.7%
RETIREE HEALTH CARE TRUST FUND (DOLLARS IN MILLIONS)
Valuation Year Jan. 1
Valuation Assets
Actuarial Accrued
Liabilities (AAL)
Unfunded Actuarial Accrued
Liabilities (UAAL)
Ratio of Assets to
AAL
Active Member
Payroll
UAAL as Percentage
of Active Member
Payroll
2016 $929.4 $5,166.6 $4,237.2 18.0% $2,060.9 205.6%
2015 1,031.9 5,399.6 4,367.7 19.1% 1,986.6 219.9%
2014 1,053.5 5,244.5 4,191.0 20.1% 1,942.3 215.8%
2013 935.6 4,234.8 3,299.2 22.1% 1,913.4 172.5%
2012 780.1 3,698.7 2,918.6 21.1% 1,897.4 153.8%
2011 717.7 3,295.3 2,577.6 21.8% 1,868.5 137.9%
* The amounts reported in this schedule do not include assets or liabilities for post-employment health care benefits.
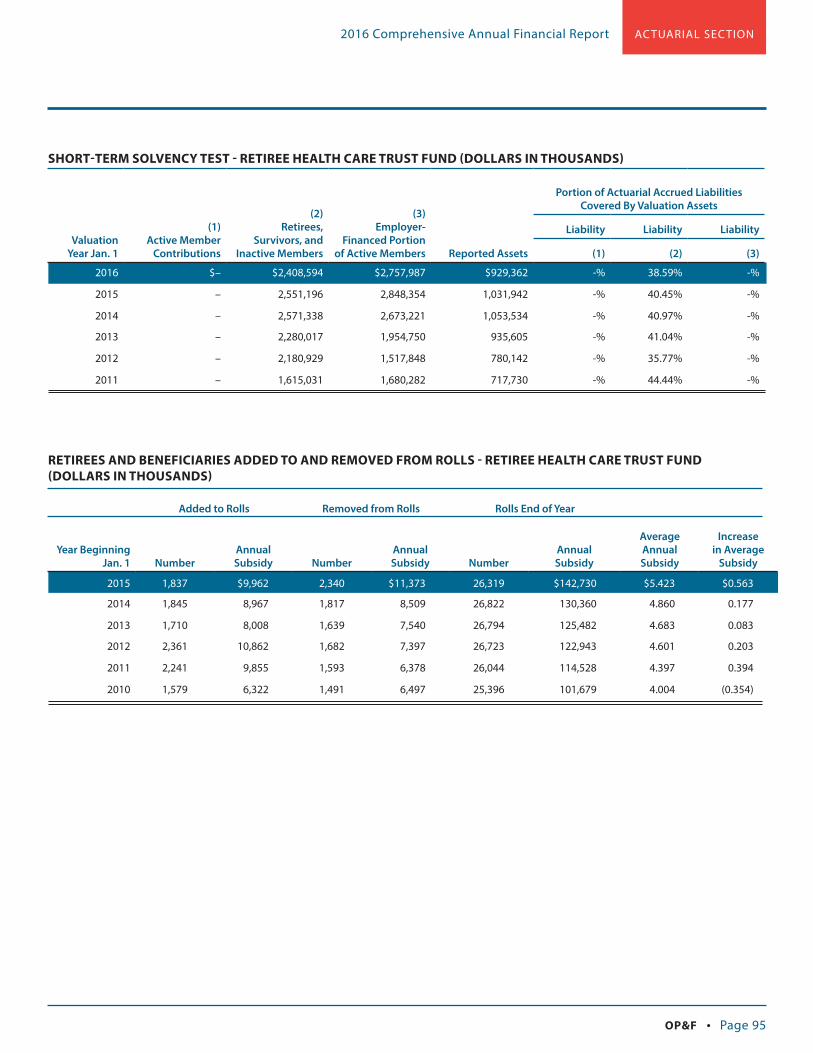
AC TUARIAL SEC TION2016 Comprehensive Annual Financial Report
OP&F • Page 95
SHORT-TERM SOLVENCY TEST - RETIREE HEALTH CARE TRUST FUND (DOLLARS IN THOUSANDS)
Valuation Year Jan. 1
(1) Active Member
Contributions
(2) Retirees,
Survivors, and Inactive Members
(3) Employer-
Financed Portion of Active Members Reported Assets
Portion of Actuarial Accrued Liabilities Covered By Valuation Assets
Liability Liability Liability
(1) (2) (3)
2016 $– $2,408,594 $2,757,987 $929,362 -% 38.59% -%
2015 – 2,551,196 2,848,354 1,031,942 -% 40.45% -%
2014 – 2,571,338 2,673,221 1,053,534 -% 40.97% -%
2013 – 2,280,017 1,954,750 935,605 -% 41.04% -%
2012 – 2,180,929 1,517,848 780,142 -% 35.77% -%
2011 – 1,615,031 1,680,282 717,730 -% 44.44% -%
RETIREES AND BENEFICIARIES ADDED TO AND REMOVED FROM ROLLS - RETIREE HEALTH CARE TRUST FUND (DOLLARS IN THOUSANDS)
Added to Rolls Removed from Rolls Rolls End of Year
Year Beginning Jan. 1 Number
Annual Subsidy Number
Annual Subsidy Number
Annual Subsidy
Average Annual Subsidy
Increase in Average
Subsidy
2015 1,837 $9,962 2,340 $11,373 26,319 $142,730 $5.423 $0.563
2014 1,845 8,967 1,817 8,509 26,822 130,360 4.860 0.177
2013 1,710 8,008 1,639 7,540 26,794 125,482 4.683 0.083
2012 2,361 10,862 1,682 7,397 26,723 122,943 4.601 0.203
2011 2,241 9,855 1,593 6,378 26,044 114,528 4.397 0.394
2010 1,579 6,322 1,491 6,497 25,396 101,679 4.004 (0.354)
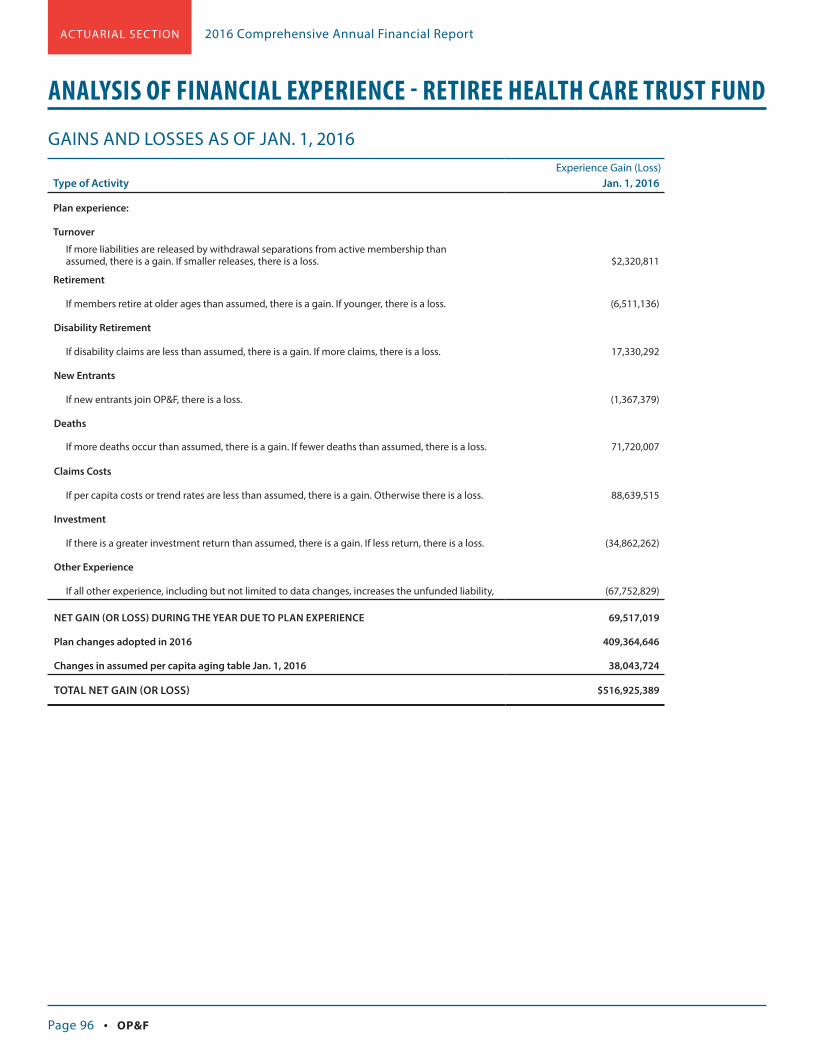
AC TUARIAL SEC TION 2016 Comprehensive Annual Financial Report
Page 96 • OP&F
GAINS AND LOSSES AS OF JAN. 1, 2016
Type of Activity Jan. 1, 2016
Plan experience:
Turnover
If more liabilities are released by withdrawal separations from active membership than assumed, there is a gain. If smaller releases, there is a loss. $2,320,811
Retirement
If members retire at older ages than assumed, there is a gain. If younger, there is a loss. (6,511,136)
Disability Retirement
If disability claims are less than assumed, there is a gain. If more claims, there is a loss. 17,330,292
New Entrants
If new entrants join OP&F, there is a loss. (1,367,379)
Deaths
If more deaths occur than assumed, there is a gain. If fewer deaths than assumed, there is a loss. 71,720,007
Claims Costs
If per capita costs or trend rates are less than assumed, there is a gain. Otherwise there is a loss. 88,639,515
Investment
If there is a greater investment return than assumed, there is a gain. If less return, there is a loss. (34,862,262)
Other Experience
If all other experience, including but not limited to data changes, increases the unfunded liability, (67,752,829)
NET GAIN (OR LOSS) DURING THE YEAR DUE TO PLAN EXPERIENCE 69,517,019
Plan changes adopted in 2016 409,364,646
Changes in assumed per capita aging table Jan. 1, 2016 38,043,724
TOTAL NET GAIN (OR LOSS) $516,925,389
Experience Gain (Loss)
ANALYSIS OF FINANCIAL EXPERIENCE - RETIREE HEALTH CARE TRUST FUND

2016
CO
MP
REH
ENSI
VE A
NN
UA
L FI
NA
NC
IAL
REP
OR
T | O
HIO
PO
LIC
E &
FIR
E P
ENSI
ON
FU
ND
STATISTICAL OBJECTIVES
FINANCIAL TRENDSChanges in Fiduciary Net Position
Revenues by Source
Expenses by Type
Benefit Expenses by Type
DROP Program Balances
REVENUE CAPACITY INFORMATIONActive Member and Total Payroll Base Statistics
Active Membership Data
Retired Membership by Type of Benefits
Retirees and Beneficiaries Statistics
Average Monthly Benefit Payments
Member Health Care Contributions
State of Ohio Subsidy Payments
Employer Contribution Rates
Member Contribution Rates
Health Care Allocation Rates from Employer Contributions
OP&F’s Cost of Living Allowance (COLA) History
Actuarial Interest Rates
DROP and Re-employed Interest Rates
DROP Member Count Roll Forward
Actuarial Valuation Information – Pension Trust Fund
Actuarial Valuation Information – Retiree Health Care Trust Fund
Historical Annual Investment Results
DEBT CAPACITY INFORMATION
DEMOGRAPHIC AND ECONOMIC INFORMATIONNumber of Employer Units
OPERATING INFORMATIONRetired Membership by Type of Benefits and Average Annual Allowance
Schedule of Average Benefits
Principal Participating Employers
OP&F Employee Budgeted Position Counts
Personnel Salaries by Year
OP&F Budget
Other Operating Statistics
Death Benefit Fund Economic Impact
LIST OF PROFESSIONAL ACRONYMS AND SYMBOLS

STATISTICAL SEC TION 2016 Comprehensive Annual Financial Report
Page 98 • OP&F
STATISTICAL OBJECTIVES
STATISTICAL OBJECTIVESThe objectives of the statistical section are to provide additional historical perspective, context and relevant details to assist readers in using information in the financial statements, notes to the financial statements and RSI in order to understand and assess OP&F’s overall financial condition. In support of these objectives, OP&F reports information in this section in compliance with GASB Statement 44, Economic Condition Reporting: The Statistical Section. This statement establishes standardized reporting requirements relative to the supplementary information provided in this section.
The schedules that follow show financial trend information about the growth of OP&F’s assets for the past 10 years. These schedules provide detailed information about the trends of key sources of additions and deductions to OP&F’s assets, which assist in providing a context framing how OP&F’s financial position has changed over time. The financial trend schedules presented are:
• Changes in Fiduciary Net Position.
• Revenues by Source.
• Expenses by Type.
• Benefit Expenses by Type.
• DROP Program Balances.
The schedules beginning on page 104 show revenue capacity information, demographic and economic information and operating information. The demographic and economic information is designed to assist in understanding the environment in which OP&F operates. The operating information is intended to provide contextual information about OP&F’s operations to assist in assessing OP&F’s economic condition. The revenue capacity information, the demographic and economic information and the operating information presented include:
• Active Member and Total Payroll Base Statistics.
• Active Membership Data.
• Retired Membership by Type of Benefits.
• Retirees and Beneficiaries Statistics.
• Average Monthly Benefit Payments.
• Member Health Care Contributions.
• State of Ohio Subsidy Payments.
• Employer Contribution Rates.
• Member Contribution Rates.
• Health Care Allocation Rates from Employer Contributions.
• OP&F’s Cost of Living Allowance (COLA) History.
• Actuarial Interest Rates.
• DROP and Reemployed Interest Rates.
• DROP Member Count Roll Forward.
• Actuarial Valuation Information – Pension Trust Fund.
• Actuarial Valuation Information – Retiree Health Care Trust Fund.
• Historical Annual Investment Results.
• Number of Employer Units.
• Retired Membership by type of Benefits and Average Annual Allowance.
• Schedule of Average Benefits.
• Principal Participating Employers.
• OP&F Employee Budgeted Position Counts.
• Personnel Salaries by Year.
• OP&F Budget.
• Other Operating Statistics.
• Death Benefit Fund.
• Economic Impact.
To help readers of this CAFR, OP&F has added a List of Professional Acronyms and Symbols at the end of the statistical section.

STATISTICAL SEC TION2016 Comprehensive Annual Financial Report
OP&F • Page 99
FINANCIAL TRENDS
CHANGES IN FIDUCIARY NET POSITIONCOMBINED TRUST FUND (DOLLARS IN MILLIONS)
2016 2015 2014 2013 2012 2011 2010 2009 2008 2007
Additions
Employer Contributions $465.4 $438.7 $427.8 $418.2 $417.0 $407.5 $414.0 $404.3 $405.9 $400.0
Member Contributions and Purchases 268.6 245.8 224.0 211.4 177.5 176.8 175.5 168.4 172.5 165.1
Investment Income 1,317.4 (10.0) 860.7 2,053.0 1,657.9 229.6 1,651.8 1,894.9 (3,832.9) 1,163.1
Health Care Contributions 73.2 71.2 70.0 66.6 65.1 62.5 58.9 59.1 57.0 56.0
Other Revenues 36.3 29.2 25.2 28.5 30.7 40.5 25.8 24.3 26.0 22.3
TOTAL ADDITIONS 2,160.9 774.9 1,607.7 2,777.7 2,348.2 916.9 2,326.0 2,551.0 (3,171.5) 1,806.5
Deductions
Benefit Payments 1,396.4 1,369.9 1,310.5 1,302.5 1,236.4 1,204.2 1,132.1 1,085.1 1,021.0 965.0
Refund of Member Contributions 14.2 13.8 15.2 16.0 26.5 22.0 15.8 15.7 17.7 15.1
Administrative and Other Expenses 19.6 16.3 16.2 15.9 15.4 15.4 15.1 16.3 16.0 16.3
TOTAL DEDUCTIONS 1,430.2 1,400.0 1,341.9 1,334.4 1,278.3 1,241.6 1,163.0 1,117.1 1,054.7 996.4
CHANGES IN FIDUCIARY NET POSITION 730.7 (625.1) 265.8 1,443.3 1,069.9 (324.7) 1,163.0 1,433.9 (4,226.2) 810.1
FIDUCIARY NET POSITION – BEGINNING OF YEAR 13,853.3 14,478.4* 14,219.6 12,776.3** 10,468.5 10,793.2 9,630.2 8,196.3 12,422.5 11,612.4
FIDUCIARY NET POSITION – END OF YEAR $14,584.0 $13,853.3 $14,485.4 $14,219.6 $11,538.4 $10,468.5 $10,793.2 $9,630.2 $8,196.3 $12,422.5
Reserve Fund Balances
Employers’ Contribution Reserves $1,155.8 $1,058.3 $2,701.1 $2,907.9 $873.8 $901.6 $1,515.9 $674.6 $(524.8) $3,998.7
Members’ Contribution Reserves 2,728.1 2,600.0 2,491.3 2,393.7 2,122.8 2,065.8 2,056.8 1,983.2 1,901.3 1,815.6
Health Care Contribution Reserves 901.6 929.4 1,031.9 1,053.5 935.6 780.1 717.7 573.4 438.7 527.0
Pension Reserves 9,798.5 9,265.6 8,261.1 7,864.5 7,606.2 6,721.0 6,502.8 6,399.0 6,381.1 6,081.2
TOTAL FIDUCIARY NET POSITION $14,584.0 $13,853.3 $14,485.4 $14,219.6 $11,538.4 $10,468.5 $10,793.2 $9,630.2 $8,196.3 $12,422.5
* Net Position was restated due to the implementation of GASB 68 during 2015.** Net Position was restated due to the implementation of GASB 67 during 2014.

STATISTICAL SEC TION 2016 Comprehensive Annual Financial Report
Page 100 • OP&F
CHANGES IN FIDUCIARY NET POSITIONPENSION TRUST FUND (DOLLARS IN MILLIONS)
2016 2015 2014 2013 2012 2011 2010 2009 2008 2007
Additions
Employer Contributions $454.7 $428.5 $418.0 $349.5 $286.7 $278.2 $285.2 $277.7 $276.4 $278.3
Member Contributions and Purchases
268.6 245.8 224.0 211.4 177.5 176.8 175.5 168.4 172.5 165.1
Investment Income 1,232.6 (16.7) 779.8 1,893.9 1,531.0 210.6 1,551.3 1,791.3 (3,697.1) 1,113.1
Health Care Contributions - - - - - - - - - -
Other Revenues 8.4 5.9 7.2 12.9 9.5 11.9 9.1 9.5 10.7 8.7
TOTAL ADDITIONS 1,964.3 663.5 1,429.0 2,467.7 2,004.7 677.5 2,021.1 2,246.9 (3,237.5) 1,565.2
Deductions
Benefit Payments 1,172.8 1,156.7 1,110.9 1,111.2 1,049.0 1,027.9 972.2 916.4 867.6 815.8
Refund of Member Contributions 14.2 13.8 15.2 16.0 26.5 22.0 15.8 15.7 17.7 15.1
Administrative and Other Expenses 18.8 15.6 15.5 15.1 14.8 14.7 14.4 15.6 15.1 14.6
TOTAL DEDUCTIONS 1,205.8 1,186.1 1,141.6 1,142.3 1,090.3 1,064.6 1,002.4 947.7 900.4 845.5
CHANGES IN FIDUCIARY NET POSITION 758.5 (522.6) 287.4 1,325.4 914.4 (387.1) 1,018.7 1,299.2 (4,137.9) 719.7
FIDUCIARY NET POSITION – BEGINNING OF YEAR 12,923.9 13,446.5* 13,166.1 11,840.7** 9,688.4 10,075.5 9,056.8 7,757.6 11,895.5 11,175.8
FIDUCIARY NET POSITION – END OF YEAR $13,682.4 $12,923.9 $13,453.5 $13,166.1 $10,602.8 $9,688.4 $10,075.5 $9,056.8 $7,757.6 $11,895.5
Reserve Fund Balances:
Employers’ Contribution Reserves $1,155.8 $1,058.3 $2,701.1 $2,907.9 $873.8 $901.6 $1,515.9 $674.6 $(524.8) $3,998.7
Members’ Contribution Reserves 2,728.1 2,600.0 2,491.3 2,393.7 2,122.8 2,065.8 2,056.8 1,983.2 1,901.3 1,815.6
Pension Reserves 9,798.5 9,265.6 8,261.1 7,864.5 7,606.2 6,721.0 6,502.8 6,399.0 6,381.1 6,081.2
TOTAL FIDUCIARY NET POSITION $13,682.4 $12,923.9 $13,453.5 $13,166.1 $10,602.8 $9,688.4 $10,075.5 $9,056.8 $7,757.6 $11,895.5
* Net Position was restated due to the implementation of GASB 68 during 2015.** Net Position was restated due to the implementation of GASB 67 during 2014.

STATISTICAL SEC TION2016 Comprehensive Annual Financial Report
OP&F • Page 101
CHANGES IN FIDUCIARY NET POSITIONRETIREE HEALTH CARE TRUST FUND (DOLLARS IN MILLIONS)
2016 2015 2014 2013 2012 2011 2010 2009 2008 2007
Additions
Employer Contributions $10.7 $10.2 $9.8 $68.7 $130.3 $129.3 $128.8 $126.6 $129.5 $121.7
Member Contributions and Purchases - - - - - - - - - -
Investment Income 84.8 6.7 80.9 159.1 126.9 19.0 100.5 103.6 (135.8) 50.0
Health Care Contributions 73.2 71.2 70.0 66.6 65.1 62.5 58.9 59.1 57.0 56.0
Other Revenues 27.9 23.3 18.0 15.6 21.2 28.6 16.7 14.8 15.3 13.6
TOTAL ADDITIONS 196.6 111.4 178.7 310.0 343.5 239.4 304.9 304.1 66.0 241.3
Deductions
Benefit Payments 223.6 213.2 199.6 191.3 187.4 176.3 159.9 168.7 153.4 149.2
Refund of Member Contributions - - - - - - - - - -
Administrative and Other Expenses 0.8 0.7 0.7 0.8 0.6 0.7 0.7 0.7 0.9 1.7
TOTAL DEDUCTIONS 224.4 213.9 200.3 192.1 188.0 177.0 160.6 169.4 154.3 150.9
CHANGES IN FIDUCIARY NET POSITION (27.8) (102.5) (21.6) 117.9 155.5 62.4 144.3 134.7 (88.3) 90.4
FIDUCIARY NET POSITION – BEGINNING OF YEAR 929.4 1,031.9 1,053.5 935.6 780.1 717.7 573.4 438.7 527.0 436.6
FIDUCIARY NET POSITION – END OF YEAR $901.6 $929.4 $1,031.9 $1,053.5 $935.6 $780.1 $717.7 $573.4 $438.7 $527.0
Reserve Fund Balances
Health Care Contribution Reserves $901.6 $929.4 $1,031.9 $1,053.5 $935.6 $780.1 $717.7 $573.4 $438.7 $527.0
TOTAL FIDUCIARY NET POSITION $901.6 $929.4 $1,031.9 $1,053.5 $935.6 $780.1 $717.7 $573.4 $438.7 $527.0
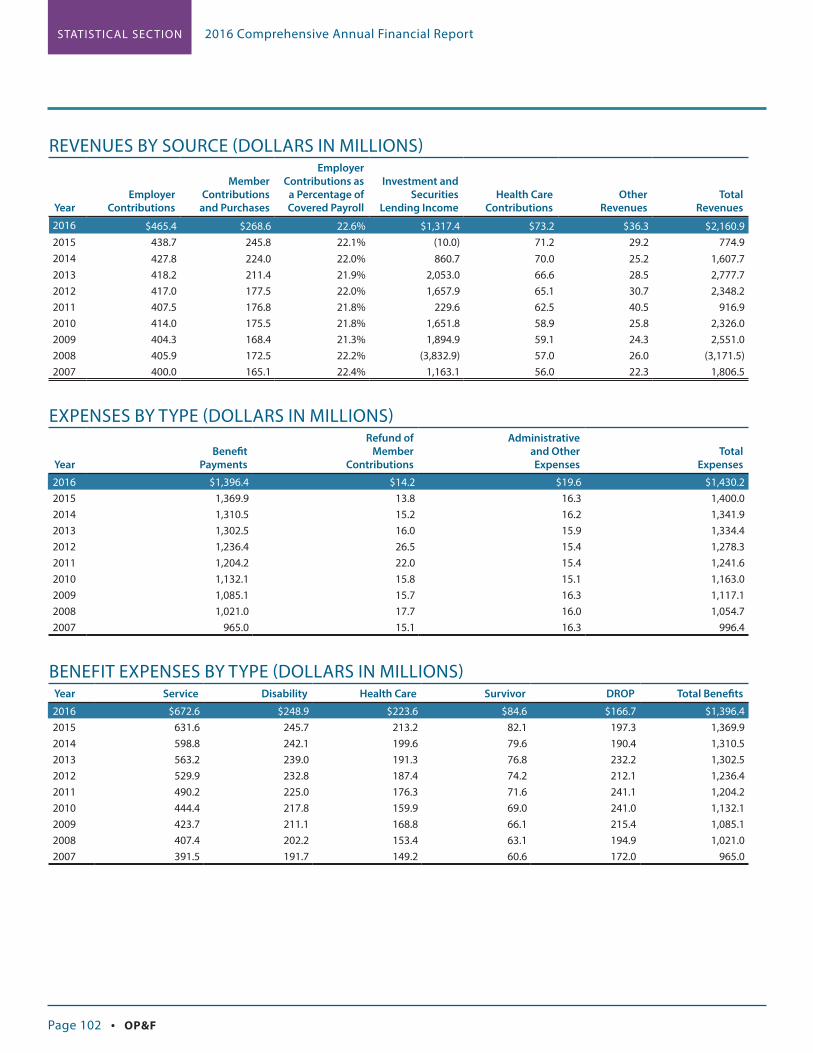
STATISTICAL SEC TION 2016 Comprehensive Annual Financial Report
Page 102 • OP&F
REVENUES BY SOURCE (DOLLARS IN MILLIONS)
YearEmployer
Contributions
Member Contributions
and Purchases
Employer Contributions as
a Percentage of Covered Payroll
Investment and Securities
Lending IncomeHealth Care
ContributionsOther
RevenuesTotal
Revenues
2016 $465.4 $268.6 22.6% $1,317.4 $73.2 $36.3 $2,160.92015 438.7 245.8 22.1% (10.0) 71.2 29.2 774.9 2014 427.8 224.0 22.0% 860.7 70.0 25.2 1,607.7 2013 418.2 211.4 21.9% 2,053.0 66.6 28.5 2,777.7 2012 417.0 177.5 22.0% 1,657.9 65.1 30.7 2,348.2 2011 407.5 176.8 21.8% 229.6 62.5 40.5 916.9 2010 414.0 175.5 21.8% 1,651.8 58.9 25.8 2,326.0 2009 404.3 168.4 21.3% 1,894.9 59.1 24.3 2,551.0 2008 405.9 172.5 22.2% (3,832.9) 57.0 26.0 (3,171.5)2007 400.0 165.1 22.4% 1,163.1 56.0 22.3 1,806.5
EXPENSES BY TYPE (DOLLARS IN MILLIONS)
YearBenefit
Payments
Refund of Member
Contributions
Administrative and Other Expenses
Total Expenses
2016 $1,396.4 $14.2 $19.6 $1,430.22015 1,369.9 13.8 16.3 1,400.02014 1,310.5 15.2 16.2 1,341.92013 1,302.5 16.0 15.9 1,334.42012 1,236.4 26.5 15.4 1,278.32011 1,204.2 22.0 15.4 1,241.62010 1,132.1 15.8 15.1 1,163.02009 1,085.1 15.7 16.3 1,117.12008 1,021.0 17.7 16.0 1,054.72007 965.0 15.1 16.3 996.4
BENEFIT EXPENSES BY TYPE (DOLLARS IN MILLIONS)Year Service Disability Health Care Survivor DROP Total Benefits
2016 $672.6 $248.9 $223.6 $84.6 $166.7 $1,396.4 2015 631.6 245.7 213.2 82.1 197.3 1,369.9 2014 598.8 242.1 199.6 79.6 190.4 1,310.5 2013 563.2 239.0 191.3 76.8 232.2 1,302.5 2012 529.9 232.8 187.4 74.2 212.1 1,236.4 2011 490.2 225.0 176.3 71.6 241.1 1,204.2 2010 444.4 217.8 159.9 69.0 241.0 1,132.1 2009 423.7 211.1 168.8 66.1 215.4 1,085.1 2008 407.4 202.2 153.4 63.1 194.9 1,021.0 2007 391.5 191.7 149.2 60.6 172.0 965.0

STATISTICAL SEC TION2016 Comprehensive Annual Financial Report
OP&F • Page 103
DROP PROGRAM BALANCES (DOLLARS IN MILLIONS)2016 2015 2014 2013 2012 2011 2010 2009 2008 2007
Police
DROP Program Beginning Balance $721.9 $687.8 $661.0 $666.5 $694.7 $650.8 $544.9 $436.9 $337.8 $246.8
Accrued Pension and COLA 108.2 103.0 97.6 95.4 90.7 92.3 98.3 92.4 86.4 80.3
Accrued Member Share Contributions 18.7 15.2 12.3 11.9 11.3 11.7 12.5 13.0 11.8 12.1
Accrued Interest 13.8 14.6 15.1 14.2 17.8 32.2 29.2 23.9 18.7 14.2
Withdrawals (92.0) (98.7) (98.2) (127.0) (148.0) (92.3) (34.1) (21.3) (17.8) (15.6)
DROP PROGRAM ENDING BALANCE - POLICE 770.6 721.9 687.8 661.0 666.5 694.7 650.8 544.9 436.9 337.8
Fire
DROP Program Beginning Balance 641.0 616.4 584.6 571.4 593.1 536.2 441.4 344.5 257.3 180.0
Accrued Pension and COLA 101.3 101.3 97.8 94.0 88.4 89.3 89.6 80.0 75.0 66.9
Accrued Member Share Contributions 17.2 14.9 12.9 12.0 11.0 11.2 11.2 11.3 10.0 9.5
Accrued Interest 12.2 13.1 13.3 12.4 15.2 27.3 23.8 19.2 14.7 10.6
Withdrawals (79.5) (104.7) (92.2) (105.2) (136.3) (70.9) (29.8) (13.6) (12.5) (9.7)
DROP PROGRAM ENDING BALANCE - FIRE 692.2 641.0 616.4 584.6 571.4 593.1 536.2 441.4 344.5 257.3
Combined Police and Fire
DROP Program Beginning Balance 1,362.9 1,304.2 1,245.6 1,237.9 1,287.8 1,187.0 986.3 781.4 595.1 426.8
Accrued Pension and COLA 209.5 204.3 195.4 189.4 179.1 181.6 187.9 172.4 161.4 147.2
Accrued Member Share Contributions 35.9 30.1 25.2 23.9 22.3 22.9 23.7 24.3 21.8 21.6
Accrued Interest 26.0 27.7 28.4 26.6 33.0 59.5 53.0 43.1 33.4 24.8
Withdrawals and Adjustments (171.5) (203.4) (190.4) (232.2) (284.3) (163.2) (63.9) (34.9) (30.3) (25.3)
DROP PROGRAM ENDING BALANCE $1,462.8 $1,362.9 $1,304.2 $1,245.6 $1,237.9 $1,287.8 $1,187.0 $986.3 $781.4 $595.1

STATISTICAL SEC TION 2016 Comprehensive Annual Financial Report
Page 104 • OP&F
REVENUE CAPACITY INFORMATION
ACTIVE MEMBER AND TOTAL PAYROLL BASE STATISTICS (DOLLARS IN MILLIONS)10-YEAR HISTORY OF MEMBERSHIP DATA*
Year Payroll BaseMember
ContributionsNumber of Members*
Percentage Change in
Payroll Base
Percentage Change in Member
Contributions
Percentage Change in Members
2016 $2,060.9 $268.6 27,624 3.7% 9.3% (0.5)%
2015 1,986.6 245.8 27,769 2.3% 9.7% 0.6%
2014 1,942.3 224.0 27,605 1.5% 6.0% 0.6%
2013 1,913.4 211.4 27,444 0.8% 19.1% (0.6)%
2012 1,897.4 177.5 27,623 1.5% 0.4% (2.1)%
2011 1,868.5 176.8 28,222 (1.4)% 0.7% (1.4)%
2010 1,895.2 175.5 28,619 (0.3)% 4.2% (1.5)%
2009 1,900.9 168.4 29,062 3.8% (2.4)% 0.7%
2008 1,831.4 172.5 28,864 2.7% 4.5% 0.9%
2007 1,782.9 165.1 28,609 1.5% (1.4)% 2.1%
* Includes rehired retirees.
ACTIVE MEMBERSHIP DATA NUMBER AND ALLOWABLE AVERAGE ANNUAL SALARY AS OF JAN. 1, 2016*
Years of Service
Age 0-4 5-9 10-14 15-19 20-24 25-29 30-34 35-39 40+ Total
Under 25 612 612
$49,201 $49,201
25-29 2,278 305 2,583
$55,503 $70,853 $57,315
30-34 1,564 1,620 390 3 3,577
$57,659 $71,681 $75,801 $81,826 $66,008
35-39 673 1,028 1,497 659 2 3,859
$56,683 $71,193 $76,475 $78,846 $82,889 $72,024
40-44 214 445 1,093 2,335 688 10 4,785
$54,201 $69,792 $74,157 $78,316 $83,418 $81,512 $76,235
45-49 90 193 532 1,535 2,206 858 17 5,431
$53,318 $66,725 $72,151 $76,310 $82,541 $86,197 $85,074 $79,301
50-54 35 61 180 488 1,096 1,690 517 12 4,079
$58,469 $65,133 $69,963 $76,276 $79,288 $84,463 $86,789 $89,696 $81,251
55-59 19 24 60 153 360 616 587 78 3 1,900
$45,276 $62,987 $66,644 $74,047 $76,427 $80,130 $85,600 $89,379 $73,360 $80,006
60-64 9 11 16 37 101 154 157 42 9 536
$60,837 $52,550 $72,877 $71,538 $72,406 $77,119 $82,186 $88,607 $84,863 $77,456
Over 64 2 3 7 6 14 20 14 6 12 84
$52,856 $72,970 $71,261 $62,983 $70,907 $71,008 $76,118 $78,999 $88,339 $73,975
TOTAL 5,496 3,690 3,775 5,216 4,467 3,348 1,292 138 24 27,446
$55,464 $70,769 $74,633 $77,413 $81,120 $83,683 $85,551 $88,721 $85,163 $73,557
* Excludes rehired retirees.

STATISTICAL SEC TION2016 Comprehensive Annual Financial Report
OP&F • Page 105
RETIRED MEMBERSHIP BY TYPE OF BENEFITS (SOURCE: ACTUARIAL VALUATION)Service Survivors Disability Total
Year Police Fire Police Fire Police Fire Beneficiaries
2016 8,048 6,207 4,424 3,406 3,754 2,563 28,402
2015 7,842 5,972 4,403 3,386 3,784 2,576 27,963
2014 7,623 5,784 4,395 3,351 3,820 2,588 27,561
2013 7,459 5,683 4,352 3,321 3,834 2,594 27,243
2012 7,204 5,540 4,543 3,389 3,825 2,577 27,078
2011 6,762 5,185 4,479 3,310 3,772 2,566 26,074
2010 6,619 5,108 4,416 3,268 3,762 2,539 25,712
2009 6,546 5,060 4,300 3,194 3,721 2,496 25,317
2008 6,523 5,036 4,090 3,077 3,682 2,470 24,878
2007 6,459 5,012 4,067 3,115 3,594 2,436 24,683
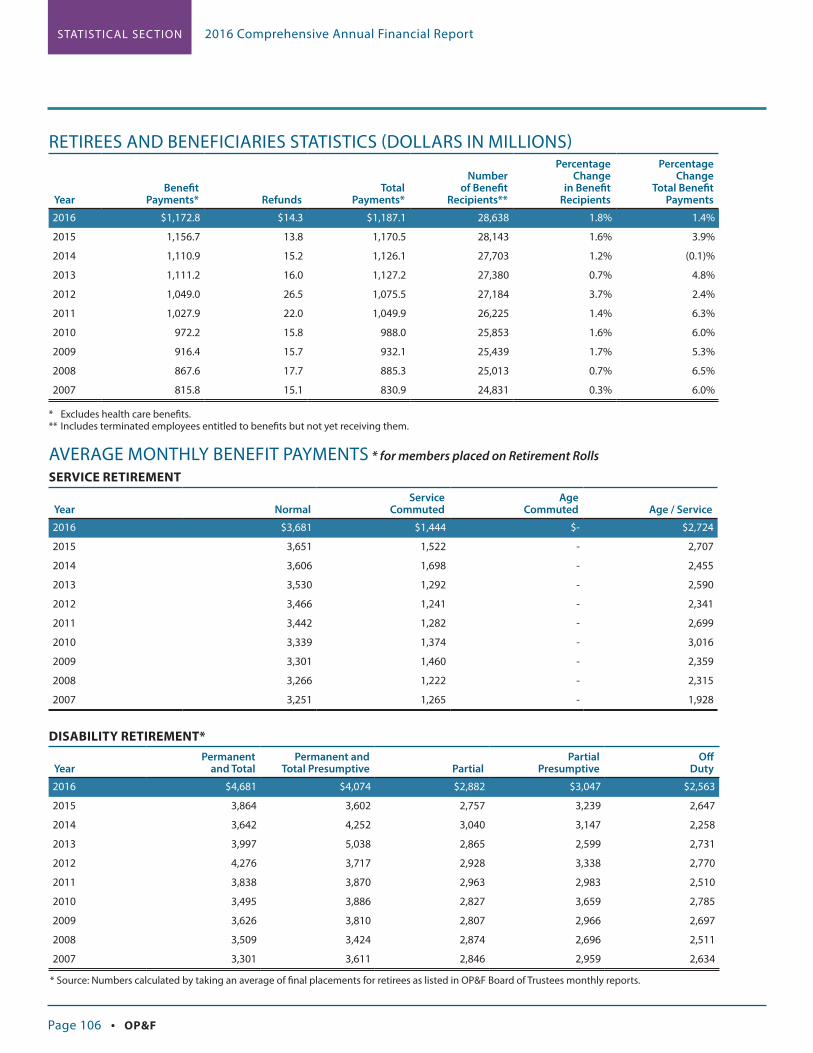
STATISTICAL SEC TION 2016 Comprehensive Annual Financial Report
Page 106 • OP&F
RETIREES AND BENEFICIARIES STATISTICS (DOLLARS IN MILLIONS)
YearBenefit
Payments* RefundsTotal
Payments*
Number of Benefit
Recipients**
Percentage Change
in Benefit Recipients
Percentage Change
Total Benefit Payments
2016 $1,172.8 $14.3 $1,187.1 28,638 1.8% 1.4%
2015 1,156.7 13.8 1,170.5 28,143 1.6% 3.9%
2014 1,110.9 15.2 1,126.1 27,703 1.2% (0.1)%
2013 1,111.2 16.0 1,127.2 27,380 0.7% 4.8%
2012 1,049.0 26.5 1,075.5 27,184 3.7% 2.4%
2011 1,027.9 22.0 1,049.9 26,225 1.4% 6.3%
2010 972.2 15.8 988.0 25,853 1.6% 6.0%
2009 916.4 15.7 932.1 25,439 1.7% 5.3%
2008 867.6 17.7 885.3 25,013 0.7% 6.5%
2007 815.8 15.1 830.9 24,831 0.3% 6.0%
* Excludes health care benefits.** Includes terminated employees entitled to benefits but not yet receiving them.
AVERAGE MONTHLY BENEFIT PAYMENTS * for members placed on Retirement Rolls
SERVICE RETIREMENT
Year NormalService
CommutedAge
Commuted Age / Service
2016 $3,681 $1,444 $- $2,724
2015 3,651 1,522 - 2,707
2014 3,606 1,698 - 2,455
2013 3,530 1,292 - 2,590
2012 3,466 1,241 - 2,341
2011 3,442 1,282 - 2,699
2010 3,339 1,374 - 3,016
2009 3,301 1,460 - 2,359
2008 3,266 1,222 - 2,315
2007 3,251 1,265 - 1,928 DISABILITY RETIREMENT*
YearPermanent
and TotalPermanent and
Total Presumptive PartialPartial
PresumptiveOff
Duty
2016 $4,681 $4,074 $2,882 $3,047 $2,563
2015 3,864 3,602 2,757 3,239 2,647
2014 3,642 4,252 3,040 3,147 2,258
2013 3,997 5,038 2,865 2,599 2,731
2012 4,276 3,717 2,928 3,338 2,770
2011 3,838 3,870 2,963 2,983 2,510
2010 3,495 3,886 2,827 3,659 2,785
2009 3,626 3,810 2,807 2,966 2,697
2008 3,509 3,424 2,874 2,696 2,511
2007 3,301 3,611 2,846 2,959 2,634
* Source: Numbers calculated by taking an average of final placements for retirees as listed in OP&F Board of Trustees monthly reports.
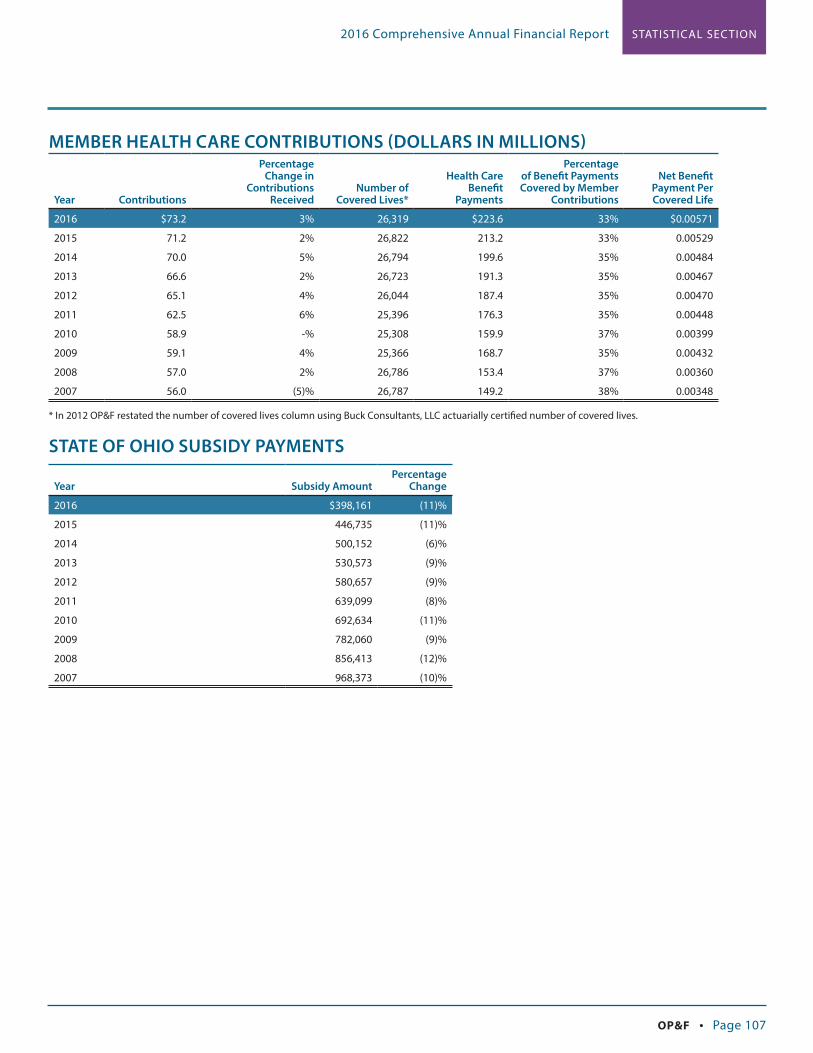
STATISTICAL SEC TION2016 Comprehensive Annual Financial Report
OP&F • Page 107
MEMBER HEALTH CARE CONTRIBUTIONS (DOLLARS IN MILLIONS)
Year Contributions
Percentage Change in
Contributions Received
Number of Covered Lives*
Health Care Benefit
Payments
Percentage of Benefit Payments Covered by Member
Contributions
Net Benefit Payment Per Covered Life
2016 $73.2 3% 26,319 $223.6 33% $0.00571
2015 71.2 2% 26,822 213.2 33% 0.00529
2014 70.0 5% 26,794 199.6 35% 0.00484
2013 66.6 2% 26,723 191.3 35% 0.00467
2012 65.1 4% 26,044 187.4 35% 0.00470
2011 62.5 6% 25,396 176.3 35% 0.00448
2010 58.9 -% 25,308 159.9 37% 0.00399
2009 59.1 4% 25,366 168.7 35% 0.00432
2008 57.0 2% 26,786 153.4 37% 0.00360
2007 56.0 (5)% 26,787 149.2 38% 0.00348
* In 2012 OP&F restated the number of covered lives column using Buck Consultants, LLC actuarially certified number of covered lives.
STATE OF OHIO SUBSIDY PAYMENTS
Year Subsidy AmountPercentage
Change
2016 $398,161 (11)%
2015 446,735 (11)%
2014 500,152 (6)%
2013 530,573 (9)%
2012 580,657 (9)%
2011 639,099 (8)%
2010 692,634 (11)%
2009 782,060 (9)%
2008 856,413 (12)%
2007 968,373 (10)%
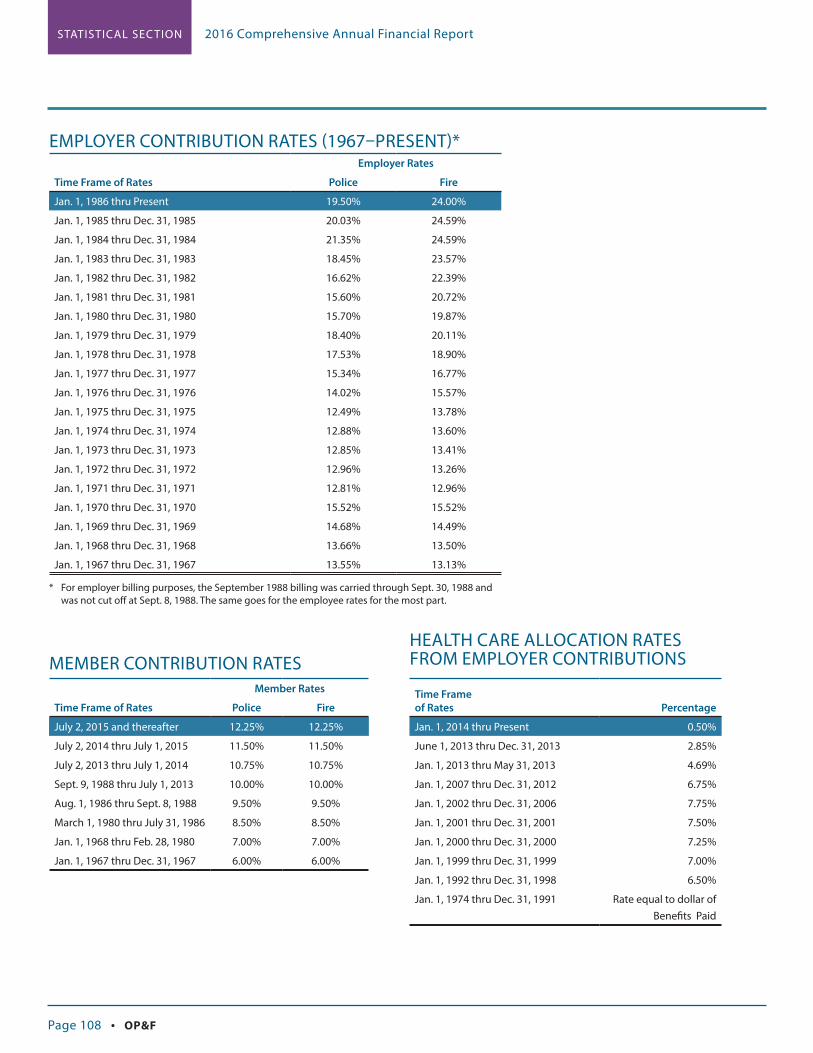
STATISTICAL SEC TION 2016 Comprehensive Annual Financial Report
Page 108 • OP&F
EMPLOYER CONTRIBUTION RATES (1967–PRESENT)*Employer Rates
Time Frame of Rates Police Fire
Jan. 1, 1986 thru Present 19.50% 24.00%
Jan. 1, 1985 thru Dec. 31, 1985 20.03% 24.59%
Jan. 1, 1984 thru Dec. 31, 1984 21.35% 24.59%
Jan. 1, 1983 thru Dec. 31, 1983 18.45% 23.57%
Jan. 1, 1982 thru Dec. 31, 1982 16.62% 22.39%
Jan. 1, 1981 thru Dec. 31, 1981 15.60% 20.72%
Jan. 1, 1980 thru Dec. 31, 1980 15.70% 19.87%
Jan. 1, 1979 thru Dec. 31, 1979 18.40% 20.11%
Jan. 1, 1978 thru Dec. 31, 1978 17.53% 18.90%
Jan. 1, 1977 thru Dec. 31, 1977 15.34% 16.77%
Jan. 1, 1976 thru Dec. 31, 1976 14.02% 15.57%
Jan. 1, 1975 thru Dec. 31, 1975 12.49% 13.78%
Jan. 1, 1974 thru Dec. 31, 1974 12.88% 13.60%
Jan. 1, 1973 thru Dec. 31, 1973 12.85% 13.41%
Jan. 1, 1972 thru Dec. 31, 1972 12.96% 13.26%
Jan. 1, 1971 thru Dec. 31, 1971 12.81% 12.96%
Jan. 1, 1970 thru Dec. 31, 1970 15.52% 15.52%
Jan. 1, 1969 thru Dec. 31, 1969 14.68% 14.49%
Jan. 1, 1968 thru Dec. 31, 1968 13.66% 13.50%
Jan. 1, 1967 thru Dec. 31, 1967 13.55% 13.13%
* For employer billing purposes, the September 1988 billing was carried through Sept. 30, 1988 and was not cut off at Sept. 8, 1988. The same goes for the employee rates for the most part.
Time Frame of Rates
Percentage
Jan. 1, 2014 thru Present 0.50%
June 1, 2013 thru Dec. 31, 2013 2.85%
Jan. 1, 2013 thru May 31, 2013 4.69%
Jan. 1, 2007 thru Dec. 31, 2012 6.75%
Jan. 1, 2002 thru Dec. 31, 2006 7.75%
Jan. 1, 2001 thru Dec. 31, 2001 7.50%
Jan. 1, 2000 thru Dec. 31, 2000 7.25%
Jan. 1, 1999 thru Dec. 31, 1999 7.00%
Jan. 1, 1992 thru Dec. 31, 1998 6.50%
Jan. 1, 1974 thru Dec. 31, 1991 Rate equal to dollar of Benefits Paid
HEALTH CARE ALLOCATION RATES FROM EMPLOYER CONTRIBUTIONS
Member Rates
Time Frame of Rates Police Fire
July 2, 2015 and thereafter 12.25% 12.25%
July 2, 2014 thru July 1, 2015 11.50% 11.50%
July 2, 2013 thru July 1, 2014 10.75% 10.75%
Sept. 9, 1988 thru July 1, 2013 10.00% 10.00%
Aug. 1, 1986 thru Sept. 8, 1988 9.50% 9.50%
March 1, 1980 thru July 31, 1986 8.50% 8.50%
Jan. 1, 1968 thru Feb. 28, 1980 7.00% 7.00%
Jan. 1, 1967 thru Dec. 31, 1967 6.00% 6.00%
MEMBER CONTRIBUTION RATES

STATISTICAL SEC TION2016 Comprehensive Annual Financial Report
OP&F • Page 109
OP&F’S COST OF LIVING ALLOWANCE (COLA) HISTORY - PART 1 OF 2
COLA Payment Dates
Members who are 55 years old
with less than 15 years of service
credit as of July 1, 2013
and have been receiving
Benefits for at least one year
COLA Paid
Members who are 55 years old with 15 or more years of service
credit as of July 1, 2013
and have been receiving
Benefits for at least one year
COLA Paid
EDOR* July 1, 2000
to June 30,2012
COLA Paid
EDOR* July 1, 1999
to June 30,2000
COLA Paid
EDOR* July 1, 1998
to June 30,1999
COLA Paid
EDOR* July 1, 1997
to June 30,1998
COLA Paid
EDOR* July 1, 1996
to June 30,1997
COLA Paid
Nov. 1, 2016 - Oct. 31, 2017 1.20% 3.00% 3.00% 3.00% 3.00% 3.00% 3.00%
Nov. 1, 2015 - Oct. 31, 2016 -% 3.00% 3.00% 3.00% 3.00% 3.00% 3.00%
Nov. 1, 2014 - Oct. 31, 2015 1.70% 3.00% 3.00% 3.00% 3.00% 3.00% 3.00%
Nov. 1, 2013 - Oct. 31, 2014 1.20% 3.00% 3.00% 3.00% 3.00% 3.00% 3.00%
July 1, 2013 - Oct. 31, 2013 2.00% 3.00% 3.00% 3.00% 3.00% 3.00% 3.00%
July 1, 2012 - June 30, 2013 3.00% 3.00% 3.00% 3.00% 3.00%
July 1, 2011 - June 30, 2012 3.00% 3.00% 3.00% 3.00% 3.00%
July 1, 2010 - June 30, 2011 3.00% 3.00% 3.00% 3.00% 3.00%
July 1, 2009 - June 30, 2010 3.00% 3.00% 3.00% 3.00% 3.00%
July 1, 2008 - June 30, 2009 3.00% 3.00% 3.00% 3.00% 3.00%
July 1, 2007 - June 30, 2008 3.00% 3.00% 3.00% 3.00% 3.00%
July 1, 2006 - June 30, 2007 3.00% 3.00% 3.00% 3.00% 3.00%
July 1, 2005 - June 30, 2006 3.00% 3.00% 3.00% 3.00% 3.00%
July 1, 2004 - June 30, 2005 3.00% 3.00% 3.00% 3.00% 3.00%
July 1, 2003 - June 30, 2004 3.00% 3.00% 3.00% 3.00% 3.00%
July 1, 2002 - June 30, 2003 3.00% 3.00% 3.00% 3.00% 3.00%
July 1, 2001 - June 30, 2002 3.00% 3.00% 3.00% 3.00% 3.00%
July 1, 2000 - June 30, 2001 2.20% 2.20% 2.20% 2.20%
July 1, 1999 - June 30, 2000 1.30% 1.30% 1.30%
July 1, 1998 - June 30, 1999 2.30% 2.30%
July 1, 1997 - June 30, 1998 2.90%
July 1, 1996 - June 30, 1997
July 1, 1995 - June 30, 1996
July 1, 1994 - June 30, 1995
July 1, 1993 - June 30, 1994
July 1, 1992 - June 30, 1993
July 1, 1991 - June 30, 1992
July 1, 1990 - June 30, 1991
July 1, 1989 - June 30, 1990
July 1, 1988 - June 30, 1989
* EDOR = Effective Date of Retirement Additional Notes: 1) First COLAs were paid July 1, 1988 through June 30, 1989 2) July 1, 2002 COLAs were a flat 3 percent (regardless of the CPI)3) Beginning July 1, 2013
A. Retired members who are at least 55 years old and have been receiving benefits for at least one year may be eligible for a cost-of-living allowance adjustment.
B. The age 55 provision for receiving a COLA does not apply to those who are receiving a permanent and total disability benefit, statutory survivors and annuity beneficiaries.
C. Members with less than 15 years of service credit on July 1, 2013, will receive a COLA equal to either three percent or the percent increase, if any, in the Consumer Price Index (CPI-W) over the 12-month period ending on Sept. 30 of the immediately preceding year, whichever is less.
D. The COLA amount for members with at least 15 years of service credit as of July 1, 2013 is equal to three percent of their base pension or disability benefit.
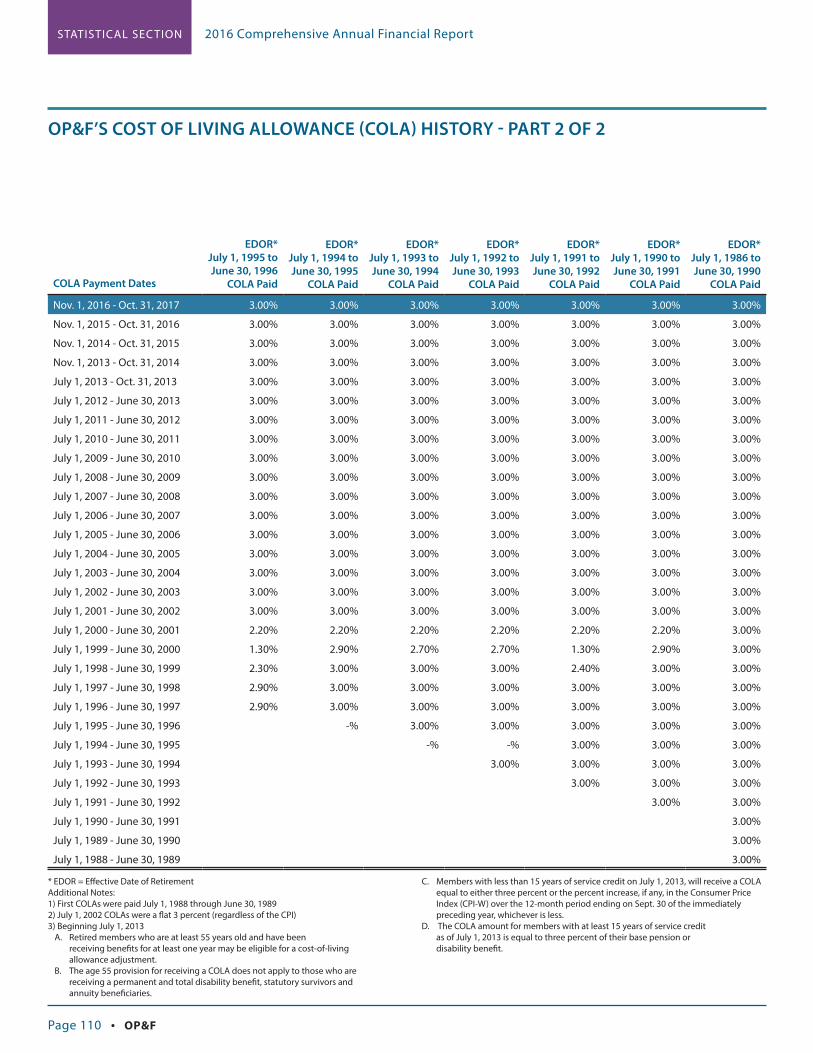
STATISTICAL SEC TION 2016 Comprehensive Annual Financial Report
Page 110 • OP&F
* EDOR = Effective Date of Retirement Additional Notes: 1) First COLAs were paid July 1, 1988 through June 30, 1989 2) July 1, 2002 COLAs were a flat 3 percent (regardless of the CPI)3) Beginning July 1, 2013
A. Retired members who are at least 55 years old and have been receiving benefits for at least one year may be eligible for a cost-of-living allowance adjustment.
B. The age 55 provision for receiving a COLA does not apply to those who are receiving a permanent and total disability benefit, statutory survivors and annuity beneficiaries.
C. Members with less than 15 years of service credit on July 1, 2013, will receive a COLA equal to either three percent or the percent increase, if any, in the Consumer Price Index (CPI-W) over the 12-month period ending on Sept. 30 of the immediately preceding year, whichever is less.
D. The COLA amount for members with at least 15 years of service credit as of July 1, 2013 is equal to three percent of their base pension or disability benefit.
OP&F’S COST OF LIVING ALLOWANCE (COLA) HISTORY - PART 2 OF 2 COLA Payment Dates
EDOR* July 1, 1995 to June 30, 1996
COLA Paid
EDOR* July 1, 1994 to June 30, 1995
COLA Paid
EDOR* July 1, 1993 to June 30, 1994
COLA Paid
EDOR* July 1, 1992 to June 30, 1993
COLA Paid
EDOR* July 1, 1991 to June 30, 1992
COLA Paid
EDOR* July 1, 1990 to June 30, 1991
COLA Paid
EDOR* July 1, 1986 to June 30, 1990
COLA Paid
Nov. 1, 2016 - Oct. 31, 2017 3.00% 3.00% 3.00% 3.00% 3.00% 3.00% 3.00%
Nov. 1, 2015 - Oct. 31, 2016 3.00% 3.00% 3.00% 3.00% 3.00% 3.00% 3.00%
Nov. 1, 2014 - Oct. 31, 2015 3.00% 3.00% 3.00% 3.00% 3.00% 3.00% 3.00%
Nov. 1, 2013 - Oct. 31, 2014 3.00% 3.00% 3.00% 3.00% 3.00% 3.00% 3.00%
July 1, 2013 - Oct. 31, 2013 3.00% 3.00% 3.00% 3.00% 3.00% 3.00% 3.00%
July 1, 2012 - June 30, 2013 3.00% 3.00% 3.00% 3.00% 3.00% 3.00% 3.00%
July 1, 2011 - June 30, 2012 3.00% 3.00% 3.00% 3.00% 3.00% 3.00% 3.00%
July 1, 2010 - June 30, 2011 3.00% 3.00% 3.00% 3.00% 3.00% 3.00% 3.00%
July 1, 2009 - June 30, 2010 3.00% 3.00% 3.00% 3.00% 3.00% 3.00% 3.00%
July 1, 2008 - June 30, 2009 3.00% 3.00% 3.00% 3.00% 3.00% 3.00% 3.00%
July 1, 2007 - June 30, 2008 3.00% 3.00% 3.00% 3.00% 3.00% 3.00% 3.00%
July 1, 2006 - June 30, 2007 3.00% 3.00% 3.00% 3.00% 3.00% 3.00% 3.00%
July 1, 2005 - June 30, 2006 3.00% 3.00% 3.00% 3.00% 3.00% 3.00% 3.00%
July 1, 2004 - June 30, 2005 3.00% 3.00% 3.00% 3.00% 3.00% 3.00% 3.00%
July 1, 2003 - June 30, 2004 3.00% 3.00% 3.00% 3.00% 3.00% 3.00% 3.00%
July 1, 2002 - June 30, 2003 3.00% 3.00% 3.00% 3.00% 3.00% 3.00% 3.00%
July 1, 2001 - June 30, 2002 3.00% 3.00% 3.00% 3.00% 3.00% 3.00% 3.00%
July 1, 2000 - June 30, 2001 2.20% 2.20% 2.20% 2.20% 2.20% 2.20% 3.00%
July 1, 1999 - June 30, 2000 1.30% 2.90% 2.70% 2.70% 1.30% 2.90% 3.00%
July 1, 1998 - June 30, 1999 2.30% 3.00% 3.00% 3.00% 2.40% 3.00% 3.00%
July 1, 1997 - June 30, 1998 2.90% 3.00% 3.00% 3.00% 3.00% 3.00% 3.00%
July 1, 1996 - June 30, 1997 2.90% 3.00% 3.00% 3.00% 3.00% 3.00% 3.00%
July 1, 1995 - June 30, 1996 -% 3.00% 3.00% 3.00% 3.00% 3.00%
July 1, 1994 - June 30, 1995 -% -% 3.00% 3.00% 3.00%
July 1, 1993 - June 30, 1994 3.00% 3.00% 3.00% 3.00%
July 1, 1992 - June 30, 1993 3.00% 3.00% 3.00%
July 1, 1991 - June 30, 1992 3.00% 3.00%
July 1, 1990 - June 30, 1991 3.00%
July 1, 1989 - June 30, 1990 3.00%
July 1, 1988 - June 30, 1989 3.00%
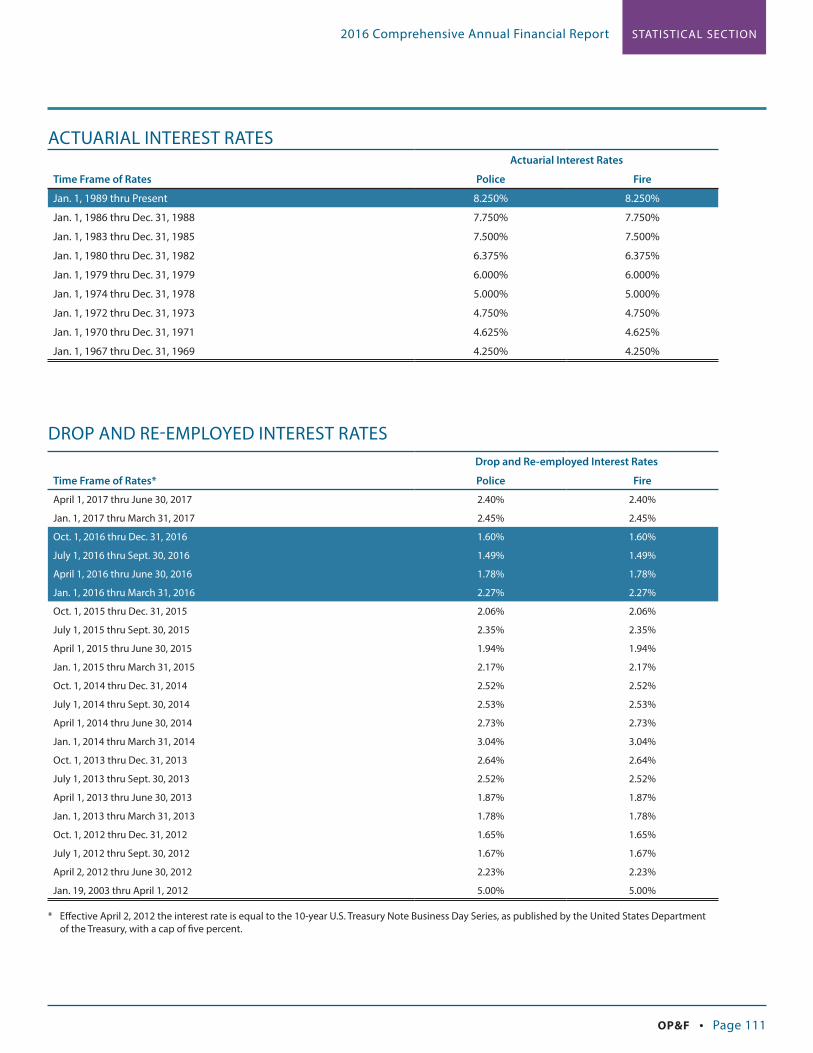
STATISTICAL SEC TION2016 Comprehensive Annual Financial Report
OP&F • Page 111
ACTUARIAL INTEREST RATESActuarial Interest Rates
Time Frame of Rates Police Fire
Jan. 1, 1989 thru Present 8.250% 8.250%
Jan. 1, 1986 thru Dec. 31, 1988 7.750% 7.750%
Jan. 1, 1983 thru Dec. 31, 1985 7.500% 7.500%
Jan. 1, 1980 thru Dec. 31, 1982 6.375% 6.375%
Jan. 1, 1979 thru Dec. 31, 1979 6.000% 6.000%
Jan. 1, 1974 thru Dec. 31, 1978 5.000% 5.000%
Jan. 1, 1972 thru Dec. 31, 1973 4.750% 4.750%
Jan. 1, 1970 thru Dec. 31, 1971 4.625% 4.625%
Jan. 1, 1967 thru Dec. 31, 1969 4.250% 4.250%
DROP AND RE-EMPLOYED INTEREST RATESDrop and Re-employed Interest Rates
Time Frame of Rates* Police Fire
April 1, 2017 thru June 30, 2017 2.40% 2.40%
Jan. 1, 2017 thru March 31, 2017 2.45% 2.45%
Oct. 1, 2016 thru Dec. 31, 2016 1.60% 1.60%
July 1, 2016 thru Sept. 30, 2016 1.49% 1.49%
April 1, 2016 thru June 30, 2016 1.78% 1.78%
Jan. 1, 2016 thru March 31, 2016 2.27% 2.27%
Oct. 1, 2015 thru Dec. 31, 2015 2.06% 2.06%
July 1, 2015 thru Sept. 30, 2015 2.35% 2.35%
April 1, 2015 thru June 30, 2015 1.94% 1.94%
Jan. 1, 2015 thru March 31, 2015 2.17% 2.17%
Oct. 1, 2014 thru Dec. 31, 2014 2.52% 2.52%
July 1, 2014 thru Sept. 30, 2014 2.53% 2.53%
April 1, 2014 thru June 30, 2014 2.73% 2.73%
Jan. 1, 2014 thru March 31, 2014 3.04% 3.04%
Oct. 1, 2013 thru Dec. 31, 2013 2.64% 2.64%
July 1, 2013 thru Sept. 30, 2013 2.52% 2.52%
April 1, 2013 thru June 30, 2013 1.87% 1.87%
Jan. 1, 2013 thru March 31, 2013 1.78% 1.78%
Oct. 1, 2012 thru Dec. 31, 2012 1.65% 1.65%
July 1, 2012 thru Sept. 30, 2012 1.67% 1.67%
April 2, 2012 thru June 30, 2012 2.23% 2.23%
Jan. 19, 2003 thru April 1, 2012 5.00% 5.00%
* Effective April 2, 2012 the interest rate is equal to the 10-year U.S. Treasury Note Business Day Series, as published by the United States Department of the Treasury, with a cap of five percent.

STATISTICAL SEC TION 2016 Comprehensive Annual Financial Report
Page 112 • OP&F
Police 2016 2015 2014 2013 2012 2011 2010 2009 2008 2007
Balance Beginning of Year 2,001 1,918 1,883 1,795 1,801 1,985 1,990 1,893 1,797 1,683
Number of members that entered into DROP Increases 369 364 322 384 329 356 289 289 258 272
Number of members that terminated DROP Decreases (320) (281) (287) (296) (335) (540) (294) (192) (162) (158)
SUB-TOTAL AT YEAR END - POLICE 2,050 2,001 1,918 1,883 1,795 1,801 1,985 1,990 1,893 1,797
Fire
Balance Beginning of Year 1,887 1,907 1,862 1,741 1,740 1,888 1,744 1,648 1,541 1,375
Number of Members that entered into DROP Increases 301 290 346 369 283 315 349 258 249 285
Number of members that terminated DROP Decreases (286) (310) (301) (248) (282) (463) (205) (162) (142) (119)
SUB-TOTAL AT YEAR END - FIRE 1,902 1,887 1,907 1,862 1,741 1,740 1,888 1,744 1,648 1,541
Police and Fire
Balance Beginning of Year 3,888 3,825 3,745 3,536 3,541 3,873 3,734 3,541 3,338 3,058
Number of members that entered into DROP Increases 670 654 668 753 612 671 638 547 507 557
Number of members that terminated DROP Decreases (606) (591) (588) (544) (617) (1,003) (499) (354) (304) (277)
TOTAL AT YEAR END - POLICE AND FIRE 3,952 3,888 3,825 3,745 3,536 3,541 3,873 3,734 3,541 3,338
DROP MEMBER COUNT ROLL FORWARD (as of Dec. 31)

STATISTICAL SEC TION2016 Comprehensive Annual Financial Report
OP&F • Page 113
ACTUARIAL VALUATION INFORMATION - PENSION TRUST FUND (DOLLARS IN MILLIONS)*
As of Jan. 1
Valuation Assets*
Actuarial Accrued Liabilities (AAL)
Unfunded/ (Overfunded)
Actuarial Accrued Liabilities (UAAL)
Ratio of Assets
to AAL
Active Member
Payroll
UAAL as Percentage
of Active Member
Payroll
2016 $13,653.0 $19,135.9 $5,482.9 71.3% $2,060.9 266.1%
2015 13,029.3 18,395.6 5,366.3 70.8% 1,986.6 270.1%
2014 11,063.2 16,577.8 5,514.6 66.7% 1,942.3 283.9%
2013 10,278.0 16,007.9 5,729.9 64.2% 1,913.4 299.5%
2012 10,309.0 16,346.7 6,037.7 63.1% 1,897.4 318.2%
2011 10,681.0 15,384.4 4,703.4 69.4% 1,868.5 251.7%
2010 10,794.1 14,830.7 4,036.6 72.8% 1,895.2 213.0%
2009 9,309.2 14,307.1 4,997.9 65.1% 1,900.9 262.9%
2008 11,212.9 13,727.8 2,514.9 81.7% 1,831.4 137.3%
2007 10,158.0 12,987.5 2,829.5 78.2% 1,782.9 158.7%
* The amounts reported in this schedule do not include assets or liabilities for post-employment health care benefits.
ACTUARIAL VALUATION INFORMATION - RETIREE HEALTH CARE TRUST FUND (DOLLARS IN MILLIONS)
As of Jan. 1
Valuation Assets
Actuarial Accrued Liabilities (AAL)
Unfunded/ (Overfunded)
Actuarial Accrued Liabilities (UAAL)
Ratio of Assets
to AAL
Active Member
Payroll
UAAL as Percentage of Active Member
Payroll
2016 $929.4 $5,166.6 $4,237.2 18.0% $2,060.9 205.6%
2015 1,031.9 5,399.6 4,367.7 19.1% 1,986.6 219.9%
2014 1,053.5 5,244.5 4,191.0 20.1% 1,942.3 215.8%
2013 935.6 4,234.8 3,299.2 22.1% 1,913.4 172.4%
2012 780.1 3,698.7 2,918.6 21.1% 1,897.4 153.8%
2011 717.7 3,295.3 2,577.6 21.8% 1,868.5 137.9%
2010 573.4 3,232.4 2,659.0 17.7% 1,895.2 140.3%
2009 438.7 3,163.6 2,724.9 13.9% 1,900.9 143.3%
2008 527.0 3,623.5 3,096.5 14.5% 1,831.4 169.1%
2007 436.6 3,273.7 2,837.1 13.3% 1,782.9 159.1%

STATISTICAL SEC TION 2016 Comprehensive Annual Financial Report
Page 114 • OP&F
HISTORICAL ANNUAL INVESTMENT RESULTS2016 2015 2014 2013 2012 2011 2010 2009 2008 2007
U.S. Equity
OP&F 15.60% 0.53% 11.27% 35.53% 15.88% 0.94% 22.43% 32.82% (38.02)% 5.37%International Equity*
OP&F 2.75% (0.77)% (5.56)% 21.01% 19.96% (12.37)% 15.11% 39.58% (45.71)% 20.61%Fixed Income
OP&F–Core 4.14% 1.45% 4.07% (1.05)% 6.31% 6.41% 9.72% 11.76% 0.37% 6.50%OP&F–High Yield 12.80% (0.95)% 2.81% 6.15% 15.64% 6.00% 15.02% 47.02% (20.17)% 2.91%OP&F–GIPS 18.76% 0.26% 19.43% (10.62)% 14.93% 35.50% 15.28% 9.84% 2.04% 11.72%OP&F–Commercial Mortgage** 5.63% 3.21% 8.56% 6.72% 5.28% 4.99% 16.63% (0.63)% 0.68% 2.31%
Master Limited Partnerships
OP&F 20.42% (29.31)% 16.91% 32.25% N/A N/A N/A N/A N/A N/AReal Estate **
OP&F 13.14% 16.83% 18.57% 15.11% 13.06% 18.01% 4.86% (37.27)% 2.07% 20.67%Private Markets **
OP&F 14.37% 12.06% 18.34% 11.50% 9.58% 17.66% 12.57% (11.61)% (2.32)% 31.88%Timber **
OP&F 2.99% 1.03% 8.99% 3.37% N/A N/A N/A N/A N/A N/ATotal Portfolio
OP&F 11.51% 0.65% 6.79% 16.94% 15.41% 2.57% 15.85% 20.73% (28.06)% 10.47% Policy Index*** 11.45% (2.18)% 6.87% 14.61% 14.94% 2.43% 12.61% 22.81% (28.89)% 9.16%
* International Equity benchmark is a blend of the MSCI ACWI ex U.S. (Net) through June 30, 2011, the MSCI ACWI ex U.S. Iran/Sudan Free from July 1, 2011 through Sept. 30, 2012 and the MSCI ACWI ex U.S. Iran/Sudan Free IMI Index from Oct. 1, 2012 forward.
** One quarter in arrears. *** Interim Policy Index: 19.8 percent Wilshire 5000, 19.1 percent MSCI ACWI ex-U.S. Iran/Sudan Free IMI index, 10.2 percent Barclays Aggregate, 14.1 percent CS First Boston
High Yield, 9.4 percent Global Treasury Inflation Protected Securities (TIPS) Custom, 11.2 percent NCREIF ODCE Index (Net) Lagged, 5.6 percent Wilshire 5000 + 3 percent Lagged, 3.1 percent CPI + 5 percent (Net), 7.5 percent Alerian MLP Index.
Long-Term Policy: 16 percent Wilshire 5000, 16 percent MSCI ACWI ex-U.S. Iran/Sudan Free IMI Index, 20 percent Barclays Aggregate, 15 percent CS First Boston High Yeild, 20 percent Global TIPS Custom, 12 percent NCREIF ODCE Index (Net) Lagged, 8 percent Wilshire 5000 + 3 percent Lagged, 5 percent NCREIF Timberland Lagged, 8 percent Alerian MLP Index (adds to 120 percent as “Risk Parity” approach uses 2x levered Global Inflation-Protected Securities and 2x levered Core Fixed Income).
Time Weighted methodology, based upon fair values, is used when calculating performance.

STATISTICAL SEC TION2016 Comprehensive Annual Financial Report
OP&F • Page 115
DEBT CAPACITY INFORMATION
OP&F does not have any outstanding debt, nor are there any plans to ever pursue issuing debt anytime in the future.
DEMOGRAPHIC AND ECONOMIC INFORMATION NUMBER OF EMPLOYER UNITS
Municipalities Townships Villages Total Total
Year Police Fire Police Fire Police Fire Police Fire Both
2016 248 221 - 130 279 37 527 388 9152015 249 220 - 131 280 37 529 388 9172014 249 221 - 129 283 36 532 386 9182013 249 223 - 124 282 33 531 380 9112012 249 225 - 122 288 33 537 380 9172011 250 227 - 123 283 34 533 384 9172010 252 229 - 123 284 33 536 385 9212009 252 229 - 121 287 32 539 382 9212008 251 228 - 123 287 34 538 385 9232007 251 229 - 122 289 33 540 384 924

STATISTICAL SEC TION 2016 Comprehensive Annual Financial Report
Page 116 • OP&F
OPERATING INFORMATION
RETIRED MEMBERSHIP BY TYPE OF BENEFITS AND AVERAGE ANNUAL ALLOWANCE (SOURCE: ACTUARIAL VALUATION) AS OF JAN. 1, 2016
Age Last Birthday NumberAnnual
Allowance
Average Annual
Allowance
Service Retirees
Under 60 2,673 $129,526,580 $48,457
60 - 64 3,008 152,232,733 50,609
65 - 69 3,148 153,877,185 48,881
70 - 74 2,261 102,454,468 45,314
75 - 79 1,435 58,296,837 40,625
Over 79 1,730 53,207,695 30,756
TOTAL 14,255 $649,595,498 $45,570
Survivors and Beneficiaries
Under 60 1,237 $12,199,343 $9,862
60 - 64 610 7,642,278 12,528
65 - 69 904 10,714,979 11,853
70 - 74 1,028 11,262,329 10,956
75 - 79 1,131 11,679,165 10,326
Over 79 2,920 28,592,094 9,792
TOTAL 7,830 $82,090,188 $10,484
Disability Retirees
Under 60 2,401 $94,738,406 $39,458
60 - 64 1,065 44,908,368 42,167
65 - 69 1,178 47,423,477 40,258
70 - 74 796 29,815,038 37,456
75 - 79 502 17,252,440 34,367
Over 79 375 10,105,502 26,948
TOTAL 6,317 $244,243,231 $38,664

STATISTICAL SEC TION2016 Comprehensive Annual Financial Report
OP&F • Page 117
RETIREMENT EFFECTIVE DATES
YEARS CREDITED SERVICE
0 - 4 5 - 9 10 - 14 15 - 19 20 - 24 25 - 29 30+
TOTAL NEW RETIREES
2016
Average Monthly BenefitAverage Final Average SalaryNumber of Active Recipients
$1,395$34,158
1
$2,314$59,041
6
$2,638$59,716
14
$2,477$63,590
44
$3,234$73,762
40
$4,075$75,132
737
$4,277$69,681
31
$3,925$73,889
873
2015
Average Monthly BenefitAverage Final Average SalaryNumber of Active Recipients
$–$–
–
$1,332$49,515
5
$2,387$59,939
17
$2,445$64,106
48
$3,175$71,568
43
$4,127$75,267
728
$4,944$77,280
40
$3,976$74,128
881
2014
Average Monthly BenefitAverage Final Average SalaryNumber of Active Recipients
$-$-
-
$2,243$62,465
8
$2,577$58,188
9
$2,349$62,903
29
$3,096$72,772
38
$4,011$72,161
708
$4,738$76,831
36
$3,910$71,822
828
2013
Average Monthly BenefitAverage Final Average SalaryNumber of Active Recipients
$2,612$52,748
2
$2,487$69,490
5
$2,736$61,462
25
$2,216$61,232
43
$3,251$71,553
47
$3,994$71,014
638
$4,832$74,792
29
$3,830$70,293
789
2012
Average Monthly BenefitAverage Final Average SalaryNumber of Active Recipients
$879$42,089
1
$2,247$55,994
14
$2,876$65,733
27
$2,783$63,252
69
$2,968$68,219
56
$3,932$68,661
662
$4,398$68,067
73
$3,761$67,858
902
2011
Average Monthly BenefitAverage Final Average SalaryNumber of Active Recipients
$2,042$52,736
2
$2,698$56,748
23
$2,758$64,823
42
$2,582$61,478
61
$3,124$68,588
37
$3,906$66,645
907
$4,722$69,404
215
$3,895$66,659
1,287
2010
Average Monthly BenefitAverage Final Average SalaryNumber of Active Recipients
$1,989$52,986
4
$2,307$63,760
18
$2,923$63,148
41
$2,858$64,760
39
$2,907$64,611
51
$3,653$64,545
452
$4,415$67,106
122
$3,602$64,829
727
2009
Average Monthly BenefitAverage Final Average SalaryNumber of Active Recipients
$2,592$50,696
5
$2,476$53,112
20
$2,878$60,367
39
$3,122$61,952
54
$3,208$64,972
44
$3,533$64,170
380
$4,205$67,365
70
$3,466$63,683
612
2008
Average Monthly BenefitAverage Final Average SalaryNumber of Active Recipients
$2,067$51,626
3
$2,539$53,487
37
$2,958$59,789
40
$2,834$60,428
62
$2,962$61,270
50
$3,402$63,520
291
$4,167$65,970
83
$3,318$62,359
566
2007
Average Monthly BenefitAverage Final Average SalaryNumber of Active Recipients
$2,347$47,179
6
$2,769$57,089
28
$2,934$60,319
50
$2,644$58,482
49
$3,019$62,037
43
$3,378$63,478
306
$4,087$65,783
91
$3,322$62,550
573
* All years begin Jan. 1 and end Dec. 31.
SCHEDULE OF AVERAGE BENEFITS*
This schedule displays the number of new retirees each year, grouped by years of credited service. Prior year numbers are not adjusted as members roll off the rolls. Retirement benefits are calculated based on the Final Average Salary (FAS) of the member. For members with 15 years or more of service credit as of July 1, 2013, FAS represents the member’s three highest
years of allowable earnings. For members with less than 15 years of service credit as of July 1, 2013, FAS represents the member’s five highest years of allowable earnings.
The Total New Retirees column represents the average monthly benefit and average FAS for the retiree counts listed in each year.

STATISTICAL SEC TION 2016 Comprehensive Annual Financial Report
Page 118 • OP&F
PRINCIPAL PARTICIPATING EMPLOYERS AS OF DEC. 31, 2016
Employer NameCovered
Employees Rank
Percentage of Total Covered
Members
City of Columbus 3,632 1 13.2%
City of Cleveland 2,375 2 8.6%
City of Cincinnati 1,927 3 7.0%
City of Toledo 1,240 4 4.5%
City of Akron 837 5 3.0%
City of Dayton 662 6 2.4%
City of Canton 317 7 1.1%
City of Youngstown 295 8 1.1%
City of Springfield 262 9 0.9%
City of Parma 221 10 0.8%
All Others 15,856 57.4%
TOTAL 27,624 100.0%
PRINCIPAL PARTICIPATING EMPLOYERS AS OF DEC. 31, 2007
Employer NameCovered
Employees Rank
Percentage of Total Covered
Members
City of Columbus 3,442 1 12.0%
City of Cleveland 2,530 2 8.9%
City of Cincinnati 1,942 3 6.8%
City of Toledo 1,156 4 4.0%
City of Akron 822 5 2.9%
City of Dayton 772 6 2.7%
City of Canton 341 7 1.2%
City of Youngstown 324 8 1.1%
City of Springfield 251 9 0.9%
City of Hamilton 236 10 0.8%
All Others 16,793 58.7%
TOTAL 28,609 100.0%

STATISTICAL SEC TION2016 Comprehensive Annual Financial Report
OP&F • Page 119
OP&F EMPLOYEE BUDGETED POSITION COUNTSDepartment 2016 2015* 2014 2013 2012** 2011 2010 2009 2008 2007
Administration 19 36 48 47 45 46 46 47 44 45
Finance 21 21 21 22 22 13 13 13 13 13
Business and Technology Solutions (BTS) 44 26 25 24 24 24 24 24 25 25
Investments 15 14 14 14 15 15 15 14 14 14
Member Services 46 46 34 34 38 46 46 51 54 64
TOTAL FULL-TIME POSITIONS 145 143 142 141 144 144 144 149 150 161
* In 2015, Customer Service was transitioned to Member Services and Purchasing was transitioned to BTS from Administration. ** In 2012, Employer Services was transitioned to Finance from Member Services.
PERSONNEL SALARIES BY YEAR (DOLLARS IN THOUSANDS)2016 2015 2014 2013 2012 2011 2010 2009 2008 2007
Salaries and Wages $9,971.3 $9,635.1 $9,054.2 $9,248.5 $8,756.9 $8,807.9 $8,313.9 $8,660.2 $8,866.4 $8,844.4
Average Salary per Budgeted Staff $68.8 $67.4 $63.8 $65.6 $60.8 $61.2 $57.7 $58.1 $59.1 $54.9
OP&F BUDGET (DOLLARS IN MILLIONS) 2016 2015 2014 2013 2012 2011 2010 2009 2008 2007
Administrative Expenses (Actual)* $63.6 $59.4 $61.6 $59.4 $52.8 $50.3 $46.5 $41.0 $43.6 $45.9
Administrative Expenses (Budget)* $66.0 $65.4 $62.6 $62.6 $58.7 $54.5 $45.6 $46.5 $54.6 $61.0
Percentage of Actual vs Budget 96% 91% 98% 95% 90% 92% 102% 88% 80% 75%
* Excludes depreciation expense.
2016 2015 2014 2013 2012 2011 2010 2009 2008 2007
Capital (Actual) $0.5 $1.3 $2.1 $3.1 $2.9 $1.7 $2.0 $0.6 $2.1 $1.2
Capital (Budget) $4.6 $3.0 $2.8 $3.4 $3.4 $3.7 $4.4 $3.2 $4.6 $3.8
Percentage of Actual vs Budget 11% 43% 75% 91% 85% 46% 45% 19% 46% 32%
2016 2015 2014 2013 2012 2011 2010 2009 2008 2007
Operating Expenses (Actual)* $17.9 $14.6 $14.4 $14.3 $13.6 $13.6 $13.1 $14.0 $13.9 $14.3
Investment Expenses (Actual)* $45.7 $44.8 $47.2 $45.1 $39.2 $36.7 $33.4 $27.0 $29.7 $31.6
* Excludes depreciation expense. Prior year operating expenses and investment expenses were recalculated to properly reflect the exclusion of depreciation expense.

STATISTICAL SEC TION 2016 Comprehensive Annual Financial Report
Page 120 • OP&F
OTHER OPERATING STATISTICS2016 2015 2014 2013 2012 2011 2010 2009 2008 2007
Total Staff 145 143 142 141 144 144 144 149 150 161
Investment Staff 15 14 14 14 15 15 15 14 14 14
Investment
Actual Expenses $45.7 $44.8 $47.2 $45.1 $39.2 $36.7 $33.4 $27.0 $29.7 $31.6
Investment Income $1,317.4 $(10.0) $860.7 $2,053.0 $1,657.9 $229.6 $1,651.8 $1,894.9 $(3,832.9) $1,163.1
Investment Staff to
Investment Expense Ratio $3.0 $3.2 $3.4 $3.2 $2.6 $2.4 $2.2 $1.9 $2.1 $2.3
Total Staff to Investment
Income Ratio $9.1 $(0.1) $6.1 $14.6 $11.5 $1.6 $11.5 $12.7 $(25.6) $7.2
Investment Staff to
Investment Income Ratio $87.8 $(0.7) $61.5 $146.6 $110.5 $15.3 $110.1 $135.4 $(273.8) $83.1
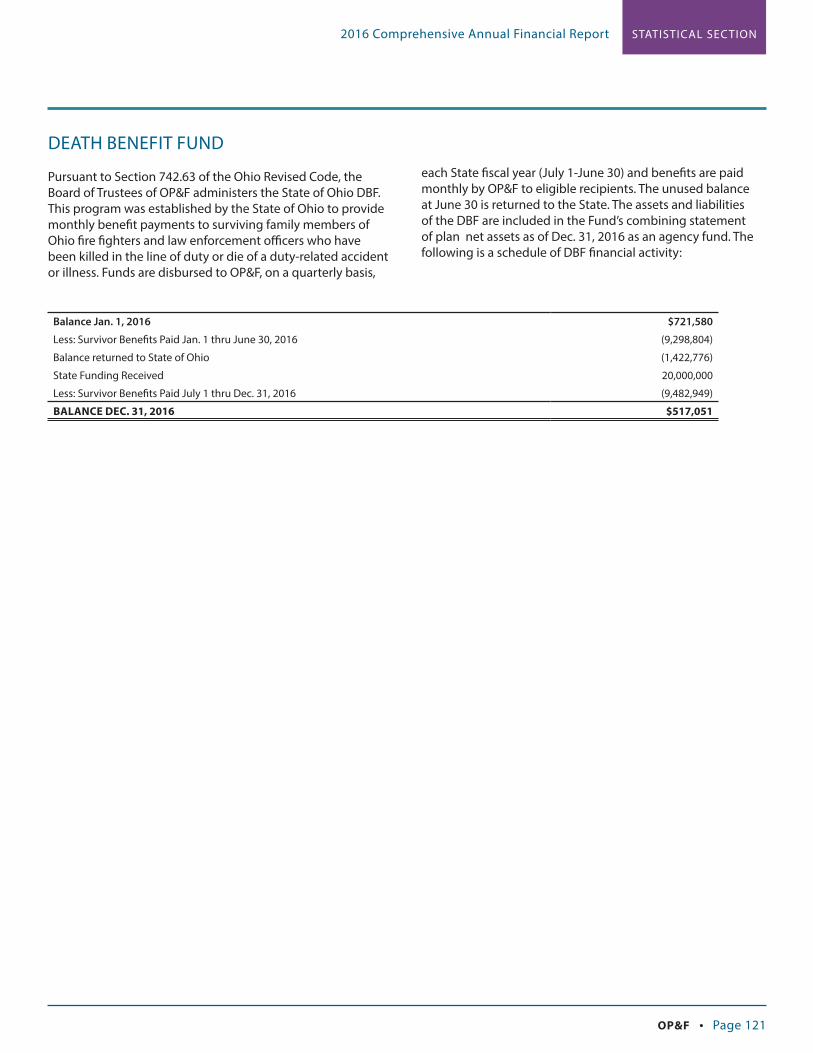
STATISTICAL SEC TION2016 Comprehensive Annual Financial Report
OP&F • Page 121
Balance Jan. 1, 2016 $721,580
Less: Survivor Benefits Paid Jan. 1 thru June 30, 2016 (9,298,804)
Balance returned to State of Ohio (1,422,776)
State Funding Received 20,000,000
Less: Survivor Benefits Paid July 1 thru Dec. 31, 2016 (9,482,949)
BALANCE DEC. 31, 2016 $517,051
DEATH BENEFIT FUND
Pursuant to Section 742.63 of the Ohio Revised Code, the Board of Trustees of OP&F administers the State of Ohio DBF. This program was established by the State of Ohio to provide monthly benefit payments to surviving family members of Ohio fire fighters and law enforcement officers who have been killed in the line of duty or die of a duty-related accident or illness. Funds are disbursed to OP&F, on a quarterly basis,
each State fiscal year (July 1-June 30) and benefits are paid monthly by OP&F to eligible recipients. The unused balance at June 30 is returned to the State. The assets and liabilities of the DBF are included in the Fund’s combining statement of plan net assets as of Dec. 31, 2016 as an agency fund. The following is a schedule of DBF financial activity:

STATISTICAL SEC TION 2016 Comprehensive Annual Financial Report
Page 122 • OP&F
ECONOMIC IMPACTIn 2006, OP&F commissioned an independent and comprehensive economic study to determine the impact of pension benefits, health care spending and other dollars spent that effected Ohio’s economy. The results remain relevant today and show the importance of OP&F’s fiscal impact on the state. Two of the principle findings of the study show:
• OP&F activity resulted in more than $1.1 billion in economic output across Ohio.
• OP&F activity resulted in 11,059 jobs in Ohio.
When OP&F makes direct payments to retirees and survivors, this income is spent and re-spent on goods and services produced in the local and regional economy where the beneficiaries reside. This spending (often termed “induced” impact by economists) in turn creates additional jobs in the sectors where the beneficiaries spend their benefit payments.
OP&F creates additional economic impact by providing health care and medical prescription insurance to retirees and survivors. Again, the consumption of health care by OP&F beneficiaries leads to ripple effects throughout the local and regional economy as a result of the increased demand for these services. Finally, OP&F contributes to Ohio’s economy by paying salaries to OP&F employees and purchasing goods and services that are needed to carry out the day-to-day operations and management of the pension fund.
These economic effects are often referred to as multiplier effects. In other words, any new dollar that is spent will have multiple economic effects throughout the local and regional economy as it leads to new jobs, which through typical economic inter-relationships then lead to other jobs. To provide a comprehensive estimate of the total economic impact of OP&F, both the direct and indirect effects of OP&F expenditures must be captured.
DIRECT IMPACT ON OHIO’S ECONOMY*
Dollar Category Amount
Benefit Payments to Retirees and Survivors $495,923,807
OP&F Health Insurance Expenditures 149,162,338
DROP Withdrawals 4,847,766
OP&F Administrative Expenditures 15,120,000
TOTAL DIRECT ECONOMIC IMPACT $665,053,911
* Based on Dec. 31, 2006 data.
IMPACT ON ECONOMIC OUTPUT*
Dollar Category Amount
Benefit Payments to Retirees and Survivors $738,628,918
OP&F Health Insurance Expenditures 330,155,792
DROP Withdrawals 7,220,263
OP&F Administrative Expenditures 32,343,192
TOTAL DIRECT ECONOMIC IMPACT $1,108,348,165
* Based on Dec. 31, 2006 data.

STATISTICAL SEC TION2016 Comprehensive Annual Financial Report
OP&F • Page 123
LIST OF PROFESSIONAL ACRONYMS AND SYMBOLS
AAL = Actuarial Accrued Liabilities
ACH = Automated Clearing House
ACWI Ex-U.S. = All Country World Index Ex-U.S.
ARC = Annual Required Contributions
B of AMLS U.S. = Bank of America Merill Lynch U.S.
Bps = Basis Points
BTS = Business and Technology Solutions
Buck = Buck Consultants, LLC (now known as Conduent)
CAFR = Comprehensive Annual Financial Report
COLA = Cost of Living Allowance
CPI = Consumer Price Index
DB = Defined Benefits
DBF = Death Benefit Fund
DROP = Deferred Retirement Option Plan
EAFE = Europe, Australia, Far East
EM = Emerging Markets
EU = European Union
€ = Euro
FAS = Final Average Salary
FED = Federal Reserve
FFC = Full Faith and Credit
FHLMC = Federal Home Loan Mortgage Corporation
FNMA = Federal National Mortgage Association
GASB = Government Accounting Standards Board
GDP = Gross Domestic Product
GFOA = Government Finance Officers Association of the U.S. and Canada
GIPS = Global Inflation Protected Securities
GNMA = Government National Mortgage Association
HCSF = Health Care Stabilization Fund
HY = High Yield
IMI = Investable Market Index
IPO = Initial Public Offering
IRR = Internal Rate of Return
I/S Free = Iran and Sudan Free
JSA = Joint and Survivor Annuity
LACC = Life Annuity Certain and Continuous
M&A = Mergers and Acquisitions
MD&A = Management Discussion and Analysis
MLPs = Master Limited Partnerships
MSCI = Morgan Stanley Capital International
NAV = Net Asset Value
NPL = Net Pension Liability
NR = Not Rated
ODCE = Open End Diversified Core Equity
OP&F = Ohio Police & Fire Pension Fund
OPEB = Other Post-Employment Benefit
OPERS = Ohio Public Employees Retirement System
ORC = Ohio Revised Code
ORSC = Ohio Retirement Study Council
PME = Public Market Equivalent
PPCC = Public Pension Coordination Council
Q1 = Quarter 1
Q2 = Quarter 2
REMICs = Real Estate Mortgage Investment Conduits
RFP = Request for Proposal
RSI = Required Supplementary Information
S&P = Standard and Poor’s
SB = Senate Bill
STIF = Short Term Investment Fund
TIPS = Treasury Inflation Protected Securities
2x = Two Times
TTY = TeletypeWriter
UAAL = Unfunded Actuarial Accrued Liabilities
U.K. = United Kingdom
U.S. = United States of America
U.S.D. = United States Dollar
Veba Trust = Voluntary Employees’ Beneficiary Association Trust

CUSTOMER SERVICE 1-888-864-8363
GENERAL INFORMATION 614-228-2975
TTY 614-221-3846
FAX 614-628-1777
E-MAIL [email protected]
PRUDENCE | INTEGRITY | EMPATHY
Securing the future for Ohio’s police and firefighters
140 East Town Street Columbus, Ohio 43215
www.op-f.org
Copyright © 2016 by Ohio Police & Fire Pension Fund. All Rights Reserved.
Top Related