Comprehensive Annual Financial Report - Kentucky CAFR (Comprehensive... · Comprehensive Annual...
167
Comprehensive Annual Financial Report Fiscal Year Ended June 30, 2011 Kentucky Retirement Systems is a component unit of the Commonwealth of Kentucky. is Comprehensive Annual Financial Report reports data for each of our three (3) systems. v Kentucky Employees Retirement System (KERS) County Employees Retirement System (CERS) State Police Retirement System (SPRS) Comprehensive Annual Financial Report Fiscal Year Ended June 30, 2012 Kentucky Retirement Systems A component unit of the Commonwealth of Kentucky Kentucky Employees Retirement System (KERS) County Employees Retirement System (CERS) State Police Retirement System (SPRS)
Transcript of Comprehensive Annual Financial Report - Kentucky CAFR (Comprehensive... · Comprehensive Annual...

Comprehensive Annual Financial Report
Fiscal Year Ended June 30, 2011 Kentucky Retirement Systems is a component
unit of the Commonwealth of Kentucky. Th is Comprehensive Annual Financial
Report reports data for each of our three (3) systems.
v Kentucky Employees Retirement System (KERS)
County Employees Retirement System (CERS)
State Police Retirement System (SPRS)
Comprehensive
Annual Financial Report Fiscal Year Ended June 30, 2012
Kentucky Retirement SystemsA component unit of the Commonwealth of Kentucky
Kentucky Employees Retirement System (KERS)
County Employees Retirement System (CERS)
State Police Retirement System (SPRS)
FINANCIAL TABLE OF CONTENTS
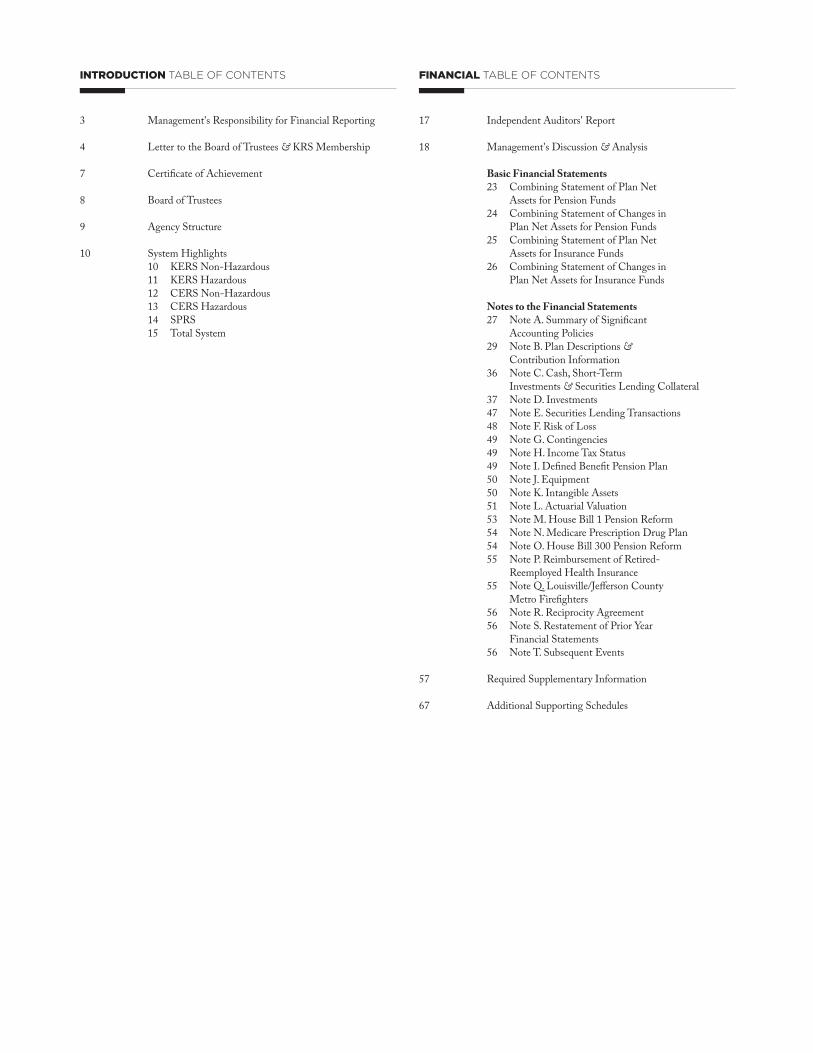
3 Management's Responsibility for Financial Reporting
4 Letter to the Board of Trustees & KRS Membership
7 Certifi cate of Achievement
8 Board of Trustees
9 Agency Structure
10 System Highlights 10 KERS Non-Hazardous 11 KERS Hazardous 12 CERS Non-Hazardous 13 CERS Hazardous 14 SPRS 15 Total System
INTRODUCTION TABLE OF CONTENTS
17 Independent Auditors' Report
18 Management's Discussion & Analysis
Basic Financial Statements 23 Combining Statement of Plan Net Assets for Pension Funds 24 Combining Statement of Changes in Plan Net Assets for Pension Funds 25 Combining Statement of Plan Net Assets for Insurance Funds 26 Combining Statement of Changes in Plan Net Assets for Insurance Funds
Notes to the Financial Statements 27 Note A. Summary of Signifi cant Accounting Policies 29 Note B. Plan Descriptions & Contribution Information 36 Note C. Cash, Short-Term Investments & Securities Lending Collateral 37 Note D. Investments 47 Note E. Securities Lending Transactions 48 Note F. Risk of Loss 49 Note G. Contingencies 49 Note H. Income Tax Status 49 Note I. Defi ned Benefi t Pension Plan 50 Note J. Equipment 50 Note K. Intangible Assets 51 Note L. Actuarial Valuation 53 Note M. House Bill 1 Pension Reform 54 Note N. Medicare Prescription Drug Plan 54 Note O. House Bill 300 Pension Reform 55 Note P. Reimbursement of Retired- Reemployed Health Insurance 55 Note Q. Louisville/Jeff erson County Metro Firefi ghters 56 Note R. Reciprocity Agreement 56 Note S. Restatement of Prior Year Financial Statements 56 Note T. Subsequent Events
57 Required Supplementary Information
67 Additional Supporting Schedules

72 One Year Later
73 Investment Summary
74 Investment Objectives
74 Investment Strategies
76 Consultants Review 76 R.V. Kuhns & Associates, Inc. 84 Altius Associates 90 ORG Portfolio Management LLC
94 Investment Results 96 U.S. Equity 98 International Equity 100 Fixed Income 102 Private Equity 102 Real Estate 103 Absolute Return 103 Real Return 104 Cash
106 External Investment Advisors
108 Schedule of Commissions Paid
108 Portfolio Summaries 108 KERS Non-Haz 108 KERS Haz 109 CERS Non-Haz 109 CERS Haz
INVESTMENTS TABLE OF CONTENTS
112 Certifi cation Letter
115 Summary of Actuarial Assumptions & Methods
120 Summary of Actuarial Valuation Results
121 Recommended Employer Contribution Rates
123 Summary of Actuarially Unfunded Liabilities
126 Analysis of Financial Experience
128 Solvency Test
131 Summary of Active Member Valuation Data
133 Summary of Retired Member Valuation Data
134 Summary of Benefi t Provisions
ACTUARIAL TABLE OF CONTENTS
142 Membership by System
144 Participating Employers
146 Average Monthly Benefi t
147 Plan Net Assets
148 Changes in Plan Net Assets
153 Schedule of Benefi t Expenses by Type
158 Analysis of Initial Retirees
159 Payments Options Selected by Members
160 Employer Contribution Rates
161 Retired Reemployed
162 Insurance Contracts by Type
164 Retirement Payments by County
STATISTICAL TABLE OF CONTENTS

3 Management's Responsibility for Financial Reporting
4 Letter to the Board of Trustees & KRS Membership
7 Certifi cate of Achievement
8 Board of Trustees
9 Agency Structure
10 System Highlights 10 KERS Non-Hazardous 11 KERS Hazardous 12 CERS Non-Hazardous 13 CERS Hazardous 14 SPRS 15 Total System
INTRODUCTION TABLE OF CONTENTS
dIIIIIInnnnnnnnnnnnnnnnntttttttttttttttttrrrrrrrrrrrrrrroooooooooooooooodddddddddddddddduuuuuuuuuuuuuucccccccccccccccttttttttttttttoooooooooooooooorrrrrrrrrrrrrryyyyyyyyyyyyyyyy SSSSSSSSSSSSSSSSeeeeeeeeeeeeeeeeeeeeeeeeeeeeeeeeeeccttiioonnnnnnnnnnnnnnnnnnnnnnnnnnnnnnnnn
December 5, 2012 Some amounts included in the fi nancial state-
ments may be based on estimates and judgments. Th ese estimates and
judgments were made utilizing the best business practices available. Th e
accounting policies followed in the preparation of these basic fi nancial
statements conform with US Generally Accepted Accounting Principles.
Financial information presented throughout the annual report is consis-
tent with the basic fi nancial statements.
Responsibility Ultimate responsibility for the basic fi nancial
statements and annual report rests with the Board of Trustees. Th e Ex-
ecutive Director and KRS' staff assist the Board in its responsibilities.
Systems of internal control and supporting procedures are maintained to
provide assurance that transactions are authorized, assets safeguarded, and
proper records maintained. Th ese controls include standards in hiring and
training of employees, the establishment of an organizational structure,
and the communications of policies and guidelines throughout the orga-
nization. Th ese internal controls are reviewed by internal audit programs.
All internal audit reports are submitted to the Audit Committee and the
Board of Trustees.
Kentucky Retirement Systems' external auditors, Dean Dorton Allen
Ford, PLLC, have conducted an independent audit of the basic fi nancial
statements in accordance with US Generally Accepted Auditing Stan-
dards. Th is audit is described in their Independent Auditors' Report on
page 17. Management has provided the external auditors with full and
unrestricted access to KRS' staff to discuss their audit and related fi ndings
as to the integrity of the plan's fi nancial reporting and the adequacy of
internal controls for the preparation of fi nancial statements.
William A. Th ielen, Esq. // Executive Director
Chief Operations Offi cer
William A. Th ielen, Esq. //
Todd E. Coleman, CPA // Controller
Management's Responsibility for Financial Reporting
Management has prepared the basic fi nancial statements of Kentucky Retirement Systemsand is responsible for the integrity and fairness of the information presented.
3 INT
Letter of Transmittal

December 5, 2012 Responsibility for both the accuracy of the data and the com-
pleteness and fairness of the presentation rests with the management of the Kentucky
Retirement Systems. We present this information to assist the Board, the members of
KERS, CERS and SPRS (collectively referred to as KRS) and the general public in un-
derstanding KRS’ fi nancial and actuarial status. Th is CAFR conforms to the principles
of governmental accounting and reporting set forth by the Governmental Account-
ing Standards Board. KRS’ fi nancial transactions are reported on the accrual basis of
accounting. Additionally, internal accounting controls provide reasonable assurance
regarding the safekeeping of assets and fair presentation of the fi nancial statements and
supporting schedules. Please refer to Management’s Discussion and Analysis in the
Financial Section.
To the Trustees & MembershipI am pleased to present the Comprehensive Annual Financial Report (CAFR) of the Kentucky Employees Retirement System (KERS), County Employees Retirement System (CERS), and State Police Retirement System (SPRS) for the fi scal year ended June 30, 2012.
KERSKentucky Employees Retirement System
CERSCounty Employees Retirement System
SPRSState Police Retirement System
ARCAnnual Required Contribution
CMSCenters for Medicare &Medicaid Services
MAJOR INITIATIVES
KRS continued during the 2012 fi scal year, whenever the opportunity presented itself,
to educate its members, participating employers, legislators, executive branch offi cials
and the general public about the funded status of its retirement plans, including the
impact of reductions to the actuarially recommended employer contribution rates for
the KERS and SPRS plans. Th is underfunding, along with past benefi t increases, un-
funded annual cost of living allowances (COLAs), and two major economic recessions
in the last decade, has resulted in a decline of funding ratios (the ratio of assets to
accrued liabilities) for the KERS nonhazardous and SPRS pension trusts to alarmingly
low levels. As of June 30, 2012, the funded ratio of the KRS nonhazardous plan is
27.30% of the actuarial value of assets. Th e funded ratio of the SPRS plan is 40.11%
of the actuarial value of assets. In 2008, the Kentucky General Assembly passed a
pension reform bill (House Bill 1) that included a schedule to increase employer con-
tributions over the next several years until reaching the full ARC in 2025 for KERS
non-hazardous, 2019 for KERS hazardous and 2020 for the SPRS system. For the
past three fi scal years, the Governor and the Kentucky General Assembly have met
the increased funding schedule set forth in House Bill 1. During its 2012 Regular
Session, the General Assembly passed House Concurrent Resolution 162, which cre-
ated the Kentucky Public Pensions Task Force. Th e Task Force was charged with the
responsibility of studying and developing recommendations concerning the benefi ts,
investments, and funding of the State administered retirement systems. Th e Task Force
will issue its fi nal report and recommendations on or before December 7, 2012.
In 2012, KRS continued to contract with the Centers for Medicare and Medicaid
Services (CMS) for an Employee Group Waiver Plan for medical and pharmacy insur-
ance benefi ts for Medicare-eligible retirees. Th is contract allows KRS to apply the full
amount of the drug subsidy received from CMS toward its unfunded liability for medi-
cal benefi ts. For the fi rst two years of the EGWP contract approximately $40 million
dollars in reimbursement was received from CMS for provision of the drug benefi t to
retirees. KRS is in its third year under this program and the application of the subsidy
to the unfunded liability for medical benefi ts resulted in a continued reduction of that
4INT
liability for the fi scal year ended June 30, 2012. Th e reduced unfunded liability has a
favorable impact on employers by reducing the amount of their contribution toward re-
tiree health care. Th e overall trend for the Medicare eligible population medical/phar-
macy benefi t has decreased with a trend of -13% while the under-65 retiree population
has experienced a growth of around 12%. Both groups together comprise a population
of slightly over 87,000 retirees.
KRS implemented the fi nal phase of its new technology system during the 2012 fi s-
cal year, which provides employer online functionality, and allows active members, as
well as retirees, to access their account information online. Th e most recent release of
the Strategic Technology Advancements for the Retirement of Tomorrow (START)
program allows employers to submit contributions and salary information for their
employees online and adds active member functionality to the retiree self service func-
tionality released in September 2009. Outreach training sessions were conducted to
encourage members and retirees to utilize the service purchase cost and retirement esti-
mate functionality. Employer refresher training sessions were held, and KRS’ Employer
Compliance and Education and Accounting staff continue to assist employers with
the transition to the new system. Th e START project warranty period will complete
in the 2012-2013 fi scal year with the exception of enhancements which KRS staff will
continue to implement. Constituents can keep current on future changes to START
and access their account information on the KRS website at http://kyret.ky.gov.
KRS continues to seek new ways to serve and educate our membership. In the spring of
2012, KRS launched a member education and outreach program, which included both
on-site and online training opportunities for active members. Twelve Pre-Retirement
Education Program (PREP) programs were conducted throughout the Common-
wealth. Th ese programs off er a general retirement education and planning curriculum
as well as focused training on how to utilize the Active Member Self Service feature on
the KRS website. Over 1,700 appointments were scheduled for the general retirement
program and 900 appointments for the Active Member Self Service computer lab ses-
sions. KRS staff also conducted a series of Active Member Self Service computer lab
sessions at the KY Transportation Cabinet which served approximately 700 members.
In partnership with the Kentucky Department of Libraries and Archives, we were able
to off er a series of 10 webinars to our KERS members. Th ese webinars focused on
general benefi t information and retirement planning. Our staff will continue to explore
educational outreach opportunities and will expand upon these eff orts in 2013.
Th e theme last year was personal and corporate balance sheet rebuilding, along with an
expansion of the Federal Reserve’s balance sheet, to create a stable environment that
would promote growth and result in reduced unemployment. Despite the improve-
ment in the economy, and the strengthening of both personal and especially corporate
balance sheets, too much uncertainty has held back the recovery and led to lackluster
job growth.
To help address this uncertainty, the KRS Board of Trustees approved a new target
asset allocation beginning July 1, 2011. As of June 30, 2012, the KRS Pension fund’s
policy allocation invests 20% of the assets in U.S. equities, 20% in broad market inter-
national equities, 4% in emerging market equities, 20% in fi xed income, 10% in private
equity, 10% in real return strategies, 10% in absolute return strategies, 5% in real estate,
and 1% in cash or short-term securities. As of June 30, 2012, the KRS Insurance fund’s
policy allocation invests 21.1% of the assets in U.S. equities, 21.1% in broad market
international equities, 3.4% in emerging market equities, 19.3% in fi xed income, 8.2%
STARTStrategic Technology Advancements for the Retirement of Tomorrow
iNVESTMENTS
5 INT
ACTUARIAL FUNDING
in private equity, 11.4% in real return strategies, 10.2% in absolute return strategies,
4.3% in real estate, and 1% in cash or short-term securities.
For the fi scal year ended June 30, 2012, the KRS pension fund returned 0.14%, which
fell 0.76% short of the benchmark return of 0.90%. Th e KRS insurance fund lost
-1.71% for the fi scal year ending June 30, 2012, compared to the benchmark’s 0.58%
return and the actuarially assumed rate of 7.75%. Th e underperformance of both the
pension fund and the insurance fund is primarily attributable to weakness in the U.S.
and Non-U.S. Equity portfolios, including the terminated dynamic currency hedging
program.
For the 10-years ending June 30, 2012, the KRS pension fund portfolio earned an
annualized total return of 5.99%, slightly underperforming the benchmark return of
6.18%. Th e KRS insurance fund underperformed its benchmark by an even closer mar-
gin for the 10-year period ending June 30, 2012, earning 5.86% versus 5.93%.
Kentucky Retirement Systems administers both a pension fund and an insurance fund for each of the systems it manages. Th ese trusts are used to fund monthly pension and health care payments to and on behalf of retirees.
Non-hazardous employees are statutorily required to contribute 5% of pre-tax salary to
their pension benefi t, while hazardous employees contribute 8% on a pre-tax basis. All
employees hired with an initial participation date on or after September 1, 2008 must
contribute an additional 1% of their pre-tax compensation toward their retiree health
insurance benefi ts. Th ese monies are deposited in a 401(h) account within the pension
trust. Employer contributions are calculated annually by the Board of Trustees and
include the normal cost of pension and insurance benefi ts plus a contribution toward
the unfunded liability of the pension and insurance trusts designed to amortize that
liability over a period no longer than 30 years.. Employer contributions also include an
administrative fee that is used to pay annual operating expenses of KRS. Th e admin-
istrative expense is shared among the plans based on the ration of a plan’s membership
to the total membership at the beginning of a fi scal year.
Funding ratios have fallen both steadily and signifi cantly over the last decade as a result
of unfavorable market conditions, higher than anticipated retirement rates, employer
underfunding in the KERS nonhazardous and SPRS plans, and increased expenses
for annual cost of living adjustments that are not pre-funded by the employers. While
improved market conditions and the increased funding in the KERS and SPRS plans
have slowed the growth of the unfunded liabilities of the various systems, KRS uses a
fi ve-year smoothing method and the full eff ects of the market losses in 2008 and 2009
will not be realized for another two years. Th e funding levels of all systems as of June
30, 2012 are listed on page 113 of the Actuarial Section.
KRS continues to engage a number of professional consultants to assist trustees and
staff in key business areas such as investments, taxes, auditing services and legal repre-
sentation. A list of the Board’s contract consultants can be found in the organizational
chart on page 9. A list of external investment managers can be found in the investment
section of this report.
PROFESSIONAL SERVICES
6INT
Th e Government Finance Offi cers Association of the United States and Canada
(GFOA) awarded a Certifi cate of Achievement for Excellence in Financial Reporting
to the Kentucky Retirement Systems for its Comprehensive Annual Financial Report
(CAFR) for the fi scal year ended June 30, 2011. Th e Certifi cate of Achievement is a
prestigious national award recognizing excellence in the preparation of state and lo-
cal government fi nancial reports and is valid for a period of one year. Th is was the
fourteenth consecutive award earned by KRS. In order to be awarded a Certifi cate of
Achievement, a government unit must publish an easily readable and effi ciently orga-
nized document. Th e report must satisfy both generally accepted accounting principles
and applicable legal requirements. We believe our 2012 CAFR will continue to meet
the Certifi cate of Achievement Program’s requirements, and we will be submitting it to
the GFOA for their consideration.
KRS also received a 2012 Recognition Award for Administration that was presented by
the Public Pension Coordinating Council, a confederation of the National Association
of State Retirement Administrators (NASRA), the National Conference on Public
Employee Retirement Systems (NCPERS), and the National Council on Teacher Re-
tirement (NCTR). Th e award is given in recognition of meeting professional standards
for plan administrators set forth in the Public Pension Standards.
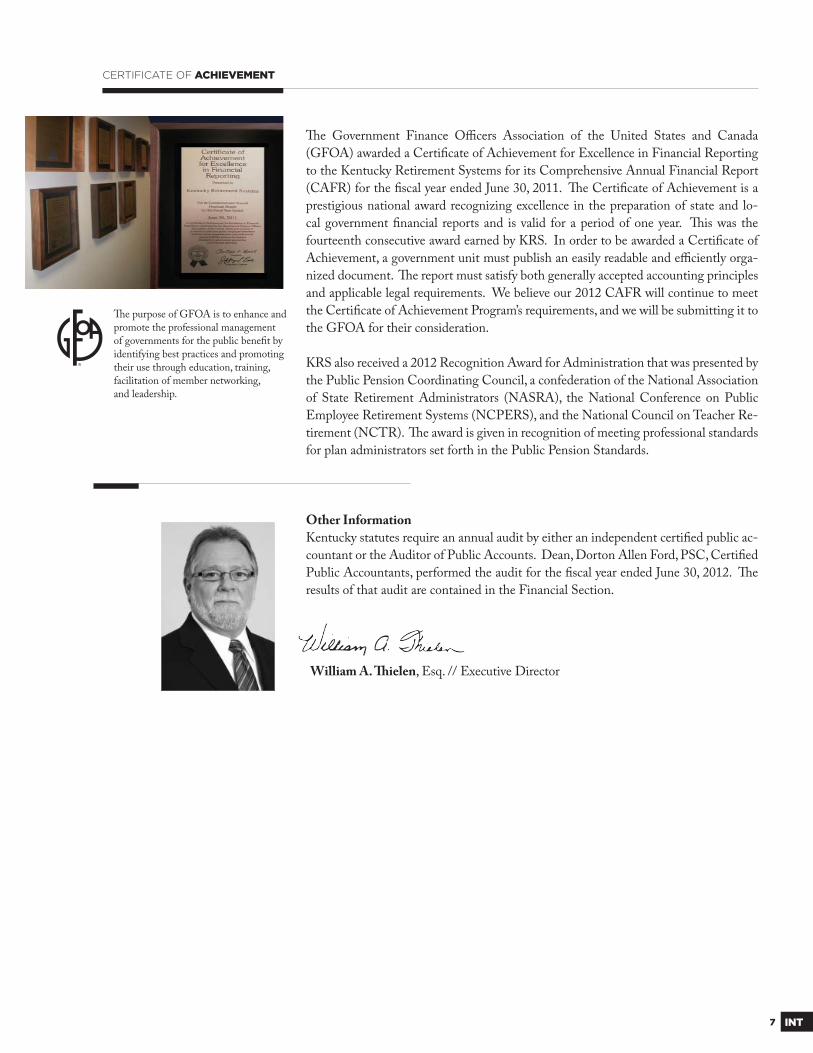
Other Information
Kentucky statutes require an annual audit by either an independent certifi ed public ac-
countant or the Auditor of Public Accounts. Dean, Dorton Allen Ford, PSC, Certifi ed
Public Accountants, performed the audit for the fi scal year ended June 30, 2012. Th e
results of that audit are contained in the Financial Section.
Th e purpose of GFOA is to enhance and promote the professional management of governments for the public benefi t by identifying best practices and promoting their use through education, training, facilitation of member networking,and leadership.
7 INT
CERTIFICATE OF ACHIEVEMENT
William A. Th ielen, Esq. // Executive Director

Th omas Elliott, ChairGovernor AppointeeTerm ends March 31, 2015
Tim LongmeyerPersonnel SecretaryTerm ends Ex-Offi cio
Dr. Daniel Bauer, Vice ChairGovernor AppointeeTerm ends March 31, 2016
Bobby HensonElected by KERSTerm ends March 31, 2014
Randy OverstreetElected by SPRSTerm ends March 31, 2015
Susan SmithElected by KERSTerm ends March 31, 2014
Jennifer Elliott Governor AppointeeTerm ends March 31, 2016
Vince LangElected by CERSTerm ends March 31, 2013
Board of Trustees
Th e Board of Trustees are comprised of nine members. Two elected by
KERS members, two elected by CERS members, one elected by SPRS
members, three appointed by Governor Steve Beshear and the Secretary
of the State Personnel Cabinet.
MEET THE BOARD
8INT
Committee Meetings OnlineVisit kyret.ky.gov/index.php/board to download materials from previous Board meetings. You may also browse a list of upcoming meetings. Click "Meet the Board" to email any Board member.
VacantElected by CERSTerm ends March 31, 2012

9 INT
ORG CHART
Consultants
Actuarial ServicesCavanaugh Macdonald Consulting, LLC
Asset ManagementAltius Associates
Auditing ServicesDean Dorton Allen Ford PSC
Investment ConsultantR.V. Kuhns
Legal ServicesStoll Keenon Ogden, PLLC
Fiduciary Review ConsultantsIce Miller, LLP
Real Estate ConsultantORG
Board of Trustees
Investment Committee Audit Committee
Internal AuditorConnie Davis
Chief Investment Offi cerT.J. Carlson
Alternative Investments Equity AssetsBrent Aldridge Bo Cracraft
Absolute & Real Return Fixed IncomeChris Schelling David Peden
Executive DirectorWilliam A. Thielen
Chief Operations Offi cerVacant
AccountingTodd E. Coleman
CommunicationsScarlett Consalvi
Employer Compliance & EducationSarah Webb
Information SecurityMark McChesney
Information TechnologyPam Gibbs
Procurement & Offi ce ServicesJoe Morris
Planning & Constituent ServicesShawn Sparks
Chief Benefi ts Offi cerCharlene Haydon
DisabilitiesLiza Welch
Member ServicesRebecca Stephens
Membership SupportSuzanne Howe
Retiree ServicesLela Hatter
General CounselJennifer Jones, Interim
Human Resources DirectorMarlane Robinson
Agency Structure
Compliance Offi cerAnn Case
10INT
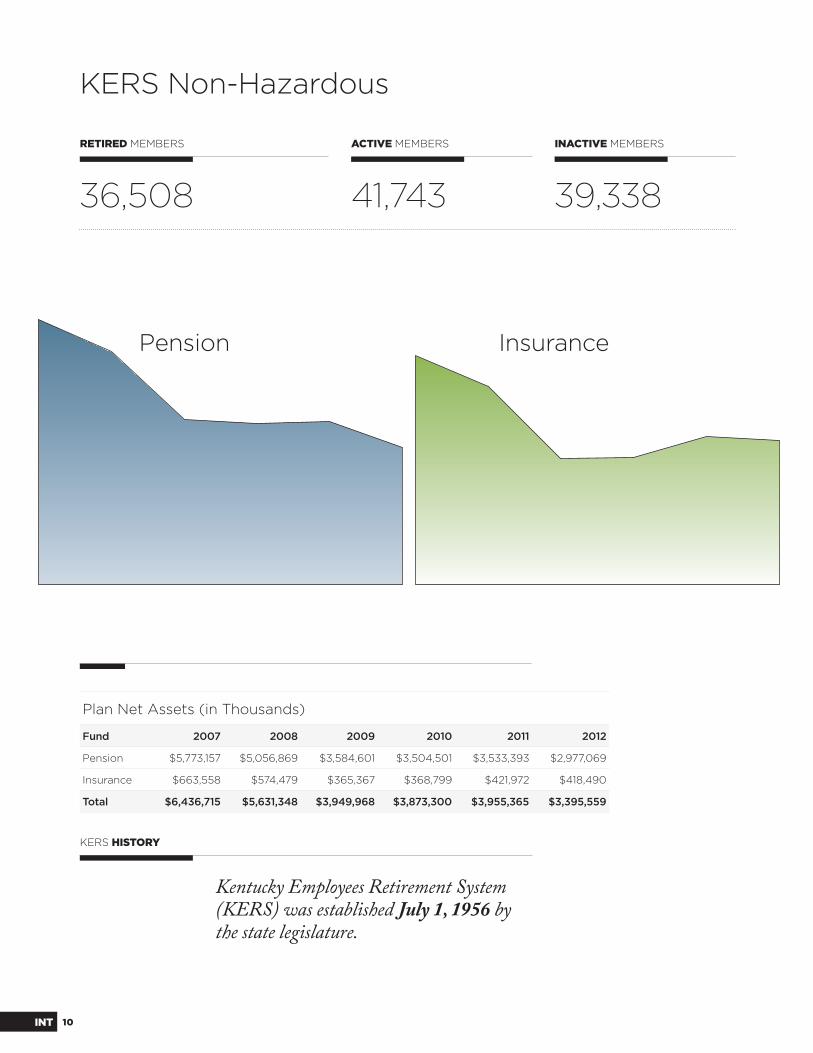
KERS Non-Hazardous
RETIRED MEMBERS
36,508
ACTIVE MEMBERS
41,743
INACTIVE MEMBERS
39,338
Kentucky Employees Retirement System (KERS) was established July 1, 1956 by the state legislature.
Plan Net Assets (in Thousands)
Fund 2007 2008 2009 2010 2011 2012
Pension $5,773,157 $5,056,869 $3,584,601 $3,504,501 $3,533,393 $2,977,069
Insurance $663,558 $574,479 $365,367 $368,799 $421,972 $418,490
Total $6,436,715 $5,631,348 $3,949,968 $3,873,300 $3,955,365 $3,395,559
KERS HISTORY
Pension Insurance
11 INT
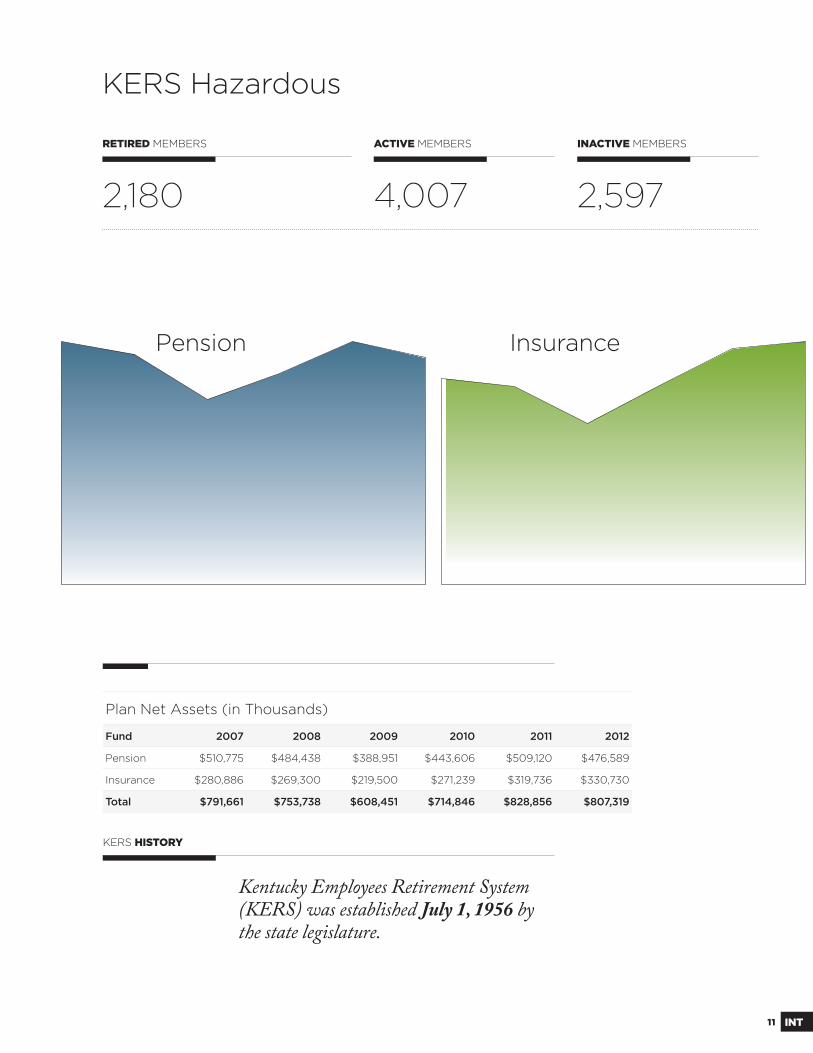
KERS Hazardous
RETIRED MEMBERS
2,180
ACTIVE MEMBERS
4,007
INACTIVE MEMBERS
2,597
Kentucky Employees Retirement System (KERS) was established July 1, 1956 by the state legislature.
Plan Net Assets (in Thousands)
Fund 2007 2008 2009 2010 2011 2012
Pension $510,775 $484,438 $388,951 $443,606 $509,120 $476,589
Insurance $280,886 $269,300 $219,500 $271,239 $319,736 $330,730
Total $791,661 $753,738 $608,451 $714,846 $828,856 $807,319
KERS HISTORY
Pension Insurance
12INT
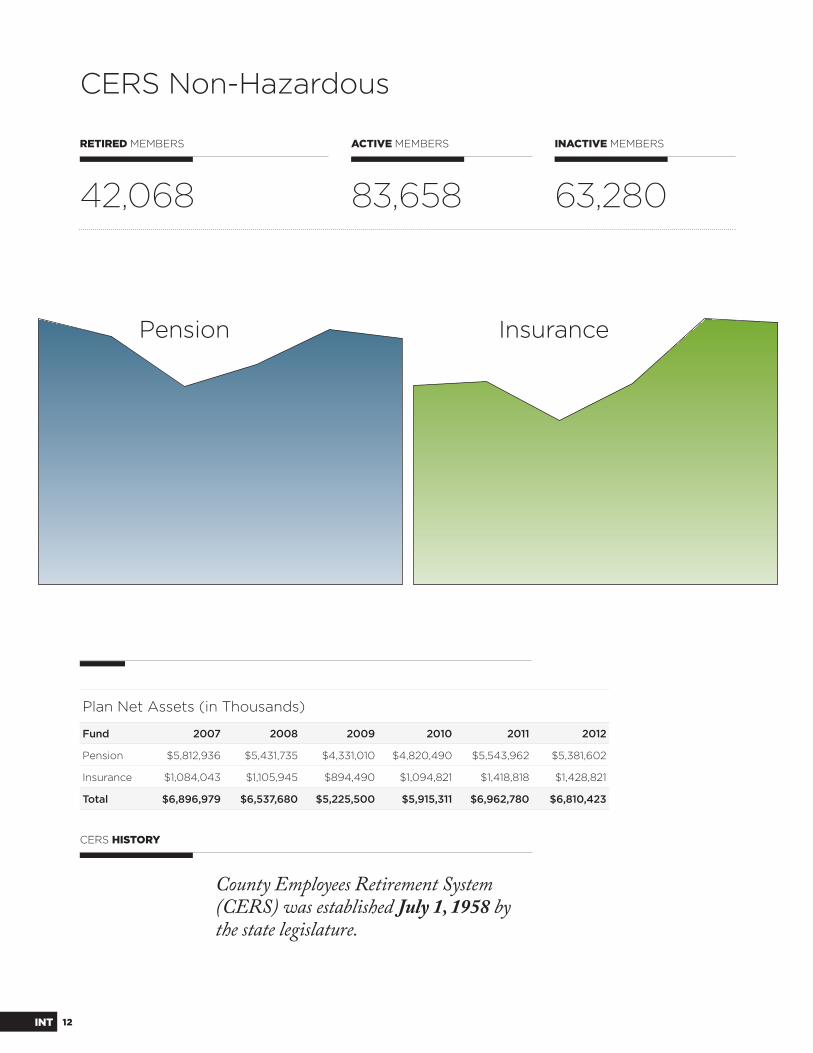
CERS Non-Hazardous
RETIRED MEMBERS
42,068
ACTIVE MEMBERS
83,658
INACTIVE MEMBERS
63,280
County Employees Retirement System (CERS) was established July 1, 1958 by the state legislature.
Plan Net Assets (in Thousands)
Fund 2007 2008 2009 2010 2011 2012
Pension $5,812,936 $5,431,735 $4,331,010 $4,820,490 $5,543,962 $5,381,602
Insurance $1,084,043 $1,105,945 $894,490 $1,094,821 $1,418,818 $1,428,821
Total $6,896,979 $6,537,680 $5,225,500 $5,915,311 $6,962,780 $6,810,423
CERS HISTORY
Pension Insurance
13 INT
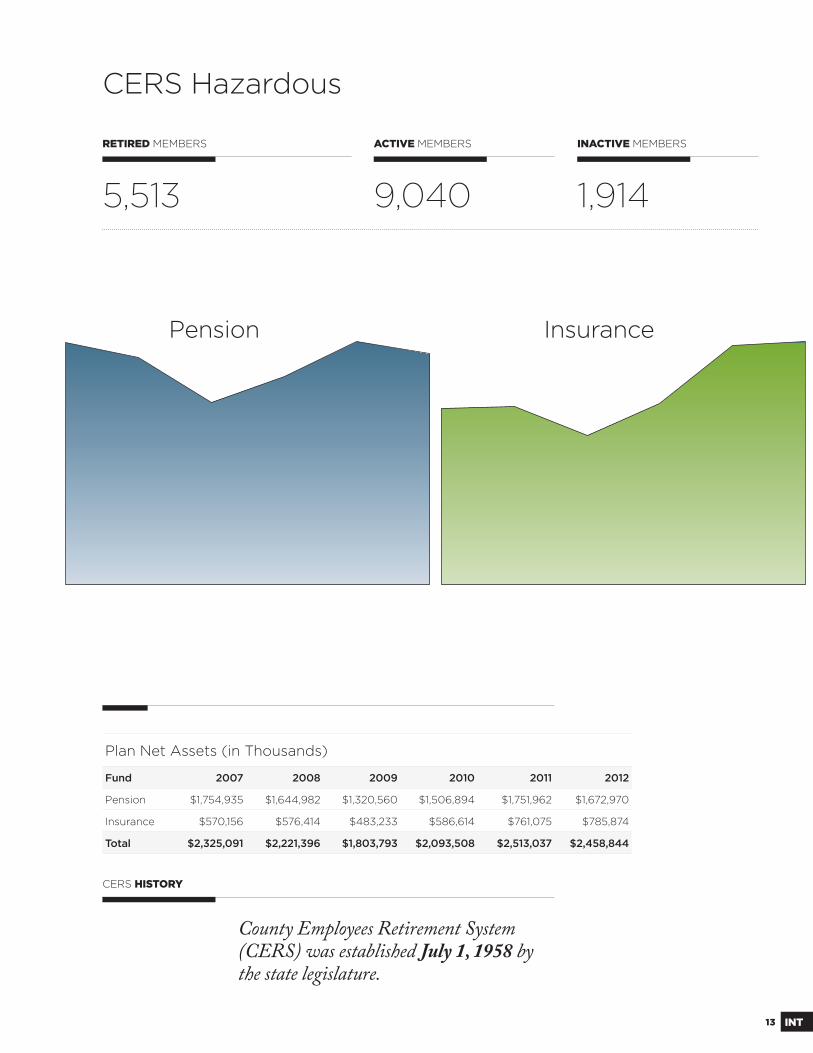
CERS Hazardous
RETIRED MEMBERS
5,513
ACTIVE MEMBERS
9,040
INACTIVE MEMBERS
1,914
County Employees Retirement System (CERS) was established July 1, 1958 by the state legislature.
Plan Net Assets (in Thousands)
Fund 2007 2008 2009 2010 2011 2012
Pension $1,754,935 $1,644,982 $1,320,560 $1,506,894 $1,751,962 $1,672,970
Insurance $570,156 $576,414 $483,233 $586,614 $761,075 $785,874
Total $2,325,091 $2,221,396 $1,803,793 $2,093,508 $2,513,037 $2,458,844
CERS HISTORY
Pension Insurance
14INT
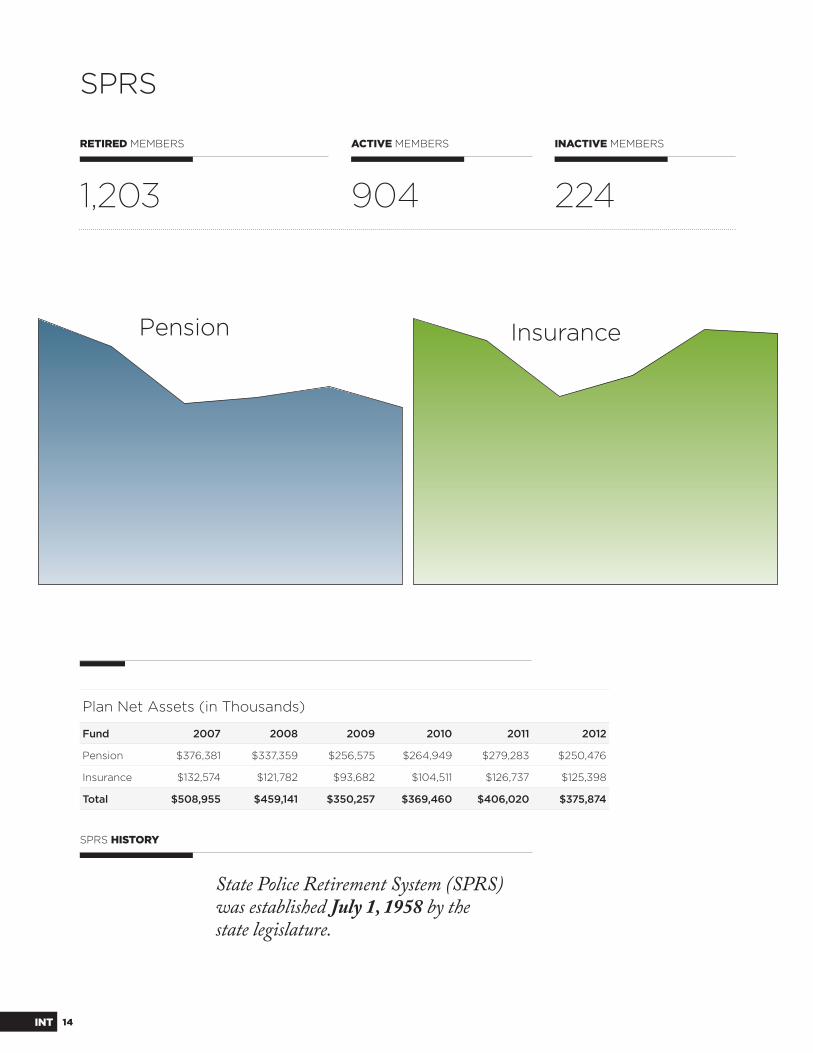
SPRS
RETIRED MEMBERS
1,203
ACTIVE MEMBERS
904
INACTIVE MEMBERS
224
State Police Retirement System (SPRS) was established July 1, 1958 by thestate legislature.
Plan Net Assets (in Thousands)
Fund 2007 2008 2009 2010 2011 2012
Pension $376,381 $337,359 $256,575 $264,949 $279,283 $250,476
Insurance $132,574 $121,782 $93,682 $104,511 $126,737 $125,398
Total $508,955 $459,141 $350,257 $369,460 $406,020 $375,874
SPRS HISTORY
Pension Insurance
15 INT
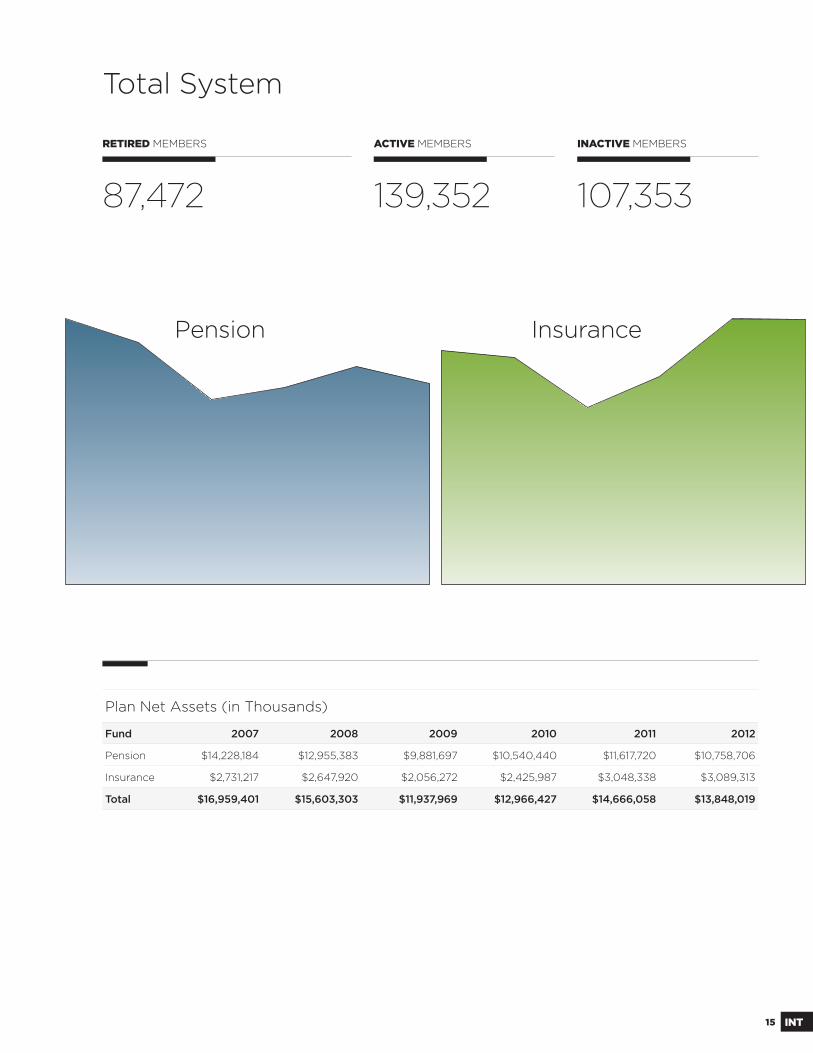
Total System
RETIRED MEMBERS
87,472
ACTIVE MEMBERS
139,352
INACTIVE MEMBERS
107,353
Plan Net Assets (in Thousands)
Fund 2007 2008 2009 2010 2011 2012
Pension $14,228,184 $12,955,383 $9,881,697 $10,540,440 $11,617,720 $10,758,706
Insurance $2,731,217 $2,647,920 $2,056,272 $2,425,987 $3,048,338 $3,089,313
Total $16,959,401 $15,603,303 $11,937,969 $12,966,427 $14,666,058 $13,848,019
Pension Insurance

17 Independent Auditors' Report
18 Management's Discussion & Analysis
Basic Financial Statements 23 Combining Statement of Plan Net Assets for Pension Funds 24 Combining Statement of Changes in Plan Net Assets for Pension Funds 25 Combining Statement of Plan Net Assets for Insurance Funds 26 Combining Statement of Changes in Plan Net Assets for Insurance Funds
Notes to the Financial Statements 27 Note A. Summary of Signifi cant Accounting Policies 29 Note B. Plan Descriptions & Contribution Information 36 Note C. Cash, Short-Term Investments & Securities Lending Collateral 37 Note D. Investments 47 Note E. Securities Lending Transactions 48 Note F. Risk of Loss 49 Note G. Contingencies 49 Note H. Income Tax Status 49 Note I. Defi ned Benefi t Pension Plan 50 Note J. Equipment 50 Note K. Intangible Assets 51 Note L. Actuarial Valuation 53 Note M. House Bill 1 Pension Reform 54 Note N. Medicare Prescription Drug Plan 54 Note O. House Bill 300 Pension Reform 55 Note P. Reimbursement of Retired- Reemployed Health Insurance 55 Note Q. Louisville/Jeff erson County Metro Firefi ghters 56 Note R. Reciprocity Agreement 56 Note S. Restatement of Prior Year Financial Statements 56 Note T. Subsequent Events
57 Required Supplementary Information
67 Additional Supporting Schedules
FINANCIAL TABLE OF CONTENTS
iii i lllllFFFFFFiiiiiinnnnnnnnnnnnnnnaaaaaaaaaaaaaaaannnnnnnnnnnnnnnnnnnccccccccccccciiiiaaaaaallllllll nSSSSSSSSSSSSSSSSSSSSSSSSSSSSSSSSSeeeeeeeeeeeeeeeeeeeeeeeeeeeeeeeeeeeeccccccccccccccccccccccccccttttttttttttttttttttttttiiiiiiiiioooooooooooooooooooooooonnnnnnnnnnnnnnnnn
17 FIN
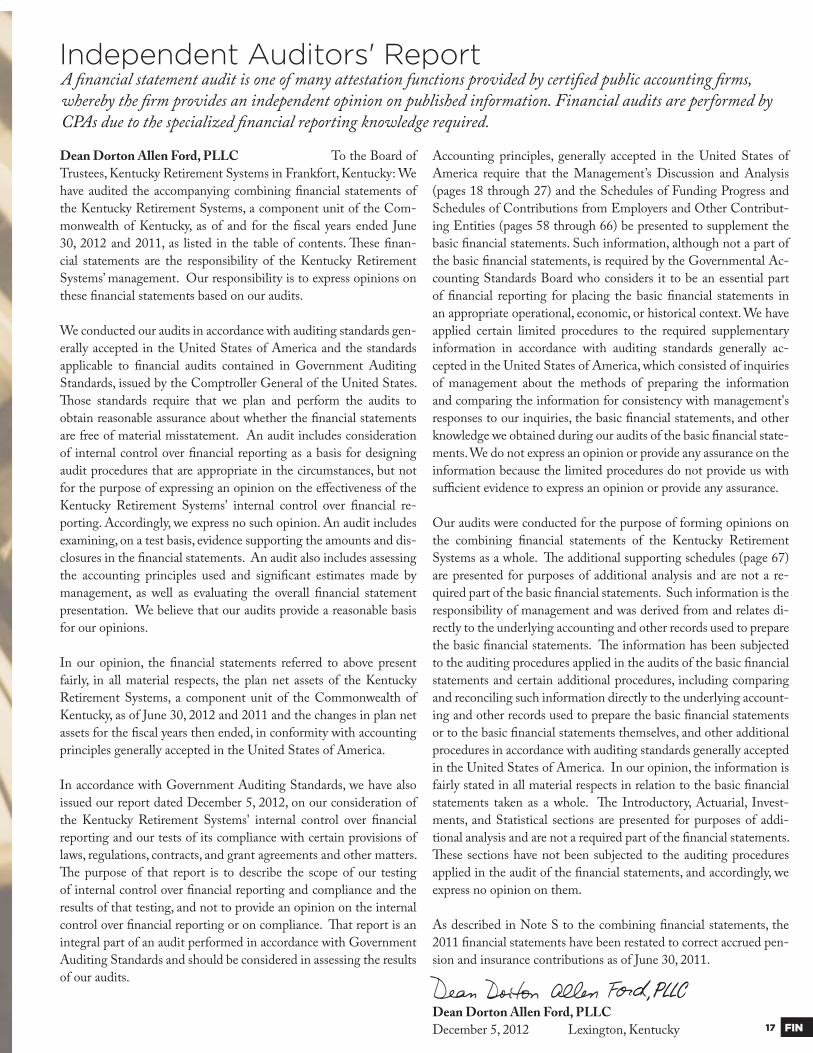
Independent Auditors' ReportA fi nancial statement audit is one of many attestation functions provided by certifi ed public accounting fi rms, whereby the fi rm provides an independent opinion on published information. Financial audits are performed by CPAs due to the specialized fi nancial reporting knowledge required.
Dean Dorton Allen Ford, PLLC To the Board of
Trustees, Kentucky Retirement Systems in Frankfort, Kentucky: We
have audited the accompanying combining fi nancial statements of
the Kentucky Retirement Systems, a component unit of the Com-
monwealth of Kentucky, as of and for the fi scal years ended June
30, 2012 and 2011, as listed in the table of contents. Th ese fi nan-
cial statements are the responsibility of the Kentucky Retirement
Systems’ management. Our responsibility is to express opinions on
these fi nancial statements based on our audits.
We conducted our audits in accordance with auditing standards gen-
erally accepted in the United States of America and the standards
applicable to fi nancial audits contained in Government Auditing
Standards, issued by the Comptroller General of the United States.
Th ose standards require that we plan and perform the audits to
obtain reasonable assurance about whether the fi nancial statements
are free of material misstatement. An audit includes consideration
of internal control over fi nancial reporting as a basis for designing
audit procedures that are appropriate in the circumstances, but not
for the purpose of expressing an opinion on the eff ectiveness of the
Kentucky Retirement Systems' internal control over fi nancial re-
porting. Accordingly, we express no such opinion. An audit includes
examining, on a test basis, evidence supporting the amounts and dis-
closures in the fi nancial statements. An audit also includes assessing
the accounting principles used and signifi cant estimates made by
management, as well as evaluating the overall fi nancial statement
presentation. We believe that our audits provide a reasonable basis
for our opinions.
In our opinion, the fi nancial statements referred to above present
fairly, in all material respects, the plan net assets of the Kentucky
Retirement Systems, a component unit of the Commonwealth of
Kentucky, as of June 30, 2012 and 2011 and the changes in plan net
assets for the fi scal years then ended, in conformity with accounting
principles generally accepted in the United States of America.
In accordance with Government Auditing Standards, we have also
issued our report dated December 5, 2012, on our consideration of
the Kentucky Retirement Systems' internal control over fi nancial
reporting and our tests of its compliance with certain provisions of
laws, regulations, contracts, and grant agreements and other matters.
Th e purpose of that report is to describe the scope of our testing
of internal control over fi nancial reporting and compliance and the
results of that testing, and not to provide an opinion on the internal
control over fi nancial reporting or on compliance. Th at report is an
integral part of an audit performed in accordance with Government
Auditing Standards and should be considered in assessing the results
of our audits.
Accounting principles, generally accepted in the United States of
America require that the Management’s Discussion and Analysis
(pages 18 through 27) and the Schedules of Funding Progress and
Schedules of Contributions from Employers and Other Contribut-
ing Entities (pages 58 through 66) be presented to supplement the
basic fi nancial statements. Such information, although not a part of
the basic fi nancial statements, is required by the Governmental Ac-
counting Standards Board who considers it to be an essential part
of fi nancial reporting for placing the basic fi nancial statements in
an appropriate operational, economic, or historical context. We have
applied certain limited procedures to the required supplementary
information in accordance with auditing standards generally ac-
cepted in the United States of America, which consisted of inquiries
of management about the methods of preparing the information
and comparing the information for consistency with management's
responses to our inquiries, the basic fi nancial statements, and other
knowledge we obtained during our audits of the basic fi nancial state-
ments. We do not express an opinion or provide any assurance on the
information because the limited procedures do not provide us with
suffi cient evidence to express an opinion or provide any assurance.
Our audits were conducted for the purpose of forming opinions on
the combining fi nancial statements of the Kentucky Retirement
Systems as a whole. Th e additional supporting schedules (page 67)
are presented for purposes of additional analysis and are not a re-
quired part of the basic fi nancial statements. Such information is the
responsibility of management and was derived from and relates di-
rectly to the underlying accounting and other records used to prepare
the basic fi nancial statements. Th e information has been subjected
to the auditing procedures applied in the audits of the basic fi nancial
statements and certain additional procedures, including comparing
and reconciling such information directly to the underlying account-
ing and other records used to prepare the basic fi nancial statements
or to the basic fi nancial statements themselves, and other additional
procedures in accordance with auditing standards generally accepted
in the United States of America. In our opinion, the information is
fairly stated in all material respects in relation to the basic fi nancial
statements taken as a whole. Th e Introductory, Actuarial, Invest-
ments, and Statistical sections are presented for purposes of addi-
tional analysis and are not a required part of the fi nancial statements.
Th ese sections have not been subjected to the auditing procedures
applied in the audit of the fi nancial statements, and accordingly, we
express no opinion on them.
As described in Note S to the combining fi nancial statements, the
2011 fi nancial statements have been restated to correct accrued pen-
sion and insurance contributions as of June 30, 2011.
Dean Dorton Allen Ford, PLLC
December 5, 2012 Lexington, Kentucky

18FIN
Pension Fund Th e following highlights are explained in
more detail later in this discussion.
v Th e combined plan net assets of all pension funds
administered by Kentucky Retirement Systems decreased by
$859.1 million during fi scal 2012.
v Member and Employer contributions reported for fi s-
cal 2012, totaled $877.4 million compared to $819.2
million (as restated) in fi scal 2011. Th is increase is due to an
increase in the employer contribution rates and the collection of
additional health insurance contributions passed by House Bill
1 in September 1, 2008.
v Th e Pension Funds’ Net Assets as of June 30, 2011, and the
increase in the Pension Funds for the fi scal year then ended,
have been restated to correct accrued contributions as of June 30,
2011. Th e net eff ect of this correction for reporting purposes is a
decrease of $62.8 million in pension contributions for the fi scal
year ended June 30, 2011, and a corresponding decrease in the
Pension Funds’ Net Assets as of June 30, 2011. Th e restatement
resulted from the double posting of an accrual of contributions
in fi scal 2011.
v Th e net depreciation in the fair value of investments was $261.2
million for the fi scal year ended June 30, 2012 compared to net
appreciation of $1,658.5 million for the prior fi scal year. In-
cluded in this net depreciation in fi scal 2012 were realized losses
on sales of investments of $22.8 million.
v Th e plan allocations for the Pension Investment Accounts in
which exposure to the Record Currency Management Dynamic
Currency Hedging Program (RCM) were adjusted. Th is ad-
justment is a revision of previously estimated plan allocation
percentages applied. Individual gains and losses were revised
using updated estimates; however, there was no change to the
net balance of the RCM Pension Account. An additional minor
adjustment may be needed once fi nal disposition of the RCM
account is complete. In accordance with accounting principles
generally accepted in the United States, this is deemed a change
in estimate. A change in estimate is accounted for only in cur-
rent and future years; prior years are not adjusted. Th e audited
fi nancial statements for fi scal 2012 include Footnote D regard-
ing the nature and reasons for the change.
v Interest, dividend and net securities lending income was $270.3
million compared to $300.9 million in fi scal 2011.
v Pension benefi ts paid to retirees and benefi ciaries totaled
$1,649.2 million compared to $1,591.5 million in fi scal 2011.
Refund of contributions paid to former members upon termina-
tion of employment totaled $30.9 million compared to $27.5
million in fi scal 2011.
v Administrative expense totaled $27.8 million compared to $24.9
million in the prior fi scal year. A supplemental appropriation of
$12.96 million was approved by the State Budget Offi ce in fi scal
2012. Th is supplemental appropriation enabled KRS to imple-
ment the recommendations of the Kentucky Auditor of Public
Accounts to include certain health and investment administra-
tive expenses for the fi rst time in the KRS administrative bud-
get. Capital Project Expenses incurred, as a result of the START
Project, totaled approximately $17,000. Certain START Project
costs were capitalized in fi scal 2012 between fi xed assets and
intangible assets, as appropriate.
v Th e Kentucky Auditor of Public Accounts recommended that
KRS include expenses for the health care fees, investments, and
internal audit as separate line items of the Administrative Ex-
pense budget. Th is has been implemented in fi scal 2012; see
pages 67 and 68.
v Th e member health insurance contribution, as a result of the
passage of House Bill 1 (eff ective September 1, 2008) to-
taled $11.9 million, for the fi scal year ended June 30, 2012,
compared to $6.6 million (as restated) in the prior fi scal year.
Insurance Fund Th e following highlights are
explained in more detail later in this discussion.
v Th e combined plan net assets of the insurance fund adminis-
tered by Kentucky Retirement Systems increased by $41.1 mil-
lion during fi scal 2012.
v Premiums received from retirees who participated in the Medi-
care eligible self-funded plan totaled $28.4 million, compared
to $31 million in the prior fi scal year. Th e decrease is a result of
CMS paying a portion of the retirees' premium. In addition, the
decrease is attributable to changes in coverage chosen by retirees.
v Employer contributions of $436.2 million were received com-
pared to $387.5 million (as restated) in fi scal 2011. Th is increase
is due to an increase in the insurance contribution rate.
v Th e Insurance Funds’ net assets as of June 30, 2011, and the
increase in the insurance funds for the fi scal year then ended,
have been restated to correct accrued contributions as of June
30, 2011. Th e net eff ect of this correction for reporting pur-
poses is a decrease of $48.5 million in insurance contributions
Management's Discussion & AnalysisTh is discussion and analysis of Kentucky Retirement Systems' fi nancial performance provides an overview of the pension and insurance fund fi nancial activities for the fi scal year ended June 30, 2012. Please read it in conjunction with the fi nancial statements, which begin on page 23.

19 FIN
for the fi scal year ended June 30, 2011, and a corresponding
decrease in the Insurance Funds’ net assets as of June 30, 2011.
Th e restatement resulted from the double posting of an accrual
of contributions in fi scal 2011.
v Th e Employer Group Waiver Plan receipts from the Centers
for Medicare & Medicaid Services (CMS) subsidies totaled
$17.8 million compared to $22.1 million in fi scal 2011. Chang-
es in receipts depend upon the fl uctuation of membership in
the Plan.
v Th e net depreciation in the fair value of investments was $118.7
million compared to net appreciation of $517.0 million for the
prior fi scal year. Included in this net depreciation in fi scal 2012
were realized losses on sales of investments of $97.7 million.
v Th e plan allocations for the Insurance Investment Accounts
in which exposure to the Record Currency Management Dy-
namic Currency Hedging Program (RCM) were adjusted. Th is
adjustment is a revision of previously estimated plan allocation
percentages applied. Individual gains and losses were revised
using updated estimates; however, there was no change to the
net balance of the RCM Insurance Account. An additional
minor adjustment may be needed once fi nal disposition of the
RCM account is complete. In accordance with accounting prin-
ciples generally accepted in the United States, this is deemed a
change in estimate. A change in estimate is accounted for only
in current and future years; prior years are not adjusted. Th e
audited fi nancial statements for fi scal 2012 include Footnote D
regarding the nature and reasons for the change.
v Interest, dividend and net securities lending income was $71.4
million compared to $53.1 million in fi scal 2011.
v Premiums paid by the fund for hospital and medical insurance
coverage (under age 65) totaled $248.3 million. Payments for
the self-funded healthcare reimbursements (over age 65) to-
taled $132.1 million. Th e total of insurance premiums paid
plus self-funded reimbursements was $380.4 million for fi scal
2012. Insurance premiums paid plus self-funded healthcare
reimbursements for the prior plan year totaled $373.1 million.
On August 6, 2012, the Board of Trustees voted to cease self-
funding of healthcare benefi ts for most KRS Medicare eligible
retirees. Th e Board elected to contract with Humana Insur-
ance Company to provide healthcare benefi ts to KRS’ retirees
through a fully insured Medicare Advantage Plan. Th e Hu-
mana Medicare Advantage Plan becomes eff ective January 1,
2013.
v As part of the application process to the Centers for Medicare
& Medicaid Services to enter into a contract to off er a Medi-
care Prescription Drug Plan, Kentucky Retirement Systems
was required to establish a segregated Insolvency Account in
the amount of $100,000; this account must retain a minimum
balance of $100,000. Th e account consists of cash and/or cash
equivalents, and is invested on a daily basis. Th e balance as of
June 30, 2012, totaled $100,691.
v Th e reimbursement of retired-reemployed health insurance, as
a result of the passage of House Bill 1 (eff ective September 1,
2008), totaled $6.3 million for the fi scal year ended June 30,
2012, compared to $4.0 million in the prior fi scal year.
Using Th is Financial Report Because of the long-term
nature of a defi ned benefi t pension plan and post-employment
healthcare benefi t plan, the fi nancial statements alone cannot
provide suffi cient information to properly refl ect the plan's ongo-
ing plan perspective. Th is fi nancial report consists of two fi nancial
statements and two required schedules of historical trend informa-
tion. Th e Combining Statement of Plan Net Assets for the Pension
Funds, on page 23, and the Combining Statement of Plan Net As-
sets for the Insurance Fund, on page 25, provide a snapshot of the
fi nancial position of each of the three systems at June 30, 2012. Th e
Combining Statement of Changes in Plan Net Assets for the Pen-
sion Funds, on page 24, and the Combining Statement of Changes
in Plan Net Assets for the Insurance Fund, on page 26, summarize
the additions and deductions that occurred for each of the three
systems during fi scal 2012.
Th e Schedules of Funding Progress, on pages 58-61, includes his-
torical trend information about the actuarially funded status of each
plan from a long-term, ongoing plan perspective and the progress
made in accumulating suffi cient assets to pay benefi ts and insurance
premiums when due. Th e Schedules of Contributions from Em-
ployers and Other Contributing Entities, on pages 62-66, presents
historical trend information about the annual required contribu-
tions and the contributions made in relation to the requirement.
Th ese schedules provide information that contributes to under-
standing the changes over time in the funded status of the plans.
Funds as a Whole Kentucky Retirement Systems’ combined
plan net assets decreased, during the fi scal year ended June 30, 2012,
by $818 million from $14,666 million to $13,848 million. Restated
plan net assets for the prior fi scal year increased by $1,699.6 million.
Th e decrease in plan net assets for the plan year ended June 30,
2012 is primarily attributable to an increase in benefi t payments,
a decrease in member contributions, a net depreciation in the fair
value of investments, and a decrease in securities lending income.
Th e analysis below focuses on plan net assets (Table 1) and changes
in plan net assets (Table 2) of Kentucky Retirement Systems’ Pen-
sion and Insurance Funds.
Plan net assets of the pension funds decreased by $859.4 million
($10,758.7 million compared to $11,617.7 million). All of these
assets are restricted in use to provide monthly retirement allowances
to members who contributed to the pension funds as employees
and their benefi ciaries.
Plan net assets of the insurance fund increased by $41.4 million
($3,089.7 million compared to $3,048.3 million). All of these as-
sets are restricted in use to provide hospital and medical insurance
benefi ts to members of the pension funds who receive a monthly
retirement allowance. Th e increase in net plan assets is primar-
ily attributable to the increase in employer contribution rates for
insurance.
20FIN
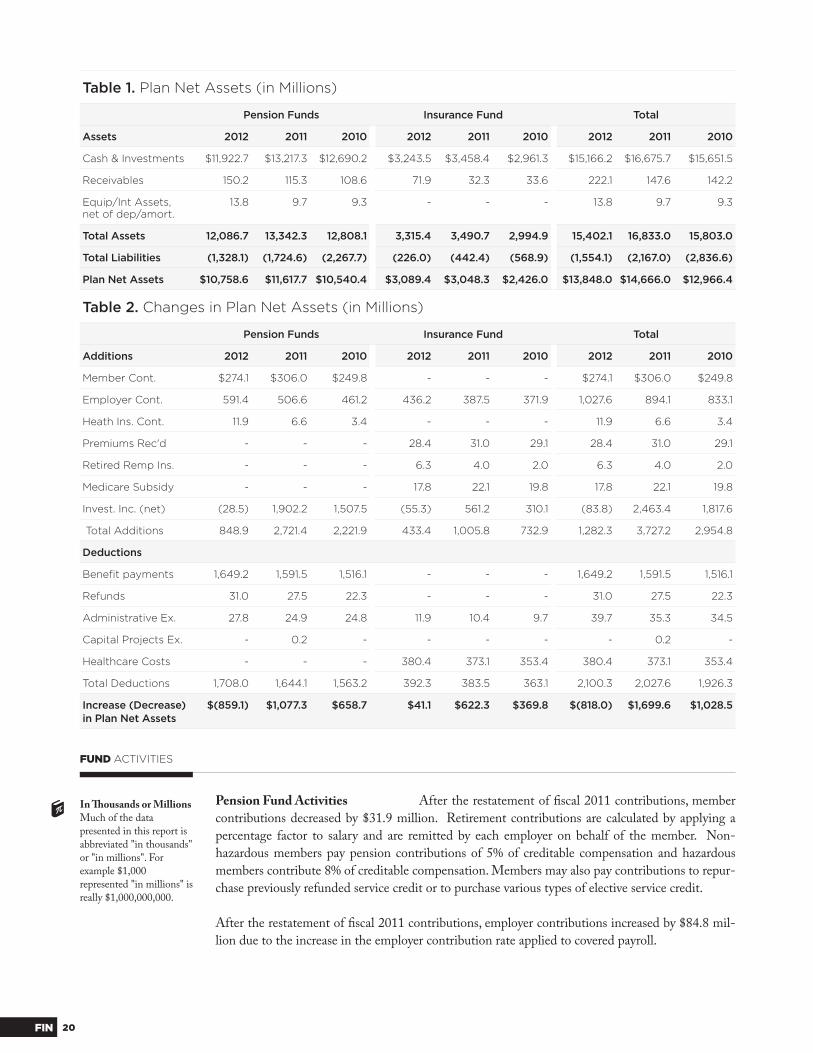
Table 1. Plan Net Assets (in Millions)
Pension Funds Insurance Fund Total
Assets 2012 2011 2010 2012 2011 2010 2012 2011 2010
Cash & Investments $11,922.7 $13,217.3 $12,690.2 $3,243.5 $3,458.4 $2,961.3 $15,166.2 $16,675.7 $15,651.5
Receivables 150.2 115.3 108.6 71.9 32.3 33.6 222.1 147.6 142.2
Equip/Int Assets, net of dep/amort.
13.8 9.7 9.3 - - - 13.8 9.7 9.3
Total Assets 12,086.7 13,342.3 12,808.1 3,315.4 3,490.7 2,994.9 15,402.1 16,833.0 15,803.0
Total Liabilities (1,328.1) (1,724.6) (2,267.7) (226.0) (442.4) (568.9) (1,554.1) (2,167.0) (2,836.6)
Plan Net Assets $10,758.6 $11,617.7 $10,540.4 $3,089.4 $3,048.3 $2,426.0 $13,848.0 $14,666.0 $12,966.4
Table 2. Changes in Plan Net Assets (in Millions)
Pension Funds Insurance Fund Total
Additions 2012 2011 2010 2012 2011 2010 2012 2011 2010
Member Cont. $274.1 $306.0 $249.8 - - - $274.1 $306.0 $249.8
Employer Cont. 591.4 506.6 461.2 436.2 387.5 371.9 1,027.6 894.1 833.1
Heath Ins. Cont. 11.9 6.6 3.4 - - - 11.9 6.6 3.4
Premiums Rec'd - - - 28.4 31.0 29.1 28.4 31.0 29.1
Retired Remp Ins. - - - 6.3 4.0 2.0 6.3 4.0 2.0
Medicare Subsidy - - - 17.8 22.1 19.8 17.8 22.1 19.8
Invest. Inc. (net) (28.5) 1,902.2 1,507.5 (55.3) 561.2 310.1 (83.8) 2,463.4 1,817.6
Total Additions 848.9 2,721.4 2,221.9 433.4 1,005.8 732.9 1,282.3 3,727.2 2,954.8
Deductions
Benefi t payments 1,649.2 1,591.5 1,516.1 - - - 1,649.2 1,591.5 1,516.1
Refunds 31.0 27.5 22.3 - - - 31.0 27.5 22.3
Administrative Ex. 27.8 24.9 24.8 11.9 10.4 9.7 39.7 35.3 34.5
Capital Projects Ex. - 0.2 - - - - - 0.2 -
Healthcare Costs - - - 380.4 373.1 353.4 380.4 373.1 353.4
Total Deductions 1,708.0 1,644.1 1,563.2 392.3 383.5 363.1 2,100.3 2,027.6 1,926.3
Increase (Decrease) in Plan Net Assets
$(859.1) $1,077.3 $658.7 $41.1 $622.3 $369.8 $(818.0) $1,699.6 $1,028.5
Pension Fund Activities After the restatement of fi scal 2011 contributions, member
contributions decreased by $31.9 million. Retirement contributions are calculated by applying a
percentage factor to salary and are remitted by each employer on behalf of the member. Non-
hazardous members pay pension contributions of 5% of creditable compensation and hazardous
members contribute 8% of creditable compensation. Members may also pay contributions to repur-
chase previously refunded service credit or to purchase various types of elective service credit.
After the restatement of fi scal 2011 contributions, employer contributions increased by $84.8 mil-
lion due to the increase in the employer contribution rate applied to covered payroll.
FUND ACTIVITIES
In Th ousands or MillionsMuch of the data presented in this report is abbreviated "in thousands" or "in millions". For example $1,000 represented "in millions" is really $1,000,000,000.
21 FIN
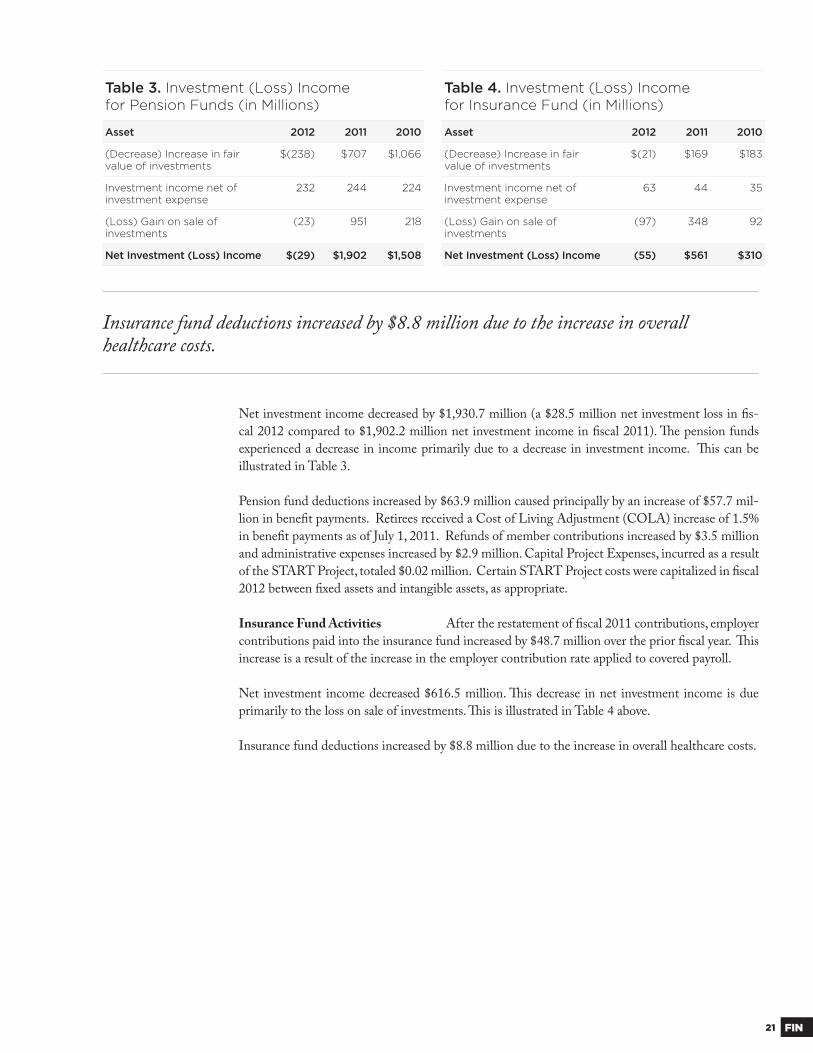
Table 3. Investment (Loss) Incomefor Pension Funds (in Millions)
Asset 2012 2011 2010
(Decrease) Increase in fair value of investments
$(238) $707 $1,066
Investment income net of investment expense
232 244 224
(Loss) Gain on sale of investments
(23) 951 218
Net Investment (Loss) Income $(29) $1,902 $1,508
Net investment income decreased by $1,930.7 million (a $28.5 million net investment loss in fi s-
cal 2012 compared to $1,902.2 million net investment income in fi scal 2011). Th e pension funds
experienced a decrease in income primarily due to a decrease in investment income. Th is can be
illustrated in Table 3.
Pension fund deductions increased by $63.9 million caused principally by an increase of $57.7 mil-
lion in benefi t payments. Retirees received a Cost of Living Adjustment (COLA) increase of 1.5%
in benefi t payments as of July 1, 2011. Refunds of member contributions increased by $3.5 million
and administrative expenses increased by $2.9 million. Capital Project Expenses, incurred as a result
of the START Project, totaled $0.02 million. Certain START Project costs were capitalized in fi scal
2012 between fi xed assets and intangible assets, as appropriate.
Insurance Fund Activities After the restatement of fi scal 2011 contributions, employer
contributions paid into the insurance fund increased by $48.7 million over the prior fi scal year. Th is
increase is a result of the increase in the employer contribution rate applied to covered payroll.
Net investment income decreased $616.5 million. Th is decrease in net investment income is due
primarily to the loss on sale of investments. Th is is illustrated in Table 4 above.
Insurance fund deductions increased by $8.8 million due to the increase in overall healthcare costs.
Insurance fund deductions increased by $8.8 million due to the increase in overall healthcare costs.
Table 4. Investment (Loss) Incomefor Insurance Fund (in Millions)
Asset 2012 2011 2010
(Decrease) Increase in fair value of investments
$(21) $169 $183
Investment income net of investment expense
63 44 35
(Loss) Gain on sale of investments
(97) 348 92
Net Investment (Loss) Income (55) $561 $310
22FIN
Accounting standards require that the Statement of Plan Net Assets state asset value
at fair value and include only benefi ts and refunds due plan members and benefi ciaries
and accrued investment and administrative expense as of the reporting date. Infor-
mation regarding the actuarial funding status of the Pension and Insurance Funds is
provided in the Schedules of Funding Progress on pages 58-61. Th e asset value stated
in the Schedules of Funding Progress is the actuarial value of assets. Th e actuarial
value of assets recognizes a portion of the diff erence between the market value of assets
and the expected market value of assets, based on the investment return assumption.
Th e amount recognized each year is 20% of the diff erence between market value and
expected market value. Th e actuarial accrued liability is calculated using the entry age
normal cost funding method. Th is actuarial accrued liability is the measure of the cost
of benefi ts that have been earned to date by Kentucky Retirement Systems’ members,
but not yet paid. Th e diff erence in value between the actuarial accrued liability and the
actuarial value of assets is defi ned as the unfunded actuarial accrued liability.
Th e unfunded actuarial accrued liability in the pension plans increased by $1,375.5mil-
lion for a total unfunded amount of $13,758 million for the fi scal year ended June
30, 2012, compared to an unfunded amount of $12,382.5 million for the fi scal year
ended June 30, 2011. In recent years, funding levels for the pension funds have fallen
dramatically due to investment returns less than the actuarially assumed rate, higher
than anticipated retirement rates, and expenditures for unfunded retiree Cost of Living
Adjustments. Within the KERS and SPRS plans, employer contribution rate reduc-
tions enacted by the Kentucky General Assembly have limited the plans' ability to
correct the declining funding levels.
Th e insurance plan’s unfunded actuarial accrued liability for the plan year ended June
30, 2012, decreased to $4,321.5 million from $6,837.7 million for the plan year ended
June 30, 2011. Th is is a decrease in the unfunded actuarial accrued liability of $2,516.2
million. Th is decrease is due to the change for the Medicare-eligible retirees from the
self-insured health plans to fully insured Medicare Advantage plans administered by
Humana.
Annual required contributions of the employers as actuarially determined and actual
contributions made by employers and other contributing entities in relation to the re-
quired contributions are provided in the Schedules of Contributions from Employers
and Other Contributing Entities on pages 62-66. Th e diff erence in the annual required
contributions and actual contributions made by employers and other contributing enti-
ties in the KERS and SPRS funds is attributable to the fact that the employer contribu-
tion rate set by the Kentucky General Assembly is less than the rate recommended by
the KRS Actuary and adopted by the KRS Board of Trustees.
KERSKentucky Employees Retirement System
CERSCounty Employees Retirement System
SPRSState Police Retirement System
HazHazardous (i.e. KERS Haz)
Non-HazNon-Hazardous (i.e. CERS Non-Haz)
HISTORICAL TRENDS
HazHazardous (i.e. KERS Haz)
Non-HazNon-Hazardous (i.e. CERS Non-Haz)
23 FIN
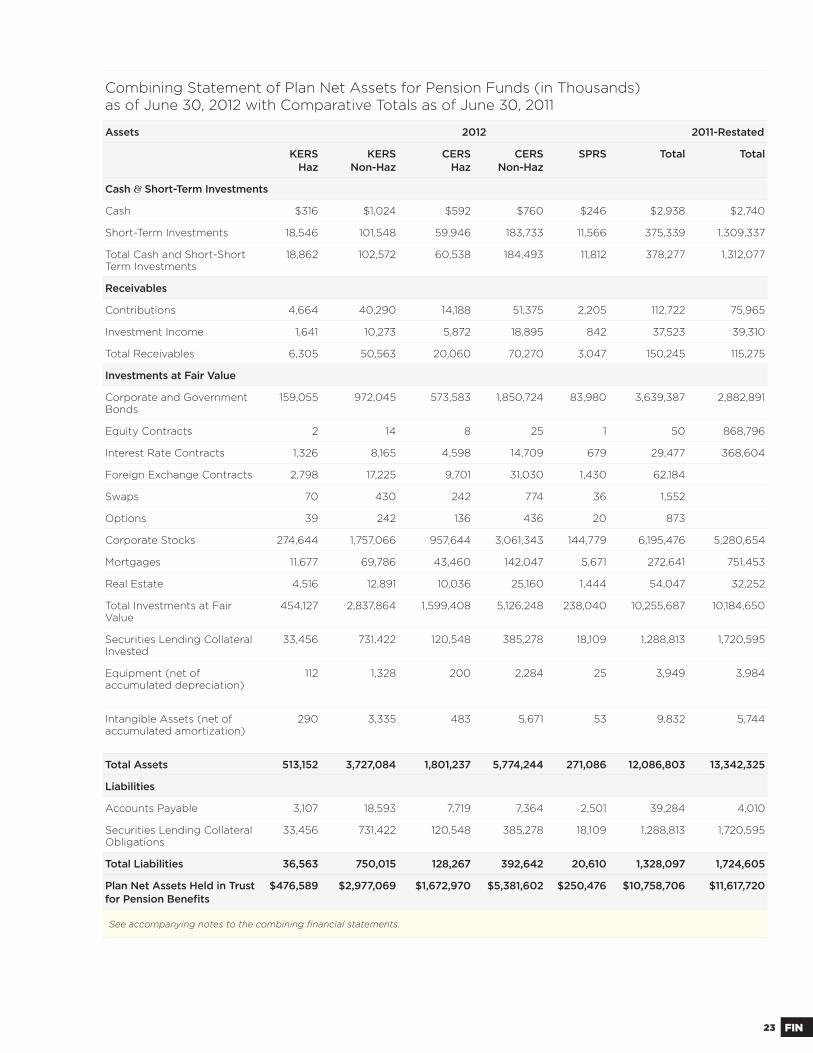
Combining Statement of Plan Net Assets for Pension Funds (in Thousands)as of June 30, 2012 with Comparative Totals as of June 30, 2011
Assets 2012 2011-Restated
KERSHaz
KERSNon-Haz
CERSHaz
CERSNon-Haz
SPRS Total Total
Cash & Short-Term Investments
Cash $316 $1,024 $592 $760 $246 $2,938 $2,740
Short-Term Investments 18,546 101,548 59,946 183,733 11,566 375,339 1,309,337
Total Cash and Short-Short Term Investments
18,862 102,572 60,538 184,493 11,812 378,277 1,312,077
Receivables
Contributions 4,664 40,290 14,188 51,375 2,205 112,722 75,965
Investment Income 1,641 10,273 5,872 18,895 842 37,523 39,310
Total Receivables 6,305 50,563 20,060 70,270 3,047 150,245 115,275
Investments at Fair Value
Corporate and Government Bonds
159,055 972,045 573,583 1,850,724 83,980 3,639,387 2,882,891
Equity Contracts 2 14 8 25 1 50 868,796
Interest Rate Contracts 1,326 8,165 4,598 14,709 679 29,477 368,604
Foreign Exchange Contracts 2,798 17,225 9,701 31,030 1,430 62,184
Swaps 70 430 242 774 36 1,552
Options 39 242 136 436 20 873
Corporate Stocks 274,644 1,757,066 957,644 3,061,343 144,779 6,195,476 5,280,654
Mortgages 11,677 69,786 43,460 142,047 5,671 272,641 751,453
Real Estate 4,516 12,891 10,036 25,160 1,444 54,047 32,252
Total Investments at Fair Value
454,127 2,837,864 1,599,408 5,126,248 238,040 10,255,687 10,184,650
Securities Lending Collateral Invested
33,456 731,422 120,548 385,278 18,109 1,288,813 1,720,595
Equipment (net of accumulated depreciation)
112 1,328 200 2,284 25 3,949 3,984
Intangible Assets (net of accumulated amortization)
290 3,335 483 5,671 53 9,832 5,744
Total Assets 513,152 3,727,084 1,801,237 5,774,244 271,086 12,086,803 13,342,325
Liabilities
Accounts Payable 3,107 18,593 7,719 7,364 2,501 39,284 4,010
Securities Lending Collateral Obligations
33,456 731,422 120,548 385,278 18,109 1,288,813 1,720,595
Total Liabilities 36,563 750,015 128,267 392,642 20,610 1,328,097 1,724,605
Plan Net Assets Held in Trust for Pension Benefi ts
$476,589 $2,977,069 $1,672,970 $5,381,602 $250,476 $10,758,706 $11,617,720
See accompanying notes to the combining fi nancial statements.
24FIN
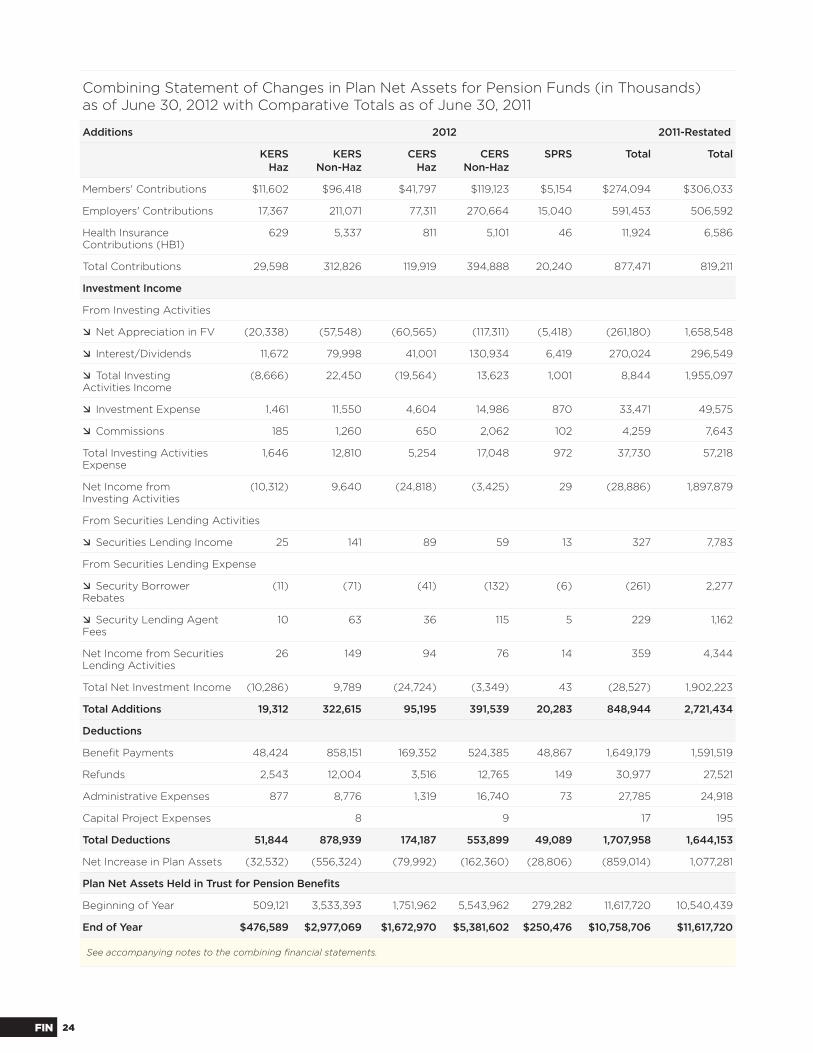
Combining Statement of Changes in Plan Net Assets for Pension Funds (in Thousands)as of June 30, 2012 with Comparative Totals as of June 30, 2011
Additions 2012 2011-Restated
KERSHaz
KERSNon-Haz
CERSHaz
CERSNon-Haz
SPRS Total Total
Members' Contributions $11,602 $96,418 $41,797 $119,123 $5,154 $274,094 $306,033
Employers' Contributions 17,367 211,071 77,311 270,664 15,040 591,453 506,592
Health Insurance Contributions (HB1)
629 5,337 811 5,101 46 11,924 6,586
Total Contributions 29,598 312,826 119,919 394,888 20,240 877,471 819,211
Investment Income
From Investing Activities
Net Appreciation in FV (20,338) (57,548) (60,565) (117,311) (5,418) (261,180) 1,658,548
Interest/Dividends 11,672 79,998 41,001 130,934 6,419 270,024 296,549
Total InvestingActivities Income
(8,666) 22,450 (19,564) 13,623 1,001 8,844 1,955,097
Investment Expense 1,461 11,550 4,604 14,986 870 33,471 49,575
Commissions 185 1,260 650 2,062 102 4,259 7,643
Total Investing Activities Expense
1,646 12,810 5,254 17,048 972 37,730 57,218
Net Income fromInvesting Activities
(10,312) 9,640 (24,818) (3,425) 29 (28,886) 1,897,879
From Securities Lending Activities
Securities Lending Income 25 141 89 59 13 327 7,783
From Securities Lending Expense
Security Borrower Rebates
(11) (71) (41) (132) (6) (261) 2,277
Security Lending Agent Fees
10 63 36 115 5 229 1,162
Net Income from Securities Lending Activities
26 149 94 76 14 359 4,344
Total Net Investment Income (10,286) 9,789 (24,724) (3,349) 43 (28,527) 1,902,223
Total Additions 19,312 322,615 95,195 391,539 20,283 848,944 2,721,434
Deductions
Benefi t Payments 48,424 858,151 169,352 524,385 48,867 1,649,179 1,591,519
Refunds 2,543 12,004 3,516 12,765 149 30,977 27,521
Administrative Expenses 877 8,776 1,319 16,740 73 27,785 24,918
Capital Project Expenses 8 9 17 195
Total Deductions 51,844 878,939 174,187 553,899 49,089 1,707,958 1,644,153
Net Increase in Plan Assets (32,532) (556,324) (79,992) (162,360) (28,806) (859,014) 1,077,281
Plan Net Assets Held in Trust for Pension Benefi ts
Beginning of Year 509,121 3,533,393 1,751,962 5,543,962 279,282 11,617,720 10,540,439
End of Year $476,589 $2,977,069 $1,672,970 $5,381,602 $250,476 $10,758,706 $11,617,720
See accompanying notes to the combining fi nancial statements.
25 FIN
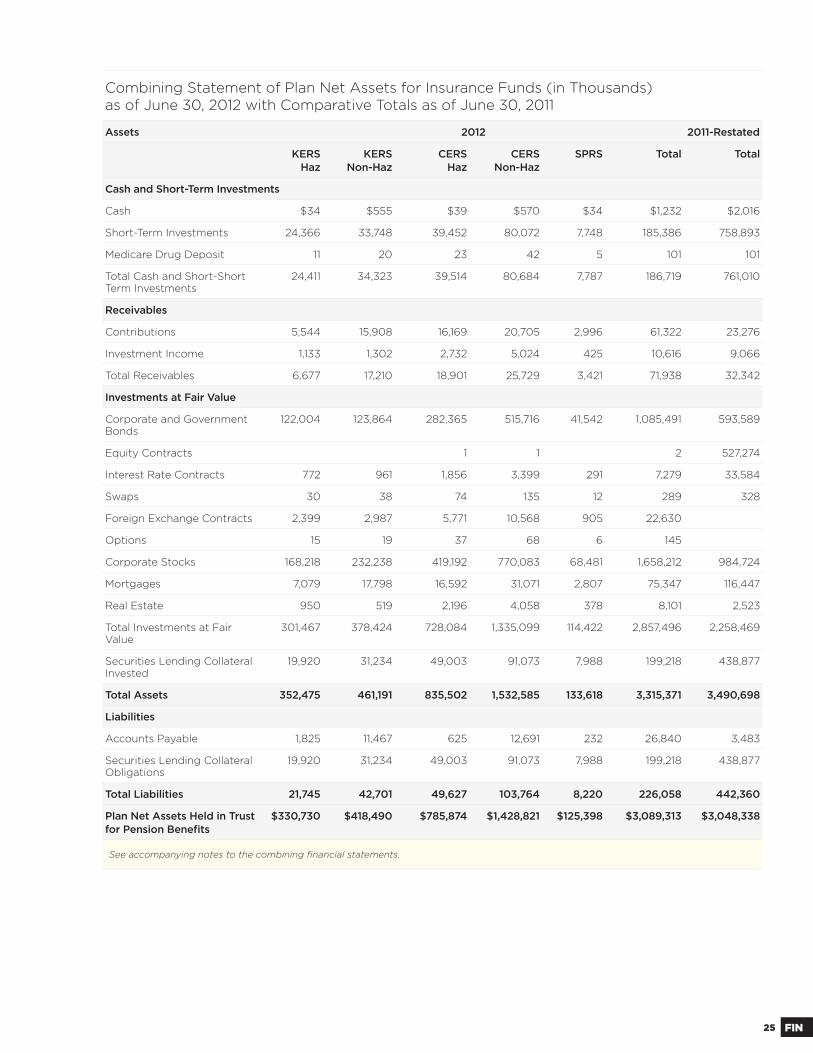
Combining Statement of Plan Net Assets for Insurance Funds (in Thousands)as of June 30, 2012 with Comparative Totals as of June 30, 2011
Assets 2012 2011-Restated
KERSHaz
KERSNon-Haz
CERSHaz
CERSNon-Haz
SPRS Total Total
Cash and Short-Term Investments
Cash $34 $555 $39 $570 $34 $1,232 $2,016
Short-Term Investments 24,366 33,748 39,452 80,072 7,748 185,386 758,893
Medicare Drug Deposit 11 20 23 42 5 101 101
Total Cash and Short-Short Term Investments
24,411 34,323 39,514 80,684 7,787 186,719 761,010
Receivables
Contributions 5,544 15,908 16,169 20,705 2,996 61,322 23,276
Investment Income 1,133 1,302 2,732 5,024 425 10,616 9,066
Total Receivables 6,677 17,210 18,901 25,729 3,421 71,938 32,342
Investments at Fair Value
Corporate and Government Bonds
122,004 123,864 282,365 515,716 41,542 1,085,491 593,589
Equity Contracts 1 1 2 527,274
Interest Rate Contracts 772 961 1,856 3,399 291 7,279 33,584
Swaps 30 38 74 135 12 289 328
Foreign Exchange Contracts 2,399 2,987 5,771 10,568 905 22,630
Options 15 19 37 68 6 145
Corporate Stocks 168,218 232,238 419,192 770,083 68,481 1,658,212 984,724
Mortgages 7,079 17,798 16,592 31,071 2,807 75,347 116,447
Real Estate 950 519 2,196 4,058 378 8,101 2,523
Total Investments at Fair Value
301,467 378,424 728,084 1,335,099 114,422 2,857,496 2,258,469
Securities Lending Collateral Invested
19,920 31,234 49,003 91,073 7,988 199,218 438,877
Total Assets 352,475 461,191 835,502 1,532,585 133,618 3,315,371 3,490,698
Liabilities
Accounts Payable 1,825 11,467 625 12,691 232 26,840 3,483
Securities Lending Collateral Obligations
19,920 31,234 49,003 91,073 7,988 199,218 438,877
Total Liabilities 21,745 42,701 49,627 103,764 8,220 226,058 442,360
Plan Net Assets Held in Trust for Pension Benefi ts
$330,730 $418,490 $785,874 $1,428,821 $125,398 $3,089,313 $3,048,338
See accompanying notes to the combining fi nancial statements.

26FIN
Combining Statement of Changes in Plan Net Assets for Insurance Funds (in Thousands)as of June 30, 2012 with Comparative Totals as of June 30, 2011
Additions 2012 2011-Restated
KERSHaz
KERSNon-Haz
CERSHaz
CERSNon-Haz
SPRS Total Total
Employers' Contributions $23,984 $146,844 $90,204 $164,297 $10,808 $436,137 $387,525
Employer Group Waiver Plan 351 7,856 871 8,443 279 17,800 22,129
Premiums Received from Retirees
339 12,229 290 15,525 20 28,403 30,959
Retired Reemployed Healthcare (HBI)
537 3,437 405 1,968 2 6,349 4,042
Total Contributions 25,211 170,366 91,770 190,233 11,109 488,689 444,655
Investment Income
From Investing Activities
Net Appreciation in FV (6,675) (12,575) (32,299) (63,013) (4,139) (118,701) 517,042
Interest/Dividends 7,702 9,167 17,951 33,381 3,040 71,241 51,808
Total InvestingActivities Income
1,027 (3,408) (14,348) (29,632) (1,099) (47,460) 568,850
Investment Expense 857 1,196 1,517 2,870 314 6,754 7,752
Commissions 128 224 304 568 51 1,275 1,236
Total Investing Activities Expense
985 1,420 1,821 3,438 365 8,029 8,988
Net Income fromInvesting Activities
42 (4,828) (16,169) (33,070) (1,464) (55,489) 559,862
From Securities Lending Activities
Securities Lending Income 9 12 21 39 3 84 1,891
From Securities Lending Expense
Security Borrower Rebates (16) (23) (38) (70) (6) (153) 240
Security Lending Agent Fees
7 10 17 31 3 68 325
Net Income from Securities Lending Activities
18 25 42 78 6 169 1,326
Total Net Investment Income 60 (4,803) (16,127) (32,992) (1,458) (55,320) 561,188
Total Additions 25,271 165,563 75,643 157,241 9,651 433,369 1,005,843
Deductions
Healthcare Premiums Subsidies 11,047 104,900 44,225 79,378 8,728 248,278 242,818
Administrative Fees 335 5,203 688 5,545 201 11,972 10,412
Self Funding Insurance Costs 2,894 58,941 5,930 62,316 2,063 132,144 130,260
Total Deductions 14,276 169,044 50,843 147,239 10,992 392,394 383,490
Net Increase in Plan Assets 10,995 (3,481) 24,800 10,002 (1,341) 40,975 622,353
Plan Net Assets Held in Trust for Insurance Benefi ts
Beginning of Year 319,735 421,971 761,074 1,418,819 126,739 3,048,338 2,425,985
End of Year $330,730 $418,490 $785,874 $1,428,821 $125,398 $3,089,313 $3,048,338
See accompanying notes to the combining fi nancial statements.
27 FIN
NOTE A.
Basis of Accounting KRS' combining fi nancial statements are prepared using the
accrual basis of accounting. Plan member contributions are recognized in the period in
which contributions are due. Employer contributions to the plan are recognized when
due and the employer has made a formal commitment to provide the contributions. Ben-
efi ts and refunds are recognized when due and payable in accordance with terms of the
plan. Premium payments are recognized when due and payable in accordance with terms
of the plan. Administrative and investment expenses are recognized when incurred.
Methods Used to Value Investments Investments are reported at fair
value. Fair value is the price that would be received to sell an asset or paid to transfer a
liability in an orderly transaction between market participants at the measurement date.
Short-term investments are reported at cost, which approximates fair value. See Note D
for further discussion of fair value measurements. Purchases and sales of securities are
recorded on a trade date basis. Interest income is recorded on the accrual basis. Dividends
are recorded on the ex-dividend date. Gain (loss) on investments includes KRS gains and
losses on investments bought and sold as well as held during the fi scal year.
Estimates Th e preparation of fi nancial statements in accordance with
accounting principles generally accepted in the United States of America requires man-
agement to make estimates and assumptions that aff ect certain reported amounts and
disclosures. Accordingly, actual results could diff er from those estimates.
Equipment Equipment is valued at historical cost and depreciation is
computed utilizing the straight-line method over the estimated useful lives of the as-
sets ranging from three to ten years. Improvements, which increase the useful life of the
equipment, are capitalized. Maintenance and repairs are charged to expense as incurred.
Th e capitalization threshold used in fi scal years ended June 30, 2012 and 2011 was $3,000
(see Note J for further information).
Although the assets of the plans are commingled for investment purposes, each plan's assets may be used only for the payment of benefi ts to the members of that plan, and a pro-rata share of administrative costs in accordance with the provisions of KRS Sections 16.555, 61.570, and 78.630.
Under the provisions of Kentucky Revised Statute Section 61.645, the Board of Trust-
ees (the Board) of Kentucky Retirement Systems (KRS) administers the Kentucky
Employees Retirement System (KERS), County Employees Retirement System
(CERS), and State Police Retirement System (SPRS).
Under the provisions of Kentucky Revised Statute Section 61.701, the Board of KRS
administers the Kentucky Retirement Systems Insurance Fund. Th e statutes provide
for a single insurance fund to provide group hospital and medical benefi ts to retirees
drawing a benefi t from the three pension funds administered by KRS: (1) KERS; (2)
CERS; and (3) SPRS. Th e assets of the insurance fund are commingled for investment
purposes. Th e following notes apply to the various funds administered by KRS.
Note A. Summary of Signifi cant Accounting Policies
KERSKentucky Employees Retirement System
CERSCounty Employees Retirement System
SPRSState Police Retirement System
28FIN
Intangible Assets Intangible assets, currently computer software, are valued at historical cost
and amortization is computed utilizing the straight-line method over the estimated useful lives of
the assets which is ten years. Th e capitalization threshold used in fi scal years ended June 30, 2012
and 2011 was $3,000 (see Note K for further information).
Contributions Receivable Contributions receivable consists of amounts due from em-
ployers. Th e management of KRS considers contributions receivable to be fully collectable; accord-
ingly, no allowance for doubtful accounts is considered necessary. If amounts become uncollectable,
they will be charged to operations when that determination is made. If amounts previously written
off are collected, they will be credited to income when received.
Payment of Benefi ts Benefi ts are recorded when paid.
Expense Allocation Administrative expenses of KRS are allocated in proportion to the number
of active members participating in each plan and direct investment manager expenses are allocated
in proportion to the percentage of investment assets held by each plan.
Component Unit KRS is a component unit of the Commonwealth of Kentucky for fi nancial
reporting purposes. KERS was created by the Kentucky General Assembly pursuant to the provi-
sions of Kentucky Revised Statute 61.515. CERS was created by the Kentucky General Assembly
pursuant to the provisions of Kentucky Revised Statute 78.520. SPRS was created by the Kentucky
General Assembly pursuant to the provisions of Kentucky Revised Statute 16.510. Th e Kentucky
Retirement Systems Insurance Fund was created by the Kentucky General Assembly pursuant to the
provisions of Kentucky Revised Statute 61.701. KRS' administrative budget is subject to approval by
the Kentucky General Assembly. Employer contribution rates for KERS and SPRS are also subject
to legislative approval. Employer contribution rates for CERS are determined by the KRS Board of
Trustees without further legislative review. Th e methods used to determine the employer rates for all
Systems are specifi ed in Kentucky Revised Statute 61.565. Employee contribution rates are set by
statute and may be changed only by the Kentucky General Assembly.
Recent Accounting Pronouncements In December 2010, the Governmental Ac-
counting Standards Board (GASB) issued Statement No. 62, “Codifi cation of Accounting and Fi-
nancial Reporting Guidance Contained in Pre-November 30, 1989 FASB and AICPA Pronounce-
ments”. Th e objective of this Statement is to incorporate into the GASB’s authoritative literature
certain accounting and fi nancial reporting guidance that is included in the following pronounce-
ments issued on, or before, November 30, 1989, which does not confl ict with, or contradict, GASB
pronouncements: Financial Accounting Standards Board (FASB) Statements and Interpretations;
Accounting Principles Board Opinions; and, Accounting Research Bulletins of the American In-
stitute of Certifi ed Public Accountants’ (AICPA) Committee on Accounting Procedure. KRS has
noted this Statement and has implemented its requirements.
In June 2011, the GASB issued Statement No. 64, “Derivative Instruments: Application of Hedge
Accounting Termination Provisions-an amendment of GASB Statement No. 53”. Th e objective of
this Statement is to clarify whether an eff ective hedging relationship continues after the replace-
ment of a swap counterparty or a swap counterparty’s credit support provider. Th is Statement sets
forth criteria that establish when the eff ective hedging relationship continues and hedge accounting
should continue to be applied. KRS has noted this Statement and has implemented its requirements
in an additional disclosure in Footnote D-Investments.
In June 2012, the GASB issued Statement No. 67, “Financial Reporting for Pension Plans-an
amendment of GASB Statement No. 25”. Th e objective of this Statement is to improve fi nancial
reporting by state and local governmental pension plans. Th is Statement requires defi ned benefi t
pension plans to present two fi nancial statements – a statement of fi duciary net position and a
statement of changes in fi duciary net position. In addition, the Statement requires that notes to
the fi nancial statements include descriptive information, such as the types of benefi ts provided,
GASBGovernmental AccountingStandards Board
29 FIN
NOTE B.
Note B. Plan Descriptions & Contribution Information
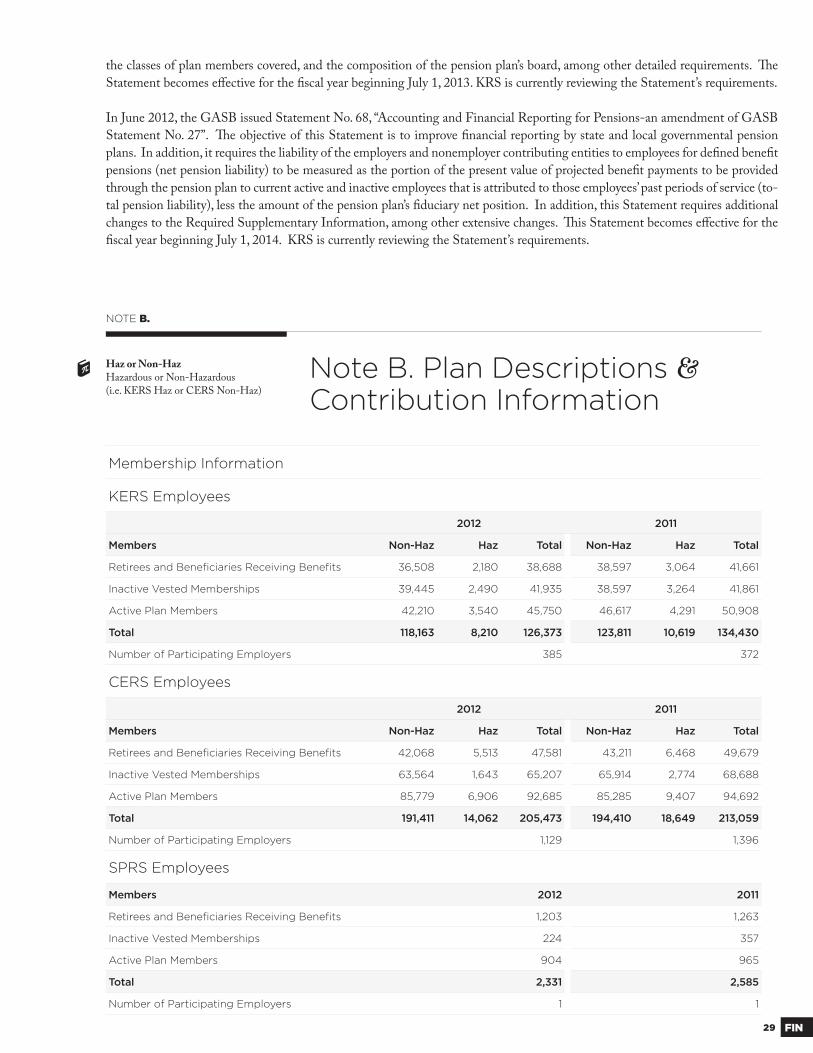
Membership Information
KERS Employees
2012 2011
Members Non-Haz Haz Total Non-Haz Haz Total
Retirees and Benefi ciaries Receiving Benefi ts 36,508 2,180 38,688 38,597 3,064 41,661
Inactive Vested Memberships 39,445 2,490 41,935 38,597 3,264 41,861
Active Plan Members 42,210 3,540 45,750 46,617 4,291 50,908
Total 118,163 8,210 126,373 123,811 10,619 134,430
Number of Participating Employers 385 372
CERS Employees
2012 2011
Members Non-Haz Haz Total Non-Haz Haz Total
Retirees and Benefi ciaries Receiving Benefi ts 42,068 5,513 47,581 43,211 6,468 49,679
Inactive Vested Memberships 63,564 1,643 65,207 65,914 2,774 68,688
Active Plan Members 85,779 6,906 92,685 85,285 9,407 94,692
Total 191,411 14,062 205,473 194,410 18,649 213,059
Number of Participating Employers 1,129 1,396
SPRS Employees
Members 2012 2011
Retirees and Benefi ciaries Receiving Benefi ts 1,203 1,263
Inactive Vested Memberships 224 357
Active Plan Members 904 965
Total 2,331 2,585
Number of Participating Employers 1 1
Haz or Non-HazHazardous or Non-Hazardous(i.e. KERS Haz or CERS Non-Haz)
the classes of plan members covered, and the composition of the pension plan’s board, among other detailed requirements. Th e
Statement becomes eff ective for the fi scal year beginning July 1, 2013. KRS is currently reviewing the Statement’s requirements.
In June 2012, the GASB issued Statement No. 68, “Accounting and Financial Reporting for Pensions-an amendment of GASB
Statement No. 27”. Th e objective of this Statement is to improve fi nancial reporting by state and local governmental pension
plans. In addition, it requires the liability of the employers and nonemployer contributing entities to employees for defi ned benefi t
pensions (net pension liability) to be measured as the portion of the present value of projected benefi t payments to be provided
through the pension plan to current active and inactive employees that is attributed to those employees’ past periods of service (to-
tal pension liability), less the amount of the pension plan’s fi duciary net position. In addition, this Statement requires additional
changes to the Required Supplementary Information, among other extensive changes. Th is Statement becomes eff ective for the
fi scal year beginning July 1, 2014. KRS is currently reviewing the Statement’s requirements.
30FIN
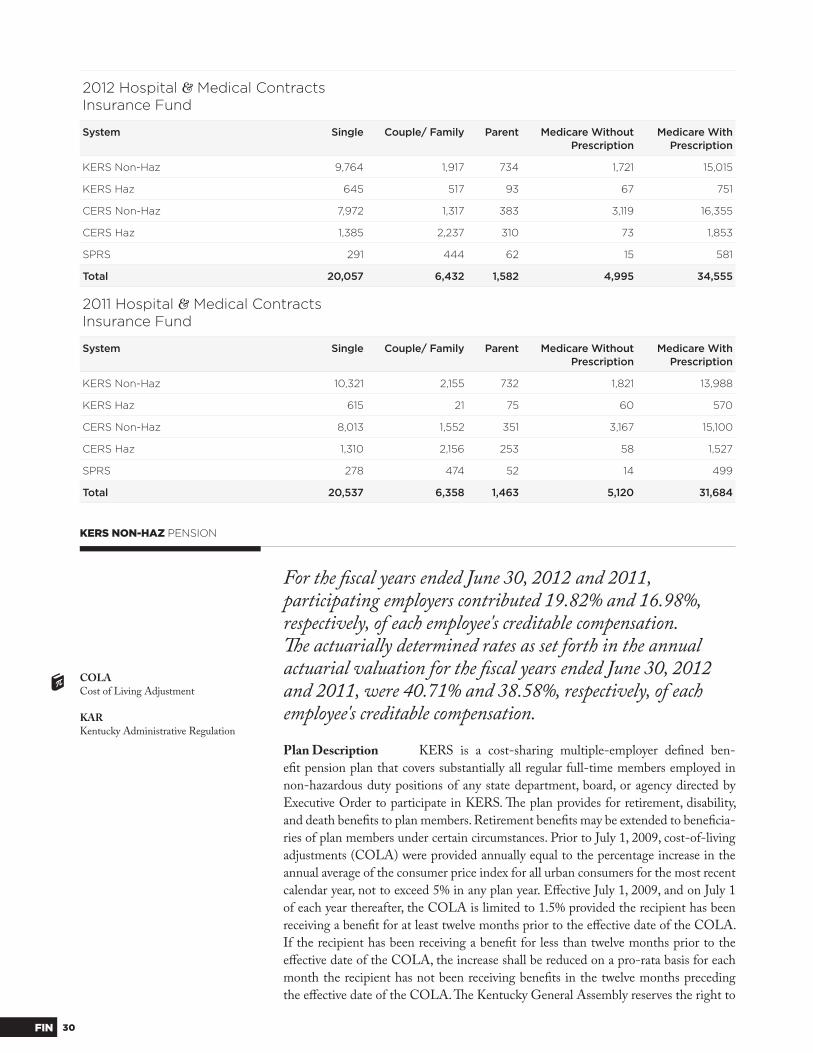
2012 Hospital & Medical ContractsInsurance Fund
System Single Couple/ Family Parent Medicare Without Prescription
Medicare With Prescription
KERS Non-Haz 9,764 1,917 734 1,721 15,015
KERS Haz 645 517 93 67 751
CERS Non-Haz 7,972 1,317 383 3,119 16,355
CERS Haz 1,385 2,237 310 73 1,853
SPRS 291 444 62 15 581
Total 20,057 6,432 1,582 4,995 34,555
2011 Hospital & Medical ContractsInsurance Fund
System Single Couple/ Family Parent Medicare Without Prescription
Medicare With Prescription
KERS Non-Haz 10,321 2,155 732 1,821 13,988
KERS Haz 615 21 75 60 570
CERS Non-Haz 8,013 1,552 351 3,167 15,100
CERS Haz 1,310 2,156 253 58 1,527
SPRS 278 474 52 14 499
Total 20,537 6,358 1,463 5,120 31,684
Plan Description KERS is a cost-sharing multiple-employer defi ned ben-
efi t pension plan that covers substantially all regular full-time members employed in
non-hazardous duty positions of any state department, board, or agency directed by
Executive Order to participate in KERS. Th e plan provides for retirement, disability,
and death benefi ts to plan members. Retirement benefi ts may be extended to benefi cia-
ries of plan members under certain circumstances. Prior to July 1, 2009, cost-of-living
adjustments (COLA) were provided annually equal to the percentage increase in the
annual average of the consumer price index for all urban consumers for the most recent
calendar year, not to exceed 5% in any plan year. Eff ective July 1, 2009, and on July 1
of each year thereafter, the COLA is limited to 1.5% provided the recipient has been
receiving a benefi t for at least twelve months prior to the eff ective date of the COLA.
If the recipient has been receiving a benefi t for less than twelve months prior to the
eff ective date of the COLA, the increase shall be reduced on a pro-rata basis for each
month the recipient has not been receiving benefi ts in the twelve months preceding
the eff ective date of the COLA. Th e Kentucky General Assembly reserves the right to
KERS NON-HAZ PENSION
COLACost of Living Adjustment
KARKentucky Administrative Regulation
For the fi scal years ended June 30, 2012 and 2011, participating employers contributed 19.82% and 16.98%, respectively, of each employee's creditable compensation. Th e actuarially determined rates as set forth in the annual actuarial valuation for the fi scal years ended June 30, 2012 and 2011, were 40.71% and 38.58%, respectively, of each employee's creditable compensation.
31 FIN
suspend or reduce cost-of-living adjustments if, in its judg-
ment, the welfare of the Commonwealth so demands. On
July 1, 2012, the COLA was not granted.
Contributions For the fi scal years ended June 30,
2012 and 2011, plan members who began participating prior
to September 1, 2008 were required to contribute 5% of their
annual creditable compensation. Th e Commonwealth was
required to contribute at an actuarially determined rate. Per
Kentucky Revised Statute Section 61.565(3), normal con-
tribution and past service contribution rates shall be deter-
mined by the Board on the basis of an annual valuation last
preceding July 1 of a new biennium. Th e Board may amend
contribution rates as of the fi rst day of July of the second year
of a biennium, if it is determined on the basis of a subse-
quent actuarial valuation that amended contribution rates are
necessary to satisfy requirements determined in accordance
with actuarial bases adopted by the Board. However, formal
commitment to provide the contributions by the employer is
made through the biennial budget. For the fi scal years ended
June 30, 2012 and 2011, participating employers contributed
19.82% and 16.98%, respectively, of each employee's credit-
able compensation. Th e actuarially determined rates set by
the Board for the fi scal years ended June 30, 2012 and 2011,
were 40.71% and 38.58%, respectively, of each employee's
creditable compensation. Administrative costs of KRS are
fi nanced through employer contributions and investment
earnings.
House Bill 1 In accordance with House Bill 1,
signed by the Governor on June 27, 2008, plan members who
began participating on, or after, September 1, 2008, were re-
quired to contribute a total of 6% of their annual creditable
compensation. Five percent of the contribution was depos-
ited to the member's account while the 1% was deposited
to an account created under 26 USC Section 401(h) in the
Pension Fund (see Kentucky Administrative Regulation 105
KAR 1:420E). Interest is paid each June 30 on members'
accounts at a rate of 2.5%. If a member terminates employ-
ment and applies to take a refund, the member is entitled to
a full refund of contributions and interest; however, the 1%
contribution to the 401 (h) account is non-refundable and is
forfeited. For plan members who began participating prior to
September 1, 2008, their contributions remain at 5% of their
annual creditable compensation.
Plan Description KERS is a cost-sharing multiple-
employer defi ned benefi t pension plan that covers substan-
tially all regular full-time members employed in hazardous
duty positions of any state department, board, or agency di-
rected by Executive Order to participate in KERS. Th e plan
provides for retirement, disability, and death benefi ts to plan
members. Retirement benefi ts may be extended to benefi cia-
ries of plan members under certain circumstances. Prior to
July 1, 2009, cost-of-living adjustments (COLA) were pro-
vided annually equal to the percentage increase in the annual
average of the consumer price index for all urban consumers
for the most recent calendar year, not to exceed 5% in any
plan year. Eff ective July 1, 2009, and on July 1 of each year
thereafter, the COLA is limited to 1.5% provided the recipi-
ent has been receiving a benefi t for at least twelve months
prior to the eff ective date of the COLA. If the recipient has
been receiving a benefi t for less than twelve months prior to
the eff ective date of the COLA, the increase shall be reduced
on a pro-rata basis for each month the recipient has not been
receiving benefi ts in the twelve months preceding the eff ec-
tive date of the COLA. Th e Kentucky General Assembly
reserves the right to suspend or reduce cost-of-living adjust-
ments if, in its judgment, the welfare of the Commonwealth
so demands. On July 1, 2012, the COLA was not granted.
Contributions For the fi scal years ended June
30, 2011 and 2010, plan members who began participating
prior to September 1, 2008 were required to contribute 8% of
their annual creditable compensation. Th e Commonwealth
was required to contribute at an actuarially determined rate.
Per Kentucky Revised Statute Section 61.565(3), normal
contribution and past service contribution rates shall be de-
termined by the Board on the basis of an annual valuation
last preceding the July 1 of a new biennium. Th e Board may
amend contribution rates as of the fi rst day of July of the
second year of a biennium, if it is determined on the basis
of a subsequent actuarial valuation that amended contribu-
tion rates are necessary to satisfy requirements determined in
accordance with actuarial bases adopted by the Board. How-
ever, formal commitment to provide the contributions by the
employer is made through the biennial budget. For the fi scal
years ended June 30, 2012 and 2011, participating employers
KERS HAZ PENSION
For the fi scal years ended June 30, 2012 and 2011, participating employers contributed 28.98% and 26.12%, respectively, of each employee's creditable compensation. Th e actuarially determined rates as set forth in the annual actuarial valuation for the fi scal years ended June 30, 2012 and 2011, were 33.84% and 34.37%, respectively, of each employee's creditable compensation.
32FIN
contributed 28.98% and 26.12%, respectively, of each em-
ployee's creditable compensation. Th e actuarially determined
rates set by the Board for the fi scal years ended June 30, 2012
and 2011, were 33.84% and 34.37%, respectively, of each
employee's creditable compensation. Administrative costs
of KRS are fi nanced through employer contributions and
investment earnings.
House Bill 1 In accordance with HB 1, signed
by the Governor on June 27, 2008, plan members who be-
gan participating on, or after, September 1, 2008, were re-
quired to contribute a total of 9% of their annual creditable
compensation. Eight percent of the contribution was depos-
ited to the member's account while the 1% was deposited
to an account created under 26 USC Section 401(h) in the
Pension Fund (see Kentucky Administrative Regulation 105
KAR 1:420E). Interest is paid each June 30 on members'
accounts at a rate of 2.5%. If a member terminates employ-
ment and applies to take a refund, the member is entitled to
a full refund of contributions and interest; however, the 1%
contribution to the 401(h) account is non-refundable and is
forfeited. For plan members who began participating prior to
September 1, 2008, their contributions remain at 8% of their
annual creditable compensation.
Plan Description CERS is a cost-sharing multiple-
employer defi ned benefi t pension plan that covers sub-
stantially all regular full-time members employed in non-
hazardous duty positions of each participating county, city,
and school board, and any additional eligible local agencies
electing to participate. Th e plan provides for retirement,
disability, and death benefi ts to plan members. Retirement
benefi ts may be extended to benefi ciaries of plan members
under certain circumstances. Prior to July 1, 2009, cost-of-
living adjustments (COLA) were provided annually equal
to the percentage increase in the annual average of the
consumer price index for all urban consumers for the most
recent calendar year, not to exceed 5% in any plan year. Ef-
fective July 1, 2009, and on July 1 of each year thereafter, the
COLA is limited to 1.5% provided the recipient has been
receiving a benefi t for at least twelve months prior to the ef-
fective date of the COLA. If the recipient has been receiving
a benefi t for less than twelve months prior to the eff ective
date of the COLA, the increase shall be reduced on a pro-
rata basis for each month the recipient has not been receiving
benefi ts in the twelve months preceding the eff ective date of
the COLA. Th e Kentucky General Assembly reserves the
right to suspend or reduce cost-of-living adjustments if, in
its judgment, the welfare of the Commonwealth so demands.
On July 1, 2012, the COLA was not granted.
Contributions For the fi scal years ended June 30,
2012 and 2011, plan members who began participating prior
to September 1, 2008 were required to contribute 5% of their
annual creditable compensation. Participating employers
were required to contribute at an actuarially determined rate.
Per Kentucky Revised Statute Section 61.565(3), normal
contribution and past service contribution rates shall be de-
termined by the Board on the basis of an annual valuation
last preceding the July 1 of a new biennium. Th e Board may
amend contribution rates as of the fi rst day of July of the
second year of a biennium, if it is determined on the basis
of a subsequent actuarial valuation that amended contribu-
tion rates are necessary to satisfy requirements determined
in accordance with actuarial bases adopted by the Board. For
the fi scal years ended June 30, 2012 and 2011, participat-
ing employers contributed 18.96% and 16.93%, respectively,
of each employee's creditable compensation. Th e actuarially
determined rates set by the Board for the fi scal years ended
June 30, 2012 and 2011, were 18.96% and 16.93%, respec-
tively. Administrative costs of KRS are fi nanced through
employer contributions and investment earnings.
House Bill 1 In accordance with House Bill 1,
signed by the Governor on June 27, 2008, plan members who
began participating on, or after, September 1, 2008, were re-
quired to contribute a total of 6% of their annual creditable
compensation. Five percent of the contribution was depos-
ited to the member's account while the 1% was deposited
to an account created under 26 USC Section 401(h) in the
Pension Fund (see Kentucky Administrative Regulation 105
KAR 1:420E). Interest is paid each June 30 on members'
accounts at a rate of 2.5%. If a member terminates employ-
ment and applies to take a refund, the member is entitled to
a full refund of contributions and interest; however, the 1%
contribution to the 401(h) account is non-refundable and is
forfeited. For plan members who began participating prior to
September 1, 2008, their contributions remain at 5% of their
annual creditable compensation.
CERS NON-HAZ PENSION
For the fi scal years ended June 30, 2012 and 2011, participating employers contributed 18.96% and 16.93%, respectively, of each employee's creditable compensation. Th e actuarially determined rates as set forth in the annual actuarial valuation for the fi scal years ended June 30, 2012 and 2011, were 18.96% and 16.93%, respectively.
33 FIN
Plan Description CERS is a cost-sharing multiple-
employer defi ned benefi t pension plan that covers substan-
tially all regular full-time members employed in hazardous
duty positions of each participating county, city and school
board, and any additional eligible local agencies electing to
participate in CERS. Th e plan provides for retirement, dis-
ability, and death benefi ts to plan members. Retirement ben-
efi ts may be extended to benefi ciaries of plan members under
certain circumstances. Prior to July 1, 2009, cost-of-living
adjustments (COLA) were provided annually equal to the
percentage increase in the annual average of the consumer
price index for all urban consumers for the most recent cal-
endar year, not to exceed 5% in any plan year. Eff ective July
1, 2009, and on July 1 of each year thereafter, the COLA
is limited to 1.5% provided the recipient has been receiv-
ing a benefi t for at least twelve months prior to the eff ec-
tive date of the COLA. If the recipient has been receiving a
benefi t for less than twelve months prior to the eff ective date
of the COLA, the increase shall be reduced on a pro-rata
basis for each month the recipient has not been receiving
benefi ts in the twelve months preceding the eff ective date
of the COLA. Th e Kentucky General Assembly reserves the
right to suspend or reduce cost-of-living adjustments if, in
its judgment, the welfare of the Commonwealth so demands.
On July 1, 2012, the COLA was not granted.
Contributions For the fi scal years ended June 30,
2012 and 2011, plan members who began participating prior
to September 1, 2008 were required to contribute 8% of their
annual creditable compensation. Th e participating employ-
ers were required to contribute at an actuarially determined
rate. Per Kentucky Revised Statute Section 61.565(3), nor-
mal contribution and past service contribution rates shall be
determined by the Board on the basis of an annual valuation
last preceding the July 1 of a new biennium. Th e Board may
amend contribution rates as of the fi rst day of July of the
second year of a biennium, if it is determined on the basis
of a subsequent actuarial valuation that amended contribu-
tion rates are necessary to satisfy requirements determined
in accordance with actuarial bases adopted by the Board. For
the fi scal years ended June 30, 2012 and 2011, participat-
ing employers contributed 35.76% and 33.25%, respectively,
of each employee's creditable compensation. Th e actuarially
determined rates set by the Board for the fi scal years ended
June 30, 2012 and 2011, were 35.76% and 33.25%, respec-
tively, of each employee's creditable compensation. Admin-
istrative costs of KRS are fi nanced through employer contri-
butions and investment earnings.
House Bill 1 In accordance with House Bill 1,
signed by the Governor on June 27, 2008, plan members who
began participating on, or after, September 1, 2008, were re-
quired to contribute a total of 9% of their annual creditable
compensation. Eight percent of the contribution was depos-
ited to the member's account while the 1% was deposited
to an account created under 26 USC Section 401(h) in the
Pension Fund (see Kentucky Administrative Regulation 105
KAR 1:420E). Interest is paid each June 30 on members'
accounts at a rate of 2.5%. If a member terminates employ-
ment and applies to take a refund, the member is entitled to
a full refund of contributions and interest; however, the 1%
contribution to the 401(h) account is non-refundable and is
forfeited. For plan members who began participating prior to
September 1, 2008, their contributions remain at 8% of their
annual creditable compensation.
CERS HAZ PENSION
For the fi scal years ended June 30, 2012 and 2011, participating employers contributed 35.76% and 33.25%, respectively, of each employee's creditable compensation. Th e actuarially determined rates as set forth in the annual actuarial valuation for the fi scal years ended June 30, 2012 and 2011, were 35.76% and 33.25%, respectively, of each employee's creditable compensation.
34FIN
Plan Description SPRS is a single-employer defi ned
benefi t pension plan that covers all full-time state troopers
employed in a hazardous duty position by the Kentucky
State Police. Th e plan provides for retirement, disability, and
death benefi ts to plan members. Retirement benefi ts may be
extended to benefi ciaries of plan members under certain cir-
cumstances. Prior to July 1, 2009, cost-of-living adjustments
(COLA) were provided annually equal to the percentage
increase in the annual average of the consumer price index
for all urban consumers for the most recent calendar year,
not to exceed 5% in any plan year. Eff ective July 1, 2009,
and on July 1 of each year thereafter, the COLA is limited
to 1.5% provided the recipient has been receiving a benefi t
for at least twelve months prior to the eff ective date of the
COLA. If the recipient has been receiving a benefi t for less
than twelve months prior to the eff ective date of the COLA,
the increase shall be reduced on a pro-rata basis for each
month the recipient has not been receiving benefi ts in the
twelve months preceding the eff ective date of the COLA.
Th e Kentucky General Assembly reserves the right to sus-
pend or reduce cost-of-living adjustments if, in its judgment,
the welfare of the Commonwealth so demands. On July 1,
2012, the COLA was not granted.
Contributions For the fi scal years ended June
30, 2012 and 2011, plan members who began participating
prior to September 1, 2008 were required to contribute 8% of
their annual creditable compensation. Th e Commonwealth
was required to contribute at an actuarially determined rate.
Per Kentucky Revised Statute Section 61.565(3), normal
contribution and past service contribution rates shall be de-
termined by the Board on the basis of an annual valuation
last preceding the July 1 of a new biennium. Th e Board may
amend contribution rates as of the fi rst day of July of the
second year of a biennium, if it is determined on the basis of
a subsequent actuarial valuation that amended contribution
rates are necessary to satisfy requirements determined in ac-
cordance with actuarial bases adopted by the Board.
However, formal commitment to provide the contributions
by the employer is made through the biennial budget. For
the fi scal years ended June 30, 2012 and 2011, the Common-
wealth contributed 52.13% and 45.54%, respectively, of each
employee's creditable compensation. Th e actuarially deter-
mined rates set by the Board for the fi scal years ended June
30, 2012 and 2011 were 94.63% and 85.63%, respectively,
of each employee's creditable compensation. Administrative
costs of KRS are fi nanced through employer contributions
and investment earnings.
House Bill 1 In accordance with House Bill 1,
signed by the Governor on June 27, 2008, plan members who
began participating on, or after, September 1, 2008, were re-
quired to contribute a total of 9% of their annual creditable
compensation. Eight percent of the contribution was depos-
ited to the member's account while the 1% was deposited
to an account created under 26 USC Section 401(h) in the
Pension Fund (see Kentucky Administrative Regulation 105
KAR 1:420E). Interest is paid each June 30 on members'
accounts at a rate of 2.5%. If a member terminates employ-
ment and applies to take a refund, the member is entitled to
a full refund of contributions and interest; however, the 1%
contribution to the 401(h) account is non-refundable and is
forfeited. For plan members who began participating prior to
September 1, 2008, their contributions remain at 8% of their
annual creditable compensation.
SPRS PENSION
For the fi scal years ended June 30, 2012 and 2011, the Commonwealth contributed 52.13% and 45.54%, respectively, of each employee's creditable compensation. Th e actuarially determined rates set by the Board for the fi scal years ended June 30, 2012 and 2011 were 94.63% and 85.63%, respectively, of each employee's creditable compensation.
35 FIN
Portion Paid by Insurance Fund
Years of Service Paid by Insurance Fund (%)
20+ years 100%
15-19 years 75%
10-14 years 50%
4-9 years 25%
Less than 4 years 0%
non-hazardous employees whose participation began on, or after,
July 1, 2003 earn ten dollars ($10) per month for insurance benefi ts
at retirement for every year of earned service without regard to a
maximum dollar amount. Hazardous employees whose participa-
tion began on, or after, July 1, 2003 earn fi fteen dollars ($15) per
month for insurance benefi ts at retirement for every year of earned
service without regard to a maximum dollar amount. Upon death
of a hazardous employee, the employee's spouse receives ten dol-
lars ($10) per month for insurance benefi ts for each year of the
deceased employee's earned hazardous service. Th is dollar amount
is subject to adjustment annually based on the retiree cost of living
adjustment (COLA), which is updated annually due to changes in
the Consumer Price Index for all urban consumers. Th is benefi t is
not protected under the inviolable contract provisions of Kentucky
Revised Statute 16.652, 61.692 and 78.852. Th e Kentucky General
Assembly reserves the right to suspend or reduce this benefi t if, in
its judgment, the welfare of the Commonwealth so demands. In
prior years, the employers' required medical insurance contribu-
tion rate was being increased annually by a percentage that would
result in advance-funding the medical liability on an actuarially
determined basis using the entry age normal cost method within a
20-year period measured from 1987. In November 1992, the Board
of Trustees adopted a fi xed percentage contribution rate and sus-
pended future increases under the current medical premium fund-
ing policy until the next experience study could be performed. In
May 1996, the Board of Trustees adopted a policy to increase the
insurance contribution rate by the amount needed to achieve the
target rate for full entry age normal funding within twenty years.
Self-Funding KRS commenced self-funding of health-
care benefi ts for its Medicare eligible retirees on January 1, 2006.
A self-funded plan is one in which KRS assumes the fi nancial risk
for providing healthcare benefi ts to its retirees. Th e self-funded
plan pays for claims out-of-pocket as they are presented instead
of paying a pre-determined premium to an insurance carrier for a
fully-insured plan. KRS funds the risk of its self-insured program
directly from its insurance assets.
Administrators KRS contracts with Catalyst Rx and
UMR to administer the pharmaceutical and medical benefi ts, re-
spectively, for its retirees. Stop-loss insurance can be arranged to
limit KRS' loss to a specifi ed amount to ensure that catastrophic
claims do not upset the fi nancial integrity of the self-funded plan.
Th e amount of stop-loss insurance is a function of KRS' size, na-
ture of its business, fi nancials, and tolerance for risk.
On August 6, 2012 the Board voted to cease self-funding of
healthcare benefi ts for most KRS Medicare eligible retirees. Th e
Board elected to contract with Humana Insurance Company to
provide healthcare benefi ts to KRS’ retirees through a fully insured
Medicare Advantage Plan. Th e Humana Medicare Advantage
Plan becomes eff ective January 1, 2013.
KRS INSURANCE
Plan Description Th e Kentucky Retirement Sys-
tems Insurance Fund (Fund) was established to provide hos-
pital and medical insurance for members receiving benefi ts
from KERS, CERS, and SPRS. Th e Fund pays a prescribed
contribution for whole or partial payment of required pre-
miums to purchase hospital and medical insurance. For the
fi scal year ended June 30, 2012, insurance premiums with-
held from benefi t payments for members of the systems
were $29,136,828 and $1,235,155 for KERS non-hazardous
and hazardous, respectively; $27,541,099 and $1,982,303
for CERS non-hazardous and hazardous, respectively; and,
$246,384 for SPRS. For fi scal 2011, insurance premiums
withheld from benefi t payments for members of KERS were
$29,350,195 and $1,225,236 for KERS non-hazardous and
KERS hazardous, respectively; $29,219,273 and $2,017,208
for CERS non-hazardous and CERS hazardous, respec-
tively; and, $250,282 for SPRS. Th e Fund pays the same
proportion of hospital and medical insurance premiums for
the spouse and dependents of retired hazardous members
killed in the line of duty. As of June 30, 2012, the Fund
had 96,742 retirees and benefi ciaries for whom benefi ts were
available. Th e amount of contribution paid by the Funds is
based on years of service. For members participating prior to
July 1, 2003, years of service and respective percentages of the
maximum contribution are as follows.
For fi scal 2012, insurance premiums withheld from benefi ts for members of KERS were $29,136,828 and $1,235,155 for KERS non-haz and KERS haz, respectively; $27,541,099 and $1,982,303 for CERS non-haz and CERS haz, respectively; and, $246,384 for SPRS.
As a result of House Bill 290 (2004 Kentucky General As-
sembly), medical insurance benefi ts are calculated diff erently
for members who began participating on, or after, July 1, 2003.
Once members reach a minimum vesting period of ten years,
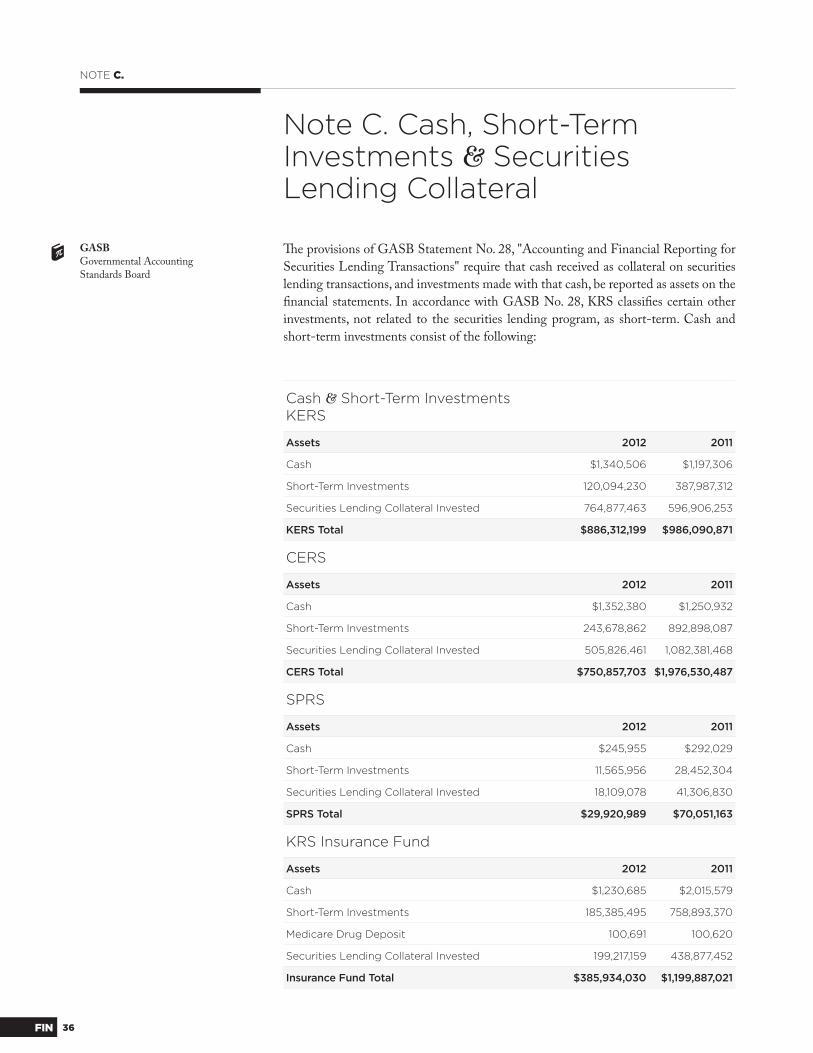
36FIN
NOTE C.
Th e provisions of GASB Statement No. 28, "Accounting and Financial Reporting for
Securities Lending Transactions" require that cash received as collateral on securities
lending transactions, and investments made with that cash, be reported as assets on the
fi nancial statements. In accordance with GASB No. 28, KRS classifi es certain other
investments, not related to the securities lending program, as short-term. Cash and
short-term investments consist of the following:
Note C. Cash, Short-Term Investments & Securities Lending Collateral
GASBGovernmental AccountingStandards Board
Cash & Short-Term InvestmentsKERS
Assets 2012 2011
Cash $1,340,506 $1,197,306
Short-Term Investments 120,094,230 387,987,312
Securities Lending Collateral Invested 764,877,463 596,906,253
KERS Total $886,312,199 $986,090,871
CERS
Assets 2012 2011
Cash $1,352,380 $1,250,932
Short-Term Investments 243,678,862 892,898,087
Securities Lending Collateral Invested 505,826,461 1,082,381,468
CERS Total $750,857,703 $1,976,530,487
SPRS
Assets 2012 2011
Cash $245,955 $292,029
Short-Term Investments 11,565,956 28,452,304
Securities Lending Collateral Invested 18,109,078 41,306,830
SPRS Total $29,920,989 $70,051,163
KRS Insurance Fund
Assets 2012 2011
Cash $1,230,685 $2,015,579
Short-Term Investments 185,385,495 758,893,370
Medicare Drug Deposit 100,691 100,620
Securities Lending Collateral Invested 199,217,159 438,877,452
Insurance Fund Total $385,934,030 $1,199,887,021
37 FIN
NOTE D.
Th e Board of Trustees of KRS recognizes its duty to invest funds in accordance with the
"Prudent Person Rule" and manage those funds consistent with the long-term nature of KRS.
For assets not managed internally by staff , the Board enters into contracts with investment
managers who use the following guidelines and restrictions in the selection and timing of
transactions as long as the security is not prohibited by the Kentucky Revised Statutes.
Equity Investments Investments may be made in common stock, securities convertible
into common stock, preferred stock of publicly traded companies on stock markets, asset class
relevant ETF’s or any other type of security contained in a manager’s benchmark. Each indi-
vidual equity account has a comprehensive set of investment guidelines prepared, which con-
tains a listing of permissible investments, portfolio restrictions and standards of performance.
Fixed Income Investments Th e fi xed income accounts may include, but are not limited to, the following fi xed income
securities: US Government and Agency bonds; investment grade US corporate credit; investment grade non-US corporate credit;
non-investment grade US corporate credit including both bonds and bank loans; non-investment grade non-US corporate credit
including bonds and bank loans; municipal bonds; non-US sovereign debt; mortgages, including residential mortgage backed securi-
ties; commercial mortgage backed securities, and whole loans; asset-backed securities and emerging market debt (EMD), including
both sovereign EMD and corporate EMD; and, asset class relevant ETF’s.
Mortgages Investment may be made in real estate mortgages on a direct basis or in the form of mortgage pool
instruments.
Private Equity, Equity Real Estate, Real Return, Absolute Return Investments Subject to the specifi c approval of the
Investment Committee of the Board of Trustees, investments may be made for the purpose of creating a diversifi ed portfolio of
alternative investments. Th e Board may invest in real estate or alternative investments including, but not limited to and without
limitation, venture capital, private equity, private placements, real assets and absolute return investments which the Investment Com-
mittee believes has excellent potential to generate income and which may have a higher degree of risk.
Cash Equivalent Securities Th e following short-term investment vehicles are considered acceptable: Publicly traded
investment grade corporate bonds, variable rate demand notes, government and agency bonds, mortgages, municipal bonds, and
collective STIF’s, money market funds or instruments (including, but not limited to, certifi cates of deposit, bank notes, deposit notes,
bankers’ acceptances and commercial paper) and repurchase agreements, relating to the above instruments. Instruments may be
selected from among those having an investment grade rating at the time of purchase by at least one recognized bond rating service.
In cases where the instrument has a split rating, the lower of the two ratings shall prevail. All instruments shall have a maturity at
the time of purchase that does not exceed two years. Repurchase agreements shall be deemed to have a maturity equal to the period
remaining until the date on which the repurchase of the underlying securities is scheduled to occur. Variable rate securities shall be
deemed to have a maturity equal to the time left until the next interest rate reset occurs, but in no case will any security have a stated
fi nal maturity of more than three years.
KRS’ fi xed income managers, who utilize cash equivalent securities as an integral part of their investment strategy, are exempt from
the permissible investments contained in the preceding paragraph. Permissible short-term investments for fi xed income managers
shall be included in the investment manager’s investment guidelines.
Derivatives Derivative instruments are fi nancial contracts whose values depend on the values of one or more underlying
assets, reference rates, or fi nancial indices. Investments may be made in derivative securities, or strategies which make use of deriva-
tive instruments, only if such investments do not cause the portfolio to be in any way leveraged beyond a 100% invested position.
Investments in derivative securities which are subject to large or unanticipated changes in duration or cash fl ow, such as interest
only (IO), principal only (PO), inverse fl oater, or structured note securities are expressly prohibited, unless specifi cally allowed by a
manager’s contract. In accordance with GASB Statement No. 53, “Accounting and Financial Reporting for Derivative Instruments”,
KRS provides this additional disclosure regarding its derivatives:
Note D. InvestmentsCMOCollateralized Mortgage Obligation
STIFShort Term Investment Fund
ETFExchange Traded Fund
IOInterest Only
POPrincipal Only
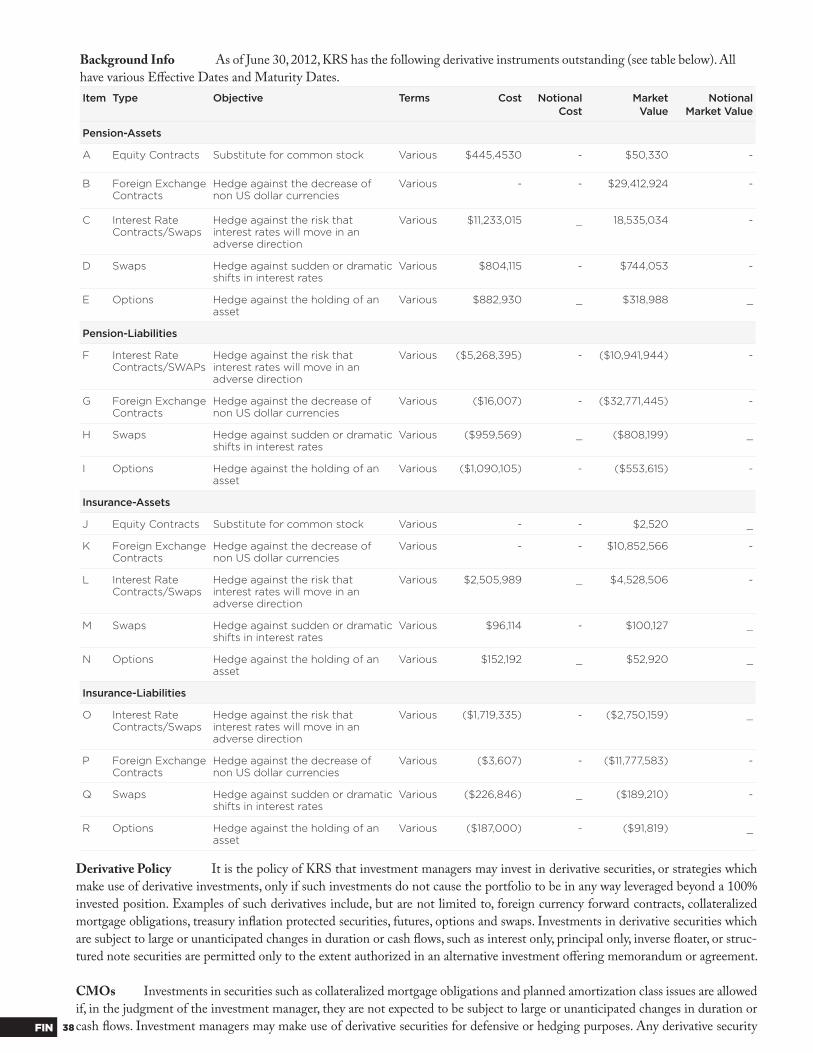
38FIN
Background Info As of June 30, 2012, KRS has the following derivative instruments outstanding (see table below). All
have various Eff ective Dates and Maturity Dates.
Item Type Objective Terms Cost NotionalCost
MarketValue
Notional Market Value
Pension-Assets
A Equity Contracts Substitute for common stock Various $445,4530 - $50,330 -
B Foreign Exchange Contracts
Hedge against the decrease of non US dollar currencies
Various - - $29,412,924 -
C Interest Rate Contracts/Swaps
Hedge against the risk that interest rates will move in an adverse direction
Various $11,233,015 _ 18,535,034 -
D Swaps Hedge against sudden or dramatic shifts in interest rates
Various $804,115 - $744,053 -
E Options Hedge against the holding of an asset
Various $882,930 _ $318,988 _
Pension-Liabilities
F Interest Rate Contracts/SWAPs
Hedge against the risk that interest rates will move in an adverse direction
Various ($5,268,395) - ($10,941,944) -
G Foreign Exchange Contracts
Hedge against the decrease of non US dollar currencies
Various ($16,007) - ($32,771,445) -
H Swaps Hedge against sudden or dramatic shifts in interest rates
Various ($959,569) _ ($808,199) _
I Options Hedge against the holding of an asset
Various ($1,090,105) - ($553,615) -
Insurance-Assets
J Equity Contracts Substitute for common stock Various - - $2,520 _
K Foreign Exchange Contracts
Hedge against the decrease of non US dollar currencies
Various - - $10,852,566 -
L Interest Rate Contracts/Swaps
Hedge against the risk that interest rates will move in an adverse direction
Various $2,505,989 _ $4,528,506 -
M Swaps Hedge against sudden or dramatic shifts in interest rates
Various $96,114 - $100,127 _
N Options Hedge against the holding of an asset
Various $152,192 _ $52,920 _
Insurance-Liabilities
O Interest Rate Contracts/Swaps
Hedge against the risk that interest rates will move in an adverse direction
Various ($1,719,335) - ($2,750,159) _
P Foreign Exchange Contracts
Hedge against the decrease of non US dollar currencies
Various ($3,607) - ($11,777,583) -
Q Swaps Hedge against sudden or dramatic shifts in interest rates
Various ($226,846) _ ($189,210) -
R Options Hedge against the holding of an asset
Various ($187,000) - ($91,819) _
Derivative Policy It is the policy of KRS that investment managers may invest in derivative securities, or strategies which
make use of derivative investments, only if such investments do not cause the portfolio to be in any way leveraged beyond a 100%
invested position. Examples of such derivatives include, but are not limited to, foreign currency forward contracts, collateralized
mortgage obligations, treasury infl ation protected securities, futures, options and swaps. Investments in derivative securities which
are subject to large or unanticipated changes in duration or cash fl ows, such as interest only, principal only, inverse fl oater, or struc-
tured note securities are permitted only to the extent authorized in an alternative investment off ering memorandum or agreement.
CMOs Investments in securities such as collateralized mortgage obligations and planned amortization class issues are allowed
if, in the judgment of the investment manager, they are not expected to be subject to large or unanticipated changes in duration or
cash fl ows. Investment managers may make use of derivative securities for defensive or hedging purposes. Any derivative security
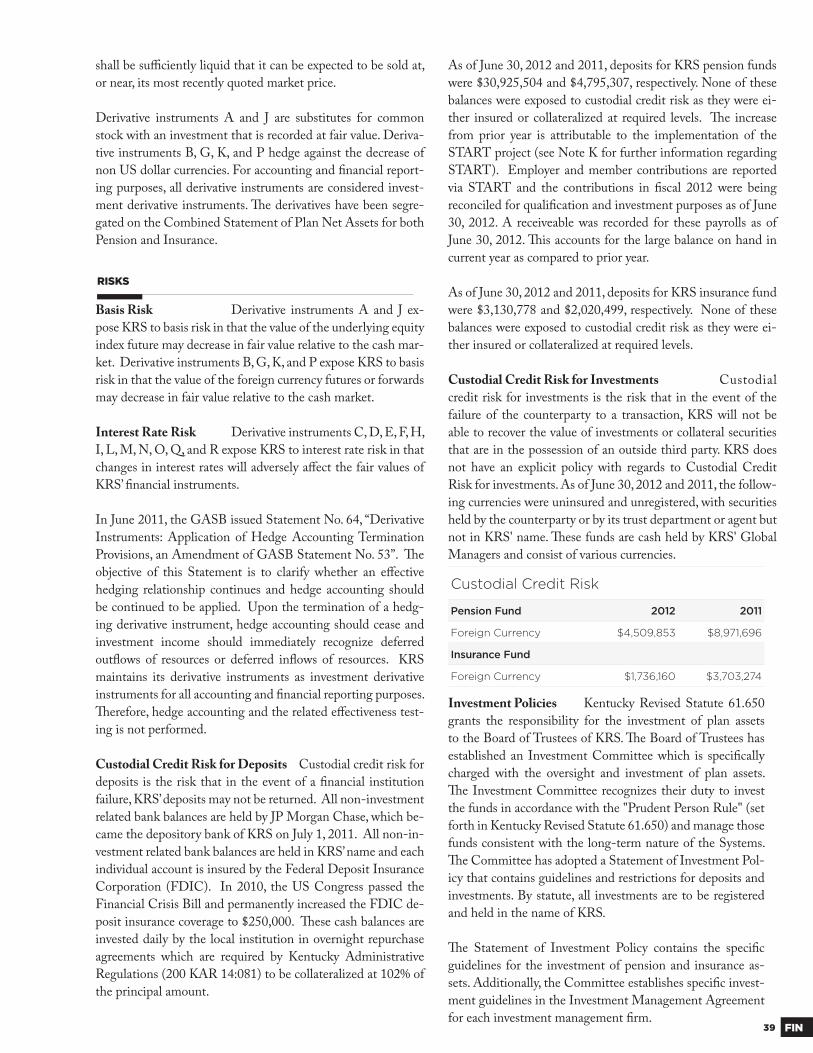
39 FIN
RISKS
Custodial Credit Risk
Pension Fund 2012 2011
Foreign Currency $4,509,853 $8,971,696
Insurance Fund
Foreign Currency $1,736,160 $3,703,274
Investment Policies Kentucky Revised Statute 61.650
grants the responsibility for the investment of plan assets
to the Board of Trustees of KRS. Th e Board of Trustees has
established an Investment Committee which is specifi cally
charged with the oversight and investment of plan assets.
Th e Investment Committee recognizes their duty to invest
the funds in accordance with the "Prudent Person Rule" (set
forth in Kentucky Revised Statute 61.650) and manage those
funds consistent with the long-term nature of the Systems.
Th e Committee has adopted a Statement of Investment Pol-
icy that contains guidelines and restrictions for deposits and
investments. By statute, all investments are to be registered
and held in the name of KRS.
Th e Statement of Investment Policy contains the specifi c
guidelines for the investment of pension and insurance as-
sets. Additionally, the Committee establishes specifi c invest-
ment guidelines in the Investment Management Agreement
for each investment management fi rm.
shall be suffi ciently liquid that it can be expected to be sold at,
or near, its most recently quoted market price.
Derivative instruments A and J are substitutes for common
stock with an investment that is recorded at fair value. Deriva-
tive instruments B, G, K, and P hedge against the decrease of
non US dollar currencies. For accounting and fi nancial report-
ing purposes, all derivative instruments are considered invest-
ment derivative instruments. Th e derivatives have been segre-
gated on the Combined Statement of Plan Net Assets for both
Pension and Insurance.
Basis Risk Derivative instruments A and J ex-
pose KRS to basis risk in that the value of the underlying equity
index future may decrease in fair value relative to the cash mar-
ket. Derivative instruments B, G, K, and P expose KRS to basis
risk in that the value of the foreign currency futures or forwards
may decrease in fair value relative to the cash market.
Interest Rate Risk Derivative instruments C, D, E, F, H,
I, L, M, N, O, Q, and R expose KRS to interest rate risk in that
changes in interest rates will adversely aff ect the fair values of
KRS’ fi nancial instruments.
In June 2011, the GASB issued Statement No. 64, “Derivative
Instruments: Application of Hedge Accounting Termination
Provisions, an Amendment of GASB Statement No. 53”. Th e
objective of this Statement is to clarify whether an eff ective
hedging relationship continues and hedge accounting should
be continued to be applied. Upon the termination of a hedg-
ing derivative instrument, hedge accounting should cease and
investment income should immediately recognize deferred
outfl ows of resources or deferred infl ows of resources. KRS
maintains its derivative instruments as investment derivative
instruments for all accounting and fi nancial reporting purposes.
Th erefore, hedge accounting and the related eff ectiveness test-
ing is not performed.
Custodial Credit Risk for Deposits Custodial credit risk for
deposits is the risk that in the event of a fi nancial institution
failure, KRS’ deposits may not be returned. All non-investment
related bank balances are held by JP Morgan Chase, which be-
came the depository bank of KRS on July 1, 2011. All non-in-
vestment related bank balances are held in KRS’ name and each
individual account is insured by the Federal Deposit Insurance
Corporation (FDIC). In 2010, the US Congress passed the
Financial Crisis Bill and permanently increased the FDIC de-
posit insurance coverage to $250,000. Th ese cash balances are
invested daily by the local institution in overnight repurchase
agreements which are required by Kentucky Administrative
Regulations (200 KAR 14:081) to be collateralized at 102% of
the principal amount.
As of June 30, 2012 and 2011, deposits for KRS pension funds
were $30,925,504 and $4,795,307, respectively. None of these
balances were exposed to custodial credit risk as they were ei-
ther insured or collateralized at required levels. Th e increase
from prior year is attributable to the implementation of the
START project (see Note K for further information regarding
START). Employer and member contributions are reported
via START and the contributions in fi scal 2012 were being
reconciled for qualifi cation and investment purposes as of June
30, 2012. A receiveable was recorded for these payrolls as of
June 30, 2012. Th is accounts for the large balance on hand in
current year as compared to prior year.
As of June 30, 2012 and 2011, deposits for KRS insurance fund
were $3,130,778 and $2,020,499, respectively. None of these
balances were exposed to custodial credit risk as they were ei-
ther insured or collateralized at required levels.
Custodial Credit Risk for Investments Custodial
credit risk for investments is the risk that in the event of the
failure of the counterparty to a transaction, KRS will not be
able to recover the value of investments or collateral securities
that are in the possession of an outside third party. KRS does
not have an explicit policy with regards to Custodial Credit
Risk for investments. As of June 30, 2012 and 2011, the follow-
ing currencies were uninsured and unregistered, with securities
held by the counterparty or by its trust department or agent but
not in KRS' name. Th ese funds are cash held by KRS' Global
Managers and consist of various currencies.
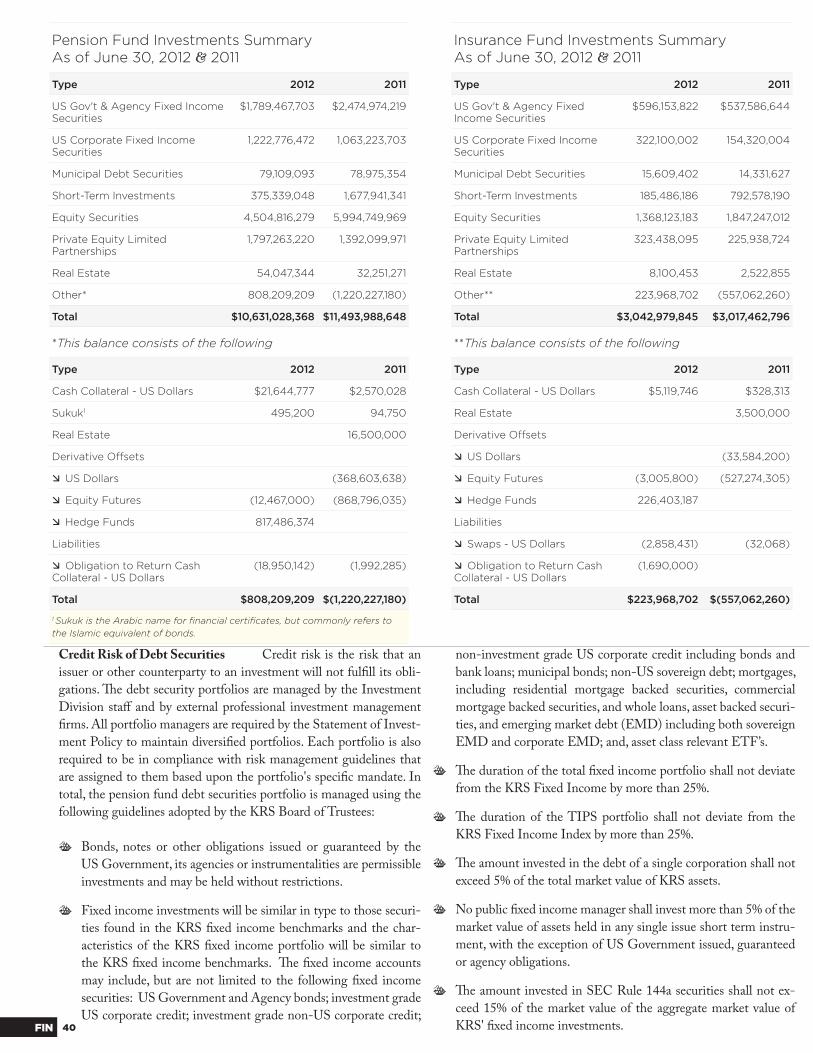
40FIN
Pension Fund Investments SummaryAs of June 30, 2012 & 2011
Type 2012 2011
US Gov't & Agency Fixed Income Securities
$1,789,467,703 $2,474,974,219
US Corporate Fixed Income Securities
1,222,776,472 1,063,223,703
Municipal Debt Securities 79,109,093 78,975,354
Short-Term Investments 375,339,048 1,677,941,341
Equity Securities 4,504,816,279 5,994,749,969
Private Equity Limited Partnerships
1,797,263,220 1,392,099,971
Real Estate 54,047,344 32,251,271
Other* 808,209,209 (1,220,227,180)
Total $10,631,028,368 $11,493,988,648
*This balance consists of the following
Type 2012 2011
Cash Collateral - US Dollars $21,644,777 $2,570,028
Sukuk1 495,200 94,750
Real Estate 16,500,000
Derivative Off sets
US Dollars (368,603,638)
Equity Futures (12,467,000) (868,796,035)
Hedge Funds 817,486,374
Liabilities
Obligation to Return Cash Collateral - US Dollars
(18,950,142) (1,992,285)
Total $808,209,209 $(1,220,227,180)
1 Sukuk is the Arabic name for fi nancial certifi cates, but commonly refers to the Islamic equivalent of bonds.
Credit Risk of Debt Securities Credit risk is the risk that an
issuer or other counterparty to an investment will not fulfi ll its obli-
gations. Th e debt security portfolios are managed by the Investment
Division staff and by external professional investment management
fi rms. All portfolio managers are required by the Statement of Invest-
ment Policy to maintain diversifi ed portfolios. Each portfolio is also
required to be in compliance with risk management guidelines that
are assigned to them based upon the portfolio's specifi c mandate. In
total, the pension fund debt securities portfolio is managed using the
following guidelines adopted by the KRS Board of Trustees:
v Bonds, notes or other obligations issued or guaranteed by the
US Government, its agencies or instrumentalities are permissible
investments and may be held without restrictions.
v Fixed income investments will be similar in type to those securi-
ties found in the KRS fi xed income benchmarks and the char-
acteristics of the KRS fi xed income portfolio will be similar to
the KRS fi xed income benchmarks. Th e fi xed income accounts
may include, but are not limited to the following fi xed income
securities: US Government and Agency bonds; investment grade
US corporate credit; investment grade non-US corporate credit;
non-investment grade US corporate credit including bonds and
bank loans; municipal bonds; non-US sovereign debt; mortgages,
including residential mortgage backed securities, commercial
mortgage backed securities, and whole loans, asset backed securi-
ties, and emerging market debt (EMD) including both sovereign
EMD and corporate EMD; and, asset class relevant ETF’s.
v Th e duration of the total fi xed income portfolio shall not deviate
from the KRS Fixed Income by more than 25%.
v Th e duration of the TIPS portfolio shall not deviate from the
KRS Fixed Income Index by more than 25%.
v Th e amount invested in the debt of a single corporation shall not
exceed 5% of the total market value of KRS assets.
v No public fi xed income manager shall invest more than 5% of the
market value of assets held in any single issue short term instru-
ment, with the exception of US Government issued, guaranteed
or agency obligations.
v Th e amount invested in SEC Rule 144a securities shall not ex-
ceed 15% of the market value of the aggregate market value of
KRS' fi xed income investments.
Insurance Fund Investments SummaryAs of June 30, 2012 & 2011
Type 2012 2011
US Gov't & Agency Fixed Income Securities
$596,153,822 $537,586,644
US Corporate Fixed Income Securities
322,100,002 154,320,004
Municipal Debt Securities 15,609,402 14,331,627
Short-Term Investments 185,486,186 792,578,190
Equity Securities 1,368,123,183 1,847,247,012
Private Equity Limited Partnerships
323,438,095 225,938,724
Real Estate 8,100,453 2,522,855
Other** 223,968,702 (557,062,260)
Total $3,042,979,845 $3,017,462,796
**This balance consists of the following
Type 2012 2011
Cash Collateral - US Dollars $5,119,746 $328,313
Real Estate 3,500,000
Derivative Off sets
US Dollars (33,584,200)
Equity Futures (3,005,800) (527,274,305)
Hedge Funds 226,403,187
Liabilities
Swaps - US Dollars (2,858,431) (32,068)
Obligation to Return Cash Collateral - US Dollars
(1,690,000)
Total $223,968,702 $(557,062,260)

41 FIN
Pension Fund Debt Securities at Fair Value as of June 30, 2012 & 2011
Quality Rating 2012 2011
AAA $176,752,688 $91,317,082
AA+ 51,817,259 34,390,755
AA 19,865,864 39,864,586
AA- 40,184,012 50,219,759
A+ 31,408,066 104,187,245
A 80,076,147 146,999,473
A- 108,297,775 152,567,548
BBB+ 57,879,171 64,799,988
BBB 103,233,884 112,518,837
BBB- 81,350,025 56,358,144
BB+ 56,241,281 7,166,376
BB 63,795,374 13,417,689
BB- 74,378,918 28,485,658
B+ 69,386,148 27,997,068
B 70,846,202 21,129,569
B- 57,149,848 32,172,492
CCC+ 27,020,113 6,138,146
CCC 20,493,357 8,838,429
CCC- 5,572,497 1,590,633
CC 720,167 -
D 6,361,973 3,394,737
NR 99,054,796 138,644,843
Total Credit Risk Debt Securities
1,301,885,565 1,142,199,057
Government Bonds 607,041,559 508,207,024
Government Mortgage-Backed Securities (GNMA)
248,950,785 725,318,403
Government Issued Commercial Mortgage Backed
10,311,861 6,325,040
Government Agencies 32,423,616 95,545,823
Indexed Linked Bonds 890,739,882 1,139,577,929
Total Debt Securities $3,091,353,268 $3,617,173,276
Pension Fund Securities At both June 30, 2012
and 2011, the weighted average quality rating of the pension
fund debt securities portfolio was AA+. As of June 30, 2012
and 2011, the KRS pension portfolio had $451,965,878 and
$150,330,797, respectively, in debt securities rated below
BBB-. Th e fair value of securities in the BBB- rating cat-
egory was $81,350,025 and $56,358,144, respectively, as of
June 30, 2012 and 2011.
Insurance Fund Debt Securities at Fair Value as of June 30, 2012 & 2011
Quality Rating 2012 2011
AAA $99,272,032 $43,946,738
AA+ 8,741,517 2,359,902
AA 6,899,008 7,044,017
AA- 7,739,207 7,138,193
A+ 11,301,734 20,243,053
A 20,358,203 18,381,398
A- 24,992,822 21,875,607
BBB+ 11,979,181 7,975,298
BBB 22,934,068 15,146,772
BBB- 15,084,027 7,256,147
BB+ 11,563,376 202,742
BB 15,166,400 1,156,866
BB- 17,353,229 1,916,666
B+ 14,268,206 3,169,797
B 16,588,386 2,226,250
B- 14,831,663
CC 961,988
CCC 5,522,254
CCC+ 5,323,130 259,375
CCC- 1,086,041
D 2,118,411
NR 3,624,521 8,352,810
Total Credit Risk Debt Securities
337,709,404 168,651,631
Government Bonds 164,367,747 94,082,811
Government Mortgage-Backed Securities (GNMA)
70,007,438 114,153,699
Government Issued Commercial Mortgage Backed
3,156,940 761,681
Government Agencies 7,506,492 13,394,544
Indexed Linked Bonds 351,115,205 315,193,909
Total Debt Securities $933,863,226 $706,238,275
Insurance Fund Securities As a result of the
most recently approved Asset/Liability Modeling Study, the
investment staff began to diversify the insurance fi xed in-
come allocation to mirror that of the pension funds. As part
of this process, the TIPS allocation (previously the only fi xed
income exposure within the insurance portfolio) was moved
to the newly created Real Return Asset Class.
42FIN
Concentration of Credit Risk Debt Securities Concentration of credit risk is the risk of loss
attributed to the magnitude of an entity's exposure in a single issuer. Th e total debt securities port-
folio is managed using the following general guidelines adopted by the KRS Board of Trustees:
v Bonds, notes or other obligations issued or guaranteed by the US Government, its agencies or
instrumentalities are permissible investments and may be held without restrictions.
v Debt obligations of any single US Corporation shall be limited to a maximum of 5% of the total
portfolio at market value.
As of June 30, 2012, the Pension Funds held $8,003,335, or 0.1%, and the Insurance Fund held
$15,424,404, or 0.5%, of its investments in Exchange Traded Funds (ETF's). ETF's are securities
that represent ownership in a long term unit investment trust that holds a portfolio of common
stocks designed to track the performance of a designated index. Similar to a stock, ETF's can be
traded continuously throughout the trading day, or can be held for the long term.
As of June 30, 2012, the Pension Funds held $165,626,504, or 1.6%, of its investment in the Federal
National Mortgage Association (Fannie Mae). Historically, Fannie Mae has been a publicly owned
government corporation, recently entering conservatorship by the US Government, to purchase
mortgages from lenders and resell them to investors; shares of Fannie Mae are traded on the New
York Stock Exchange. Fannie Mae's debt has been perceived to be nearly as safe as US Treasury
debt, given the US Government's implicit guarantee which has allowed it to pay lower interest rates
to its debt holders.
Interest Rate Risk Interest rate risk is the risk that changes in interest rates will adversely
aff ect the fair value of an investment. Duration measures the sensitivity of the market prices of fi xed
income securities to changes in the yield curve. Duration is measured using two methodologies:
eff ective and modifi ed duration. Eff ective duration uses the present value of cash fl ows, weighted for
those cash fl ows as a percentage of the investment’s full price and makes adjustments for any bond
features that would retire the bonds prior to maturity. Th e modifi ed duration, similar to eff ective
duration, measures the sensitivity of the market prices to changes in the yield curve, but does not
assume the securities will be called prior to maturity.
Th e KRS pension fund benchmarks its fi xed income securities portfolio to the Barclays US Universal
Index. Prior to June 30, 2011 the KRS pension fund benchmark for its fi xed income securities was a
combination of the Barclays Aggregate Index and the Barclays TIPS Index. As of June 30, 2012 and
2011, the modifi ed duration of the KRS fi xed income benchmark was 5.02 and 6.03, respectively.
At the same points in time, the modifi ed duration of the KRS pension fund fi xed income securities
portfolio was 5.61 and 5.85 respectively.
Th e KRS insurance fund benchmarks its fi xed income securities portfolio to the Barclays US Uni-
versal Index. Prior to June 30, 2011 the KRS insurance fund benchmark for its fi xed income securi-
ties was a combination of the Barclays Aggregate Index and the Barclays TIPS Index. As of June
30, 2012 and 2011, the modifi ed duration of the KRS fi xed income benchmark was 5.02 and 7.14,
respectively. At the same points in time, the modifi ed duration of the KRS insurance fund fi xed
income securities portfolio was 5.66 and 6.60 respectively.
As of June 30, 2012, the Pension Funds held $8,003,335, or .01%, and the Insurance Fund held $15,424,404, or 0.5%, of its investments in Exchange Traded Funds.
ETFExchange Traded Fund
Fannie MaeFederal National Mortgage Association
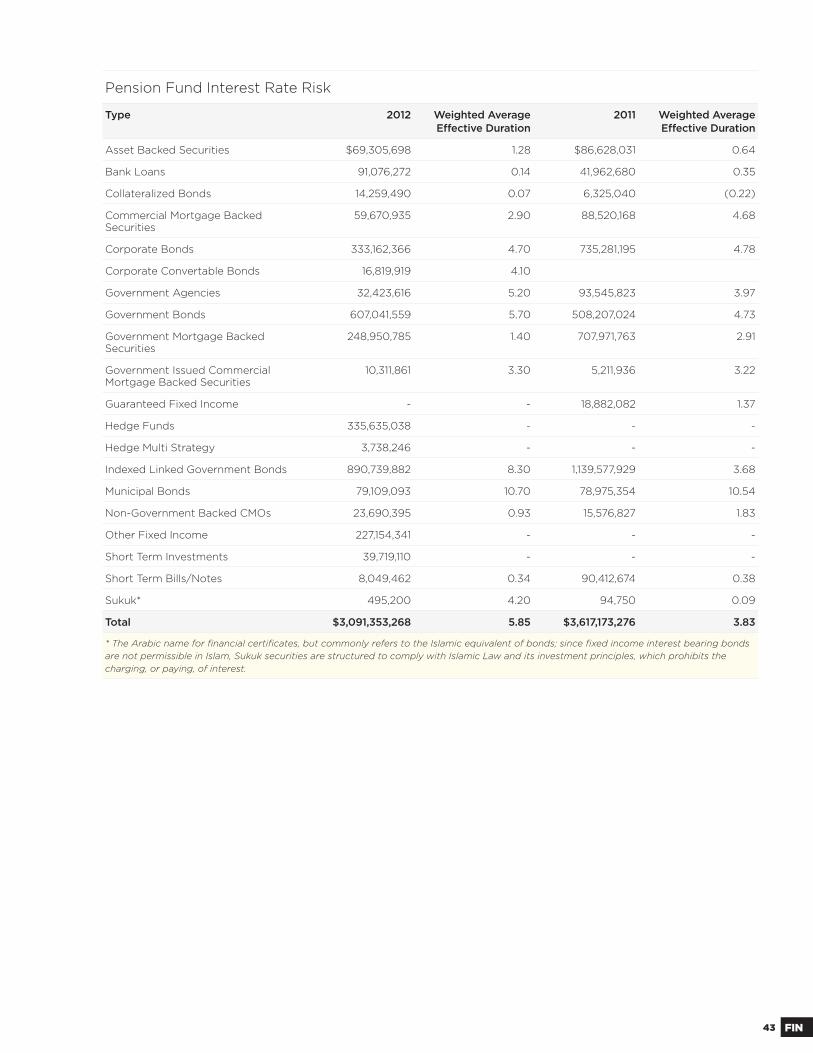
43 FIN
Pension Fund Interest Rate Risk
Type 2012 Weighted Average Eff ective Duration
2011 Weighted Average Eff ective Duration
Asset Backed Securities $69,305,698 1.28 $86,628,031 0.64
Bank Loans 91,076,272 0.14 41,962,680 0.35
Collateralized Bonds 14,259,490 0.07 6,325,040 (0.22)
Commercial Mortgage Backed Securities
59,670,935 2.90 88,520,168 4.68
Corporate Bonds 333,162,366 4.70 735,281,195 4.78
Corporate Convertable Bonds 16,819,919 4.10
Government Agencies 32,423,616 5.20 93,545,823 3.97
Government Bonds 607,041,559 5.70 508,207,024 4.73
Government Mortgage Backed Securities
248,950,785 1.40 707,971,763 2.91
Government Issued Commercial Mortgage Backed Securities
10,311,861 3.30 5,211,936 3.22
Guaranteed Fixed Income - - 18,882,082 1.37
Hedge Funds 335,635,038 - - -
Hedge Multi Strategy 3,738,246 - - -
Indexed Linked Government Bonds 890,739,882 8.30 1,139,577,929 3.68
Municipal Bonds 79,109,093 10.70 78,975,354 10.54
Non-Government Backed CMOs 23,690,395 0.93 15,576,827 1.83
Other Fixed Income 227,154,341 - - -
Short Term Investments 39,719,110 - - -
Short Term Bills/Notes 8,049,462 0.34 90,412,674 0.38
Sukuk* 495,200 4.20 94,750 0.09
Total $3,091,353,268 5.85 $3,617,173,276 3.83
* The Arabic name for fi nancial certifi cates, but commonly refers to the Islamic equivalent of bonds; since fi xed income interest bearing bonds are not permissible in Islam, Sukuk securities are structured to comply with Islamic Law and its investment principles, which prohibits the charging, or paying, of interest.

44FIN
Interest Fund Interest Rate Risk
2012 2011
Investment Fair Value Weighted Duration Fair Value Weighted Duration
Asset Backed Securities $20,616,445 2.40 $1,000,340 1.73
Bank Loans 19,461,761 3.90 5,808,008 3.58
Collateralized Bonds 5,256,039 0.80
Commercial Mortgage Backed Securities 12,783,807 3.30 11,977,676 4.42
Corporate Bonds 71,656,715 5.80 69,145,598 5.78
Corporate Convertible Bonds 3,788,169 7.90
Fixed Income 83,061,859
Government Agencies 7,506,492 6.40 13,394,544 4.34
Government Bonds 164,367,747 5.80 94,082,811 4.79
Government Mortgage Backed Securities 70,007,438 3.10 114,153,699 4.19
Government Issued Commercial Mortgages 3,156,940 3.60 534,001 3.51
Guaranteed Fixed Income 4,439,819 1.85
Hedge Fund 85,762,072
Hedge Multi Strategy 1,584,968
Index Linked Government Bonds 351,115,205 8.30 315,193,909 7.78
Municipal/Provincial Bonds 15,609,402 10.00 14,331,627 10.74
Non-Government Backed CMOs 5,339,625 1.10 2,293,809 3.47
Short Term Investments 11,619,360
Short Term Bills/Notes 1,169,182 .50 59,882,434 0.39
Total $933,863,226 6.60 $706,238,275 5.83
Foreign Currency Risk Foreign currency risk is the risk that changes in exchange
rates will adversely aff ect the value of a non-US dollar based investment or deposit with the KRS
portfolio. KRS' currency risk exposure, or exchange rate risk, primarily resides with KRS' inter-
national equity holdings, but also aff ects other asset classes. KRS does not have a formal policy to
limit foreign currency risk, however, during the fi scal year, KRS employed a third party vendor to
dynamically hedge some major currency exposures.
All foreign currency transactions are classifi ed as Short-Term Investments. All gains and losses as-
sociated with these transactions are recorded in the Net Appreciation (Depreciation) in the Fair
Value of Investments on the fi nancial statements.
KRS originally invested $12,043,264 of the Pension Funds, and $4,197,722 of the Insurance Fund,
in the Record Currency Management Dynamic Currency Hedging Program (RCM), for a total of
$16,243,160. Th e RCM program began in September 2009. Th e RCM account experienced a tre-
mendous amount of growth through May 2011 when it peaked with a market value of $82,001,355
in the Pension Funds, and $30,026,900 in the Insurance Fund, a total of $112,028,255. It began
to lose ground in June 2011, which led to a cumulative inception to date loss of $6,752,497 in the
Pension Funds, and $3,516,224 in the Insurance Fund, for a total overall RCM loss of $10,268,721
as of June 30, 2011. Th e dynamic currency hedging program previously run by RCM was terminated
on November 3, 2011 and is expected to be completely unwound in November 2012. Th e tables on
the following pages present KRS' exposure to foreign currency risk as of June 30, 2012 and 2011.
Foreign currency risk is the risk that changes in exchange rates will adversely aff ect the value of a non-US dollar based investment or deposit with the KRS portfolio.
RCMRecord Currency Management Dynamic Currency Hedging Program
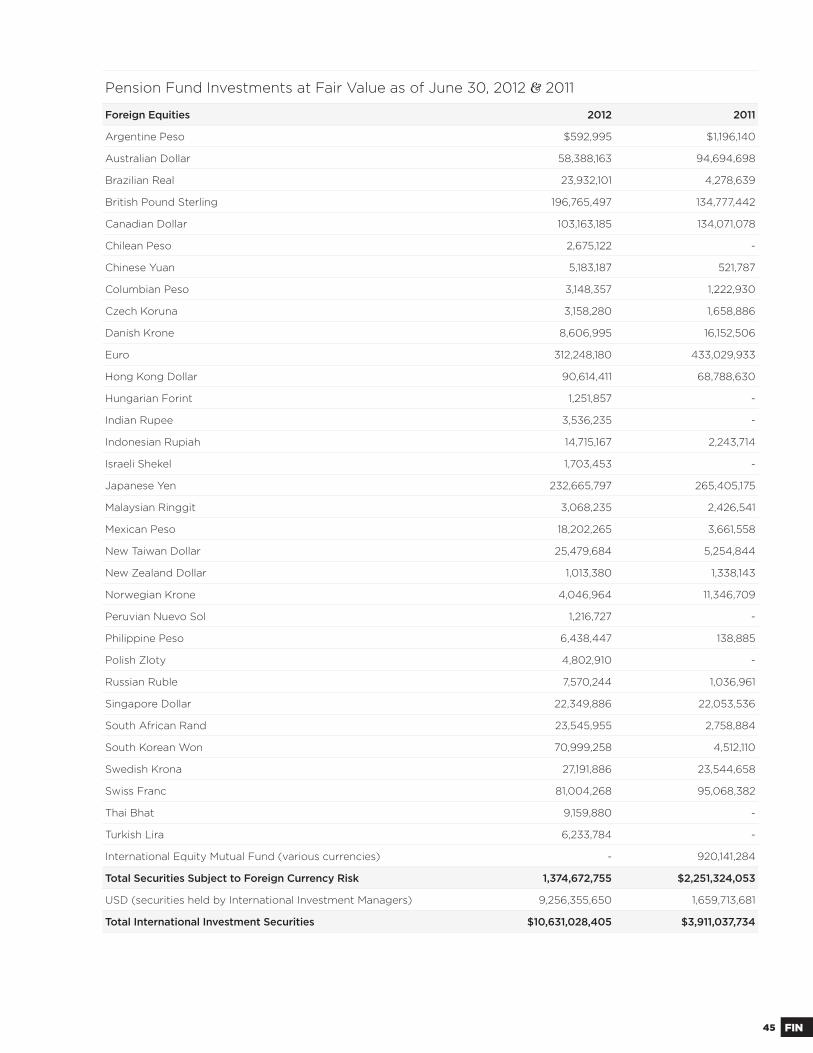
45 FIN
Pension Fund Investments at Fair Value as of June 30, 2012 & 2011
Foreign Equities 2012 2011
Argentine Peso $592,995 $1,196,140
Australian Dollar 58,388,163 94,694,698
Brazilian Real 23,932,101 4,278,639
British Pound Sterling 196,765,497 134,777,442
Canadian Dollar 103,163,185 134,071,078
Chilean Peso 2,675,122 -
Chinese Yuan 5,183,187 521,787
Columbian Peso 3,148,357 1,222,930
Czech Koruna 3,158,280 1,658,886
Danish Krone 8,606,995 16,152,506
Euro 312,248,180 433,029,933
Hong Kong Dollar 90,614,411 68,788,630
Hungarian Forint 1,251,857 -
Indian Rupee 3,536,235 -
Indonesian Rupiah 14,715,167 2,243,714
Israeli Shekel 1,703,453 -
Japanese Yen 232,665,797 265,405,175
Malaysian Ringgit 3,068,235 2,426,541
Mexican Peso 18,202,265 3,661,558
New Taiwan Dollar 25,479,684 5,254,844
New Zealand Dollar 1,013,380 1,338,143
Norwegian Krone 4,046,964 11,346,709
Peruvian Nuevo Sol 1,216,727 -
Philippine Peso 6,438,447 138,885
Polish Zloty 4,802,910 -
Russian Ruble 7,570,244 1,036,961
Singapore Dollar 22,349,886 22,053,536
South African Rand 23,545,955 2,758,884
South Korean Won 70,999,258 4,512,110
Swedish Krona 27,191,886 23,544,658
Swiss Franc 81,004,268 95,068,382
Thai Bhat 9,159,880 -
Turkish Lira 6,233,784 -
International Equity Mutual Fund (various currencies) - 920,141,284
Total Securities Subject to Foreign Currency Risk 1,374,672,755 $2,251,324,053
USD (securities held by International Investment Managers) 9,256,355,650 1,659,713,681
Total International Investment Securities $10,631,028,405 $3,911,037,734
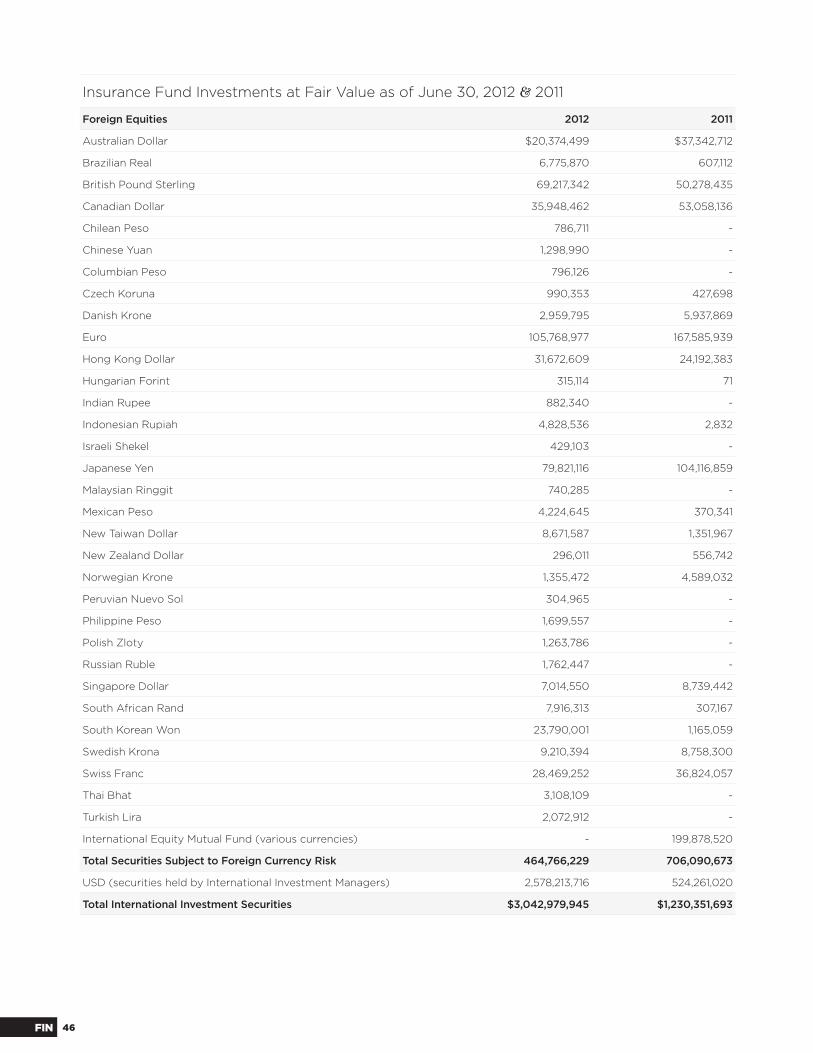
46FIN
Insurance Fund Investments at Fair Value as of June 30, 2012 & 2011
Foreign Equities 2012 2011
Australian Dollar $20,374,499 $37,342,712
Brazilian Real 6,775,870 607,112
British Pound Sterling 69,217,342 50,278,435
Canadian Dollar 35,948,462 53,058,136
Chilean Peso 786,711 -
Chinese Yuan 1,298,990 -
Columbian Peso 796,126 -
Czech Koruna 990,353 427,698
Danish Krone 2,959,795 5,937,869
Euro 105,768,977 167,585,939
Hong Kong Dollar 31,672,609 24,192,383
Hungarian Forint 315,114 71
Indian Rupee 882,340 -
Indonesian Rupiah 4,828,536 2,832
Israeli Shekel 429,103 -
Japanese Yen 79,821,116 104,116,859
Malaysian Ringgit 740,285 -
Mexican Peso 4,224,645 370,341
New Taiwan Dollar 8,671,587 1,351,967
New Zealand Dollar 296,011 556,742
Norwegian Krone 1,355,472 4,589,032
Peruvian Nuevo Sol 304,965 -
Philippine Peso 1,699,557 -
Polish Zloty 1,263,786 -
Russian Ruble 1,762,447 -
Singapore Dollar 7,014,550 8,739,442
South African Rand 7,916,313 307,167
South Korean Won 23,790,001 1,165,059
Swedish Krona 9,210,394 8,758,300
Swiss Franc 28,469,252 36,824,057
Thai Bhat 3,108,109 -
Turkish Lira 2,072,912 -
International Equity Mutual Fund (various currencies) - 199,878,520
Total Securities Subject to Foreign Currency Risk 464,766,229 706,090,673
USD (securities held by International Investment Managers) 2,578,213,716 524,261,020
Total International Investment Securities $3,042,979,945 $1,230,351,693
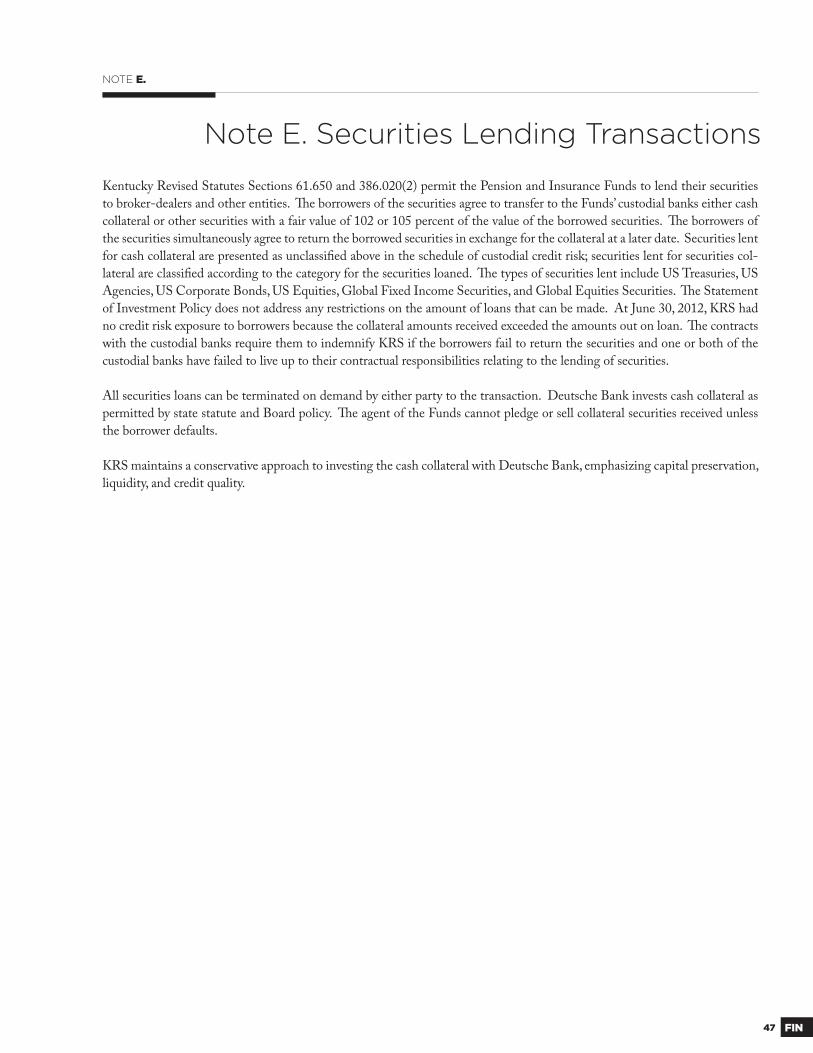
47 FIN
NOTE E.
Note E. Securities Lending Transactions
Kentucky Revised Statutes Sections 61.650 and 386.020(2) permit the Pension and Insurance Funds to lend their securities
to broker-dealers and other entities. Th e borrowers of the securities agree to transfer to the Funds’ custodial banks either cash
collateral or other securities with a fair value of 102 or 105 percent of the value of the borrowed securities. Th e borrowers of
the securities simultaneously agree to return the borrowed securities in exchange for the collateral at a later date. Securities lent
for cash collateral are presented as unclassifi ed above in the schedule of custodial credit risk; securities lent for securities col-
lateral are classifi ed according to the category for the securities loaned. Th e types of securities lent include US Treasuries, US
Agencies, US Corporate Bonds, US Equities, Global Fixed Income Securities, and Global Equities Securities. Th e Statement
of Investment Policy does not address any restrictions on the amount of loans that can be made. At June 30, 2012, KRS had
no credit risk exposure to borrowers because the collateral amounts received exceeded the amounts out on loan. Th e contracts
with the custodial banks require them to indemnify KRS if the borrowers fail to return the securities and one or both of the
custodial banks have failed to live up to their contractual responsibilities relating to the lending of securities.
All securities loans can be terminated on demand by either party to the transaction. Deutsche Bank invests cash collateral as
permitted by state statute and Board policy. Th e agent of the Funds cannot pledge or sell collateral securities received unless
the borrower defaults.
KRS maintains a conservative approach to investing the cash collateral with Deutsche Bank, emphasizing capital preservation,
liquidity, and credit quality.
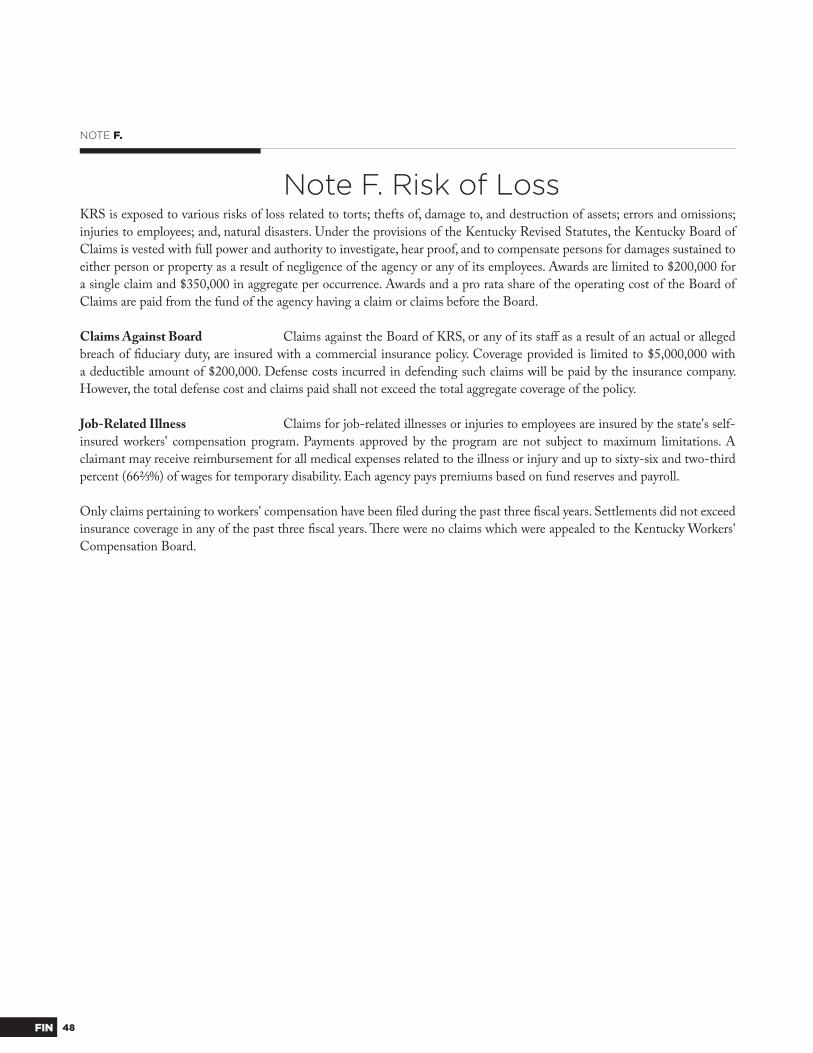
48FIN
NOTE F.
KRS is exposed to various risks of loss related to torts; thefts of, damage to, and destruction of assets; errors and omissions;
injuries to employees; and, natural disasters. Under the provisions of the Kentucky Revised Statutes, the Kentucky Board of
Claims is vested with full power and authority to investigate, hear proof, and to compensate persons for damages sustained to
either person or property as a result of negligence of the agency or any of its employees. Awards are limited to $200,000 for
a single claim and $350,000 in aggregate per occurrence. Awards and a pro rata share of the operating cost of the Board of
Claims are paid from the fund of the agency having a claim or claims before the Board.
Claims Against Board Claims against the Board of KRS, or any of its staff as a result of an actual or alleged
breach of fi duciary duty, are insured with a commercial insurance policy. Coverage provided is limited to $5,000,000 with
a deductible amount of $200,000. Defense costs incurred in defending such claims will be paid by the insurance company.
However, the total defense cost and claims paid shall not exceed the total aggregate coverage of the policy.
Job-Related Illness Claims for job-related illnesses or injuries to employees are insured by the state's self-
insured workers' compensation program. Payments approved by the program are not subject to maximum limitations. A
claimant may receive reimbursement for all medical expenses related to the illness or injury and up to sixty-six and two-third
percent (66⅔ %) of wages for temporary disability. Each agency pays premiums based on fund reserves and payroll.
Only claims pertaining to workers' compensation have been fi led during the past three fi scal years. Settlements did not exceed
insurance coverage in any of the past three fi scal years. Th ere were no claims which were appealed to the Kentucky Workers'
Compensation Board.
Note F. Risk of Loss
49 FIN
NOTE G.
In the normal course of business, KRS is involved in litigation concerning the right
of participants, or their benefi ciaries, to receive benefi ts. KRS does not anticipate any
material losses as a result of the contingent liabilities.
Note G. Contingencies
NOTE H.
Th e Internal Revenue Service has ruled that KRS qualifi es under Section 401(a) of the
Internal Revenue Code and is, generally, not subject to tax. KRS is subject to income
tax on any unrelated business income;however, KRS had no unrelated business income
in 2012.
Note H. Income Tax Status
NOTE I.
All eligible employees of KRS participate in KERS (non-hazardous), a cost-sharing,
multiple-employer defi ned pension plan that covers substantially all regular full-time
employees in non-hazardous positions of any Kentucky State Department, Board or
Agency directed by Executive Order to participate in the system. Th e plan provides for
retirement, disability and death benefi ts to plan members. Plan benefi ts are extended
to benefi ciaries of plan members under certain circumstances. Plan members who
began participating prior to September 1, 2008, contributed 5% of creditable compen-
sation for the periods ended June 30, 2012, 2011, and 2010. Plan members who began
participating on or after September 1, 2008, contributed 6% of creditable compensa-
tion for the periods ended June 30, 2012, 2011, and 2010. KRS contributed 19.82%,
16.98%, and 11.61% of covered payroll for the periods ended June 30, 2012, 2011,
and 2010, respectively. Th e chart below includes the covered payroll and contribution
amounts for KRS for the three periods included in this discussion.
Note I. Defi ned Benefi tPension Plan
Payroll & Contributions
2012 2011 2010
Covered Payroll $13,784,847 $13,444,315 $13,383,859
Required Employer Contributions
$2,726,780 $2,282,864 $1,553,865
Employer Percentage Contributed
100% 100% 100%
KERSKentucky Employees Retirement System
CERSCounty Employees Retirement System
SPRSState Police Retirement System
50FIN
NOTE J.
Note J. Equipment
Equipment Expenses as of June 30
Expense 2012 2011
Equipment At-Cost $6,753,648 $6,971,185
Less Accumulated Depreciation (2,805,034) (2,987,098)
Total $3,948,614 $3,984,087
Depreciation expense for the fi scal years ended June 30, 2012 and 2011 amounted to
$68,471 and $62,203, respectively. Th e decrease in equipment at cost is due to some
assets being fully depreciated as of June 30, 2012.
NOTE K.
Th e provisions of GASB Statement No. 51, "Accounting and Financial Reporting for
Intangible Assets" require that intangible assets be recognized in the Statement of Plan
Net Assets only if they are considered identifi able. In accordance with GASB No. 51,
KRS has capitalized software costs as indicated below for the Strategic Technology
Advancements for the Retirement of Tomorrow (START) project.
Note K. Intangible Assets
GASBGovernmental AccountingStandards Board
STARTStrategic Technology Advancements for the Retirement of Tomorrow
Software Expenses as of June 30
Expense 2012 2011
Software At-Cost $12,724,117 $7,424,611
Less Accumulated Amortization (2,893,011) (1,682,261)
Total $9,831,106 $5,742,350
Amortization expense for the fi scal years ended June 30, 2012 and 2011 amounted to
$1,210,750 and $688,473, respectively.
START Project In fi scal 2007, KRS initiated the START project. It is an-
ticipated that START will be completed in its entirety in fi scal 2013. Th e objectives of
the project are to provide employees with a technology solution that will enable them
to serve more customers more quickly while providing continued superior service; to
enhance business services and improve operational effi ciency; to improve the accuracy
of the information collected, maintained, and provided; to improve the timeliness and
accuracy of responses to members' inquiries; to provide internet based, self-service
capabilities to members, retirees, and employers; and, to ensure that retirees receive
monthly benefi ts without error or disruption.
51 FIN
NOTE L.
Th e provisions of GASB Statement No. 50, "Pension Disclosures, an Amendment of
GASB No. 25 and No. 27", require that actuarial information included in the Notes
to the Required Supplementary Information be moved to the Notes to the Financial
Statements. In accordance with GASB No. 50, KRS has moved the following informa-
tion from the Notes to the Required Supplementary Information to the Notes to the
Financial Statements:
Note L. Actuarial Valuation
HazHazardous (i.e. KERS Haz)
Non-HazNon-Hazardous (i.e. CERS Non-Haz)
Pension Fund Valuation
Non-Haz Haz
Valuation Date June 30, 2012 June 30, 2012
Actuarial Cost Method Entry Age Entry Age
Amortization Method Level Percent Closed Level Percent Closed
Remaining Amortization Period 25 Years 25 Years
Asset Valuation Method Five-year Smoothed Market
Five-year Smoothed Market
Actuarial Assumptions
Investment Rate of Return 7.75% 7.75%
Includes Price Infl ation at 3.5% 3.5%
Projected Salary Increases 4.75-17.0% 4.5-21.0%
Includes Wage Infl ation at 4.5% 4.5%
Cost of Living Adjustment None None
Insurance Fund Valuation1
Non-Haz Haz
Valuation Date June 30, 2012 June 30, 2012
Actuarial Cost Method Entry Age Entry Age
Amortization Method Level Percent Closed Level Percent Closed
Remaining Amortization Period 25 Years 25 Years
Asset Valuation Method Five-year Smoothed Market
Five-year Smoothed Market
Medical Trend Assumption(Pre-Medicare)
9.5-5.0% 9.5-5.0%
Medical Trend Assumption(Post-Medicare)
7.5-5.0% 7.5-5.0%
Year of Ultimate Trend 2019 2019
Actuarial Assumptions
Investment Rate of Return 4.5% and 7.75%2 4.5% and 7.75%
Includes Price Infl ation at 3.5% 3.5%
1Th e actuarial valuation for the Insurance Fund involves estimates of the value of reported amounts and assumptions about the probability of future events. Actuarially determined amounts are subject to continual revision as results are compared to past expectations and new estimates are made about the future. Calculations are based on the benefi ts provided under the terms of the insurance plan in eff ect at the time of each valuation and on the pattern of sharing costs between the employer and plan members as of the valuation date. Actuarial calculations of the insurance plan refl ect a long-term perspective.
2Th e actuarial investment rate of return for developing insurance liabilities and contribution rates is 4.5% for the Kentucky Employees Retirement System (non-hazardous) and the State Police Retirement System. Th e lower rate is required under the parameters set by the Governmental Accounting Standards Board (GASB) Statements 43 and 45 given the lack of pre-funding ofinsurance benefi ts.
52FIN
Unfunded Actuarial Accrued Liabilities as of June 30Pension Fund
System 2012 2011
KERS Non-Haz $8,259,731,398 $7,455,155,945
KERS Haz 255,473,161 210,544,939
CERS Non-Haz 3,592,332,096 3,288,473,842
CERS Haz 1,262,612,750 1,079,495,659
SPRS 387,897,090 348,798,770
Total Pension Funds $13,758,046,495 $12,382,469,155
Unfunded Actuarial Accrued Liabilities as of June 30Insurance Fund
System 2012 2011
KERS Non-Haz $2,679,249,646 $3,828,469,191
KERS Haz 39,018,458 177,097,152
CERS Non-Haz 857,917,437 1,640,522,412
CERS Haz 535,802,215 876,912,481
SPRS 209,531,710 314,740,474
Total Insurance Funds $4,321,519,466 $6,837,741,710
Total Unfunded Actuarial Accrued Liability $18,079,565,961 $19,220,210,865
Unfunded Actuarial Accrued Liability KRS had the following Unfunded
Actuarial Accrued Liabilities as of June 30 2012 and 2011:
HazHazardous (i.e. KERS Haz)
Non-HazNon-Hazardous (i.e. CERS Non-Haz)
AALActuarial Accrued Liability
Pension Fund Schedule of Funding Progress
System Actuarial Value of Assets
AAL Entry Age Normal
Funded Covered Payroll Unfunded as a % of Covered Payroll
KERS Non-Haz $3,101,316,738 $11,361,048,136 27.3% $1,644,896,681 502.1%
KERS Haz 497,226,296 752,699,457 66.1% 131,976,754 193.6%
CERS Non-Haz 5,547,235,599 9,139,567,695 60.7% 2,236,546,345 160.6%
CERS Haz 1,747,379,297 3,009,992,047 58.1% 464,228,923 272.0%
SPRS 259,791,575 647,688,665 40.1% 48,372,506 801.9%
Total Pension Funds $11,152,949,505 $24,910,996,000 44.8% $4,526,021,209 304.0%
Th e Schedule of Funding Progress for Pension Funds begins on page 58. Th e Schedule of Funding Progress for the Insurance Fund begins on page 60.
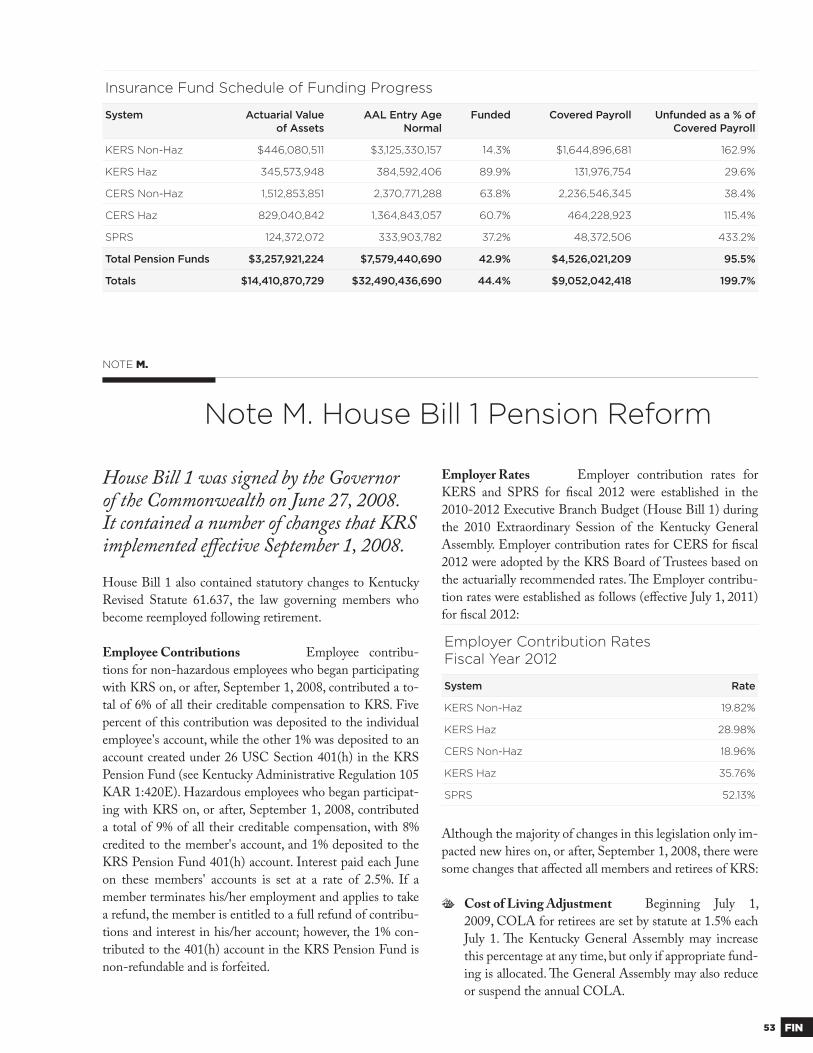
53 FIN
Insurance Fund Schedule of Funding Progress
System Actuarial Value of Assets
AAL Entry Age Normal
Funded Covered Payroll Unfunded as a % of Covered Payroll
KERS Non-Haz $446,080,511 $3,125,330,157 14.3% $1,644,896,681 162.9%
KERS Haz 345,573,948 384,592,406 89.9% 131,976,754 29.6%
CERS Non-Haz 1,512,853,851 2,370,771,288 63.8% 2,236,546,345 38.4%
CERS Haz 829,040,842 1,364,843,057 60.7% 464,228,923 115.4%
SPRS 124,372,072 333,903,782 37.2% 48,372,506 433.2%
Total Pension Funds $3,257,921,224 $7,579,440,690 42.9% $4,526,021,209 95.5%
Totals $14,410,870,729 $32,490,436,690 44.4% $9,052,042,418 199.7%
NOTE M.
House Bill 1 also contained statutory changes to Kentucky
Revised Statute 61.637, the law governing members who
become reemployed following retirement.
Employee Contributions Employee contribu-
tions for non-hazardous employees who began participating
with KRS on, or after, September 1, 2008, contributed a to-
tal of 6% of all their creditable compensation to KRS. Five
percent of this contribution was deposited to the individual
employee's account, while the other 1% was deposited to an
account created under 26 USC Section 401(h) in the KRS
Pension Fund (see Kentucky Administrative Regulation 105
KAR 1:420E). Hazardous employees who began participat-
ing with KRS on, or after, September 1, 2008, contributed
a total of 9% of all their creditable compensation, with 8%
credited to the member's account, and 1% deposited to the
KRS Pension Fund 401(h) account. Interest paid each June
on these members' accounts is set at a rate of 2.5%. If a
member terminates his/her employment and applies to take
a refund, the member is entitled to a full refund of contribu-
tions and interest in his/her account; however, the 1% con-
tributed to the 401(h) account in the KRS Pension Fund is
non-refundable and is forfeited.
Employer Rates Employer contribution rates for
KERS and SPRS for fi scal 2012 were established in the
2010-2012 Executive Branch Budget (House Bill 1) during
the 2010 Extraordinary Session of the Kentucky General
Assembly. Employer contribution rates for CERS for fi scal
2012 were adopted by the KRS Board of Trustees based on
the actuarially recommended rates. Th e Employer contribu-
tion rates were established as follows (eff ective July 1, 2011)
for fi scal 2012:
Note M. House Bill 1 Pension Reform
Employer Contribution RatesFiscal Year 2012
System Rate
KERS Non-Haz 19.82%
KERS Haz 28.98%
CERS Non-Haz 18.96%
KERS Haz 35.76%
SPRS 52.13%
House Bill 1 was signed by the Governor of the Commonwealth on June 27, 2008. It contained a number of changes that KRS implemented eff ective September 1, 2008.
Although the majority of changes in this legislation only im-
pacted new hires on, or after, September 1, 2008, there were
some changes that aff ected all members and retirees of KRS:
v Cost of Living Adjustment Beginning July 1,
2009, COLA for retirees are set by statute at 1.5% each
July 1. Th e Kentucky General Assembly may increase
this percentage at any time, but only if appropriate fund-
ing is allocated. Th e General Assembly may also reduce
or suspend the annual COLA.
54FIN
v Service Purchase Costs Th e actuarial factors used to determine the cost to
purchase a service must assume the earliest date a member can retire with an un-
reduced benefi t, and must also assume a 1.5% COLA will be enacted. Th is change
results in an increased service purchase cost for any purchase calculated on, or after,
September 1, 2008. Th is change also aff ects the cost billed to employers for sick
leave when an employee retires.
v Payment Options Th e Partial Lump Sum Payment Option was made avail-
able only to those employees who retired on, or before, January 1, 2009.
Kentucky Revised Statute 61.637 was modifi ed signifi cantly by House Bill 1. Specifi -
cally, a retiree who is reemployed on, or after, September 1, 2008, cannot accrue ad-
ditional service credit in KRS, even if employed in a position that would otherwise be
required to participate in KRS. However, if a retiree is reemployed in a regular full time
position, his/her employer is required to pay contributions on all creditable compensa-
tion earned during the period of reemployment. Th ese contributions are used to reduce
the unfunded actuarial liability.
COLACost of Living Adjustment
NOTE N.
In fi scal 2009, Kentucky Retirement Systems submitted an application to the Centers
for Medicare & Medicaid Services, of the Department of Health & Human Services,
to enter into a contract to off er a Medicare Prescription Drug Plan (PDP), as described
in the Medicare Prescription Drug Benefi t Final Rule published in the Federal Regis-
ter on January 28, 2005 (70 Fed. Reg. 4194). As part of the application process, KRS
was required to establish a segregated Insolvency Account in the amount of $100,000;
this account must retain a minimum balance of $100,000. Th e account consists of
cash and/or cash equivalents and is invested on a daily basis. On February 19, 2009,
KRS established the KRS Insurance Prescription Drug Fund at Northern Trust. As of
June 30, 2012 and 2011, the Insolvency Account amounted to $100,691 and $100,620,
respectively.
Note N. Medicare Prescription Drug Plan
PDPPrescription Drug Plan
NOTE O.
House Bill 300 was signed by the Governor on April 11, 2012. Th e Bill makes
changes/additions to information and defi nitions regarding placement agents, audits
to be performed on KRS by the Kentucky Auditor of Public Accounts, terms of service
of Trustees of the Board, terms of service of Board offi cers (Chair and Vice-Chair),
among other changes.
Note O. House Bill 300 Pension Reform
55 FIN
NOTE Q.
Firefi ghter employees of Louisville/Jeff erson County Metro Government were award-
ed a total of $28,440,159 for back-pay. Of that total, $28,425,232, was determined to
be the amount of creditable compensation. Th e total contributions owed to KRS were
calculated by applying the contribution rate in eff ect for each fi scal year awarded (fi scal
1986 to fi scal 2009) while considering the appropriate participation status, hazardous
or non-hazardous, of each employee. Th ese calculations established that the total em-
ployer contribution owed was $5,113,511, and the total employee contribution owed
was $2,083,310, for a total of $7,196,821. Th ese amounts were received on July 27,
2010.
KRS also calculated the impact on fi nal compensation caused by the retroactive benefi ts
paid to those fi refi ghters who have already retired. KRS was required to pay retroactive
benefi t payments totaling $6,221,219, refl ecting additional benefi ts due to the increase
in fi nal compensation. Th e liability was paid on August 22, 2010, by issuance of benefi t
payments to the individual fi refi ghter members.
Kentucky Revised Statute 61.675(3)(b) requires that KRS collect interest on unmade or
delinquent contributions. Th e interest owed by the Louisville/Jeff erson County Metro
Government, as calculated by KRS' actuaries, amounted to $12,020,731. Th erefore, the
total amount due KRS was $19,217,552. As stated earlier, $7,196,821 was received on
July 27, 2010.
On July 2, 2012, KRS received an additional $7,000,000, for interest owed, which by
settlement extinguished the liability to KRS.
Note Q. Louisville/Jeff erson County Metro Firefi ghters
NOTE P.
As a result of the passage of House Bill 1 on September 1, 2008, if a retiree is reem-
ployed in a regular full time position and has chosen health insurance coverage through
KRS, the employer is required to reimburse KRS for the health insurance premium
paid on the retiree’s behalf, not to exceed the cost of the single premium rate. As
of June 30, 2012 and 2011, the reimbursement totaled $6,349,929 and $4,041,974,
respectively.
Note P. Reimbursement Of Retired – Reemployed Health Insurance
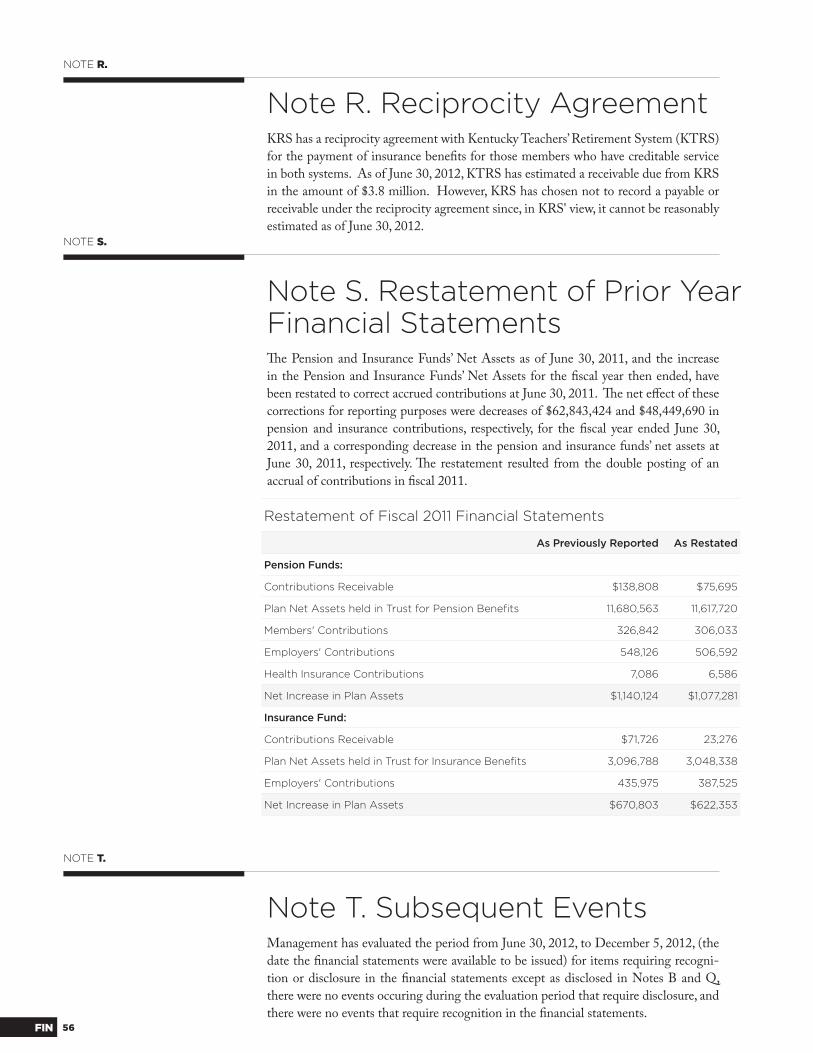
56FIN
NOTE R.
KRS has a reciprocity agreement with Kentucky Teachers’ Retirement System (KTRS)
for the payment of insurance benefi ts for those members who have creditable service
in both systems. As of June 30, 2012, KTRS has estimated a receivable due from KRS
in the amount of $3.8 million. However, KRS has chosen not to record a payable or
receivable under the reciprocity agreement since, in KRS' view, it cannot be reasonably
estimated as of June 30, 2012.
Note R. Reciprocity Agreement
NOTE S.
Th e Pension and Insurance Funds’ Net Assets as of June 30, 2011, and the increase
in the Pension and Insurance Funds’ Net Assets for the fi scal year then ended, have
been restated to correct accrued contributions at June 30, 2011. Th e net eff ect of these
corrections for reporting purposes were decreases of $62,843,424 and $48,449,690 in
pension and insurance contributions, respectively, for the fi scal year ended June 30,
2011, and a corresponding decrease in the pension and insurance funds’ net assets at
June 30, 2011, respectively. Th e restatement resulted from the double posting of an
accrual of contributions in fi scal 2011.
Note S. Restatement of Prior Year Financial Statements
NOTE T.
Management has evaluated the period from June 30, 2012, to December 5, 2012, (the
date the fi nancial statements were available to be issued) for items requiring recogni-
tion or disclosure in the fi nancial statements except as disclosed in Notes B and Q,
there were no events occuring during the evaluation period that require disclosure, and
there were no events that require recognition in the fi nancial statements.
Note T. Subsequent Events
Restatement of Fiscal 2011 Financial Statements
As Previously Reported As Restated
Pension Funds:
Contributions Receivable $138,808 $75,695
Plan Net Assets held in Trust for Pension Benefi ts 11,680,563 11,617,720
Members' Contributions 326,842 306,033
Employers' Contributions 548,126 506,592
Health Insurance Contributions 7,086 6,586
Net Increase in Plan Assets $1,140,124 $1,077,281
Insurance Fund:
Contributions Receivable $71,726 23,276
Plan Net Assets held in Trust for Insurance Benefi ts 3,096,788 3,048,338
Employers' Contributions 435,975 387,525
Net Increase in Plan Assets $670,803 $622,353

57 FIN
Required Supplementary Information
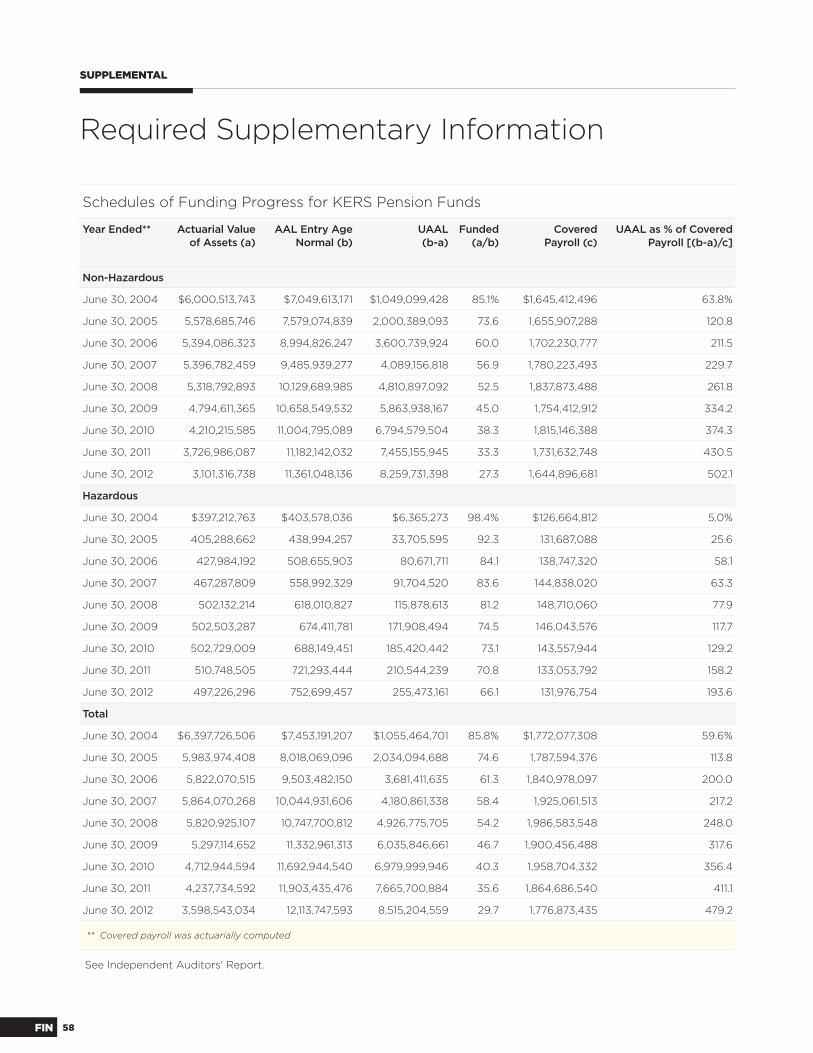
58FIN
SUPPLEMENTAL
Required Supplementary Information
Schedules of Funding Progress for KERS Pension Funds
Year Ended** Actuarial Value of Assets (a)
AAL Entry Age Normal (b)
UAAL(b-a)
Funded(a/b)
CoveredPayroll (c)
UAAL as % of Covered Payroll [(b-a)/c]
Non-Hazardous
June 30, 2004 $6,000,513,743 $7,049,613,171 $1,049,099,428 85.1% $1,645,412,496 63.8%
June 30, 2005 5,578,685,746 7,579,074,839 2,000,389,093 73.6 1,655,907,288 120.8
June 30, 2006 5,394,086,323 8,994,826,247 3,600,739,924 60.0 1,702,230,777 211.5
June 30, 2007 5,396,782,459 9,485,939,277 4,089,156,818 56.9 1,780,223,493 229.7
June 30, 2008 5,318,792,893 10,129,689,985 4,810,897,092 52.5 1,837,873,488 261.8
June 30, 2009 4,794,611,365 10,658,549,532 5,863,938,167 45.0 1,754,412,912 334.2
June 30, 2010 4,210,215,585 11,004,795,089 6,794,579,504 38.3 1,815,146,388 374.3
June 30, 2011 3,726,986,087 11,182,142,032 7,455,155,945 33.3 1,731,632,748 430.5
June 30, 2012 3,101,316,738 11,361,048,136 8,259,731,398 27.3 1,644,896,681 502.1
Hazardous
June 30, 2004 $397,212,763 $403,578,036 $6,365,273 98.4% $126,664,812 5.0%
June 30, 2005 405,288,662 438,994,257 33,705,595 92.3 131,687,088 25.6
June 30, 2006 427,984,192 508,655,903 80,671,711 84.1 138,747,320 58.1
June 30, 2007 467,287,809 558,992,329 91,704,520 83.6 144,838,020 63.3
June 30, 2008 502,132,214 618,010,827 115,878,613 81.2 148,710,060 77.9
June 30, 2009 502,503,287 674,411,781 171,908,494 74.5 146,043,576 117.7
June 30, 2010 502,729,009 688,149,451 185,420,442 73.1 143,557,944 129.2
June 30, 2011 510,748,505 721,293,444 210,544,239 70.8 133,053,792 158.2
June 30, 2012 497,226,296 752,699,457 255,473,161 66.1 131,976,754 193.6
Total
June 30, 2004 $6,397,726,506 $7,453,191,207 $1,055,464,701 85.8% $1,772,077,308 59.6%
June 30, 2005 5,983,974,408 8,018,069,096 2,034,094,688 74.6 1,787,594,376 113.8
June 30, 2006 5,822,070,515 9,503,482,150 3,681,411,635 61.3 1,840,978,097 200.0
June 30, 2007 5,864,070,268 10,044,931,606 4,180,861,338 58.4 1,925,061,513 217.2
June 30, 2008 5,820,925,107 10,747,700,812 4,926,775,705 54.2 1,986,583,548 248.0
June 30, 2009 5,297,114,652 11,332,961,313 6,035,846,661 46.7 1,900,456,488 317.6
June 30, 2010 4,712,944,594 11,692,944,540 6,979,999,946 40.3 1,958,704,332 356.4
June 30, 2011 4,237,734,592 11,903,435,476 7,665,700,884 35.6 1,864,686,540 411.1
June 30, 2012 3,598,543,034 12,113,747,593 8,515,204,559 29.7 1,776,873,435 479.2
** Covered payroll was actuarially computed
See Independent Auditors' Report.
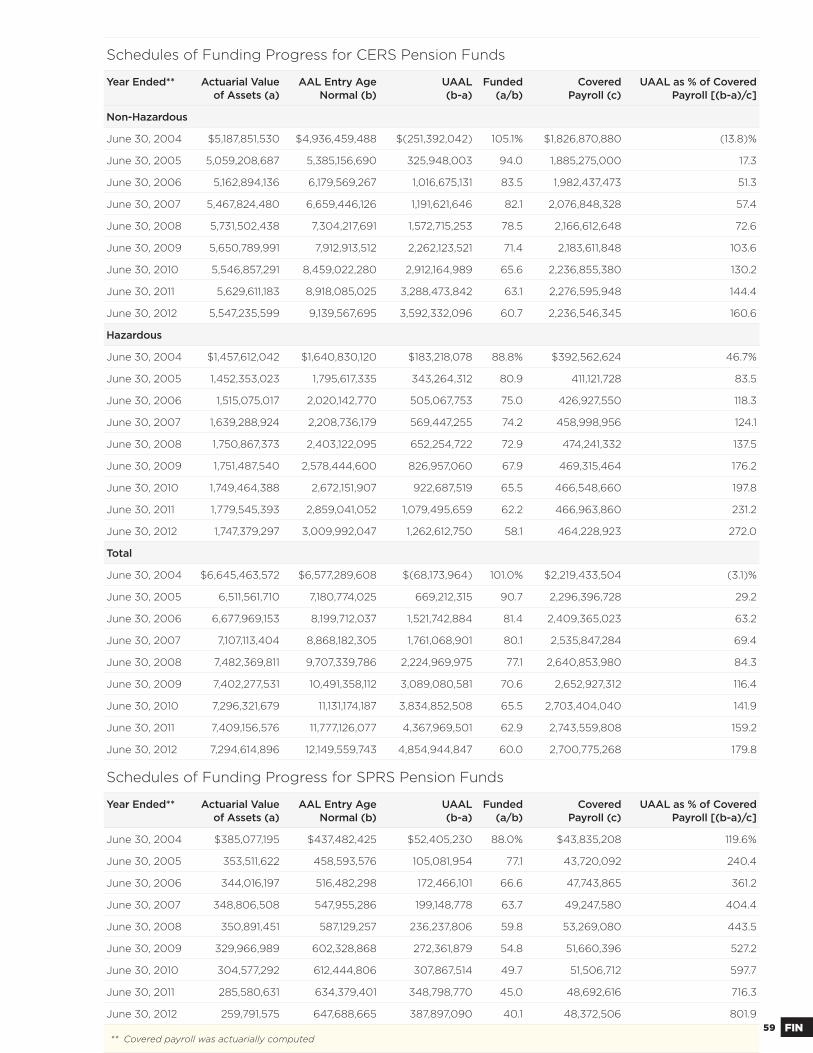
59 FIN
Schedules of Funding Progress for CERS Pension Funds
Year Ended** Actuarial Value of Assets (a)
AAL Entry Age Normal (b)
UAAL(b-a)
Funded(a/b)
CoveredPayroll (c)
UAAL as % of Covered Payroll [(b-a)/c]
Non-Hazardous
June 30, 2004 $5,187,851,530 $4,936,459,488 $(251,392,042) 105.1% $1,826,870,880 (13.8)%
June 30, 2005 5,059,208,687 5,385,156,690 325,948,003 94.0 1,885,275,000 17.3
June 30, 2006 5,162,894,136 6,179,569,267 1,016,675,131 83.5 1,982,437,473 51.3
June 30, 2007 5,467,824,480 6,659,446,126 1,191,621,646 82.1 2,076,848,328 57.4
June 30, 2008 5,731,502,438 7,304,217,691 1,572,715,253 78.5 2,166,612,648 72.6
June 30, 2009 5,650,789,991 7,912,913,512 2,262,123,521 71.4 2,183,611,848 103.6
June 30, 2010 5,546,857,291 8,459,022,280 2,912,164,989 65.6 2,236,855,380 130.2
June 30, 2011 5,629,611,183 8,918,085,025 3,288,473,842 63.1 2,276,595,948 144.4
June 30, 2012 5,547,235,599 9,139,567,695 3,592,332,096 60.7 2,236,546,345 160.6
Hazardous
June 30, 2004 $1,457,612,042 $1,640,830,120 $183,218,078 88.8% $392,562,624 46.7%
June 30, 2005 1,452,353,023 1,795,617,335 343,264,312 80.9 411,121,728 83.5
June 30, 2006 1,515,075,017 2,020,142,770 505,067,753 75.0 426,927,550 118.3
June 30, 2007 1,639,288,924 2,208,736,179 569,447,255 74.2 458,998,956 124.1
June 30, 2008 1,750,867,373 2,403,122,095 652,254,722 72.9 474,241,332 137.5
June 30, 2009 1,751,487,540 2,578,444,600 826,957,060 67.9 469,315,464 176.2
June 30, 2010 1,749,464,388 2,672,151,907 922,687,519 65.5 466,548,660 197.8
June 30, 2011 1,779,545,393 2,859,041,052 1,079,495,659 62.2 466,963,860 231.2
June 30, 2012 1,747,379,297 3,009,992,047 1,262,612,750 58.1 464,228,923 272.0
Total
June 30, 2004 $6,645,463,572 $6,577,289,608 $(68,173,964) 101.0% $2,219,433,504 (3.1)%
June 30, 2005 6,511,561,710 7,180,774,025 669,212,315 90.7 2,296,396,728 29.2
June 30, 2006 6,677,969,153 8,199,712,037 1,521,742,884 81.4 2,409,365,023 63.2
June 30, 2007 7,107,113,404 8,868,182,305 1,761,068,901 80.1 2,535,847,284 69.4
June 30, 2008 7,482,369,811 9,707,339,786 2,224,969,975 77.1 2,640,853,980 84.3
June 30, 2009 7,402,277,531 10,491,358,112 3,089,080,581 70.6 2,652,927,312 116.4
June 30, 2010 7,296,321,679 11,131,174,187 3,834,852,508 65.5 2,703,404,040 141.9
June 30, 2011 7,409,156,576 11,777,126,077 4,367,969,501 62.9 2,743,559,808 159.2
June 30, 2012 7,294,614,896 12,149,559,743 4,854,944,847 60.0 2,700,775,268 179.8
Schedules of Funding Progress for SPRS Pension Funds
Year Ended** Actuarial Value of Assets (a)
AAL Entry Age Normal (b)
UAAL(b-a)
Funded(a/b)
CoveredPayroll (c)
UAAL as % of Covered Payroll [(b-a)/c]
June 30, 2004 $385,077,195 $437,482,425 $52,405,230 88.0% $43,835,208 119.6%
June 30, 2005 353,511,622 458,593,576 105,081,954 77.1 43,720,092 240.4
June 30, 2006 344,016,197 516,482,298 172,466,101 66.6 47,743,865 361.2
June 30, 2007 348,806,508 547,955,286 199,148,778 63.7 49,247,580 404.4
June 30, 2008 350,891,451 587,129,257 236,237,806 59.8 53,269,080 443.5
June 30, 2009 329,966,989 602,328,868 272,361,879 54.8 51,660,396 527.2
June 30, 2010 304,577,292 612,444,806 307,867,514 49.7 51,506,712 597.7
June 30, 2011 285,580,631 634,379,401 348,798,770 45.0 48,692,616 716.3
June 30, 2012 259,791,575 647,688,665 387,897,090 40.1 48,372,506 801.9
** Covered payroll was actuarially computed
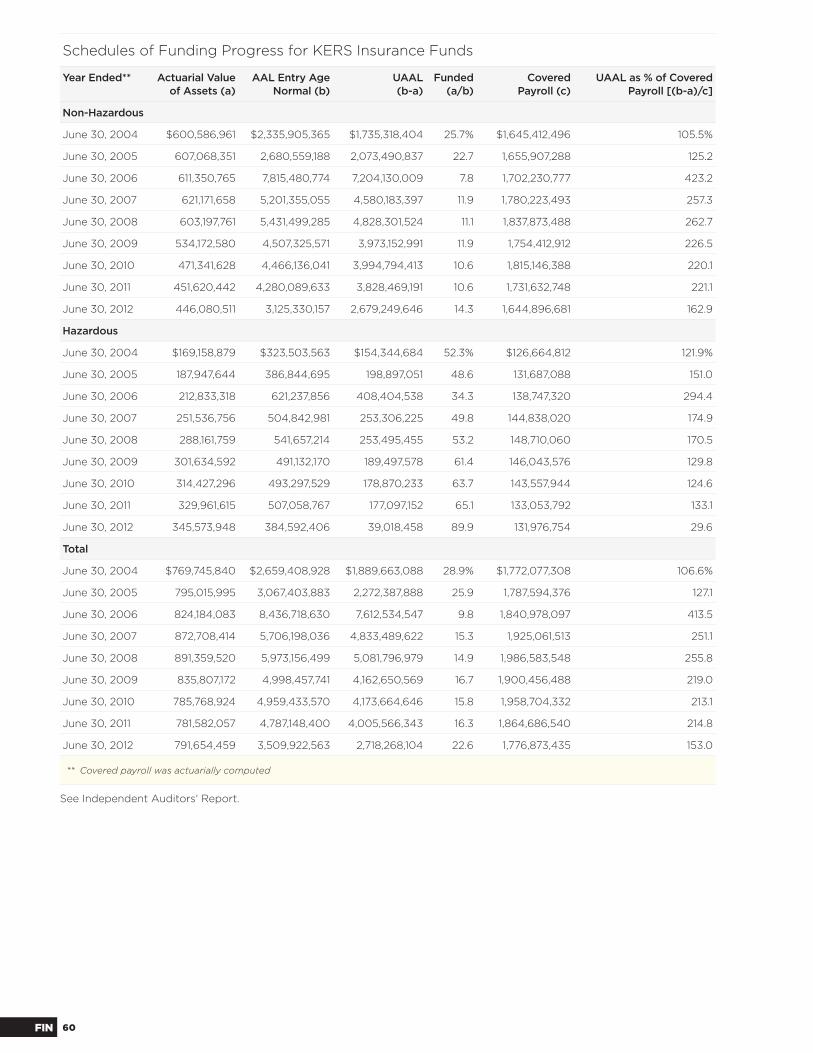
60FIN
Schedules of Funding Progress for KERS Insurance Funds
Year Ended** Actuarial Value of Assets (a)
AAL Entry Age Normal (b)
UAAL(b-a)
Funded(a/b)
CoveredPayroll (c)
UAAL as % of Covered Payroll [(b-a)/c]
Non-Hazardous
June 30, 2004 $600,586,961 $2,335,905,365 $1,735,318,404 25.7% $1,645,412,496 105.5%
June 30, 2005 607,068,351 2,680,559,188 2,073,490,837 22.7 1,655,907,288 125.2
June 30, 2006 611,350,765 7,815,480,774 7,204,130,009 7.8 1,702,230,777 423.2
June 30, 2007 621,171,658 5,201,355,055 4,580,183,397 11.9 1,780,223,493 257.3
June 30, 2008 603,197,761 5,431,499,285 4,828,301,524 11.1 1,837,873,488 262.7
June 30, 2009 534,172,580 4,507,325,571 3,973,152,991 11.9 1,754,412,912 226.5
June 30, 2010 471,341,628 4,466,136,041 3,994,794,413 10.6 1,815,146,388 220.1
June 30, 2011 451,620,442 4,280,089,633 3,828,469,191 10.6 1,731,632,748 221.1
June 30, 2012 446,080,511 3,125,330,157 2,679,249,646 14.3 1,644,896,681 162.9
Hazardous
June 30, 2004 $169,158,879 $323,503,563 $154,344,684 52.3% $126,664,812 121.9%
June 30, 2005 187,947,644 386,844,695 198,897,051 48.6 131,687,088 151.0
June 30, 2006 212,833,318 621,237,856 408,404,538 34.3 138,747,320 294.4
June 30, 2007 251,536,756 504,842,981 253,306,225 49.8 144,838,020 174.9
June 30, 2008 288,161,759 541,657,214 253,495,455 53.2 148,710,060 170.5
June 30, 2009 301,634,592 491,132,170 189,497,578 61.4 146,043,576 129.8
June 30, 2010 314,427,296 493,297,529 178,870,233 63.7 143,557,944 124.6
June 30, 2011 329,961,615 507,058,767 177,097,152 65.1 133,053,792 133.1
June 30, 2012 345,573,948 384,592,406 39,018,458 89.9 131,976,754 29.6
Total
June 30, 2004 $769,745,840 $2,659,408,928 $1,889,663,088 28.9% $1,772,077,308 106.6%
June 30, 2005 795,015,995 3,067,403,883 2,272,387,888 25.9 1,787,594,376 127.1
June 30, 2006 824,184,083 8,436,718,630 7,612,534,547 9.8 1,840,978,097 413.5
June 30, 2007 872,708,414 5,706,198,036 4,833,489,622 15.3 1,925,061,513 251.1
June 30, 2008 891,359,520 5,973,156,499 5,081,796,979 14.9 1,986,583,548 255.8
June 30, 2009 835,807,172 4,998,457,741 4,162,650,569 16.7 1,900,456,488 219.0
June 30, 2010 785,768,924 4,959,433,570 4,173,664,646 15.8 1,958,704,332 213.1
June 30, 2011 781,582,057 4,787,148,400 4,005,566,343 16.3 1,864,686,540 214.8
June 30, 2012 791,654,459 3,509,922,563 2,718,268,104 22.6 1,776,873,435 153.0
** Covered payroll was actuarially computed
See Independent Auditors' Report.
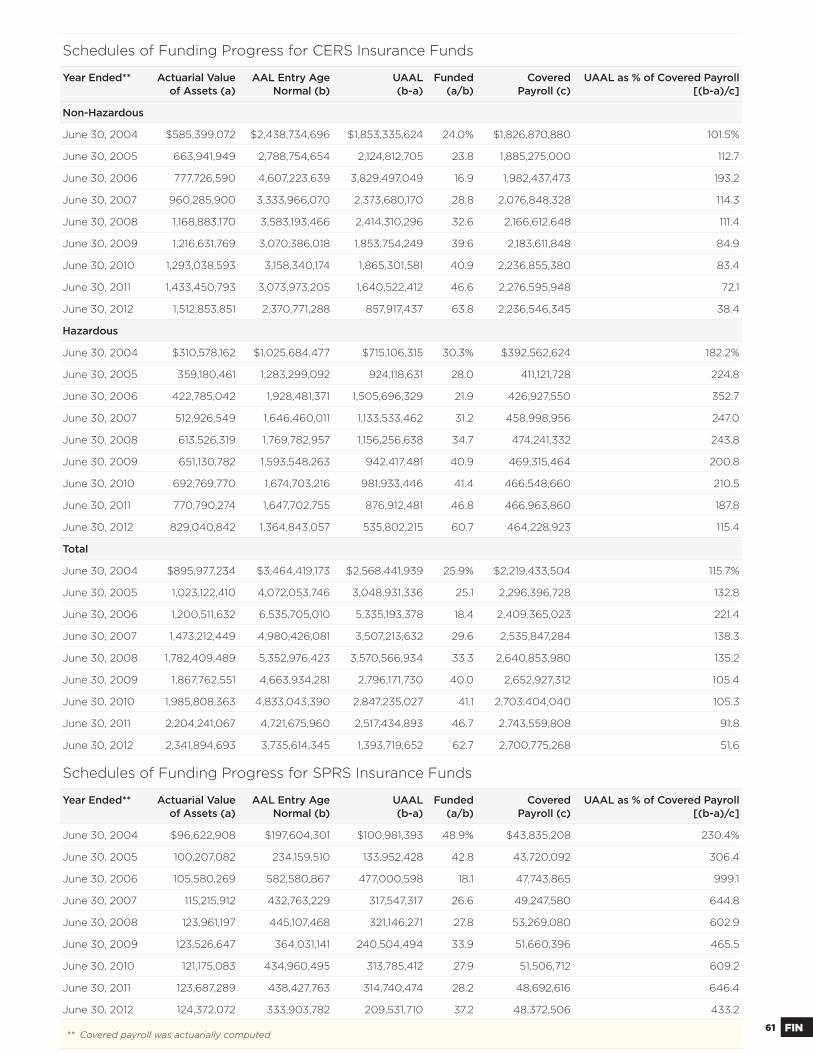
61 FIN
Schedules of Funding Progress for CERS Insurance Funds
Year Ended** Actuarial Value of Assets (a)
AAL Entry Age Normal (b)
UAAL(b-a)
Funded(a/b)
CoveredPayroll (c)
UAAL as % of Covered Payroll [(b-a)/c]
Non-Hazardous
June 30, 2004 $585,399,072 $2,438,734,696 $1,853,335,624 24.0% $1,826,870,880 101.5%
June 30, 2005 663,941,949 2,788,754,654 2,124,812,705 23.8 1,885,275,000 112.7
June 30, 2006 777,726,590 4,607,223,639 3,829,497,049 16.9 1,982,437,473 193.2
June 30, 2007 960,285,900 3,333,966,070 2,373,680,170 28.8 2,076,848,328 114.3
June 30, 2008 1,168,883,170 3,583,193,466 2,414,310,296 32.6 2,166,612,648 111.4
June 30, 2009 1,216,631,769 3,070,386,018 1,853,754,249 39.6 2,183,611,848 84.9
June 30, 2010 1,293,038,593 3,158,340,174 1,865,301,581 40.9 2,236,855,380 83.4
June 30, 2011 1,433,450,793 3,073,973,205 1,640,522,412 46.6 2,276,595,948 72.1
June 30, 2012 1,512,853,851 2,370,771,288 857,917,437 63.8 2,236,546,345 38.4
Hazardous
June 30, 2004 $310,578,162 $1,025,684,477 $715,106,315 30.3% $392,562,624 182.2%
June 30, 2005 359,180,461 1,283,299,092 924,118,631 28.0 411,121,728 224.8
June 30, 2006 422,785,042 1,928,481,371 1,505,696,329 21.9 426,927,550 352.7
June 30, 2007 512,926,549 1,646,460,011 1,133,533,462 31.2 458,998,956 247.0
June 30, 2008 613,526,319 1,769,782,957 1,156,256,638 34.7 474,241,332 243.8
June 30, 2009 651,130,782 1,593,548,263 942,417,481 40.9 469,315,464 200.8
June 30, 2010 692,769,770 1,674,703,216 981,933,446 41.4 466,548,660 210.5
June 30, 2011 770,790,274 1,647,702,755 876,912,481 46.8 466,963,860 187.8
June 30, 2012 829,040,842 1,364,843,057 535,802,215 60.7 464,228,923 115.4
Total
June 30, 2004 $895,977,234 $3,464,419,173 $2,568,441,939 25.9% $2,219,433,504 115.7%
June 30, 2005 1,023,122,410 4,072,053,746 3,048,931,336 25.1 2,296,396,728 132.8
June 30, 2006 1,200,511,632 6,535,705,010 5,335,193,378 18.4 2,409,365,023 221.4
June 30, 2007 1,473,212,449 4,980,426,081 3,507,213,632 29.6 2,535,847,284 138.3
June 30, 2008 1,782,409,489 5,352,976,423 3,570,566,934 33.3 2,640,853,980 135.2
June 30, 2009 1,867,762,551 4,663,934,281 2,796,171,730 40.0 2,652,927,312 105.4
June 30, 2010 1,985,808,363 4,833,043,390 2,847,235,027 41.1 2,703,404,040 105.3
June 30, 2011 2,204,241,067 4,721,675,960 2,517,434,893 46.7 2,743,559,808 91.8
June 30, 2012 2,341,894,693 3,735,614,345 1,393,719,652 62.7 2,700,775,268 51.6
Schedules of Funding Progress for SPRS Insurance Funds
Year Ended** Actuarial Value of Assets (a)
AAL Entry Age Normal (b)
UAAL(b-a)
Funded(a/b)
CoveredPayroll (c)
UAAL as % of Covered Payroll [(b-a)/c]
June 30, 2004 $96,622,908 $197,604,301 $100,981,393 48.9% $43,835,208 230.4%
June 30, 2005 100,207,082 234,159,510 133,952,428 42.8 43,720,092 306.4
June 30, 2006 105,580,269 582,580,867 477,000,598 18.1 47,743,865 999.1
June 30, 2007 115,215,912 432,763,229 317,547,317 26.6 49,247,580 644.8
June 30, 2008 123,961,197 445,107,468 321,146,271 27.8 53,269,080 602.9
June 30, 2009 123,526,647 364,031,141 240,504,494 33.9 51,660,396 465.5
June 30, 2010 121,175,083 434,960,495 313,785,412 27.9 51,506,712 609.2
June 30, 2011 123,687,289 438,427,763 314,740,474 28.2 48,692,616 646.4
June 30, 2012 124,372,072 333,903,782 209,531,710 37.2 48,372,506 433.2
** Covered payroll was actuarially computed
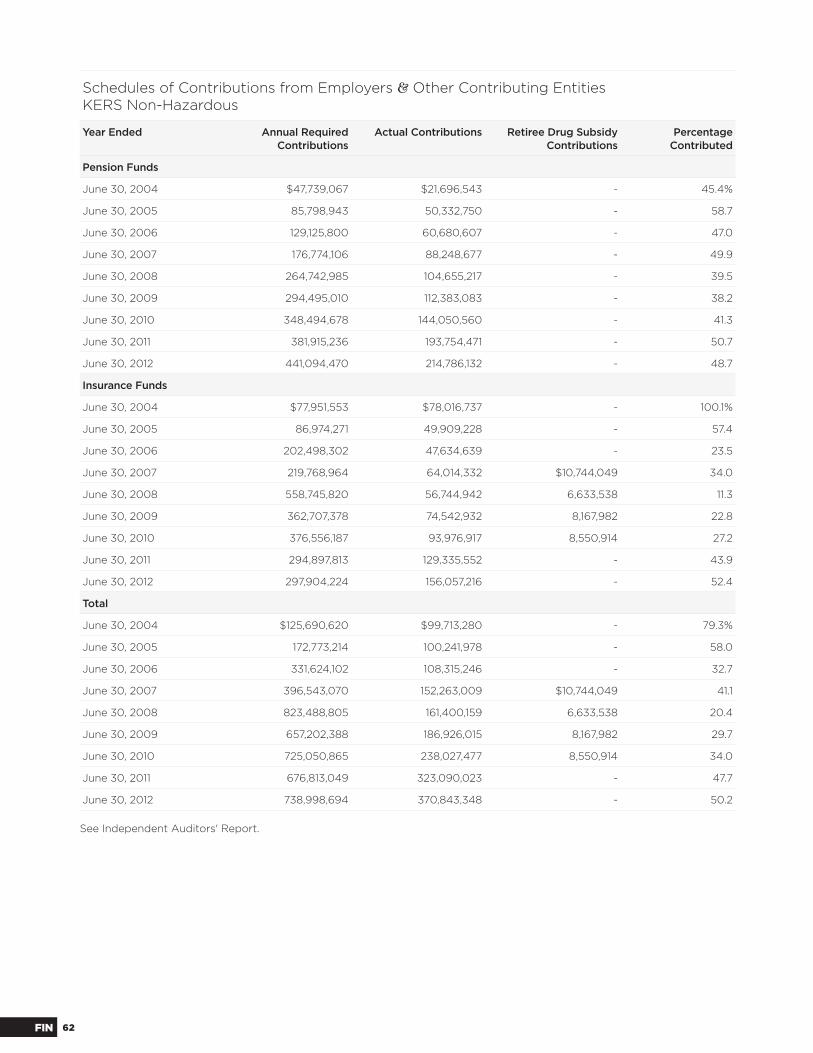
62FIN
Schedules of Contributions from Employers & Other Contributing Entities KERS Non-Hazardous
Year Ended Annual Required Contributions
Actual Contributions Retiree Drug Subsidy Contributions
Percentage Contributed
Pension Funds
June 30, 2004 $47,739,067 $21,696,543 - 45.4%
June 30, 2005 85,798,943 50,332,750 - 58.7
June 30, 2006 129,125,800 60,680,607 - 47.0
June 30, 2007 176,774,106 88,248,677 - 49.9
June 30, 2008 264,742,985 104,655,217 - 39.5
June 30, 2009 294,495,010 112,383,083 - 38.2
June 30, 2010 348,494,678 144,050,560 - 41.3
June 30, 2011 381,915,236 193,754,471 - 50.7
June 30, 2012 441,094,470 214,786,132 - 48.7
Insurance Funds
June 30, 2004 $77,951,553 $78,016,737 - 100.1%
June 30, 2005 86,974,271 49,909,228 - 57.4
June 30, 2006 202,498,302 47,634,639 - 23.5
June 30, 2007 219,768,964 64,014,332 $10,744,049 34.0
June 30, 2008 558,745,820 56,744,942 6,633,538 11.3
June 30, 2009 362,707,378 74,542,932 8,167,982 22.8
June 30, 2010 376,556,187 93,976,917 8,550,914 27.2
June 30, 2011 294,897,813 129,335,552 - 43.9
June 30, 2012 297,904,224 156,057,216 - 52.4
Total
June 30, 2004 $125,690,620 $99,713,280 - 79.3%
June 30, 2005 172,773,214 100,241,978 - 58.0
June 30, 2006 331,624,102 108,315,246 - 32.7
June 30, 2007 396,543,070 152,263,009 $10,744,049 41.1
June 30, 2008 823,488,805 161,400,159 6,633,538 20.4
June 30, 2009 657,202,388 186,926,015 8,167,982 29.7
June 30, 2010 725,050,865 238,027,477 8,550,914 34.0
June 30, 2011 676,813,049 323,090,023 - 47.7
June 30, 2012 738,998,694 370,843,348 - 50.2
See Independent Auditors' Report.
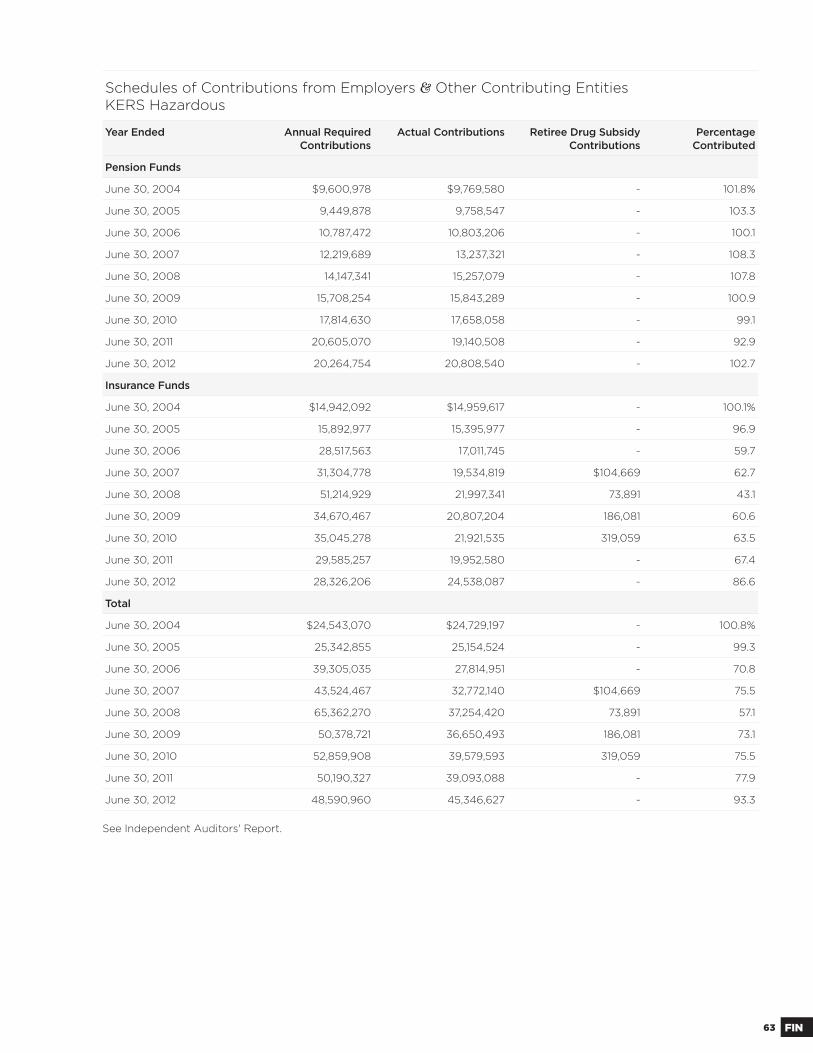
63 FIN
Schedules of Contributions from Employers & Other Contributing Entities KERS Hazardous
Year Ended Annual Required Contributions
Actual Contributions Retiree Drug Subsidy Contributions
Percentage Contributed
Pension Funds
June 30, 2004 $9,600,978 $9,769,580 - 101.8%
June 30, 2005 9,449,878 9,758,547 - 103.3
June 30, 2006 10,787,472 10,803,206 - 100.1
June 30, 2007 12,219,689 13,237,321 - 108.3
June 30, 2008 14,147,341 15,257,079 - 107.8
June 30, 2009 15,708,254 15,843,289 - 100.9
June 30, 2010 17,814,630 17,658,058 - 99.1
June 30, 2011 20,605,070 19,140,508 - 92.9
June 30, 2012 20,264,754 20,808,540 - 102.7
Insurance Funds
June 30, 2004 $14,942,092 $14,959,617 - 100.1%
June 30, 2005 15,892,977 15,395,977 - 96.9
June 30, 2006 28,517,563 17,011,745 - 59.7
June 30, 2007 31,304,778 19,534,819 $104,669 62.7
June 30, 2008 51,214,929 21,997,341 73,891 43.1
June 30, 2009 34,670,467 20,807,204 186,081 60.6
June 30, 2010 35,045,278 21,921,535 319,059 63.5
June 30, 2011 29,585,257 19,952,580 - 67.4
June 30, 2012 28,326,206 24,538,087 - 86.6
Total
June 30, 2004 $24,543,070 $24,729,197 - 100.8%
June 30, 2005 25,342,855 25,154,524 - 99.3
June 30, 2006 39,305,035 27,814,951 - 70.8
June 30, 2007 43,524,467 32,772,140 $104,669 75.5
June 30, 2008 65,362,270 37,254,420 73,891 57.1
June 30, 2009 50,378,721 36,650,493 186,081 73.1
June 30, 2010 52,859,908 39,579,593 319,059 75.5
June 30, 2011 50,190,327 39,093,088 - 77.9
June 30, 2012 48,590,960 45,346,627 - 93.3
See Independent Auditors' Report.

64FIN
Schedules of Contributions from Employers & Other Contributing Entities CERS Non-Hazardous
Year Ended Annual Required Contributions
Actual Contributions Retiree Drug Subsidy Contributions
Percentage Contributed
Pension Funds
June 30, 2004 $43,111,505 $44,028,465 - 102.1%
June 30, 2005 53,117,955 54,616,800 - 102.8
June 30, 2006 83,123,669 90,834,052 - 109.3
June 30, 2007 112,508,305 124,260,850 - 110.4
June 30, 2008 138,311,398 150,925,334 - 109.1
June 30, 2009 161,097,151 179,284,551 - 111.3
June 30, 2010 186,724,383 207,075,842 - 110.9
June 30, 2011 218,984,628 248,518,574 - 113.5
June 30, 2012 261,764,019 275,736,191 - 105.3
Insurance Funds
June 30, 2004 $89,289,520 $89,344,241 - 100.1%
June 30, 2005 106,612,633 106,638,253 - 100.0
June 30, 2006 272,942,757 128,867,817 - 47.2
June 30, 2007 285,600,490 147,608,801 $9,623,431 55.1
June 30, 2008 406,541,729 196,110,111 6,003,181 49.7
June 30, 2009 264,733,532 123,852,611 7,623,628 49.6
June 30, 2010 266,331,326 166,607,097 9,156,991 66.0
June 30, 2011 213,429,424 186,885,576 - 87.6
June 30, 2012 214,421,008 171,924,836 - 80.2
Total
June 30, 2004 $132,401,025 $133,372,706 - 100.7%
June 30, 2005 159,730,588 161,255,053 - 101.0
June 30, 2006 356,066,426 219,701,869 - 61.7
June 30, 2007 398,108,795 271,869,651 $9,623,431 70.7
June 30, 2008 544,853,127 347,035,445 6,003,181 64.8
June 30, 2009 425,830,683 303,137,162 7,623,628 73.0
June 30, 2010 453,055,709 373,682,939 9,156,991 84.5
June 30, 2011 432,414,052 435,404,150 - 100.7
June 30, 2012 476,185,027 447,661,027 - 94.0
See Independent Auditors' Report.
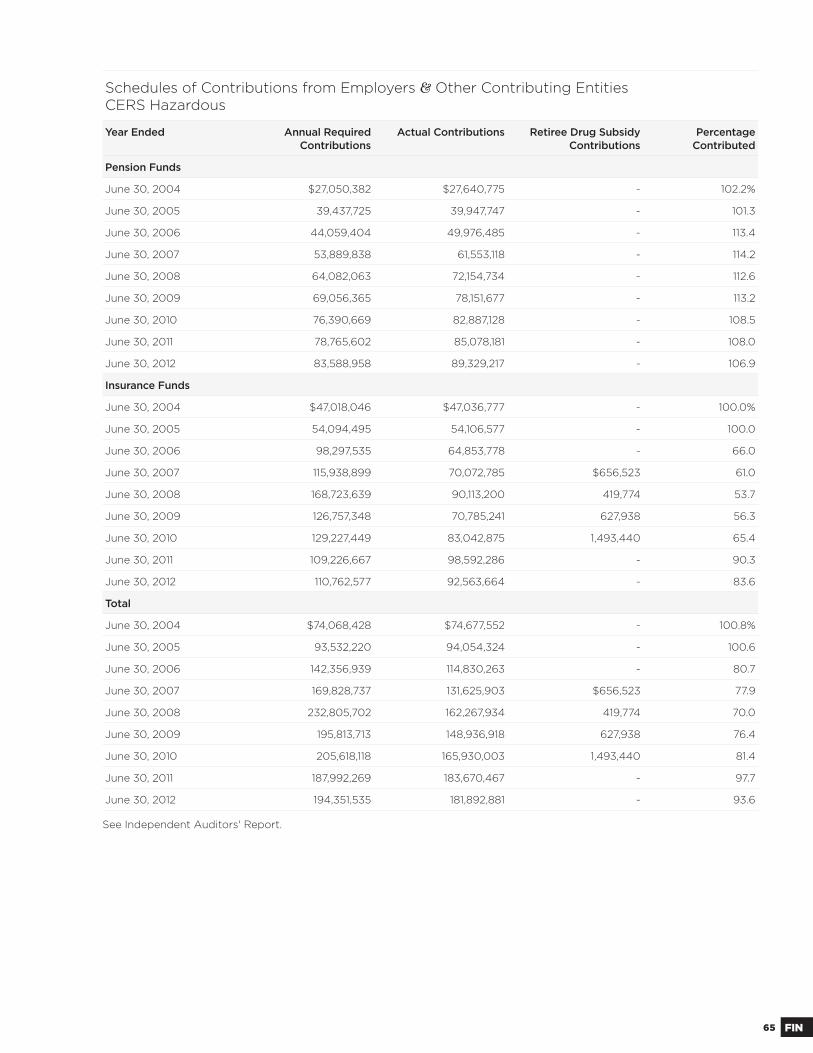
65 FIN
Schedules of Contributions from Employers & Other Contributing Entities CERS Hazardous
Year Ended Annual Required Contributions
Actual Contributions Retiree Drug Subsidy Contributions
Percentage Contributed
Pension Funds
June 30, 2004 $27,050,382 $27,640,775 - 102.2%
June 30, 2005 39,437,725 39,947,747 - 101.3
June 30, 2006 44,059,404 49,976,485 - 113.4
June 30, 2007 53,889,838 61,553,118 - 114.2
June 30, 2008 64,082,063 72,154,734 - 112.6
June 30, 2009 69,056,365 78,151,677 - 113.2
June 30, 2010 76,390,669 82,887,128 - 108.5
June 30, 2011 78,765,602 85,078,181 - 108.0
June 30, 2012 83,588,958 89,329,217 - 106.9
Insurance Funds
June 30, 2004 $47,018,046 $47,036,777 - 100.0%
June 30, 2005 54,094,495 54,106,577 - 100.0
June 30, 2006 98,297,535 64,853,778 - 66.0
June 30, 2007 115,938,899 70,072,785 $656,523 61.0
June 30, 2008 168,723,639 90,113,200 419,774 53.7
June 30, 2009 126,757,348 70,785,241 627,938 56.3
June 30, 2010 129,227,449 83,042,875 1,493,440 65.4
June 30, 2011 109,226,667 98,592,286 - 90.3
June 30, 2012 110,762,577 92,563,664 - 83.6
Total
June 30, 2004 $74,068,428 $74,677,552 - 100.8%
June 30, 2005 93,532,220 94,054,324 - 100.6
June 30, 2006 142,356,939 114,830,263 - 80.7
June 30, 2007 169,828,737 131,625,903 $656,523 77.9
June 30, 2008 232,805,702 162,267,934 419,774 70.0
June 30, 2009 195,813,713 148,936,918 627,938 76.4
June 30, 2010 205,618,118 165,930,003 1,493,440 81.4
June 30, 2011 187,992,269 183,670,467 - 97.7
June 30, 2012 194,351,535 181,892,881 - 93.6
See Independent Auditors' Report.

66FIN
Schedules of Contributions from Employers & Other Contributing Entities SPRS
Year Ended Annual Required Contributions
Actual Contributions Retiree Drug Subsidy Contributions
Percentage Contributed
Pension Funds
June 30, 2004 $1,175,711 $1,152,752 - 98.0%
June 30, 2005 3,730,805 2,851,461 - 76.4
June 30, 2006 6,352,777 4,244,445 - 66.8
June 30, 2007 9,023,665 6,142,326 - 68.1
June 30, 2008 13,823,490 7,443,277 - 53.8
June 30, 2009 15,951,841 8,186,259 - 51.3
June 30, 2010 18,764,941 9,489,399 - 50.6
June 30, 2011 18,463,372 12,657,225 - 68.6
June 30, 2012 20,497,924 15,361,781 - 74.9
Insurance Funds
June 30, 2004 $8,434,834 $8,455,498 - 100.2%
June 30, 2005 8,608,536 6,631,031 - 77.0
June 30, 2006 12,554,648 6,880,517 - 54.8
June 30, 2007 15,233,320 6,488,600 $361,942 45.0
June 30, 2008 43,469,735 7,329,229 183,564 17.3
June 30, 2009 29,324,666 7,413,552 229,240 26.1
June 30, 2010 30,302,151 8,369,428 273,684 28.5
June 30, 2011 25,772,574 11,050,964 - 42.9
June 30, 2012 28,246,786 11,960,468 - 42.3
Total
June 30, 2004 $9,610,545 $9,608,250 - 100.0%
June 30, 2005 12,339,341 9,482,492 - 76.8
June 30, 2006 18,907,425 11,124,962 - 58.8
June 30, 2007 24,256,985 12,630,926 $361,942 53.6
June 30, 2008 57,293,225 14,772,506 183,564 26.1
June 30, 2009 45,276,507 15,599,811 229,240 35.0
June 30, 2010 49,067,092 17,858,827 273,684 37.0
June 30, 2011 44,235,946 23,708,189 - 53.6
June 30, 2012 48,744,710 27,322,249 - 56.0
See Independent Auditors' Report.

67 FIN
SCHEDULES
Additional Supporting SchedulesSchedule of Administrative Expenses (in Thousands)
Expense 2012 2011
Personnel Services
Salaries and Per Diem $14,316 $13,889
Fringe Benefi ts 5,561 5,179
Tuition Assistance 31 23
Total Personnel Services $19,908 $19,091
Contractual Services
Actuarial $297 $270
Audit 30 111
Human Resources 40
Legal 806 231
Medical 229 306
Contractual 1,008 1,353
Total Contractual Services $2,410 $2,271
Communication
Printing $299 $286
Telephone 132 118
Postage 525 593
Travel 182 118
Total Communication $1,138 $1,115
Internal Audit
Travel/Conferences $1
Dues/Subscriptions 2
Miscellaneous 1
Total Internal Audit $4
Note: In fi scal 2012, Administrative Expenses include the Healthcare Fees and Investment Expenses which are paid through the Pension Funds and reimbursed by the Insurance Fund.
Expense 2012 2011
Investments (Pension Fund)
Travel/Conferences $41
Dues/Subscriptions 26
Computer 149
Contractual 858
Miscellaneous 15
Legal 265
Total Investments $1,354
Rentals
Offi ce Space $1,144 $1,125
Equipment 91 90
Total Rentals $1,235 $1,215
Miscellaneous
Utilities $201 $217
Supplies 140 176
Insurance 76 78
Maintenance 40 5
Total Miscellaneous $457 $476
Depreciation/Amortization 1,279 750
Total Pension Fund Administrative Expenses
$27,785 $24,918
Investment Expenses (Insurance Fund)
Investment Consultant $246
Investment Related Travel 9
Dues & Subscriptions 7
Conferences 3
Miscellaneous 4
Software 43
Legal Counsel 76
Subtotal 388
Healthcare Fees 11,584 10,412
Total Insurance Fund Administrative Expenses
$11,972 $10,412
Total Administrative Expenses
$39,757 $35,330
See Independent Auditors' Report.
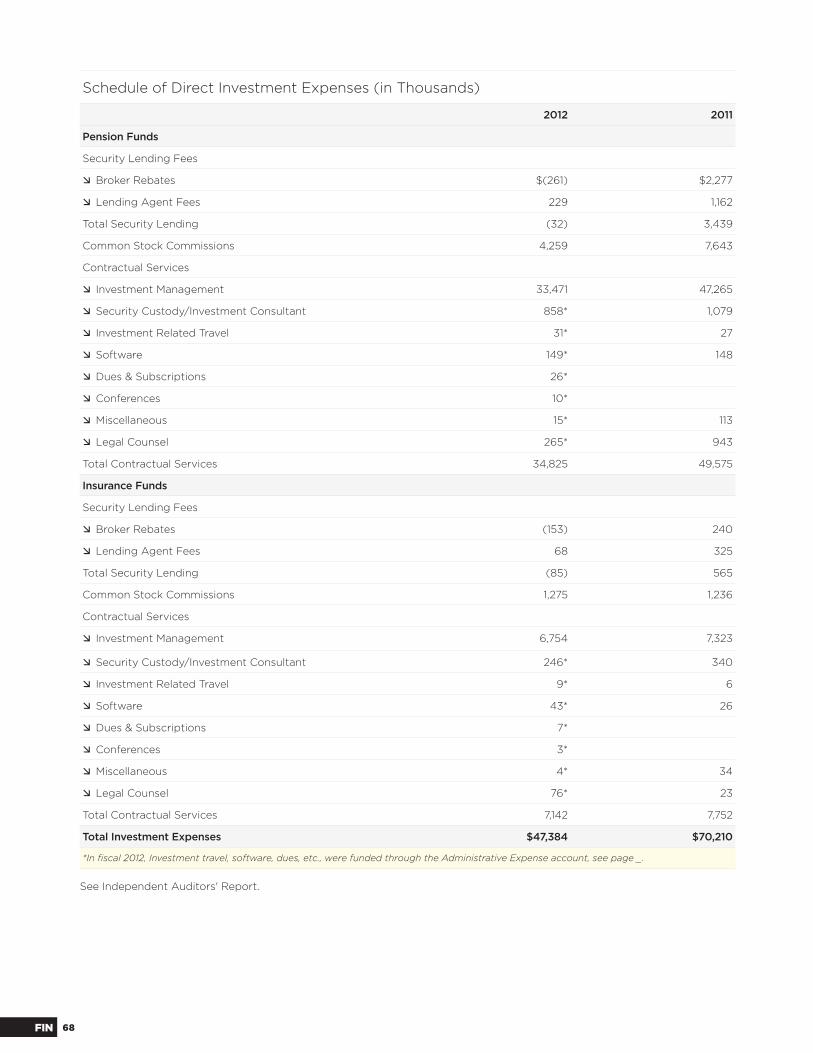
68FIN
Schedule of Direct Investment Expenses (in Thousands)
2012 2011
Pension Funds
Security Lending Fees
Broker Rebates $(261) $2,277
Lending Agent Fees 229 1,162
Total Security Lending (32) 3,439
Common Stock Commissions 4,259 7,643
Contractual Services
Investment Management 33,471 47,265
Security Custody/Investment Consultant 858* 1,079
Investment Related Travel 31* 27
Software 149* 148
Dues & Subscriptions 26*
Conferences 10*
Miscellaneous 15* 113
Legal Counsel 265* 943
Total Contractual Services 34,825 49,575
Insurance Funds
Security Lending Fees
Broker Rebates (153) 240
Lending Agent Fees 68 325
Total Security Lending (85) 565
Common Stock Commissions 1,275 1,236
Contractual Services
Investment Management 6,754 7,323
Security Custody/Investment Consultant 246* 340
Investment Related Travel 9* 6
Software 43* 26
Dues & Subscriptions 7*
Conferences 3*
Miscellaneous 4* 34
Legal Counsel 76* 23
Total Contractual Services 7,142 7,752
Total Investment Expenses $47,384 $70,210
*In fi scal 2012, Investment travel, software, dues, etc., were funded through the Administrative Expense account, see page _.
See Independent Auditors' Report.

69 FIN
Report on Internal Control Over Financial Reporting,
Compliance & Other Matters Based on an Audit of Fi-
nancial Statements Performed in Accordance with Gov-
ernment Auditing Standards To the Board of
Trustees, Kentucky Retirement Systems, Frankfort, Ken-
tucky: We have audited the combining fi nancial statements
of KRS, a component unit of the Commonwealth of Ken-
tucky, as of and for the fi scal year ended June 30, 2012, and
have issued our report thereon dated December 5, 2012. We
conducted our audit in accordance with auditing standards
generally accepted in the United States of America and the
standards applicable to fi nancial audits contained in Govern-
ment Auditing Standards, issued by the Comptroller General
of the United States.
Internal Control Over Financial Reporting M a n -
agement of Kentucky Retirement Systems is responsible for
establishing and maintaining eff ective internal control over
fi nancial reporting. In planning and performing our audit,
we considered KRS' internal control over fi nancial reporting
as a basis for designing our auditing procedures for the pur-
pose of expressing our opinion on the combining fi nancial
statements, but not for the purpose of expressing an opinion
on the eff ectiveness of KRS' internal control over fi nancial
reporting. Accordingly, we do not express an opinion on the
eff ectiveness of KRS' internal control over fi nancial report-
ing. A defi ciency in internal control exists when the design
or operation of a control does not allow management or em-
ployees, in the normal course of performing their assigned
functions, to prevent, or detect and correct misstatements on
a timely basis. A material weakness is a defi ciency, or combi-
nation of defi ciencies, in internal control, such that there is a
reasonable possibility that a material misstatement of the en-
tity's fi nancial statements will not be prevented, or detected
and corrected on a timely basis. Our consideration of internal
control over fi nancial reporting was for the limited purpose
described in the fi rst paragraph of this section and was not
designed to identify all defi ciencies in internal control over
fi nancial reporting that might be defi ciencies, signifi cant
defi ciencies, or material weaknesses. We did not identify any
defi ciencies in internal control over fi nancial reporting that
we consider to be material weaknesses, as defi ned above.
Compliance & Other Matters As part of obtain-
ing reasonable assurance about whether KRS' combining
fi nancial statements are free of material misstatement, we
performed tests of its compliance with certain provisions of
laws, regulations, contracts and grant agreements, noncom-
pliance with which could have a direct and material eff ect on
the determination of fi nancial statement amounts. However,
providing an opinion on compliance with those provisions
was not an objective of our audit and, accordingly, we do not
express such an opinion. Th e results of our tests disclosed
no instances of noncompliance or other matters that are re-
quired to be reported under Government Auditing Standards.
Th is report is intended solely for the information and use
of the Board of Trustees, the audit committee, management,
and the Commonwealth of Kentucky and is not intended to
be and should not be used by anyone other than these speci-
fi ed parties. However, this report is a matter of public record
and its distribution is not limited.
Schedule of Professional Consultant Fees (in Thousands)
Fees 2012 2011
Actuarial Services $297 $270
Medical Review Services 229 306
Audit Services 30 111
Legal Counsel 806 231
Compliance 98 771
Workfl ow 28 209
Healthcare 699 113
Banking 66 55
Human Resources 40
Miscellaneous 117 205
Total 2,410 $2,271
Our audit disclosed no fi ndings which are required to be reported in accordance with Government Auditing Standards.
SCHEDULE OF FINDING & RESPONSE
December 5, 2012
Lexington, Kentucky

70INV

71 INV7171 INVINV
72 One Year Later
73 Investment Summary
74 Investment Objectives
74 Investment Strategies
76 Consultants Review 76 R.V. Kuhns & Associates, Inc. 84 Altius Associates 90 ORG Portfolio Management LLC
94 Investment Results 96 U.S. Equity 98 International Equity 100 Fixed Income 102 Private Equity 102 Real Estate 103 Absolute Return 103 Real Return 104 Cash
106 External Investment Advisors
108 Schedule of Commissions Paid
108 Portfolio Summaries 108 KERS Non-Haz 108 KERS Haz 109 CERS Non-Haz 109 CERS Haz 109 SPRS
INVESTMENTS TABLE OF CONTENTS
IIIIInnnnnnnnnnnvvvvvvvvvvveeeeeeeeeeessssssssssstttttttttttmmmmmmmmmmmeeeeeeeeeeeeeeeeennnnnnnnnnnnnnnnnnnnnnnnnntttttttttttttttttttttttttttttttttttttttttttttttttt SSSSSSSSSSSSSSSSSS iiSSSSSSSSSSSSSSSSSSSSSSSSSSSSSSSSSSSSSSSSSSSSSSSSSSSSSSSSSSSSSSSSSSeeeeeeeeeeeeeeeeeeeeeeeeeeeeeeeeeeeeeeeeeeeeeeccccccccccccccccccccccccccccccccccccccccccccccccccccccccccccccccccctttttttttttttttttttttttttttttttttttttttttttiiiiiiiiiiiiiiiiiiiiiiiiiiiiiioooooooooooooooooooooooooooooooooooooooooooooooooooooooonnnnnnnnnnnnnnnnnnnnnnnnnnnnnnnnnnnnnnnnnn
72INV
One Year Later Th ese themes of healing appear to be continu-
ing, albeit in a slightly modifi ed way, as solutions to the Federal Reserve’s
dual mandate (promotion of economic stability and job creation) have
thus far appeared to be inadequate as consistent, stable economic growth
which leads to persistent job creation has been elusive. In the four years
since the initial credit crisis, the amount of debt on consumers’ balance
sheets has been substantially reduced and thanks to several bond purchas-
ing programs by the Federal Reserve the amount of people underwater
on their mortgages in the United States has been reduced. Th e Federal
Reserve as well as other central banks around the world have substantially
reduced interest rates and have also taken other highly accommodative
monetary policy stances to blunt the eff ects of the fi nancial crisis on what
appears to be an increasingly competitive global economy. Since Septem-
ber of 2009, the Federal Reserve’s balance sheet for bond purchases and
other accommodative monetary policy programs has ballooned from $750
billion to just under $3 trillion in assets.
While economic activity continues, it is growing at a sluggish pace in
comparison to recoveries of the past, and most concernedly, as companies
seem to have right sized their employee headcount necessary to reach pro-
duction capacity, many companies seem to be doing more with less due to
increased global competition. Th is is a concern of paramount proportions
to the Federal Reserve because if companies are stagnant in hiring, the
amount of money spent by all consumers is also stagnant which mutes
economic expansion. While the unemployment rate has fallen in the last
four years, evidence of this right sized economy can be seen by a labor par-
ticipation rate that fell from about 67% to 63%. While this may seem like
a small change in terms of percentage, the amount is astounding when you
consider that the participation rate has not been this low in over 30 years.
As much as fi scal responsibility and competiveness for both the work-
force and businesses are necessary conditions for the overall health of
the economy, growth is also necessary to promote lasting positive eco-
nomic conditions. Th e problem is that growth typically requires increased
spending, which runs counter to eff orts on debt reduction. Th e Federal
Reserve continues to hold short-term interest rates near zero and has sig-
naled that this will not change until well after the economy shows strong
signs of being on a sustainable mend. Low rates are supposed to increase
borrowing and thus lead to economic expansion and investment. Low
rates also encourage investors to take more risk in order to reach for yield,
thus infl ating asset prices, stabilizing housing prices and hopefully hav-
ing a positive wealth eff ect pushing up personal spending and increased
consumer confi dence.
Th e theme of last year’s commentary was one of personal and corporate balance sheet rebuilding along with an expansion of the Federal Reserve’s balance sheet to create a stable environment which would promote growth and create an environment in which unemployment would be reduced. Despite the economy improving to some degree and both personal and especially corporate balance sheets strengthening, too much uncertainty has held back the recovery and led to lackluster job growth.
A Two Track Recovery at HomeA Global Economic Focus – An Uncertain Future

73 INV
Consumer confi dence fi gures have been inconsistent over the
last year as well. In today’s world of instant news feeds and
ever more rapid responses from the markets, informational
and economic fl ows from around the world have impacted
consumers, private sector economic decision makers, and
policy makers. While the Federal Reserve has maintained
an accommodative policy response to blunt economic shocks
(the European Debt crisis, unrest in the Middle East, natu-
ral disasters, lasting impacts from the fi nancial crisis, etc),
policymakers in Washington D.C. have been at a stalemate.
Another factor compounding this uncertainty is the U.S.
Election in November. Simply put, both the economic uncer-
tainty brought from a globalized economy and an uncertain
future regulatory environment has led to a frozen, wait and
see, response from private sector economic decision makers.
Pension Funds Respond Lower growth rates
and higher unemployment at home, a massive European
sovereign debt crisis, and rising infl ation threatening to
slow emerging economies make for volatile global markets.
Questions surrounding how pension funds will meet their
expected return targets and thus fund their liabilities are
valid. Many funds are faced with the need to boost returns in
this environment and have turned to alternative investment
markets such as private equity, real estate, real return strat-
egies, and absolute return strategies. Th is change has been
accomplished most often at the expense of traditional public
equities allocations. KRS has also moved in this direction.
New target asset allocations were approved during this fi scal
year for each plan, in response to recently completed asset
liability modeling studies. Th ese new asset allocation guide-
lines generally call for a decrease in U.S. public equity, a more
diversifi ed fi xed income portfolio, and new allocations to the
real return and absolute return buckets, so going forward, the
portfolio is more diversifi ed than ever.
Th e Board of Trustees is charged with the responsibility of investing the Systems’ as-
sets to provide for the benefi ts of the members of the Systems. To achieve that goal,
the Board follows a policy of thoughtfully growing our asset base while protecting
against undue risk and losses in any particular investment area. Th e Board recognizes
its fi duciary duty not only to invest the funds in compliance with the Prudent Person
Rule, but also to manage the funds in continued recognition of the basic long term
nature of the Systems. In carrying out their fi duciary duties, the Trustees have set forth
clearly defi ned investment policies, objectives and strategies for both the pension and
insurance portfolios.
Investment Policy Th e KRS Board of Trustees approved a new target asset al-
location beginning July 1, 2011. As of June 30, 2012, the fund's policy allocation invests
the following.
INVESTMENT SUMMARY
Board Investment Policy for Fund Asset Allocation
Asset Pension Fund Insurance Fund
U.S. Equity 20.0% 21.1%
International Equity 20.0% 21.0%
Emerging Market Equity 4.0% 3.4%
Core Fixed 10.0% 14.1%
Global Fixed 5.0% 1.7%
High Yield 5.0% 3.5%
Private Equity 10.0% 8.3%
Real Estate 5.0% 4.3%
Absolute Return 10.0% 10.2%
Real Return 10.0% 11.4%
Cash 1.0% 1.0%
Investment PoliciesVisit kyret.ky.gov/index.php/investments to read our Statement of Investment policy. Other policies include Brokerage, Securities Trading, Placement Agents, Proxy Voting, and more.
74INV
Th e investment objectives of the portfolios are to produce results that exceed the stated
goals over both short-term and long-term periods.
Short-Term (5 years and less) Th e returns of the particular asset classes of the
managed funds of the Systems, measured on a year-to-year basis, should exceed the
returns achieved by a policy benchmark portfolio composed of comparable unmanaged
market indices.
Medium-Term (5 to 30 years) Th e returns of the particular asset classes of the
managed funds of the Systems, measured on a rolling year basis, should exceed the
returns achieved by a policy benchmark portfolio composed of comparable unmanaged
market indices and perform above median in an appropriate peer universe if there is
one.
Longer-Term Th e total assets of the Systems should achieve a return mea-
sured over 30 to 40 years which exceeds the actuarially required rate of return of 7.75%
while also exceeding the return achieved by its total fund benchmark.
INVESTMENT OBJECTIVES
Investing for KentuckyIn keeping with the Board of Trustees’ fi duciary responsibility, where all else equal, the Board encourages the investment of the Systems’ assets in securities of corporations that provide a positive contribution to the economy of the Commonwealth of Kentucky.
Diversifi cation KRS portfolios are diversifi ed on several levels. Portfolios are
diversifi ed through the use of multiple asset classes. Asset allocations are revisited on
a periodic basis and represent an effi cient allocation to achieve overall return and risk
characteristics. Th e individual asset classes are diversifi ed through the use of multiple
portfolios that are managed both by the Investment Division Staff and by external
investment advisors. Finally, portfolios within each of the asset classes are diversi-
fi ed through the selection of individual securities. Each portfolio advisor is aff orded
discretion to diversify its portfolio(s) within the parameters established by the Board of
Trustees.
Rebalancing Proper implementation of the investment policy requires
that a periodic adjustment, or rebalancing, of assets be made to ensure conformance
with KRS’ Statement of Investment Policy target levels. Such rebalancing is neces-
sary to refl ect sizeable cash fl ows and performance imbalances among asset classes and
investment advisors. KRS’ rebalancing policies call for an immediate rebalancing to
within its allocation ranges, if an asset class exceeds or falls below its target allocation
by an appropriate percentage defi ned in the investment Policy Statement. As the fol-
lowing charts depict, the Pension and Insurance portfolios were operating within the
ranges established by the investment policies.
INVESTMENT STRATEGIES

75 INV
Performance Review Procedures At least once each quarter, the In-
vestment Committee, on behalf of the Board of Trustees, reviews the performance of
the portfolio for determination of compliance with the Statement of Investment Policy.
Th e Investment Committee also reviews a report created and presented by the KRS
Compliance Offi cer who is part of the independent Internal Audit Department. Th e
Compliance Offi cer performs tests daily, monthly, and quarterly to assure compliance
with the restrictions imposed by the Investment Policy.
Consulting Th e Board employs industry leading external consultants
to assist in determining and reviewing the asset allocation guidelines and the perfor-
mance of both the internally managed and externally managed assets. A letter from
each consulting fi rm utilized follows this introduction and discusses current allocations,
performance and signifi cant changes during the fi scal year.
INVESTMENT STRATEGIES
Asset AllocationBoard Policy vs. Actual (Rebalanced)
Asset Policy's Pension Asset Allocation
Actual PensionAsset Allocation
Policy's Insurance Asset Allocation
Actual Insurance Asset Allocation
U.S. Equity 20.0% 19.1% 21.1% 22.1%
International Equity 20.0% 19.1% 21.0% 19.3%
Emerging Market Equity 4.0% 3.8% 3.4% 3.0%
Core Fixed 10.0% 10.4% 14.1% 11.0%
High Yield 5.0% 5.5% 3.5% 4.7%
Global Fixed 5.0% 5.3% 1.7% 4.5%
Private Equity 10.0% 12.3% 8.3% 6.7%
Real Estate 5.0% 2.0% 4.3% 1.1%
Absolute Return 10.0% 10.2% 10.2% 10.2%
Real Return 10.0% 10.8% 11.4% 13.8%
Cash 1.0% 1.6% 1.0% 3.7%
Th e objectives of the portfolios are to produce results that exceed the stated goals.
76INV
Th e markets quickly reacted to growing and endless news about the mounting sovereign debt in many Eu-
ropean countries and the fragility of the European Union. With many global businesses impacted by issues
in Europe, the U.S. Treasury became the investment of choice, which drove down yields to historic lows.
Th e fi rst half of the fi scal year began with several negative events that sparked a "risk off " mode in the global
fi nancial markets. In the U.S., political stalemate over raising the country's debt ceiling led credit rating
agency Standard & Poor's to downgrade the U.S. debt from AAA to AA+, the fi rst downgrade in U.S.
history. However, the gravity of the historical event eluded investors as fear mounted over uncertainty with
global capital markets and they continued to buy U.S. Treasurys. High unemployment in the U.S. at 9.1 %
coupled with a possible double-dip recession led the Fed to launch "Operation Twist," a stimulus program
designed to keep long-term rates low by selling short-term Treasurys and buying long-term Treasurys. In
Europe, investors worried about Greece defaulting on its debt without a substantial restructuring plan and
even more about the magnitude of possible bailouts for countries like Spain, Italy, and Ireland. Th e Japanese
economy experienced a recovery from the devastating tsunami earlier in the calendar year.
Toward the end of the fi rst half of the fi scal year, six Central Banks around the world (including the U.S.)
off ered European banks access to low interest rate loans to inject liquidity and confi dence back into the
global markets. Th e International Monetary Fund ("IMF") stepped in to establish the European Financial
Stabilization Fund ("ESFS"), which provided additional liquidity to troubled countries unable to access the
capital markets at reasonable borrowing rates. In the U.S., the Gross Domestic Product ("GDP") growth
for the third quarter of 2011 was revised down to an annual growth rate of 1.8%. Th e signifi cant injections
of liquidity in the European markets coupled with improving economic data in the U.S. (signs of growth)
helped motivate investors to sell out of U.S. Treasurys and buy riskier assets.
Th e second half of the fi scal year continued the strong market upswing in the U.S. supported by cleaner
corporate balance sheets, positive earnings reports, and signs of improved growth. Th e fi nal estimate for
GDP growth for the fourth quarter was 3.0% annualized and both the manufacturing and services industries
showed improvements. In Europe, the member countries created the Long-Term Refi nance Operation, or
the LTRO, which off ered additional loans to banks, and Greece fi nally established a plan to signifi cantly
reduce the par value of it bonds. Th e new lending facility along with certainty about the Greek debt tem-
porarily encouraged investors to begin buying non-U.S. Treasury securities. In Asia, the Bank of Japan
announced a 1.0% infl ation target to combat defl ationary pressures. China, citing decreased exports resulting
from slowed global growth, reduced their 2012 GDP growth target from 8.0% to 7.5%.
Th e positive sentiment faded toward the end of the fi scal year with a downward revision of GDP growth in
the U.S. for the fi rst quarter to 1.9%. European economic conditions sank to near-recessionary levels, posting
a contraction in economic growth. Brazil and China, concerned over diminishing growth prospects at home
and abroad, cut their primary interest rates in an eff ort to reinvigorate their economies. Finally, the Bank of
Japan stepped up its bond buying programs in order to fi ght against ongoing defl ationary pressures. Th e "risk
off " mode of the capital markets pushed skittish investors back into long-term U.S. Treasurys and fl attened
the yield curve. By the end of the quarter, the yield on the 10-year Treasury had fallen from 3.2% on June
30, 2011 to a very low 1.6%.
Prepared by R.V. Kuhns & Associates, Inc.
Th e start of the fi scal year ushered in a period fi lled with episodic market cycles coined as"risk on/risk off ' phases. Th roughout the past 12-months ending June 30, 2012, global macroeconomic events pushed investors from a "rush to risk" to a "fl ight to safety" mode numerous times.
By Rebecca A. GratsingerCEO, PrincipalR.V. Kuhns & Associates
ECONOMIC REVIEW
GDPGross Domestic Product
FedFederal Reserve
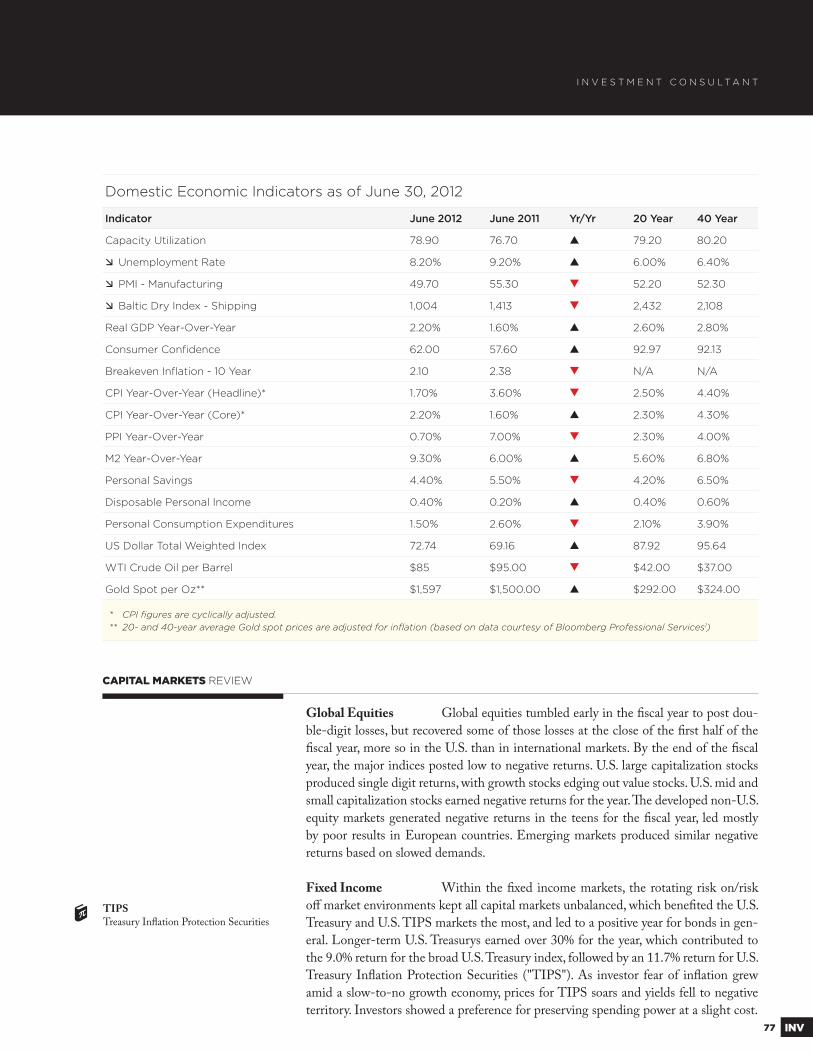
77 INV
I N V E S T M E N T C O N S U L T A N T
Domestic Economic Indicators as of June 30, 2012
Indicator June 2012 June 2011 Yr/Yr 20 Year 40 Year
Capacity Utilization 78.90 76.70 79.20 80.20
Unemployment Rate 8.20% 9.20% 6.00% 6.40%
PMI - Manufacturing 49.70 55.30 52.20 52.30
Baltic Dry Index - Shipping 1,004 1,413 2,432 2,108
Real GDP Year-Over-Year 2.20% 1.60% 2.60% 2.80%
Consumer Confi dence 62.00 57.60 92.97 92.13
Breakeven Infl ation - 10 Year 2.10 2.38 N/A N/A
CPI Year-Over-Year (Headline)* 1.70% 3.60% 2.50% 4.40%
CPI Year-Over-Year (Core)* 2.20% 1.60% 2.30% 4.30%
PPI Year-Over-Year 0.70% 7.00% 2.30% 4.00%
M2 Year-Over-Year 9.30% 6.00% 5.60% 6.80%
Personal Savings 4.40% 5.50% 4.20% 6.50%
Disposable Personal Income 0.40% 0.20% 0.40% 0.60%
Personal Consumption Expenditures 1.50% 2.60% 2.10% 3.90%
US Dollar Total Weighted Index 72.74 69.16 87.92 95.64
WTI Crude Oil per Barrel $85 $95.00 $42.00 $37.00
Gold Spot per Oz** $1,597 $1,500.00 $292.00 $324.00
* CPI fi gures are cyclically adjusted.** 20- and 40-year average Gold spot prices are adjusted for infl ation (based on data courtesy of Bloomberg Professional Services1)
Global Equities Global equities tumbled early in the fi scal year to post dou-
ble-digit losses, but recovered some of those losses at the close of the fi rst half of the
fi scal year, more so in the U.S. than in international markets. By the end of the fi scal
year, the major indices posted low to negative returns. U.S. large capitalization stocks
produced single digit returns, with growth stocks edging out value stocks. U.S. mid and
small capitalization stocks earned negative returns for the year. Th e developed non-U.S.
equity markets generated negative returns in the teens for the fi scal year, led mostly
by poor results in European countries. Emerging markets produced similar negative
returns based on slowed demands.
Fixed Income Within the fi xed income markets, the rotating risk on/risk
off market environments kept all capital markets unbalanced, which benefi ted the U.S.
Treasury and U.S. TIPS markets the most, and led to a positive year for bonds in gen-
eral. Longer-term U.S. Treasurys earned over 30% for the year, which contributed to
the 9.0% return for the broad U.S. Treasury index, followed by an 11.7% return for U.S.
Treasury Infl ation Protection Securities ("TIPS"). As investor fear of infl ation grew
amid a slow-to-no growth economy, prices for TIPS soars and yields fell to negative
territory. Investors showed a preference for preserving spending power at a slight cost.
CAPITAL MARKETS REVIEW
TIPSTreasury Infl ation Protection Securities
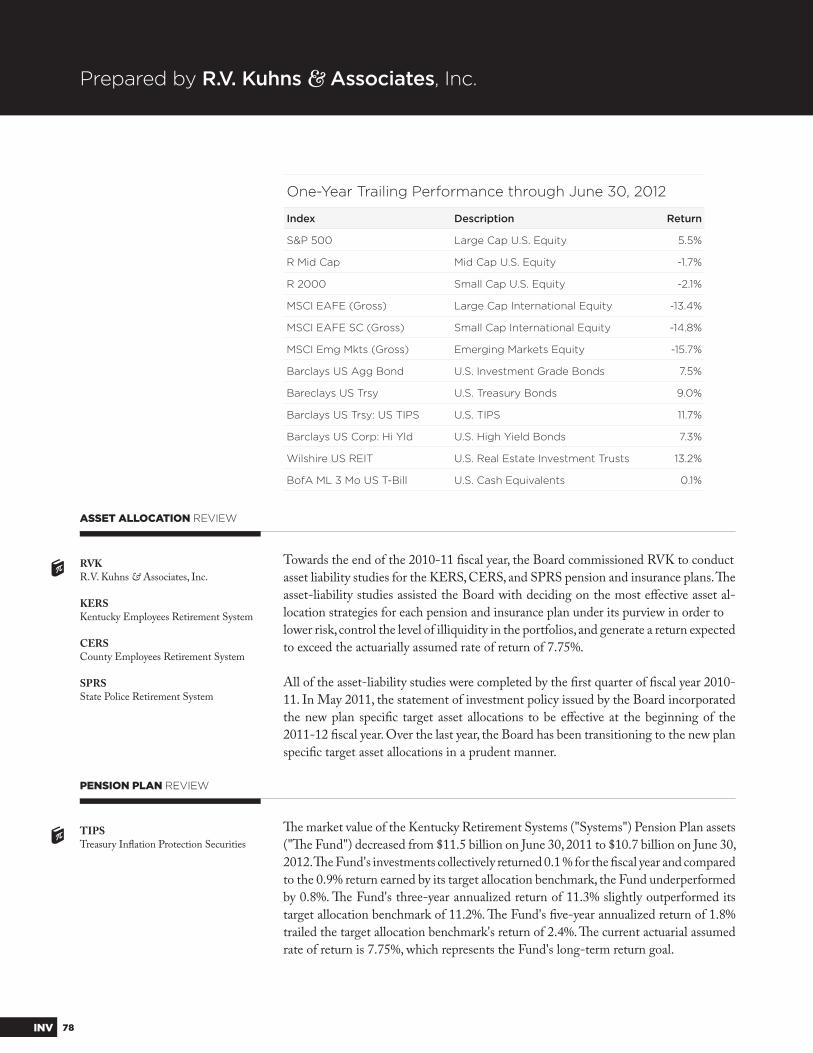
78INV
Prepared by R.V. Kuhns & Associates, Inc.
One-Year Trailing Performance through June 30, 2012
Index Description Return
S&P 500 Large Cap U.S. Equity 5.5%
R Mid Cap Mid Cap U.S. Equity -1.7%
R 2000 Small Cap U.S. Equity -2.1%
MSCI EAFE (Gross) Large Cap International Equity -13.4%
MSCI EAFE SC (Gross) Small Cap International Equity -14.8%
MSCI Emg Mkts (Gross) Emerging Markets Equity -15.7%
Barclays US Agg Bond U.S. Investment Grade Bonds 7.5%
Bareclays US Trsy U.S. Treasury Bonds 9.0%
Barclays US Trsy: US TIPS U.S. TIPS 11.7%
Barclays US Corp: Hi Yld U.S. High Yield Bonds 7.3%
Wilshire US REIT U.S. Real Estate Investment Trusts 13.2%
BofA ML 3 Mo US T-Bill U.S. Cash Equivalents 0.1%
ASSET ALLOCATION REVIEW
Towards the end of the 2010-11 fi scal year, the Board commissioned RVK to conduct
asset liability studies for the KERS, CERS, and SPRS pension and insurance plans. Th e
asset-liability studies assisted the Board with deciding on the most eff ective asset al-
location strategies for each pension and insurance plan under its purview in order to
lower risk, control the level of illiquidity in the portfolios, and generate a return expected
to exceed the actuarially assumed rate of return of 7.75%.
All of the asset-liability studies were completed by the fi rst quarter of fi scal year 2010-
11. In May 2011, the statement of investment policy issued by the Board incorporated
the new plan specifi c target asset allocations to be eff ective at the beginning of the
2011-12 fi scal year. Over the last year, the Board has been transitioning to the new plan
specifi c target asset allocations in a prudent manner.
RVKR.V. Kuhns & Associates, Inc.
KERSKentucky Employees Retirement System
CERSCounty Employees Retirement System
SPRSState Police Retirement System
PENSION PLAN REVIEW
Th e market value of the Kentucky Retirement Systems ("Systems") Pension Plan assets
("Th e Fund") decreased from $11.5 billion on June 30, 2011 to $10.7 billion on June 30,
2012. Th e Fund's investments collectively returned 0.1 % for the fi scal year and compared
to the 0.9% return earned by its target allocation benchmark, the Fund underperformed
by 0.8%. Th e Fund's three-year annualized return of 11.3% slightly outperformed its
target allocation benchmark of 11.2%. Th e Fund's fi ve-year annualized return of 1.8%
trailed the target allocation benchmark's return of 2.4%. Th e current actuarial assumed
rate of return is 7.75%, which represents the Fund's long-term return goal.
TIPSTreasury Infl ation Protection Securities

79 INV
I N V E S T M E N T C O N S U L T A N T
KERS & CERS Pension PlanAsset Allocation vs. Target Allocation
Asset Market Value Allocation Current Target
U.S. Equity $1,991,870,055 19.1% 20.0%
Non U.S. Equity $1,983,942,841 19.0% 20.0%
Emerging Markets Equity $393,761,218 3.8% 4.0%
Fixed Income $2,215,015,354 21.3% 20.0%
Real Return $1,123,208,288 10.8% 10.0%
Real Estate $207,773,289 2.0% 5.0%
Absolute Return $1,062,503,647 10.2% 10.0%
Private Equity $1,281,276,645 12.3% 10.0%
Cash Equivalent $158,409,311 1.5% 1.0%
Total Fund (excluding SPRS) $10,417,760,647 100.0% 100.0%
SPRS Pension PlanAsset Allocation vs. Target Allocation
Asset Market Value Allocation Current Target
U.S. Equity $47,071,900 18.8% 20.0%
Non U.S. Equity $46,009,277 18.4% 20.0%
Emerging Markets Equity $9,255,462 3.7% 4.0%
Fixed Income $49,559,159 19.8% 20.0%
Real Return $24,419,498 9.8% 10.0%
Real Estate $5,627,669 2.2% 5.0%
Absolute Return $30,840,326 12.3% 12.0%
Private Equity $30,659,594 12.2% 7.0%
Cash Equivalent $6,998,506 2.8% 2.0%
Total SPRS Fund $250,441,391 100.0% 100.0%
Th e Systems' current pension plan investments are diversi-
fi ed across all segments of the U.S. and international equity
markets (both developed and emerging markets). Th e fi xed
income portfolio is diversifi ed mix of U.S. investment grade,
high yield, global fi xed income, and emerging market debt
securities. Th e Systems also invests in real return assets, real
estate, absolute return strategies, and private equity.
As shown above, the current target asset allocation for KERS
Non-Hazardous, KERS Hazardous, CERS Non-Hazardous,
and CERS Hazardous plans are all the same. Th e current
target asset allocation for the SPRS plan, as shown above, is
slightly diff erent with a smaller allocation to private equity
and a greater allocation to absolute return strategies and cash
equivalents.
For each plan, the current deviations to the targets are being
brought closer to the current target allocations in a prudent
manner over time. For less liquid asset classes (private equity
and real estate), it may take years before the current alloca-
tion is in line with the current target.
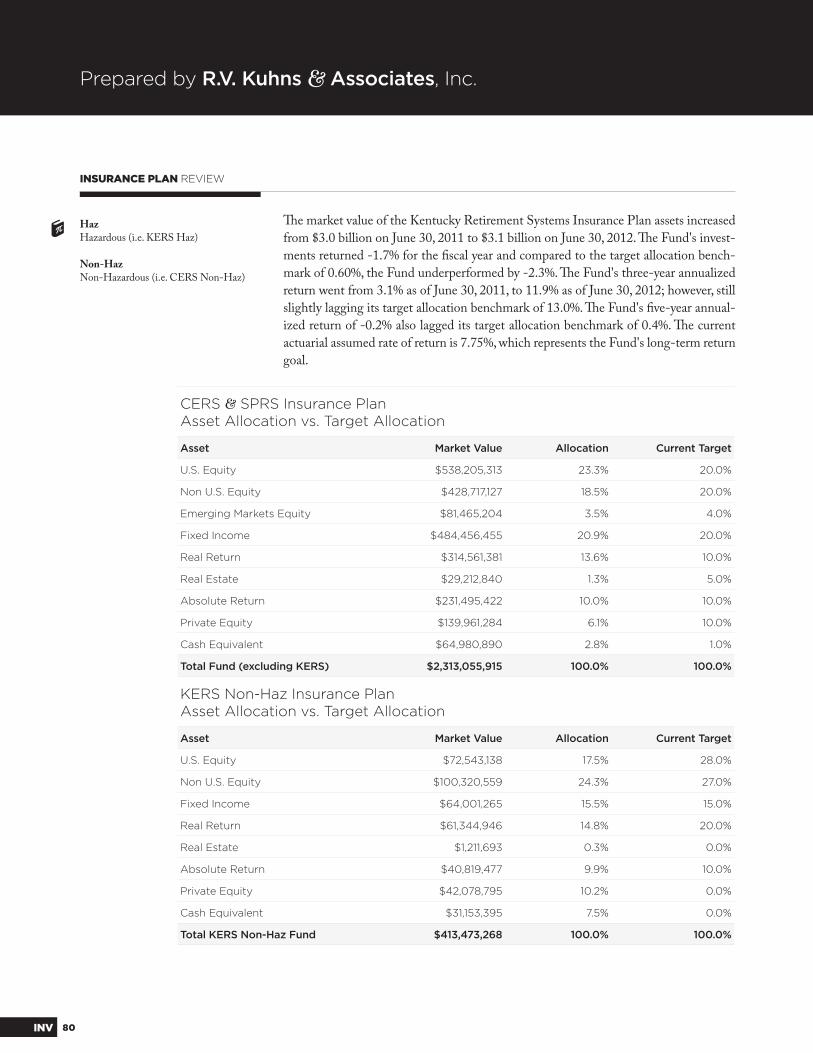
80INV
Prepared by R.V. Kuhns & Associates, Inc.
INSURANCE PLAN REVIEW
HazHazardous (i.e. KERS Haz)
Non-HazNon-Hazardous (i.e. CERS Non-Haz)
Th e market value of the Kentucky Retirement Systems Insurance Plan assets increased
from $3.0 billion on June 30, 2011 to $3.1 billion on June 30, 2012. Th e Fund's invest-
ments returned -1.7% for the fi scal year and compared to the target allocation bench-
mark of 0.60%, the Fund underperformed by -2.3%. Th e Fund's three-year annualized
return went from 3.1% as of June 30, 2011, to 11.9% as of June 30, 2012; however, still
slightly lagging its target allocation benchmark of 13.0%. Th e Fund's fi ve-year annual-
ized return of -0.2% also lagged its target allocation benchmark of 0.4%. Th e current
actuarial assumed rate of return is 7.75%, which represents the Fund's long-term return
goal.
CERS & SPRS Insurance PlanAsset Allocation vs. Target Allocation
Asset Market Value Allocation Current Target
U.S. Equity $538,205,313 23.3% 20.0%
Non U.S. Equity $428,717,127 18.5% 20.0%
Emerging Markets Equity $81,465,204 3.5% 4.0%
Fixed Income $484,456,455 20.9% 20.0%
Real Return $314,561,381 13.6% 10.0%
Real Estate $29,212,840 1.3% 5.0%
Absolute Return $231,495,422 10.0% 10.0%
Private Equity $139,961,284 6.1% 10.0%
Cash Equivalent $64,980,890 2.8% 1.0%
Total Fund (excluding KERS) $2,313,055,915 100.0% 100.0%
KERS Non-Haz Insurance PlanAsset Allocation vs. Target Allocation
Asset Market Value Allocation Current Target
U.S. Equity $72,543,138 17.5% 28.0%
Non U.S. Equity $100,320,559 24.3% 27.0%
Fixed Income $64,001,265 15.5% 15.0%
Real Return $61,344,946 14.8% 20.0%
Real Estate $1,211,693 0.3% 0.0%
Absolute Return $40,819,477 9.9% 10.0%
Private Equity $42,078,795 10.2% 0.0%
Cash Equivalent $31,153,395 7.5% 0.0%
Total KERS Non-Haz Fund $413,473,268 100.0% 100.0%
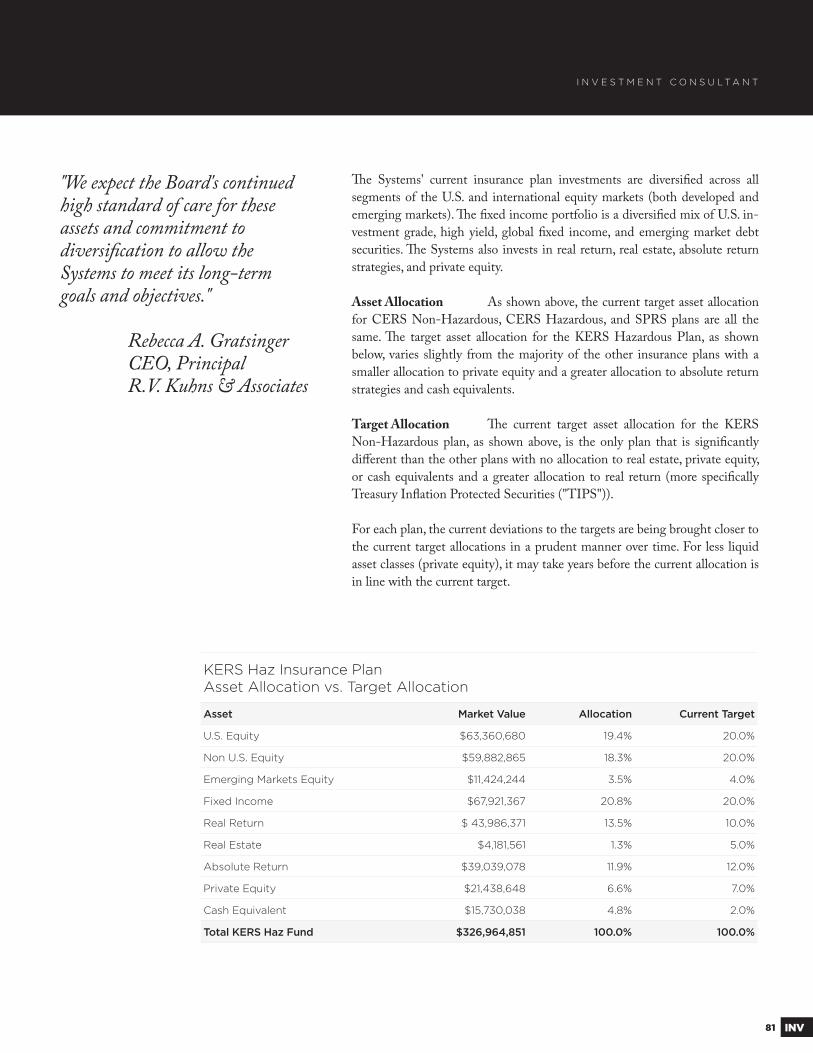
81 INV
I N V E S T M E N T C O N S U L T A N T
Th e Systems' current insurance plan investments are diversifi ed across all
segments of the U.S. and international equity markets (both developed and
emerging markets). Th e fi xed income portfolio is a diversifi ed mix of U.S. in-
vestment grade, high yield, global fi xed income, and emerging market debt
securities. Th e Systems also invests in real return, real estate, absolute return
strategies, and private equity.
Asset Allocation As shown above, the current target asset allocation
for CERS Non-Hazardous, CERS Hazardous, and SPRS plans are all the
same. Th e target asset allocation for the KERS Hazardous Plan, as shown
below, varies slightly from the majority of the other insurance plans with a
smaller allocation to private equity and a greater allocation to absolute return
strategies and cash equivalents.
Target Allocation Th e current target asset allocation for the KERS
Non-Hazardous plan, as shown above, is the only plan that is signifi cantly
diff erent than the other plans with no allocation to real estate, private equity,
or cash equivalents and a greater allocation to real return (more specifi cally
Treasury Infl ation Protected Securities ("TIPS")).
For each plan, the current deviations to the targets are being brought closer to
the current target allocations in a prudent manner over time. For less liquid
asset classes (private equity), it may take years before the current allocation is
in line with the current target.
KERS Haz Insurance PlanAsset Allocation vs. Target Allocation
Asset Market Value Allocation Current Target
U.S. Equity $63,360,680 19.4% 20.0%
Non U.S. Equity $59,882,865 18.3% 20.0%
Emerging Markets Equity $11,424,244 3.5% 4.0%
Fixed Income $67,921,367 20.8% 20.0%
Real Return $ 43,986,371 13.5% 10.0%
Real Estate $4,181,561 1.3% 5.0%
Absolute Return $39,039,078 11.9% 12.0%
Private Equity $21,438,648 6.6% 7.0%
Cash Equivalent $15,730,038 4.8% 2.0%
Total KERS Haz Fund $326,964,851 100.0% 100.0%
"We expect the Board's continued high standard of care for these assets and commitment to diversifi cation to allow the Systems to meet its long-term goals and objectives."
Rebecca A. Gratsinger CEO, Principal R.V. Kuhns & Associates
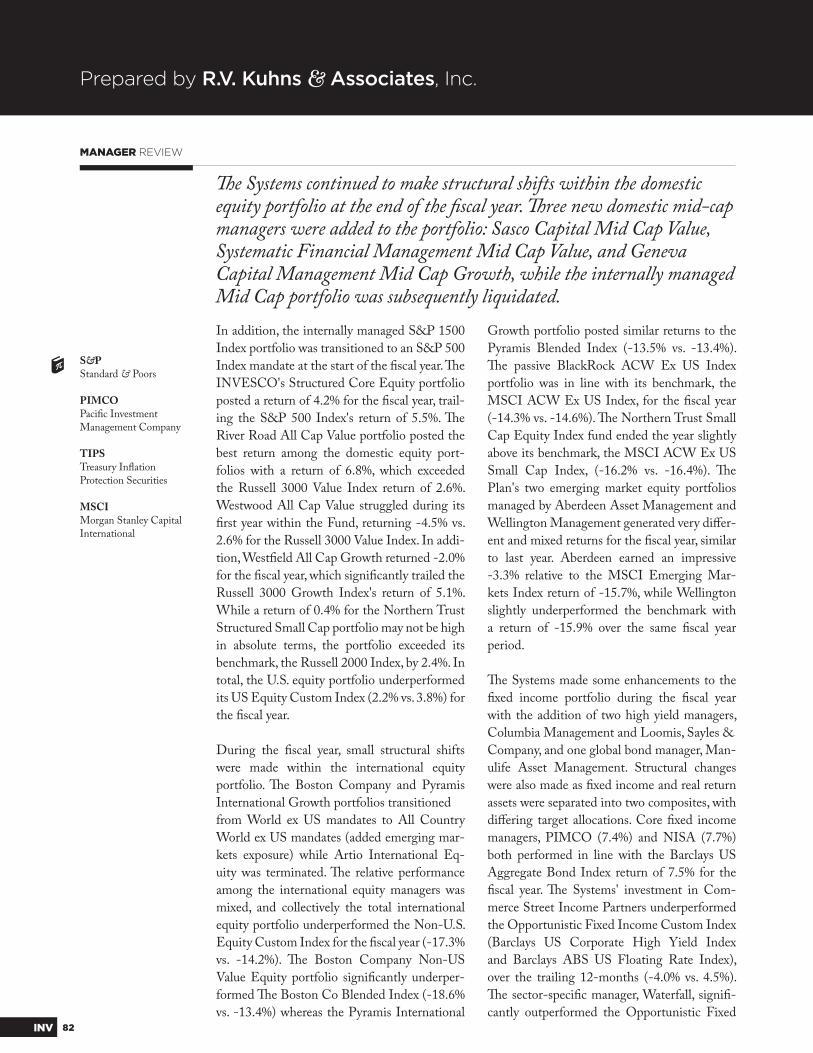
82INV
Prepared by R.V. Kuhns & Associates, Inc.
MANAGER REVIEW
S&PStandard & Poors
PIMCOPacifi c Investment Management Company
TIPSTreasury Infl ation Protection Securities
MSCIMorgan Stanley Capital International
Th e Systems continued to make structural shifts within the domestic equity portfolio at the end of the fi scal year. Th ree new domestic mid-cap managers were added to the portfolio: Sasco Capital Mid Cap Value, Systematic Financial Management Mid Cap Value, and Geneva Capital Management Mid Cap Growth, while the internally managed Mid Cap portfolio was subsequently liquidated.
In addition, the internally managed S&P 1500
Index portfolio was transitioned to an S&P 500
Index mandate at the start of the fi scal year. Th e
INVESCO's Structured Core Equity portfolio
posted a return of 4.2% for the fi scal year, trail-
ing the S&P 500 Index's return of 5.5%. Th e
River Road All Cap Value portfolio posted the
best return among the domestic equity port-
folios with a return of 6.8%, which exceeded
the Russell 3000 Value Index return of 2.6%.
Westwood All Cap Value struggled during its
fi rst year within the Fund, returning -4.5% vs.
2.6% for the Russell 3000 Value Index. In addi-
tion, Westfi eld All Cap Growth returned -2.0%
for the fi scal year, which signifi cantly trailed the
Russell 3000 Growth Index's return of 5.1%.
While a return of 0.4% for the Northern Trust
Structured Small Cap portfolio may not be high
in absolute terms, the portfolio exceeded its
benchmark, the Russell 2000 Index, by 2.4%. In
total, the U.S. equity portfolio underperformed
its US Equity Custom Index (2.2% vs. 3.8%) for
the fi scal year.
During the fi scal year, small structural shifts
were made within the international equity
portfolio. Th e Boston Company and Pyramis
International Growth portfolios transitioned
from World ex US mandates to All Country
World ex US mandates (added emerging mar-
kets exposure) while Artio International Eq-
uity was terminated. Th e relative performance
among the international equity managers was
mixed, and collectively the total international
equity portfolio underperformed the Non-U.S.
Equity Custom Index for the fi scal year (-17.3%
vs. -14.2%). Th e Boston Company Non-US
Value Equity portfolio signifi cantly underper-
formed Th e Boston Co Blended Index (-18.6%
vs. -13.4%) whereas the Pyramis International
Growth portfolio posted similar returns to the
Pyramis Blended Index (-13.5% vs. -13.4%).
Th e passive BlackRock ACW Ex US Index
portfolio was in line with its benchmark, the
MSCI ACW Ex US Index, for the fi scal year
(-14.3% vs. -14.6%). Th e Northern Trust Small
Cap Equity Index fund ended the year slightly
above its benchmark, the MSCI ACW Ex US
Small Cap Index, (-16.2% vs. -16.4%). Th e
Plan's two emerging market equity portfolios
managed by Aberdeen Asset Management and
Wellington Management generated very diff er-
ent and mixed returns for the fi scal year, similar
to last year. Aberdeen earned an impressive
-3.3% relative to the MSCI Emerging Mar-
kets Index return of -15.7%, while Wellington
slightly underperformed the benchmark with
a return of -15.9% over the same fi scal year
period.
Th e Systems made some enhancements to the
fi xed income portfolio during the fi scal year
with the addition of two high yield managers,
Columbia Management and Loomis, Sayles &
Company, and one global bond manager, Man-
ulife Asset Management. Structural changes
were also made as fi xed income and real return
assets were separated into two composites, with
diff ering target allocations. Core fi xed income
managers, PIMCO (7.4%) and NISA (7.7%)
both performed in line with the Barclays US
Aggregate Bond Index return of 7.5% for the
fi scal year. Th e Systems' investment in Com-
merce Street Income Partners underperformed
the Opportunistic Fixed Income Custom Index
(Barclays US Corporate High Yield Index
and Barclays ABS US Floating Rate Index),
over the trailing 12-months (-4.0% vs. 4.5%).
Th e sector-specifi c manager, Waterfall, signifi -
cantly outperformed the Opportunistic Fixed
83 INV
I N V E S T M E N T C O N S U L T A N T
Income Custom Index for the fi scal year (7.4% vs. 4.5%). Th e
high yield/bank loans investment managed by Shenkman
returned 5.4%, consistent with the US High Yield/Bank
Loans Blended Index (5.4%). Stone Harbor, the Systems'
emerging market debt manager produced a return of 8.7%,
underperforming its benchmark, the JPMorgan Emerging
Market Bond Global Diversifi ed Index, by -1.1%. Overall,
the total fi xed income portfolio returned 8.1% for the fi s-
cal year, outperforming the Fixed Income Custom Index by
0.8%.
Th e new real return composite consists primarily of the Sys-
tems' TIPS managers, with smaller allocations to a couple
alternative real return portfolios, Tenaska Power Fund and
Tortoise Capital MLPs. In addition, PIMCO All Asset fund
was added during the fi scal year to diversify the real return
portfolio. Th e internally managed TIPS portfolio slightly
underperformed the Barclays US TIPS Index (11.3% vs.
11.7%) while the Weaver Barksdale TIPS portfolio (11.8%)
performed in line with the benchmark over the fi scal year. In
total, the real return portfolio returned 12.0%, exceeding the
Consumer Price Index +3% by 7.3% for the fi scal year.
Th e Plan's alternative investment portfolio consists of an
absolute return strategy portfolio, longer term investments
in real estate, and private equity. Th e System continued to
develop the absolute return strategy portfolio during the
fi scal year with the addition of three multistrategy funds
of hedge funds, Blackstone Alternative Asset Management
("BAAM"), Pacifi c Alternative Asset Management Com-
pany ("PAAMCO"), and Prisma Capital Partners. Th e real
estate portfolio was further developed with the addition of
H/2 Credit Partners and Harrison Street Core. Th e fi scal
year return for the real estate portfolio was 7.5% vs. 12.4%
for the Real Estate Blended Index. Th e Systems' only ab-
solute return strategy manager with enough performance
history, Arrowhawk Durable Alpha Fund, posted a relative
gain against the one-quarter lagged HFN Fund of Funds
Diversifi ed Index for the fi scal year (-3.2% vs. -4.7%). Over
the past fi ve years ending June 30, 2012, the total private
equity portfolio return of 2.7% underperformed the Alterna-
tives Custom Index return of 4.9%.
Insurance Plan Th e Insurance Plan invests in all of
the same portfolios as the Pension Plan with the exception
of a few investments: INVESCO Structured Core Equity
and Northern Trust International Small Cap Equity In-
dex. In addition, the Insurance Plan has an allocation to
an Internal International Equity portfolio, which tracks
the MSCI Emerging Markets Index. For the fi scal year,
the portfolio return was in line with the index (-15.9% vs.
-15.7%). Although the insurance plan returns slightly dif-
fer from the returns earned in the pension plan because of
investment restrictions, the relative under/outperformance
was similar for the fi scal year.
Board Initiatives Th e Board continues to review the
eff ectiveness of the approved asset allocation to meet the
assumed rates of returns for the pension and insurance plans.
Research, selection, and implementation of investments
within alternative investment and infl ation-protection strat-
egies continue as a means to protect the portfolios in the
event of market shocks and potentially higher infl ationary
environment. Presently, there is no clear outlook on when
infl ation will become a signifi cant threat to the purchasing
power of earnings generated by the portfolios. However, the
Board proactively seeks investment strategies expected to
mitigate the eff ects while contributing to the growth of the
portfolios.
Oversight Th e Systems' investment policies,
goals, and objectives, as well as the performance of its assets
are regularly monitored by KRS staff , the Board, and R.V.
Kuhns & Associates, Inc. Th ese evaluations include reviews
of the investment management fi rms and the custodial bank
that serve the Systems. Th e Systems' assets are held in cus-
tody at Northern Trust. Market values and investment per-
formance returns referenced above are based upon fi nancial
statements prepared by Northern Trust. We rely on their data
and have not independently audited it. However, their fi nan-
cial statements are, to the best of our knowledge, believed to
be reliable.
Summary An uncertain market environment
demands careful attention and thoughtful treatment of the
assets entrusted to the Board's care by the Systems' employee
participants. We expect the Board's continued high standard
of care for these assets and commitment to diversifi cation to
allow the Systems to meet its long-term goals and objectives.
Rebecca A. Gratsinger // CEO, Principal
R.V. Kuhns & Associates, Inc.
October 3, 2012
84INV
Prepared by Altius Associates
The Board of Trustees of the Kentucky Retirement SystemsPerimeter Park West1260 Louisville RoadFrankfort, KY 40601
Subject: Annual Private Equity Review
Dear Trustees:
Kentucky Retirement Systems Private Equity Portfolio Review
Altius Associates was hired in December of 2011 to advise the Kentucky Retirement Systems (“KRS”) Board of Trustees and Staff in its private equity investment activities. This is our first annual review of the KRS private equity investment program. Unless otherwise noted, all data is through June 30, 2012. The investment program is managed in accordance with the KRS Investment Policies and Procedures.
Private Equity Market Overview
Overall, the private equity market has continued to improve, as the pace of fundraising has increased and exit opportunities remain robust. While, as with the broader economy, expectations of the market in the medium term are mixed, regulatory and structural disruptions occurring in the macroeconomic background are largely outweighed by strategic buyers flush with cash, a persistently low interest rate environment, and LPs search for return and uncertainty in more traditional investments. Altius expects the pace of both investment and distribution to accelerate, which will mainly be driven by activity in the US and other world economies.
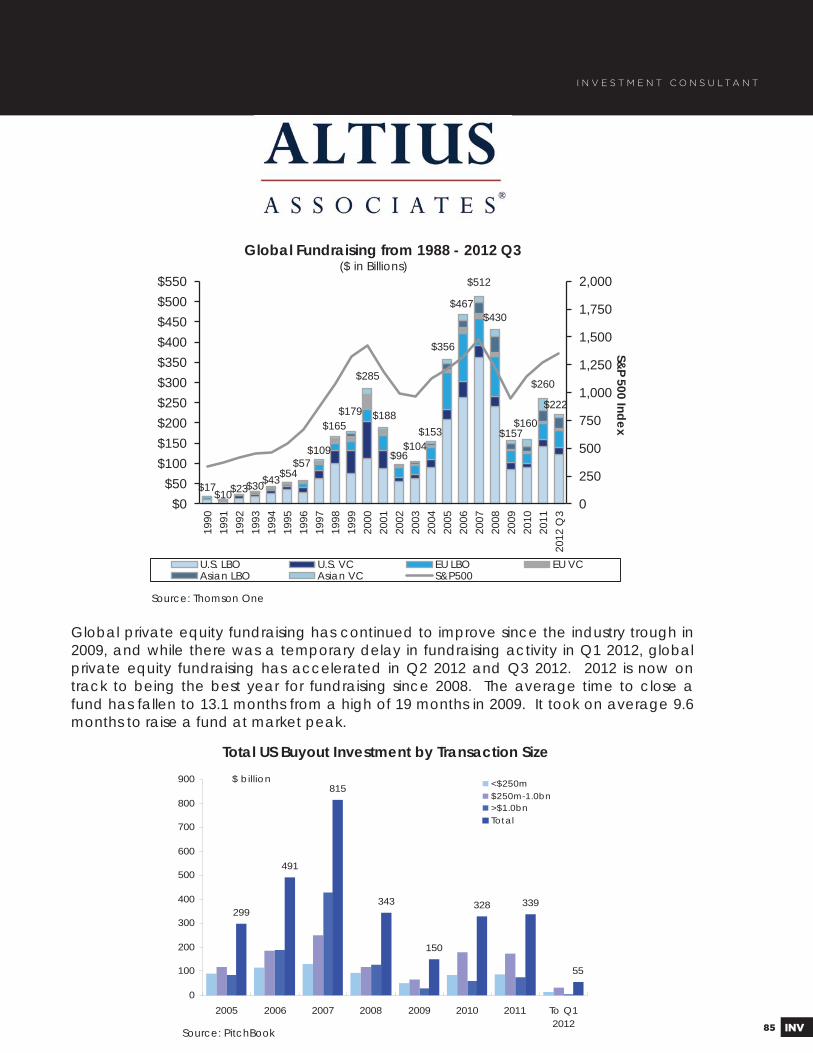
85 INV
I N V E S T M E N T C O N S U L T A N T
Global private equity fundraising has continued to improve since the industry trough in 2009, and while there was a temporary delay in fundraising activity in Q1 2012, global private equity fundraising has accelerated in Q2 2012 and Q3 2012. 2012 is now on track to being the best year for fundraising since 2008. The average time to close a fund has fallen to 13.1 months from a high of 19 months in 2009. It took on average 9.6 months to raise a fund at market peak.
$17$10$23$30$43$54
$57$109
$165$179
$285
$188
$96$104
$153
$356
$467
$512
$430
$157$160
$260
$222
0
250
500
750
1,000
1,250
1,500
1,750
2,000
$0$50
$100$150$200$250$300$350$400$450$500$550
1990
1991
1992
1993
1994
1995
1996
1997
1998
1999
2000
2001
2002
2003
2004
2005
2006
2007
2008
2009
2010
2011
2012
Q3
S&P 500 Index
($ in Billions)Global Fundraising from 1988 - 2012 Q3
U.S. LBO U.S. VC EU LBO EU VCAsian LBO Asian VC S&P500
299
491
815
343
150
328 339
55
0
100
200
300
400
500
600
700
800
900
2005 2006 2007 2008 2009 2010 2011 To Q12012
$ billion <$250m$250m-1.0bn>$1.0bnTotal
Total US Buyout Investment by Transaction Size
Source: Thomson One
Source: PitchBook
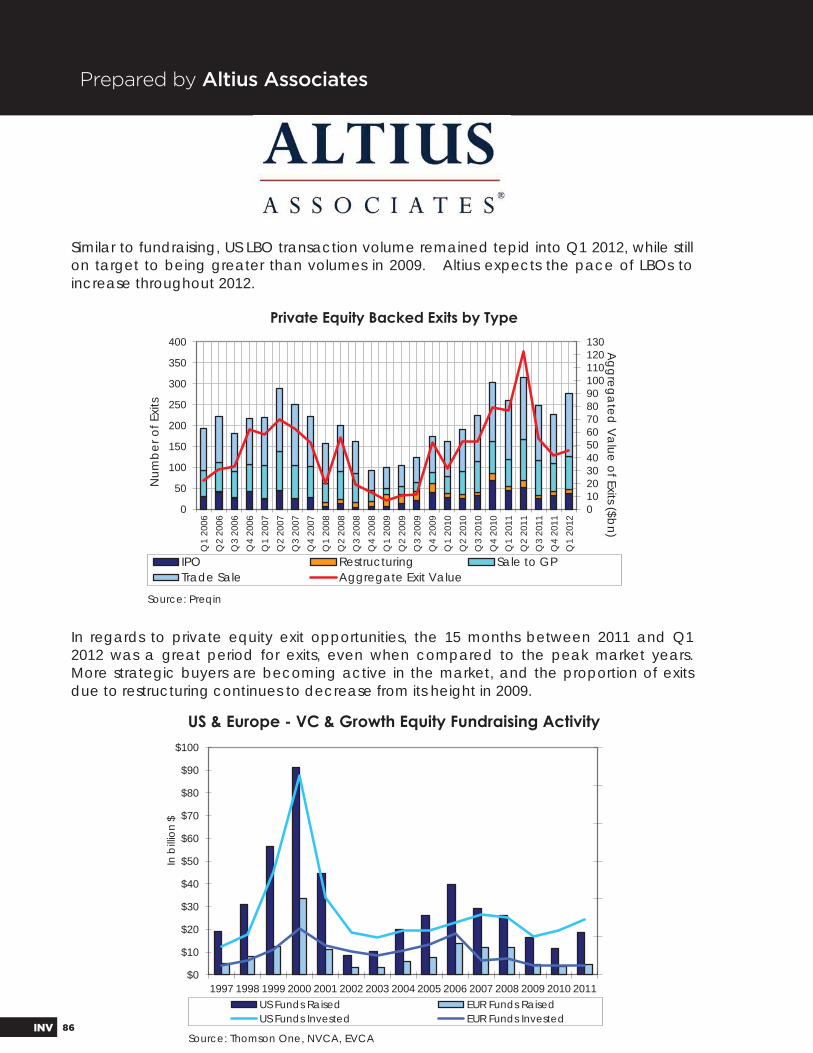
86INV
Prepared by Altius Associates
Similar to fundraising, US LBO transaction volume remained tepid into Q1 2012, while still on target to being greater than volumes in 2009. Altius expects the pace of LBOs to increase throughout 2012.
In regards to private equity exit opportunities, the 15 months between 2011 and Q1 2012 was a great period for exits, even when compared to the peak market years. More strategic buyers are becoming active in the market, and the proportion of exits due to restructuring continues to decrease from its height in 2009.
0102030405060708090100110120130
0
50
100
150
200
250
300
350
400
Q1
2006
Q2
2006
Q3
2006
Q4
2006
Q1
2007
Q2
2007
Q3
2007
Q4
2007
Q1
2008
Q2
2008
Q3
2008
Q4
2008
Q1
2009
Q2
2009
Q3
2009
Q4
2009
Q1
2010
Q2
2010
Q3
2010
Q4
2010
Q1
2011
Q2
2011
Q3
2011
Q4
2011
Q1
2012
Aggregated Value of Exits ($bn)
Num
ber o
f Exi
ts
IPO Restructuring Sale to GPTrade Sale Aggregate Exit Value
$0
$10
$20
$30
$40
$50
$60
$70
$80
$90
$100
1997 1998 1999 2000 2001 2002 2003 2004 2005 2006 2007 2008 2009 2010 2011
In b
illion
$
US Funds Raised EUR Funds RaisedUS Funds Invested EUR Funds Invested
Private Equity Backed Exits by Type
US & Europe - VC & Growth Equity Fundraising Activity
Source: Thomson One, NVCA, EVCA
Source: Preqin

87 INV
I N V E S T M E N T C O N S U L T A N T
While US fundraising for VC and growth equity funds is finally showing signs of life, fundraising for European funds has failed to gain momentum. Fundraising for VC has never recovered to its previous high water mark set in 2000.
Exits of venture-backed companies by IPOs have been challenging for smaller companies, but there have been some exceptions for larger well-known companies such as Facebook and LinkedIn. US M&A activity in 2011 hit a peak of 467 exits of VC backed companies in 2011 – the highest single year since 1997. Altius finds it likely that the exit market for VC firms will remain healthy through 2012.
$0
$50
$100
$150
$200
$250
$300
$350
$400
$450
0
50
100
150
200
250
300
350
400
450
500
1997 1998 1999 2000 2001 2002 2003 2004 2005 2006 2007 2008 2009 2010 2011 Q1 2012
M&
A D
eal Size
Num
ber
of I
POs/
M&
A D
eals
Number of IPOs Number of M&A M&A Avg. Deal Size
0%
2%
4%
6%
8%
10%
12%
Europe (ELLI) US (LLI)
VC & Growth Equity US Exit Activity
Leveraged Loan Default Rates
Source: Thomson One, NVCA, EVCA
Source: Moody’s, S&P LCD
88INV
Prepared by Altius Associates
In past economic cycles, the distressed debt opportunity has been short-lived. With the recent spike in European leveraged loan default rates, Altius expects that European opportunistic and distressed strategies will continue to outperform. Furthermore, the “amend and extend” of loans by lenders is slowing down and default rates are increasing. The poor credit quality of 2006-08 vintage year loans has resulted in a wall of debt maturing over the next three years. Altius continues to view this sector as attractive.
Kentucky Retirement Systems Private Equity Program
At Altius’ hiring in 2011, KRS had committed $2.15 billion to 50 managers across the private markets spectrum including Buyout, Venture/Growth, and Credit-oriented Strategies. KRS also has exposure to a number of funds of funds as well as more opportunistic strategies. The portfolio is well diversified across strategies, in large, mid and small market buyout (60% by commitments); venture and growth capital (18%); and the remainder in credit and other strategies. On December 31, 2011 the capital invested was $1.52 billion. In the six months through June 30th 2012, an additional $45.9 million was drawn by underlying managers and $83.9 million distributed. The NAV of the portfolio on June 30th was $1.528 billion.
Looking forward, Altius identified the following areas of focus for further development of the portfolio:
Pursue a global fund allocation and increase direct exposure to non-US general partners Smooth out investment pace and refrain from being too tactical with pacing Maintain smaller/mid-market buyout bias without increasing the number of managersIncrease allocation per commitment and focus on maintaining a manageable number of manager relationshipsOpportunistically invest in secondary marketSlowly reduce exposure to pure venture capital
KRS’ exposure to non – US private equity is mainly drawn from two sources: diversified global private equity funds and funds of funds. These will naturally run off over time and KRS will look to replace this exposure with commitments directly to non-US based general partners. Altius has recommended that KRS first start with diversified European funds and move into Asia and other emerging markets as the plan develops. The vision is to eventually reach an allocation of about 60% US, 25% Europe and 15% rest of world.
89 INV
I N V E S T M E N T C O N S U L T A N T
Moving forward, Altius has modeled out that KRS should commit on average $300 million per year to maintain its current allocation to private equity. Taking into account existing managers with whom KRS would recommit, this implies making 5-6commitments per year with an average size of $50-60 million.
Altius advises to continue to bias buyout investments towards smaller and mid-market managers. In addition, Altius recommends increasing allocation per fund commitment in order to better maintain manager relationships.
KRS has a healthy allocation of 18% to venture capital and, like the fund of funds that are in the portfolio, we recommend that those allocations be allowed to run off or self-liquidate to bring the allocation in to line with recommended policy. This will be achieved by recommitting to only a select group of venture managers which will allow the allocation level to naturally decline.
KRS has used the secondary market effectively in the past to reduce exposure to the asset class. Going forward, Altius will recommend continued use of secondaries, mostly on the buy-side to aide in portfolio construction.
Overall, the KRS private equity is well diversified across venture, buyout and opportunistic strategies in the US. The program is now sufficiently mature to begin to make commitments internationally and Altius is well positioned to assist KRS with the continued development of the portfolio.
Sincerely,
P. Bradford YoungPartner and Executive Director

90INV
Prepared by ORG Portfolio Management, LLC
MARKET OVERVIEW
Th e U.S. commercial real estate market continued to see improvement in 2012 al-
though the second quarter saw declines. Th e GDP only expanded at an annualized rate
of 1.5% (compared to 2.0% and 4.1% in the prior two quarters) resulting in softer labor
conditions and continued unemployment hovering close to 8%. Overall U.S. employ-
ment growth remains sluggish, falling considerably below historical norms.
Capitalization Rates 2nd Qtr. 2011 2nd Qtr. 2012 Basis Point Change
Total 5.79% 5.56% -0.23
Apartments 5.27% 5.15% -0.12
Retail 6.27% 5.88% -0.39
Offi ce 5.77% 5.46% -0.31
Industrial/Warehouse 6.16% 6.04% -0.12
Source: NCREIF – Current Value Weighted Capitalization Rates
Capitalization rates at the top tier of the market continue to decline with interest rates
remain low. Th e 10 year Treasury yield fell below 1.4% in July and is currently approxi-
mately 1.6%. However, ongoing weakness in U.S. economic data and the problems in
Europe leave capitalization rate spreads elevated, especially in tertiary markets and for
non-stabilized assets.
Th e current apartment vacancy rate is 4.7% and refl ects consistent year over year oc-
cupancy gains. New apartment supply is expected to come on line in 2013. Demand
for apartments continue to look promising although home ownership has become less
expensive than renting in many markets which has resulted in slower rent growth es-
pecially in suburban locations. While the outlook for apartments is still positive, the
supply/demand equation will become more balanced.
Vacancy is down across the national offi ce market. Offi ce construction completions are
currently at the lowest in nearly 20 years. While some projects are proposed, few are
getting started because rents do not support the construction.
Retail fundamentals continue to tighten due to a combination of weak but positive
absorption and complete shutdown of construction. Same store sales are rising for
mall and lifestyle anchors but weakening for outdoor format big-box tenants (e.g., Best
Buy). Regional and super-regional malls are reporting the strongest operating results
in years. Neighborhood center operating results (typically anchored by grocery and
convenience retail) have also been improving.
By Jonathan BernsPrincipalORG Portfolio Management
Property Sector 10 Year Average 2nd Qtr. 2011 2nd Qtr. 2012 Change % Forecast 2013 Change %
Apartments 6.2% 5.9% 4.7% -1.2% 4.2% -0.5%
Retail 7.2% 11.0% 10.8% -0.2% 10.0% -0.8%
Offi ce 15.0% 16.2% 15.7% -0.5% 14.8% -0.9%
Industrial/Warehouse 11.9% 14.0% 13.2% -0.8% 11.9% -1.3%
Source: Torto Wheaton Research, REIS and L&B Research
GDPGross Domestic Product
91 INV
R E A L E S T A T E I N V E S T M E N T C O N S U L T A N T
Th e vacancy rate for industrial properties has declined to 13.2%. Older and small to
mid-sized properties are struggling to fi ll vacancies in most market while large distri-
bution spaces are being leased by E-retailers and third-party logistics fi rms.
ORG'S VIEW
Th e NCREIF Property Index reports a 13.4% trailing 4 quarter return. During the
second quarter of 2012, ORG recognizes that core properties located in gateway mar-
kets (e.g., Washington D.C., Manhattan, Boston, San Francisco and Los Angeles)
have experienced a dramatic decline in capitalization rates. Th ese low going in income
returns will require substantial rental rate growth in order for the properties to generate
the projected 8-9% rate of return expected for core. ORG is concerned that the strate-
gies targeting gateway core markets will underperform expectations for core real estate.
As an alternative, ORG has recommended that investors focus on investment strate-
gies where going in income returns are higher in certain overlooked strategies. Th e
suggested focus includes secondary markets (e.g., Atlanta, Houston, Dallas and Seattle
among numerous others), real estate debt and alternative core property types such as
student housing, medical offi ce, senior housing and self-storage.
ORG also recommends strategies in distressed opportunistic funds where investors can
capitalize on the continual de-leveraging of real estate that continues as debt originated
during 2005-2007 continues to mature over the next several years. Th ese opportunities
to recapitalize high quality properties that have often been neglected could generate
attractive risk adjusted returns over the next several years.
ORG has noted that commercial real estate market is continuing to improve over 2011 levels.
REAL ESTATE INVESTMENTS
2008-2010 Investment Activity Kentucky Retirement Systems made $40 million
commitments each to Mesa West Real Estate Income Fund II, PRIMA Mortgage Invest-
ment Trust and Walton Street Real Estate Fund VI in December 2008.
v Year to Date through September 2012, Mesa West Real Estate Income Fund II made
three capital calls totaling $8.7 million and returned $1.6 million in adjustments and
preferred return distributions. Since inception, $33.4 million has been funded with
$6.6 million remaining capital to be called.
v PRIMA Mortgage Investment Trust called Kentucky Retirement Systems’ entire $40
million commitment by the end of the 3rd quarter 2009 and the investment is fully
funded. Year to Date through September 2012, PRIMA Mortgage Investment Trust
distributed $1.9 million to KRS. Since inception, PRIMA has returned $9.2 million.
v Year to Date through September 2012, Walton Street Real Estate Fund VI made two
capital calls totaling $10 million. Since inception, $28.4 million has been funded with
$11.6 million remaining capital to be called.

92INV
2011 Investment Activity Kentucky Retirement Systems
made a $100 million commitment to H/2 Credit Partners in April 2011 and a $101.9
million commitment to Harrison Street Core Property Fund in December 2011.
v H/2 Credit called Kentucky Retirement Systems’ entire $100 million commitment
during 2011 and the investment is fully funded.
v Year to Date through September 2012, Harrison Street Core Property Fund II
made fi ve capital calls totaling $66.6 million and returned $0.4 million of income
distributions. Since inception, $66.6 million has been funded with $35.3 million
remaining capital to be called.
2012 Investment Activity Kentucky Retirement Systems made a $52.5
million investment in Walton Street Fund VII and has made no capital calls. In addi-
tion, an open end fund is under legal review:
v Mesa West Core Fund – a newly formed core open ended fund that will originate
commercial mortgages utilizing existing commercial mortgage platform.
ORG Portfolio Management serves as the Real Estate Investment Consultant for KRS and makes recommendations related to the real estate portfolio.
Jonathan Berns // Principal
ORG Portfolio Management, LLC
October 3, 2012

93 INV
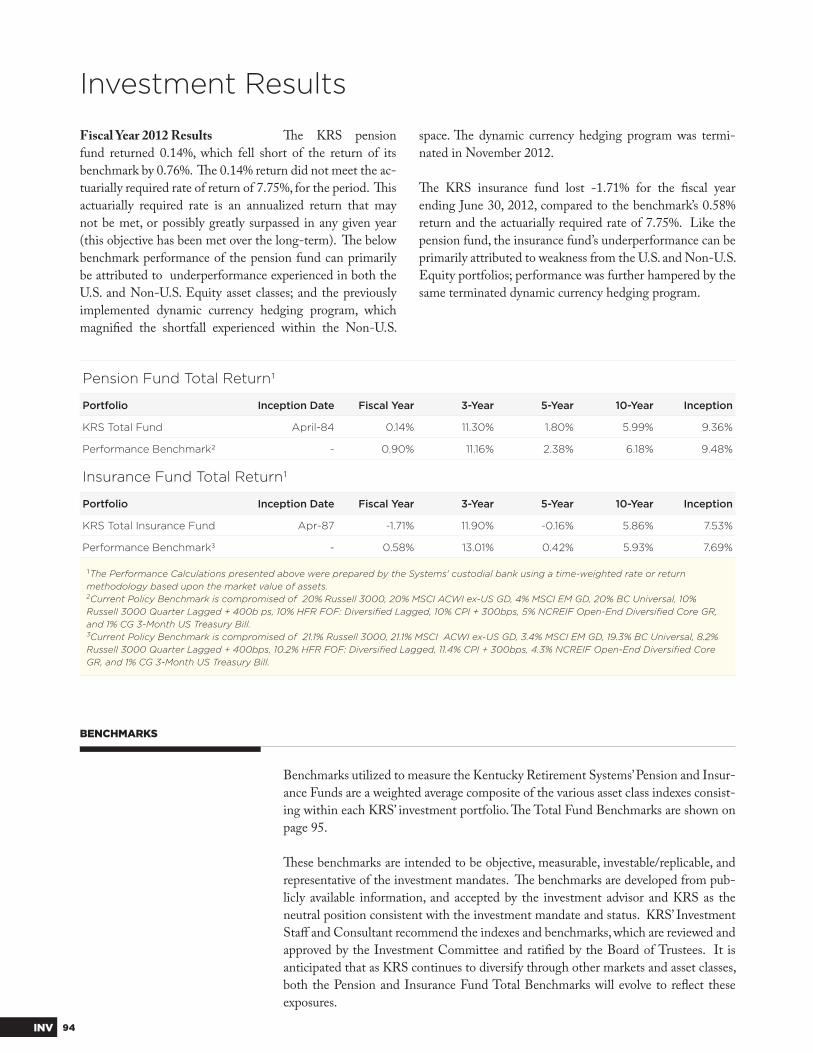
94INV
Investment Results
Fiscal Year 2012 Results Th e KRS pension
fund returned 0.14%, which fell short of the return of its
benchmark by 0.76%. Th e 0.14% return did not meet the ac-
tuarially required rate of return of 7.75%, for the period. Th is
actuarially required rate is an annualized return that may
not be met, or possibly greatly surpassed in any given year
(this objective has been met over the long-term). Th e below
benchmark performance of the pension fund can primarily
be attributed to underperformance experienced in both the
U.S. and Non-U.S. Equity asset classes; and the previously
implemented dynamic currency hedging program, which
magnifi ed the shortfall experienced within the Non-U.S.
space. Th e dynamic currency hedging program was termi-
nated in November 2012.
Th e KRS insurance fund lost -1.71% for the fi scal year
ending June 30, 2012, compared to the benchmark’s 0.58%
return and the actuarially required rate of 7.75%. Like the
pension fund, the insurance fund’s underperformance can be
primarily attributed to weakness from the U.S. and Non-U.S.
Equity portfolios; performance was further hampered by the
same terminated dynamic currency hedging program.
Pension Fund Total Return1
Portfolio Inception Date Fiscal Year 3-Year 5-Year 10-Year Inception
KRS Total Fund April-84 0.14% 11.30% 1.80% 5.99% 9.36%
Performance Benchmark2 - 0.90% 11.16% 2.38% 6.18% 9.48%
Insurance Fund Total Return1
Portfolio Inception Date Fiscal Year 3-Year 5-Year 10-Year Inception
KRS Total Insurance Fund Apr-87 -1.71% 11.90% -0.16% 5.86% 7.53%
Performance Benchmark3 - 0.58% 13.01% 0.42% 5.93% 7.69%
1The Performance Calculations presented above were prepared by the Systems' custodial bank using a time-weighted rate or return methodology based upon the market value of assets.2Current Policy Benchmark is compromised of 20% Russell 3000, 20% MSCI ACWI ex-US GD, 4% MSCI EM GD, 20% BC Universal, 10% Russell 3000 Quarter Lagged + 400b ps, 10% HFR FOF: Diversifi ed Lagged, 10% CPI + 300bps, 5% NCREIF Open-End Diversifi ed Core GR, and 1% CG 3-Month US Treasury Bill. 3Current Policy Benchmark is compromised of 21.1% Russell 3000, 21.1% MSCI ACWI ex-US GD, 3.4% MSCI EM GD, 19.3% BC Universal, 8.2% Russell 3000 Quarter Lagged + 400bps, 10.2% HFR FOF: Diversifi ed Lagged, 11.4% CPI + 300bps, 4.3% NCREIF Open-End Diversifi ed Core GR, and 1% CG 3-Month US Treasury Bill.
Benchmarks utilized to measure the Kentucky Retirement Systems’ Pension and Insur-
ance Funds are a weighted average composite of the various asset class indexes consist-
ing within each KRS’ investment portfolio. Th e Total Fund Benchmarks are shown on
page 95.
Th ese benchmarks are intended to be objective, measurable, investable/replicable, and
representative of the investment mandates. Th e benchmarks are developed from pub-
licly available information, and accepted by the investment advisor and KRS as the
neutral position consistent with the investment mandate and status. KRS’ Investment
Staff and Consultant recommend the indexes and benchmarks, which are reviewed and
approved by the Investment Committee and ratifi ed by the Board of Trustees. It is
anticipated that as KRS continues to diversify through other markets and asset classes,
both the Pension and Insurance Fund Total Benchmarks will evolve to refl ect these
exposures.
BENCHMARKS

95 INV
Total Fund Benchmarks
Index Pension Fund Insurance Fund
Russell 3000 20.0% 21.1%
MSCI ACWI ex US GD 20.0% 21.1%
MSCI Emerging Markets GD 4.0% 3.4%
Barclays Capital US Universal 20.0% 19.3%
Russell 3000 Quarter Lagged + 400 bps 10.0% 8.2%
HFR FOF: Diversifi ed Lagged 10.0% 10.2%
CPI + 300 bps 10.0% 11.4%
NCREIF Open-End Diversifi ed Core GR 5.0% 4.3%
CG 3-Mo U.S. Treasury Bill 1.0% 1.0%
LONG-TERM RESULTS
Pension Fund For the 10-years ending June 30,
2012, the KRS pension fund portfolio earned an annualized
total return of 5.99%. As shown in the investment results
table, the KRS pension fund return has trailed the bench-
mark in all measured time periods, except for the three-year
return period, where the fund has added an additional 14
basis points annually over the benchmark. Performance is
displayed below in a growth of dollars table. Th e table dem-
onstrates the performance of $1,000 invested in the KRS
pension portfolio, its policy benchmark portfolio, and its ac-
tuarial objective over the past 10 years. As of June 30, 2012,
$1,000 would have grown to $1,790, while the same $1,000
invested in the benchmark or in the actuarial objective would
have grown to $1,822 and $2,149, respectively.
Insurance Fund Th e KRS insurance fund has
just underperformed its benchmark for the 10-year period
ending June 30, 2012, earning 5.86% versus 5.93%. Perfor-
mance is displayed below in a growth of dollars table. Th e
table highlights the performance of $1,000 invested in the
KRS insurance portfolio ($1,768), benchmark ($1,779), and
actuarial objective ($2,149) over the past 10 years.
As the results show in the accompanying insurance charts
and table above, the insurance fund has struggled during all
measured standard return ranges.
Total Pension FundGrowth of $1,000
Portfolio 2002 2003 2004 2005 2006 2007 2008 2009 2010 2011 2012
Pension Fund Growth $1,000 $1,043 $1,185 $1,294 $1,420 $1,636 $1,567 $1,298 $1,503 $1,788 $1,790
Performance Benchmark $1,000 $1,051 $1,202 $1,304 $1,410 $1,620 $1,558 $1,326 $1,501 $1,806 $1,822
Actuarial Assumed Rate of Return
$1,000 $1,083 $1,172 $1,268 $1,373 $1,480 $1,594 $1,718 $1,851 $1,994 $2,149
Total Insurance FundGrowth of $1,000
Portfolio 2002 2003 2004 2005 2006 2007 2008 2009 2010 2011 2012
Insurance Fund Growth $1,000 $1,017 $1,214 $1,329 $1,494 $1,782 $1,643 $1,262 $1,457 $1,799 $1,768
Performance Benchmark $1,000 $1,011 $1,210 $1,315 $1,463 $1,743 $1,604 $1,232 $1,393 $1,769 $1,779
Actuarial Assumed Rate of Return
$1,000 $1,083 $1,172 $1,268 $1,373 $1,480 $1,594 $1,718 $1,851 $1,994 $2,149
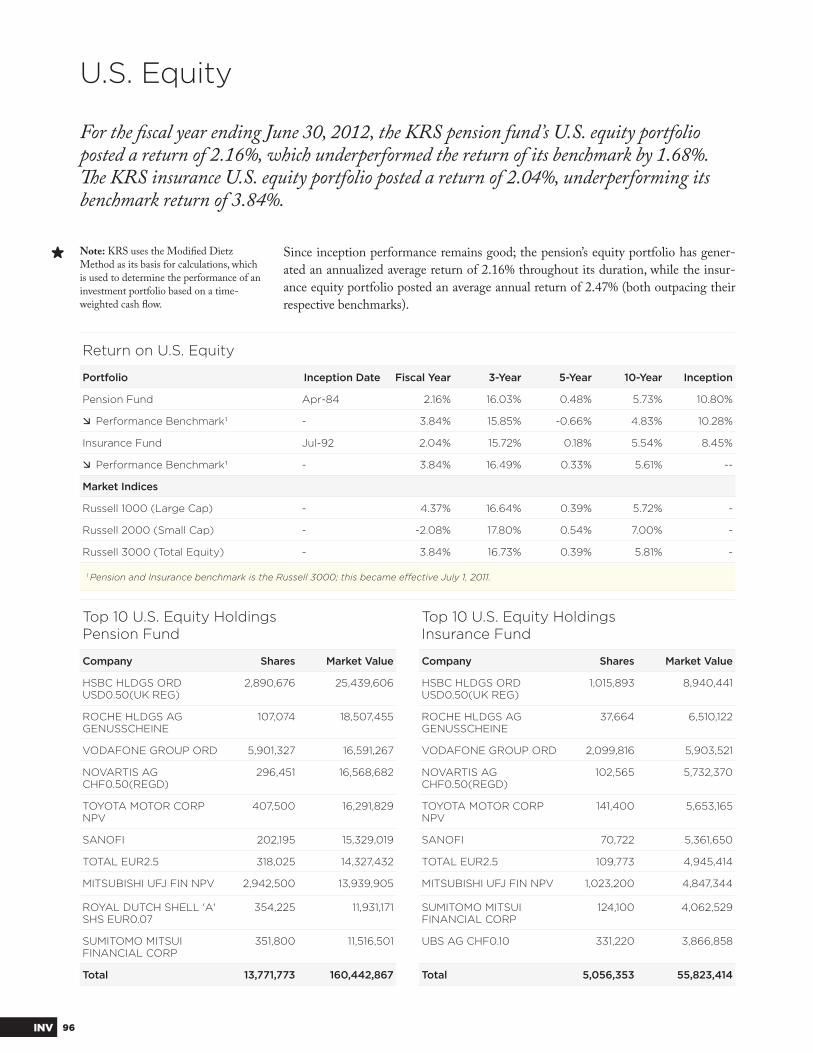
96INV
Top 10 U.S. Equity HoldingsPension Fund
Top 10 U.S. Equity HoldingsInsurance Fund
Company Shares Market Value Company Shares Market Value
HSBC HLDGS ORD USD0.50(UK REG)
2,890,676 25,439,606 HSBC HLDGS ORD USD0.50(UK REG)
1,015,893 8,940,441
ROCHE HLDGS AG GENUSSCHEINE
107,074 18,507,455 ROCHE HLDGS AG GENUSSCHEINE
37,664 6,510,122
VODAFONE GROUP ORD 5,901,327 16,591,267 VODAFONE GROUP ORD 2,099,816 5,903,521
NOVARTIS AG CHF0.50(REGD)
296,451 16,568,682 NOVARTIS AG CHF0.50(REGD)
102,565 5,732,370
TOYOTA MOTOR CORP NPV
407,500 16,291,829 TOYOTA MOTOR CORP NPV
141,400 5,653,165
SANOFI 202,195 15,329,019 SANOFI 70,722 5,361,650
TOTAL EUR2.5 318,025 14,327,432 TOTAL EUR2.5 109,773 4,945,414
MITSUBISHI UFJ FIN NPV 2,942,500 13,939,905 MITSUBISHI UFJ FIN NPV 1,023,200 4,847,344
ROYAL DUTCH SHELL 'A' SHS EUR0.07
354,225 11,931,171 SUMITOMO MITSUI FINANCIAL CORP
124,100 4,062,529
SUMITOMO MITSUI FINANCIAL CORP
351,800 11,516,501 UBS AG CHF0.10 331,220 3,866,858
Total 13,771,773 160,442,867 Total 5,056,353 55,823,414
Since inception performance remains good; the pension’s equity portfolio has gener-
ated an annualized average return of 2.16% throughout its duration, while the insur-
ance equity portfolio posted an average annual return of 2.47% (both outpacing their
respective benchmarks).
For the fi scal year ending June 30, 2012, the KRS pension fund’s U.S. equity portfolio posted a return of 2.16%, which underperformed the return of its benchmark by 1.68%. Th e KRS insurance U.S. equity portfolio posted a return of 2.04%, underperforming its benchmark return of 3.84%.
Return on U.S. Equity
Portfolio Inception Date Fiscal Year 3-Year 5-Year 10-Year Inception
Pension Fund Apr-84 2.16% 16.03% 0.48% 5.73% 10.80%
Performance Benchmark1 - 3.84% 15.85% -0.66% 4.83% 10.28%
Insurance Fund Jul-92 2.04% 15.72% 0.18% 5.54% 8.45%
Performance Benchmark1 - 3.84% 16.49% 0.33% 5.61% --
Market Indices
Russell 1000 (Large Cap) - 4.37% 16.64% 0.39% 5.72% -
Russell 2000 (Small Cap) - -2.08% 17.80% 0.54% 7.00% -
Russell 3000 (Total Equity) - 3.84% 16.73% 0.39% 5.81% -
1 Pension and Insurance benchmark is the Russell 3000; this became eff ective July 1, 2011.
U.S. Equity
Note: KRS uses the Modifi ed Dietz Method as its basis for calculations, which is used to determine the performance of an investment portfolio based on a time-weighted cash fl ow.
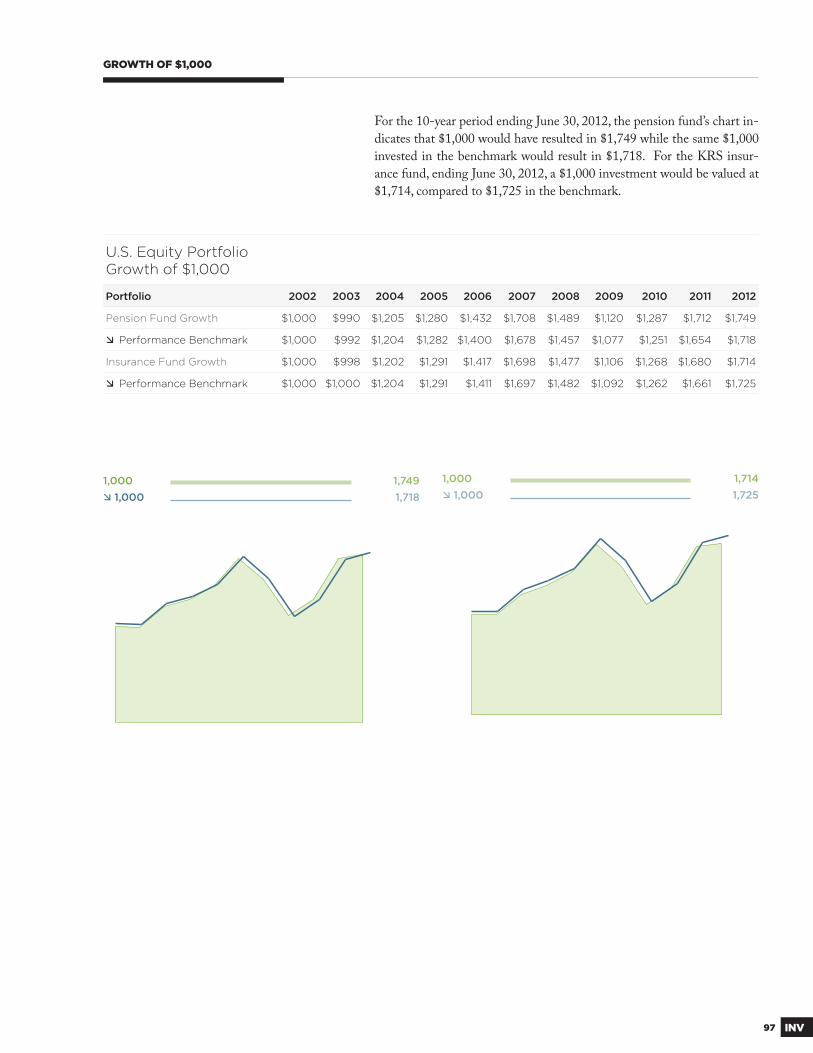
97 INV
1,7491,718
1,000 1,000
U.S. Equity PortfolioGrowth of $1,000
Portfolio 2002 2003 2004 2005 2006 2007 2008 2009 2010 2011 2012
Pension Fund Growth $1,000 $990 $1,205 $1,280 $1,432 $1,708 $1,489 $1,120 $1,287 $1,712 $1,749
Performance Benchmark $1,000 $992 $1,204 $1,282 $1,400 $1,678 $1,457 $1,077 $1,251 $1,654 $1,718
Insurance Fund Growth $1,000 $998 $1,202 $1,291 $1,417 $1,698 $1,477 $1,106 $1,268 $1,680 $1,714
Performance Benchmark $1,000 $1,000 $1,204 $1,291 $1,411 $1,697 $1,482 $1,092 $1,262 $1,661 $1,725
1,7141,725
1,000 1,000
For the 10-year period ending June 30, 2012, the pension fund’s chart in-
dicates that $1,000 would have resulted in $1,749 while the same $1,000
invested in the benchmark would result in $1,718. For the KRS insur-
ance fund, ending June 30, 2012, a $1,000 investment would be valued at
$1,714, compared to $1,725 in the benchmark.
GROWTH OF $1,000
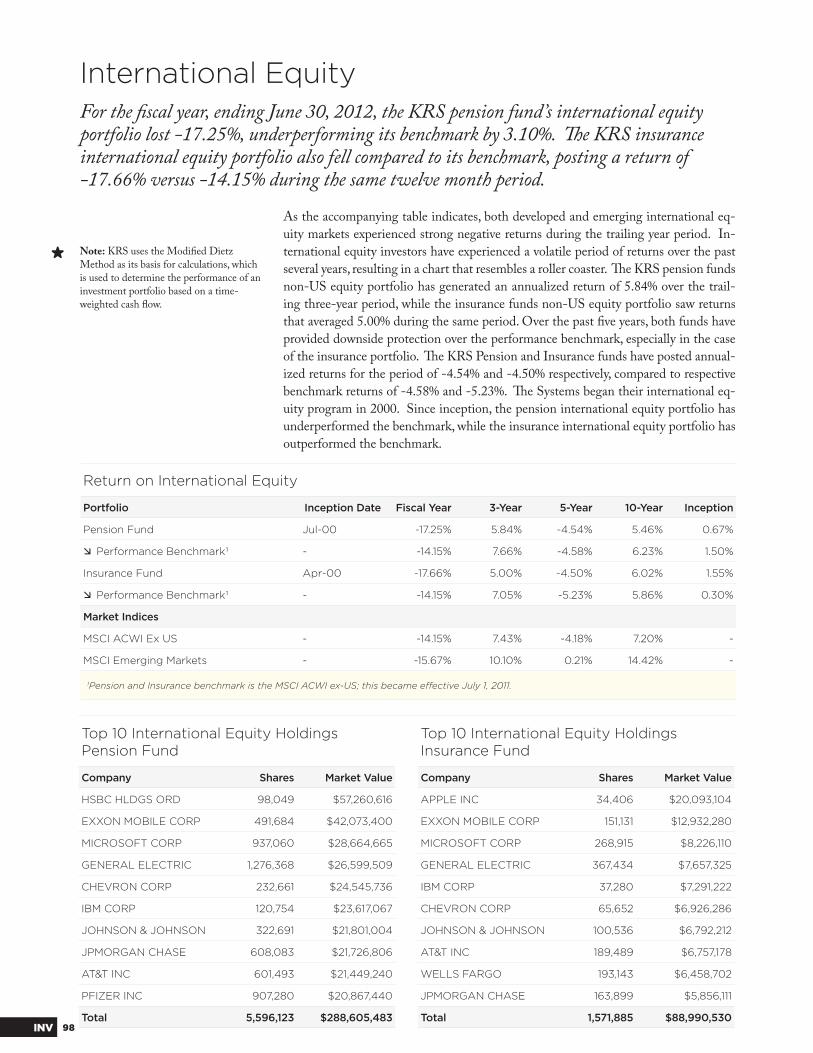
98INV
Top 10 International Equity HoldingsPension Fund
Top 10 International Equity HoldingsInsurance Fund
Company Shares Market Value Company Shares Market Value
HSBC HLDGS ORD 98,049 $57,260,616 APPLE INC 34,406 $20,093,104
EXXON MOBILE CORP 491,684 $42,073,400 EXXON MOBILE CORP 151,131 $12,932,280
MICROSOFT CORP 937,060 $28,664,665 MICROSOFT CORP 268,915 $8,226,110
GENERAL ELECTRIC 1,276,368 $26,599,509 GENERAL ELECTRIC 367,434 $7,657,325
CHEVRON CORP 232,661 $24,545,736 IBM CORP 37,280 $7,291,222
IBM CORP 120,754 $23,617,067 CHEVRON CORP 65,652 $6,926,286
JOHNSON & JOHNSON 322,691 $21,801,004 JOHNSON & JOHNSON 100,536 $6,792,212
JPMORGAN CHASE 608,083 $21,726,806 AT&T INC 189,489 $6,757,178
AT&T INC 601,493 $21,449,240 WELLS FARGO 193,143 $6,458,702
PFIZER INC 907,280 $20,867,440 JPMORGAN CHASE 163,899 $5,856,111
Total 5,596,123 $288,605,483 Total 1,571,885 $88,990,530
As the accompanying table indicates, both developed and emerging international eq-
uity markets experienced strong negative returns during the trailing year period. In-
ternational equity investors have experienced a volatile period of returns over the past
several years, resulting in a chart that resembles a roller coaster. Th e KRS pension funds
non-US equity portfolio has generated an annualized return of 5.84% over the trail-
ing three-year period, while the insurance funds non-US equity portfolio saw returns
that averaged 5.00% during the same period. Over the past fi ve years, both funds have
provided downside protection over the performance benchmark, especially in the case
of the insurance portfolio. Th e KRS Pension and Insurance funds have posted annual-
ized returns for the period of -4.54% and -4.50% respectively, compared to respective
benchmark returns of -4.58% and -5.23%. Th e Systems began their international eq-
uity program in 2000. Since inception, the pension international equity portfolio has
underperformed the benchmark, while the insurance international equity portfolio has
outperformed the benchmark.
For the fi scal year, ending June 30, 2012, the KRS pension fund’s international equity portfolio lost -17.25%, underperforming its benchmark by 3.10%. Th e KRS insurance international equity portfolio also fell compared to its benchmark, posting a return of -17.66% versus -14.15% during the same twelve month period.
Return on International Equity
Portfolio Inception Date Fiscal Year 3-Year 5-Year 10-Year Inception
Pension Fund Jul-00 -17.25% 5.84% -4.54% 5.46% 0.67%
Performance Benchmark1 - -14.15% 7.66% -4.58% 6.23% 1.50%
Insurance Fund Apr-00 -17.66% 5.00% -4.50% 6.02% 1.55%
Performance Benchmark1 - -14.15% 7.05% -5.23% 5.86% 0.30%
Market Indices
MSCI ACWI Ex US - -14.15% 7.43% -4.18% 7.20% -
MSCI Emerging Markets - -15.67% 10.10% 0.21% 14.42% -
1Pension and Insurance benchmark is the MSCI ACWI ex-US; this became eff ective July 1, 2011.
International Equity
Note: KRS uses the Modifi ed Dietz Method as its basis for calculations, which is used to determine the performance of an investment portfolio based on a time-weighted cash fl ow.
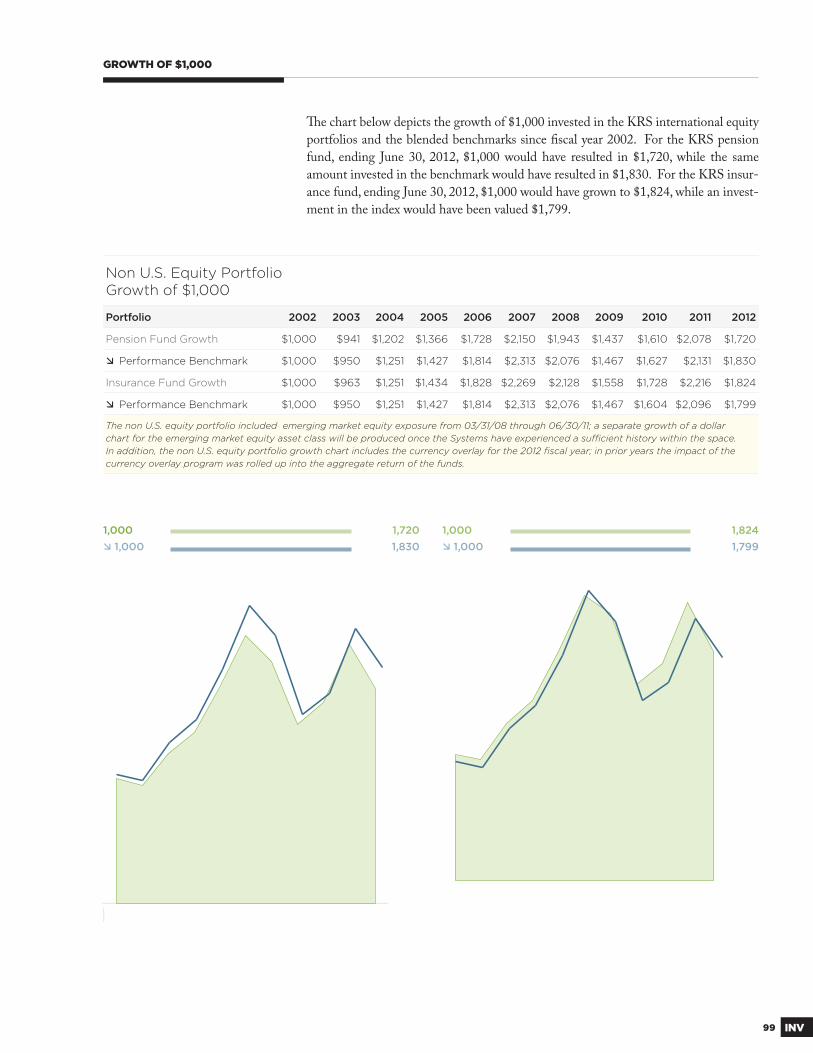
99 INV
0
1,7201,830
1,000 1,000
1,8241,799
1,000 1,000
Non U.S. Equity PortfolioGrowth of $1,000
Portfolio 2002 2003 2004 2005 2006 2007 2008 2009 2010 2011 2012
Pension Fund Growth $1,000 $941 $1,202 $1,366 $1,728 $2,150 $1,943 $1,437 $1,610 $2,078 $1,720
Performance Benchmark $1,000 $950 $1,251 $1,427 $1,814 $2,313 $2,076 $1,467 $1,627 $2,131 $1,830
Insurance Fund Growth $1,000 $963 $1,251 $1,434 $1,828 $2,269 $2,128 $1,558 $1,728 $2,216 $1,824
Performance Benchmark $1,000 $950 $1,251 $1,427 $1,814 $2,313 $2,076 $1,467 $1,604 $2,096 $1,799
The non U.S. equity portfolio included emerging market equity exposure from 03/31/08 through 06/30/11; a separate growth of a dollar chart for the emerging market equity asset class will be produced once the Systems have experienced a suffi cient history within the space. In addition, the non U.S. equity portfolio growth chart includes the currency overlay for the 2012 fi scal year; in prior years the impact of the currency overlay program was rolled up into the aggregate return of the funds.
GROWTH OF $1,000
Th e chart below depicts the growth of $1,000 invested in the KRS international equity
portfolios and the blended benchmarks since fi scal year 2002. For the KRS pension
fund, ending June 30, 2012, $1,000 would have resulted in $1,720, while the same
amount invested in the benchmark would have resulted in $1,830. For the KRS insur-
ance fund, ending June 30, 2012, $1,000 would have grown to $1,824, while an invest-
ment in the index would have been valued $1,799.
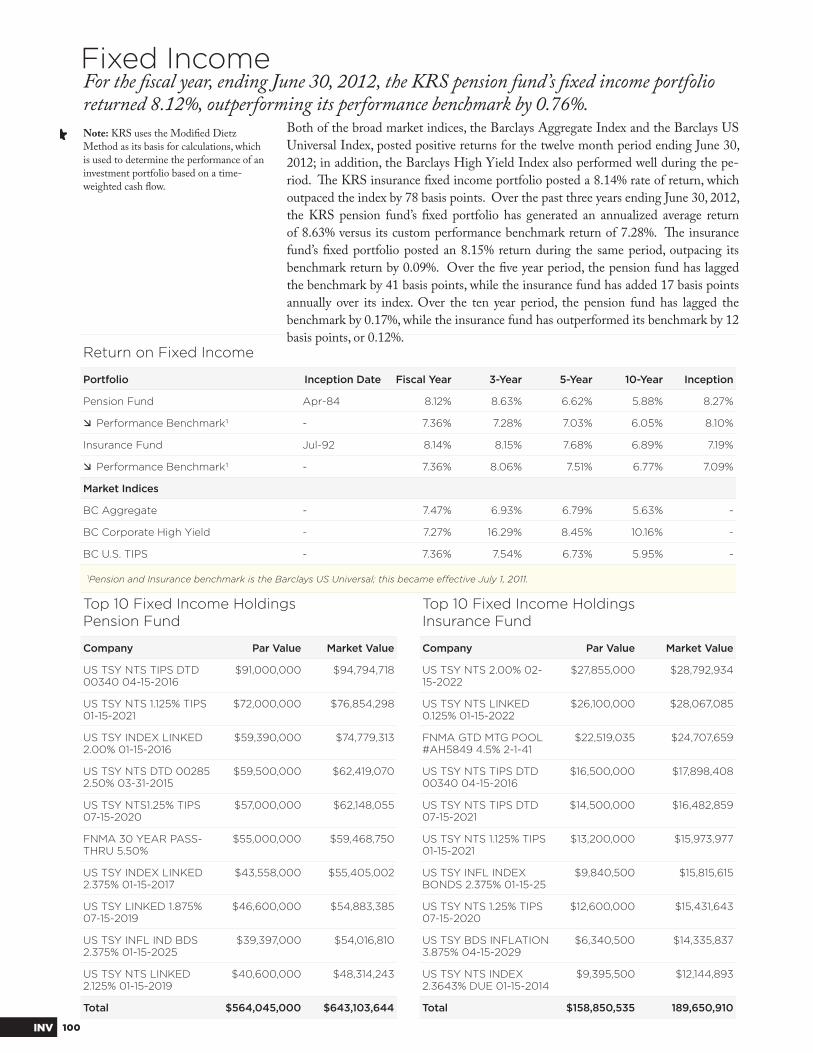
100INV
Top 10 Fixed Income HoldingsPension Fund
Top 10 Fixed Income HoldingsInsurance Fund
Company Par Value Market Value Company Par Value Market Value
US TSY NTS TIPS DTD 00340 04-15-2016
$91,000,000 $94,794,718 US TSY NTS 2.00% 02-15-2022
$27,855,000 $28,792,934
US TSY NTS 1.125% TIPS 01-15-2021
$72,000,000 $76,854,298 US TSY NTS LINKED 0.125% 01-15-2022
$26,100,000 $28,067,085
US TSY INDEX LINKED 2.00% 01-15-2016
$59,390,000 $74,779,313 FNMA GTD MTG POOL #AH5849 4.5% 2-1-41
$22,519,035 $24,707,659
US TSY NTS DTD 00285 2.50% 03-31-2015
$59,500,000 $62,419,070 US TSY NTS TIPS DTD 00340 04-15-2016
$16,500,000 $17,898,408
US TSY NTS1.25% TIPS 07-15-2020
$57,000,000 $62,148,055 US TSY NTS TIPS DTD 07-15-2021
$14,500,000 $16,482,859
FNMA 30 YEAR PASS-THRU 5.50%
$55,000,000 $59,468,750 US TSY NTS 1.125% TIPS 01-15-2021
$13,200,000 $15,973,977
US TSY INDEX LINKED 2.375% 01-15-2017
$43,558,000 $55,405,002 US TSY INFL INDEX BONDS 2.375% 01-15-25
$9,840,500 $15,815,615
US TSY LINKED 1.875% 07-15-2019
$46,600,000 $54,883,385 US TSY NTS 1.25% TIPS 07-15-2020
$12,600,000 $15,431,643
US TSY INFL IND BDS 2.375% 01-15-2025
$39,397,000 $54,016,810 US TSY BDS INFLATION 3.875% 04-15-2029
$6,340,500 $14,335,837
US TSY NTS LINKED 2.125% 01-15-2019
$40,600,000 $48,314,243 US TSY NTS INDEX 2.3643% DUE 01-15-2014
$9,395,500 $12,144,893
Total $564,045,000 $643,103,644 Total $158,850,535 189,650,910
Both of the broad market indices, the Barclays Aggregate Index and the Barclays US
Universal Index, posted positive returns for the twelve month period ending June 30,
2012; in addition, the Barclays High Yield Index also performed well during the pe-
riod. Th e KRS insurance fi xed income portfolio posted a 8.14% rate of return, which
outpaced the index by 78 basis points. Over the past three years ending June 30, 2012,
the KRS pension fund’s fi xed portfolio has generated an annualized average return
of 8.63% versus its custom performance benchmark return of 7.28%. Th e insurance
fund’s fi xed portfolio posted an 8.15% return during the same period, outpacing its
benchmark return by 0.09%. Over the fi ve year period, the pension fund has lagged
the benchmark by 41 basis points, while the insurance fund has added 17 basis points
annually over its index. Over the ten year period, the pension fund has lagged the
benchmark by 0.17%, while the insurance fund has outperformed its benchmark by 12
basis points, or 0.12%.
For the fi scal year, ending June 30, 2012, the KRS pension fund’s fi xed income portfolio returned 8.12%, outperforming its performance benchmark by 0.76%.
Return on Fixed Income
Portfolio Inception Date Fiscal Year 3-Year 5-Year 10-Year Inception
Pension Fund Apr-84 8.12% 8.63% 6.62% 5.88% 8.27%
Performance Benchmark1 - 7.36% 7.28% 7.03% 6.05% 8.10%
Insurance Fund Jul-92 8.14% 8.15% 7.68% 6.89% 7.19%
Performance Benchmark1 - 7.36% 8.06% 7.51% 6.77% 7.09%
Market Indices
BC Aggregate - 7.47% 6.93% 6.79% 5.63% -
BC Corporate High Yield - 7.27% 16.29% 8.45% 10.16% -
BC U.S. TIPS - 7.36% 7.54% 6.73% 5.95% -
1Pension and Insurance benchmark is the Barclays US Universal; this became eff ective July 1, 2011.
Fixed Income
Note: KRS uses the Modifi ed Dietz Method as its basis for calculations, which is used to determine the performance of an investment portfolio based on a time-weighted cash fl ow.
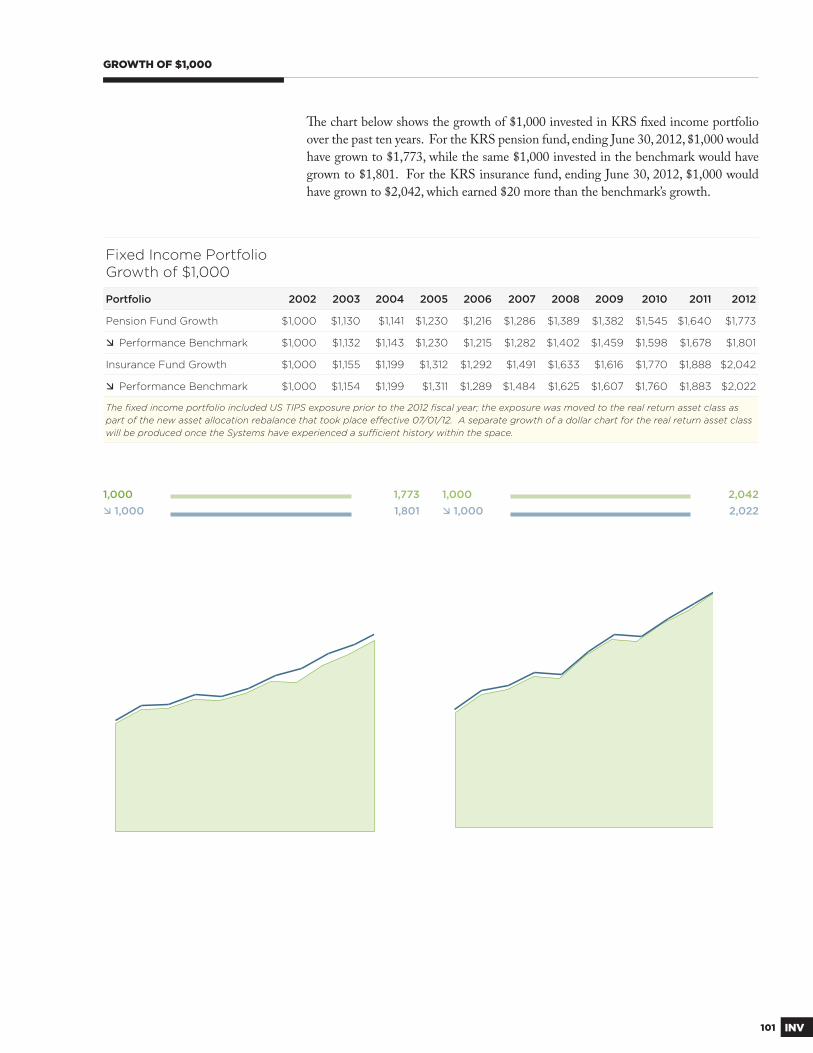
101 INV
Fixed Income PortfolioGrowth of $1,000
Portfolio 2002 2003 2004 2005 2006 2007 2008 2009 2010 2011 2012
Pension Fund Growth $1,000 $1,130 $1,141 $1,230 $1,216 $1,286 $1,389 $1,382 $1,545 $1,640 $1,773
Performance Benchmark $1,000 $1,132 $1,143 $1,230 $1,215 $1,282 $1,402 $1,459 $1,598 $1,678 $1,801
Insurance Fund Growth $1,000 $1,155 $1,199 $1,312 $1,292 $1,491 $1,633 $1,616 $1,770 $1,888 $2,042
Performance Benchmark $1,000 $1,154 $1,199 $1,311 $1,289 $1,484 $1,625 $1,607 $1,760 $1,883 $2,022
The fi xed income portfolio included US TIPS exposure prior to the 2012 fi scal year; the exposure was moved to the real return asset class as part of the new asset allocation rebalance that took place eff ective 07/01/12. A separate growth of a dollar chart for the real return asset class will be produced once the Systems have experienced a suffi cient history within the space.
1,7731,801
1,000 1,000
2,0422,022
1,000 1,000
Th e chart below shows the growth of $1,000 invested in KRS fi xed income portfolio
over the past ten years. For the KRS pension fund, ending June 30, 2012, $1,000 would
have grown to $1,773, while the same $1,000 invested in the benchmark would have
grown to $1,801. For the KRS insurance fund, ending June 30, 2012, $1,000 would
have grown to $2,042, which earned $20 more than the benchmark’s growth.
GROWTH OF $1,000
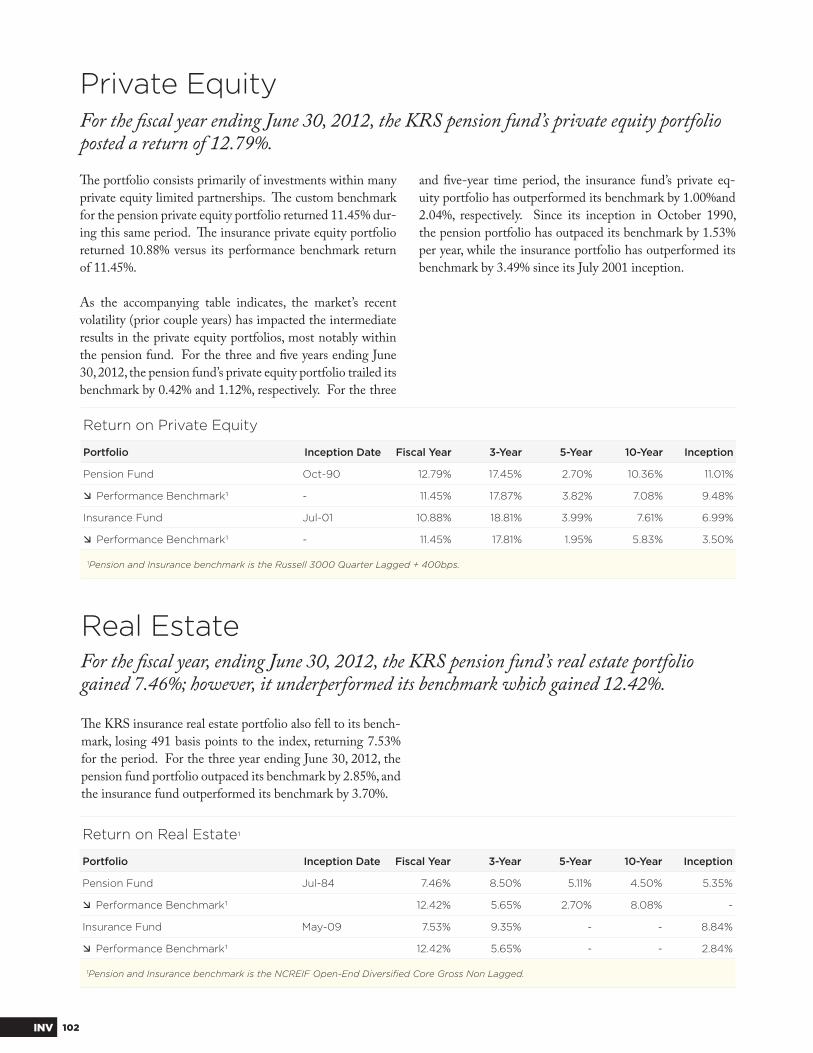
102INV
Return on Private Equity
Portfolio Inception Date Fiscal Year 3-Year 5-Year 10-Year Inception
Pension Fund Oct-90 12.79% 17.45% 2.70% 10.36% 11.01%
Performance Benchmark1 - 11.45% 17.87% 3.82% 7.08% 9.48%
Insurance Fund Jul-01 10.88% 18.81% 3.99% 7.61% 6.99%
Performance Benchmark1 - 11.45% 17.81% 1.95% 5.83% 3.50%
1Pension and Insurance benchmark is the Russell 3000 Quarter Lagged + 400bps.
Th e portfolio consists primarily of investments within many
private equity limited partnerships. Th e custom benchmark
for the pension private equity portfolio returned 11.45% dur-
ing this same period. Th e insurance private equity portfolio
returned 10.88% versus its performance benchmark return
of 11.45%.
As the accompanying table indicates, the market’s recent
volatility (prior couple years) has impacted the intermediate
results in the private equity portfolios, most notably within
the pension fund. For the three and fi ve years ending June
30, 2012, the pension fund’s private equity portfolio trailed its
benchmark by 0.42% and 1.12%, respectively. For the three
and fi ve-year time period, the insurance fund’s private eq-
uity portfolio has outperformed its benchmark by 1.00%and
2.04%, respectively. Since its inception in October 1990,
the pension portfolio has outpaced its benchmark by 1.53%
per year, while the insurance portfolio has outperformed its
benchmark by 3.49% since its July 2001 inception.
For the fi scal year ending June 30, 2012, the KRS pension fund’s private equity portfolio posted a return of 12.79%.
Return on Real Estate1
Portfolio Inception Date Fiscal Year 3-Year 5-Year 10-Year Inception
Pension Fund Jul-84 7.46% 8.50% 5.11% 4.50% 5.35%
Performance Benchmark1 12.42% 5.65% 2.70% 8.08% -
Insurance Fund May-09 7.53% 9.35% - - 8.84%
Performance Benchmark1 12.42% 5.65% - - 2.84%
1Pension and Insurance benchmark is the NCREIF Open-End Diversifi ed Core Gross Non Lagged.
For the fi scal year, ending June 30, 2012, the KRS pension fund’s real estate portfolio gained 7.46%; however, it underperformed its benchmark which gained 12.42%.
Private Equity
Real Estate
Th e KRS insurance real estate portfolio also fell to its bench-
mark, losing 491 basis points to the index, returning 7.53%
for the period. For the three year ending June 30, 2012, the
pension fund portfolio outpaced its benchmark by 2.85%, and
the insurance fund outperformed its benchmark by 3.70%.

103 INV
Return on Absolute Return
Portfolio Inception Date Fiscal Year 3-Year 5-Year 10-Year Inception
Pension Fund Apr-10 0.68% - - - 1.94%
Performance Benchmark1 -4.58% - - - 0.81%
Insurance Fund Apr-10 0.59% - - - 1.74%
Performance Benchmark1 -4.58% - - - 0.81%
1Pension and Insurance benchmark is the HFR FOF: Diversifi ed Lagged.
For the fi scal year, ending June 30, 2012, the KRS pension fund’s absolute return portfolio gained 0.68% versus its benchmark which fell -4.58%.
Absolute Return
Th e KRS insurance absolute return port-
folio also bested the benchmark, out earn-
ing the index by 527 basis points, return-
ing 0.59% for the period. Note: Th ough
the allocation’s inception date is April,
2010, the current book of managers, now
consisting of three funds of funds, were
employed in September 2011.
Return on Absolute Return
Portfolio Inception Date Fiscal Year 3-Year 5-Year 10-Year Inception
Pension Fund Jul-11 12.02% - - - 12.02%
Performance Benchmark1 4.71% - - - 4.71%
Insurance Fund Jul-11 11.91% - - - 11.91%
Performance Benchmark1 4.71% - - - 4.71%
1Pension and Insurance benchmark is CPI + 300bps
For the fi scal year, ending June 30, 2012, the KRS pension fund’s real return portfolio gained 12.02% versus its benchmark return of 4.71%.
Real Return
Th e KRS insurance real return portfolio
bested the index by 720 basis points, re-
turning 11.91% for the period. Note: Th e
real return allocation was formed eff ective
July 1, 2011.

104INV
Return on Cash
Portfolio Inception Date Fiscal Year 3-Year 5-Year 10-Year Inception
Pension Fund Jan-88 0.22% 0.66% 1.62% 2.70% 4.65%
Performance Benchmark1 - 0.04% 0.10% 0.87% 1.77% 3.84%
Insurance Fund Jul-92 0.19% 0.24% 1.14% 2.28% 3.44%
Performance Benchmark1 - 0.04% 0.10% 0.87% 1.77% 3.17%
1Pension and Insurance Cash benchmark is the Citi Group 3-month Treasury.
Th e KRS insurance cash portfolio also outperformed the index, posting a return of
0.19% during the same twelve month period.
As the accompanying table indicates, the longer term results from the cash portfolios
have also been excellent with comparison to their benchmark. For the fi ve years ending
June 30, 2012, the pension fund portfolio has outperformed its custom benchmark by
0.75% on an annualized basis. Since its inception, the portfolio has exceeded its bench-
mark by 0.81% per year. Th e insurance portfolio has also done very well, exceeding its
benchmark return over the fi ve-year period and since inception, both time frames by
0.27%.
For the fi scal year, ending June 30, 2012, the KRS pension fund’s cash portfolio returned 0.22%, outpacing its benchmark, the Citi Group 3-month Treasury by 0.18%.
Cash
Note: KRS uses the Modifi ed Dietz Method as its basis for calculations, which is used to determine the performance of an investment portfolio based on a time-weighted cash fl ow.

105 INV
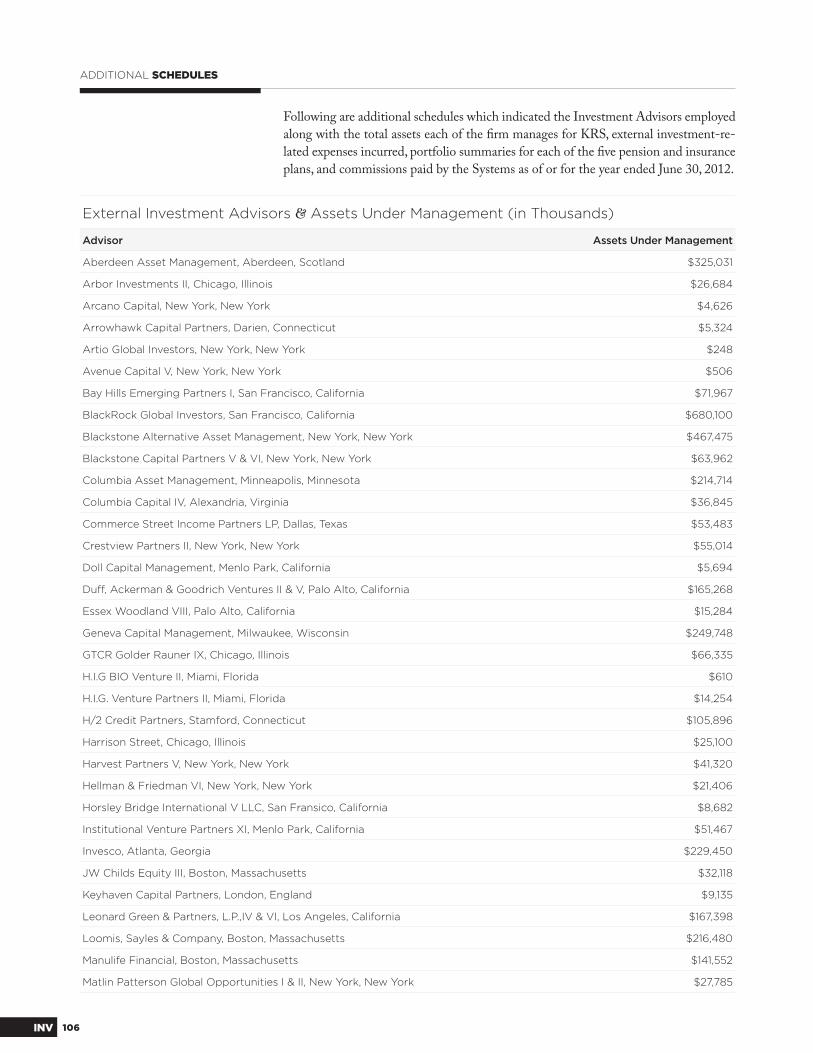
106INV
ADDITIONAL SCHEDULES
Following are additional schedules which indicated the Investment Advisors employed
along with the total assets each of the fi rm manages for KRS, external investment-re-
lated expenses incurred, portfolio summaries for each of the fi ve pension and insurance
plans, and commissions paid by the Systems as of or for the year ended June 30, 2012.
External Investment Advisors & Assets Under Management (in Thousands)
Advisor Assets Under Management
Aberdeen Asset Management, Aberdeen, Scotland $325,031
Arbor Investments II, Chicago, Illinois $26,684
Arcano Capital, New York, New York $4,626
Arrowhawk Capital Partners, Darien, Connecticut $5,324
Artio Global Investors, New York, New York $248
Avenue Capital V, New York, New York $506
Bay Hills Emerging Partners I, San Francisco, California $71,967
BlackRock Global Investors, San Francisco, California $680,100
Blackstone Alternative Asset Management, New York, New York $467,475
Blackstone Capital Partners V & VI, New York, New York $63,962
Columbia Asset Management, Minneapolis, Minnesota $214,714
Columbia Capital IV, Alexandria, Virginia $36,845
Commerce Street Income Partners LP, Dallas, Texas $53,483
Crestview Partners II, New York, New York $55,014
Doll Capital Management, Menlo Park, California $5,694
Duff , Ackerman & Goodrich Ventures II & V, Palo Alto, California $165,268
Essex Woodland VIII, Palo Alto, California $15,284
Geneva Capital Management, Milwaukee, Wisconsin $249,748
GTCR Golder Rauner IX, Chicago, Illinois $66,335
H.I.G BIO Venture II, Miami, Florida $610
H.I.G. Venture Partners II, Miami, Florida $14,254
H/2 Credit Partners, Stamford, Connecticut $105,896
Harrison Street, Chicago, Illinois $25,100
Harvest Partners V, New York, New York $41,320
Hellman & Friedman VI, New York, New York $21,406
Horsley Bridge International V LLC, San Fransico, California $8,682
Institutional Venture Partners XI, Menlo Park, California $51,467
Invesco, Atlanta, Georgia $229,450
JW Childs Equity III, Boston, Massachusetts $32,118
Keyhaven Capital Partners, London, England $9,135
Leonard Green & Partners, L.P.,IV & VI, Los Angeles, California $167,398
Loomis, Sayles & Company, Boston, Massachusetts $216,480
Manulife Financial, Boston, Massachusetts $141,552
Matlin Patterson Global Opportunities I & II, New York, New York $27,785
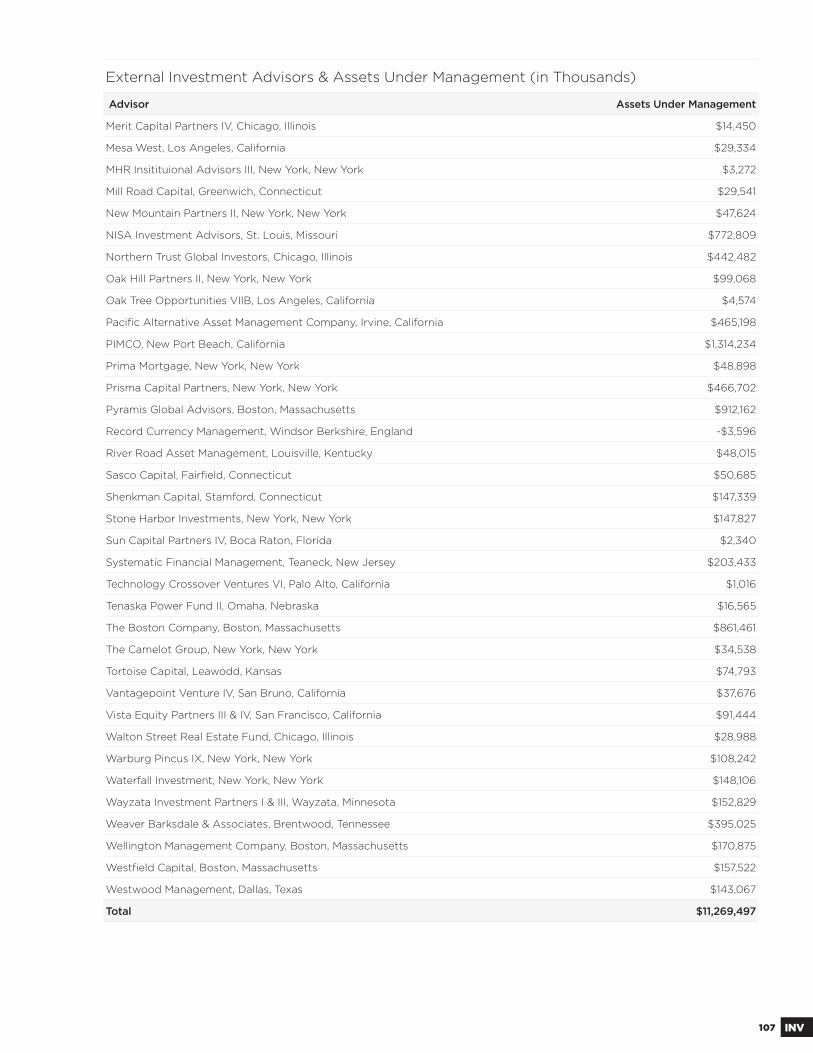
107 INV
External Investment Advisors & Assets Under Management (in Thousands)
Advisor Assets Under Management
Merit Capital Partners IV, Chicago, Illinois $14,450
Mesa West, Los Angeles, California $29,334
MHR Insitituional Advisors III, New York, New York $3,272
Mill Road Capital, Greenwich, Connecticut $29,541
New Mountain Partners II, New York, New York $47,624
NISA Investment Advisors, St. Louis, Missouri $772,809
Northern Trust Global Investors, Chicago, Illinois $442,482
Oak Hill Partners II, New York, New York $99,068
Oak Tree Opportunities VIIB, Los Angeles, California $4,574
Pacifi c Alternative Asset Management Company, Irvine, California $465,198
PIMCO, New Port Beach, California $1,314,234
Prima Mortgage, New York, New York $48,898
Prisma Capital Partners, New York, New York $466,702
Pyramis Global Advisors, Boston, Massachusetts $912,162
Record Currency Management, Windsor Berkshire, England -$3,596
River Road Asset Management, Louisville, Kentucky $48,015
Sasco Capital, Fairfi eld, Connecticut $50,685
Shenkman Capital, Stamford, Connecticut $147,339
Stone Harbor Investments, New York, New York $147,827
Sun Capital Partners IV, Boca Raton, Florida $2,340
Systematic Financial Management, Teaneck, New Jersey $203,433
Technology Crossover Ventures VI, Palo Alto, California $1,016
Tenaska Power Fund II, Omaha, Nebraska $16,565
The Boston Company, Boston, Massachusetts $861,461
The Camelot Group, New York, New York $34,538
Tortoise Capital, Leawodd, Kansas $74,793
Vantagepoint Venture IV, San Bruno, California $37,676
Vista Equity Partners III & IV, San Francisco, California $91,444
Walton Street Real Estate Fund, Chicago, Illinois $28,988
Warburg Pincus IX, New York, New York $108,242
Waterfall Investment, New York, New York $148,106
Wayzata Investment Partners I & III, Wayzata, Minnesota $152,829
Weaver Barksdale & Associates, Brentwood, Tennessee $395,025
Wellington Management Company, Boston, Massachusetts $170,875
Westfi eld Capital, Boston, Massachusetts $157,522
Westwood Management, Dallas, Texas $143,067
Total $11,269,497
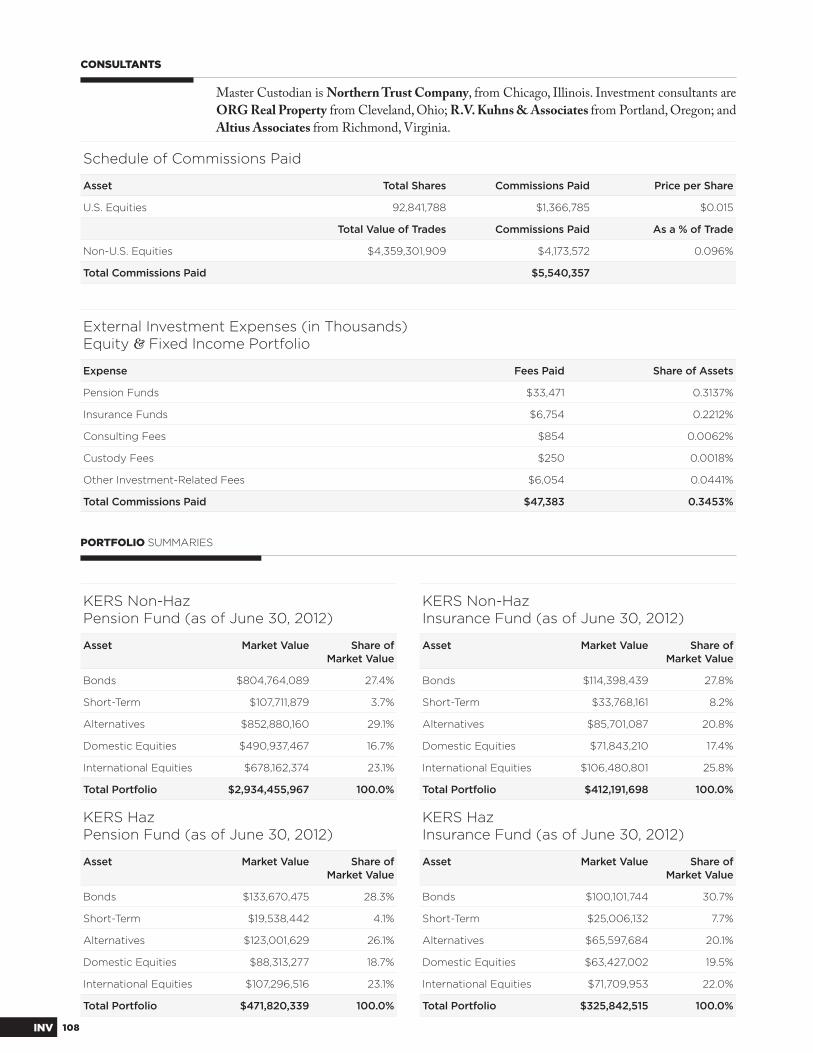
108INV
External Investment Expenses (in Thousands)Equity & Fixed Income Portfolio
Expense Fees Paid Share of Assets
Pension Funds $33,471 0.3137%
Insurance Funds $6,754 0.2212%
Consulting Fees $854 0.0062%
Custody Fees $250 0.0018%
Other Investment-Related Fees $6,054 0.0441%
Total Commissions Paid $47,383 0.3453%
PORTFOLIO SUMMARIES
KERS Non-HazPension Fund (as of June 30, 2012)
Asset Market Value Share ofMarket Value
Bonds $804,764,089 27.4%
Short-Term $107,711,879 3.7%
Alternatives $852,880,160 29.1%
Domestic Equities $490,937,467 16.7%
International Equities $678,162,374 23.1%
Total Portfolio $2,934,455,967 100.0%
KERS HazPension Fund (as of June 30, 2012)
Asset Market Value Share ofMarket Value
Bonds $133,670,475 28.3%
Short-Term $19,538,442 4.1%
Alternatives $123,001,629 26.1%
Domestic Equities $88,313,277 18.7%
International Equities $107,296,516 23.1%
Total Portfolio $471,820,339 100.0%
KERS Non-HazInsurance Fund (as of June 30, 2012)
Asset Market Value Share ofMarket Value
Bonds $114,398,439 27.8%
Short-Term $33,768,161 8.2%
Alternatives $85,701,087 20.8%
Domestic Equities $71,843,210 17.4%
International Equities $106,480,801 25.8%
Total Portfolio $412,191,698 100.0%
KERS HazInsurance Fund (as of June 30, 2012)
Asset Market Value Share ofMarket Value
Bonds $100,101,744 30.7%
Short-Term $25,006,132 7.7%
Alternatives $65,597,684 20.1%
Domestic Equities $63,427,002 19.5%
International Equities $71,709,953 22.0%
Total Portfolio $325,842,515 100.0%
CONSULTANTS
Master Custodian is Northern Trust Company, from Chicago, Illinois. Investment consultants are
ORG Real Property from Cleveland, Ohio; R.V. Kuhns & Associates from Portland, Oregon; and
Altius Associates from Richmond, Virginia.
Schedule of Commissions Paid
Asset Total Shares Commissions Paid Price per Share
U.S. Equities 92,841,788 $1,366,785 $0.015
Total Value of Trades Commissions Paid As a % of Trade
Non-U.S. Equities $4,359,301,909 $4,173,572 0.096%
Total Commissions Paid $5,540,357
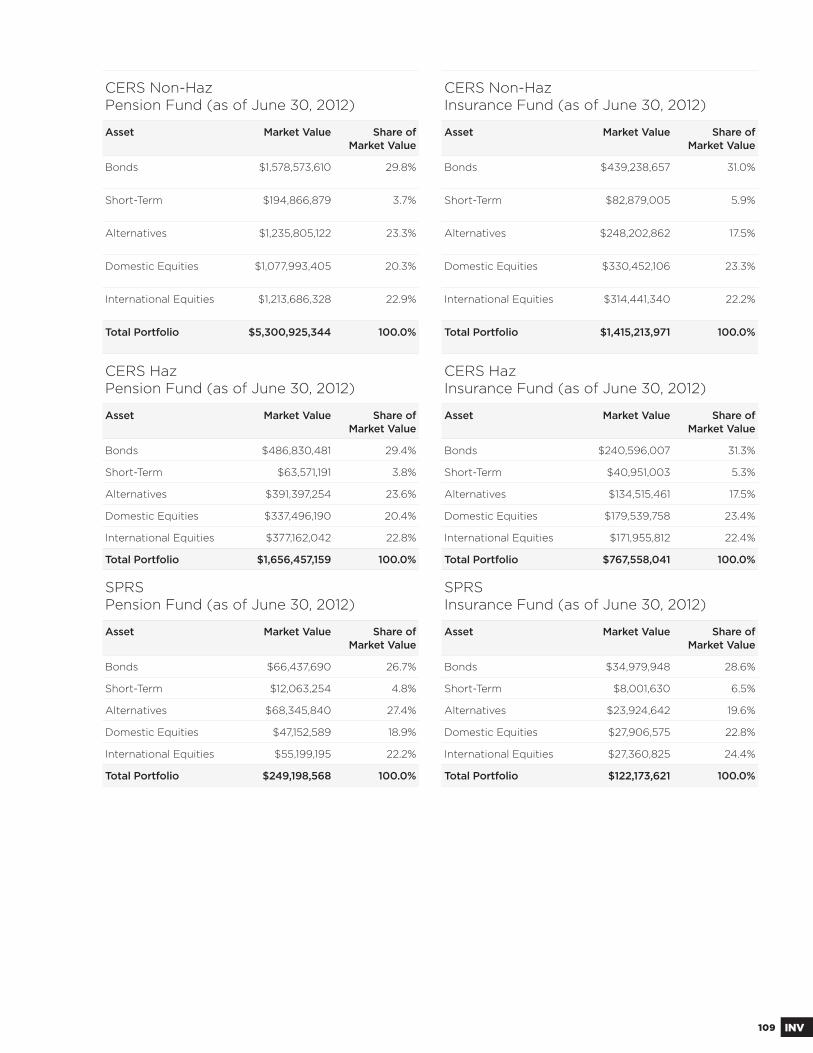
109 INV
CERS Non-HazPension Fund (as of June 30, 2012)
Asset Market Value Share ofMarket Value
Bonds $1,578,573,610 29.8%
Short-Term $194,866,879 3.7%
Alternatives $1,235,805,122 23.3%
Domestic Equities $1,077,993,405 20.3%
International Equities $1,213,686,328 22.9%
Total Portfolio $5,300,925,344 100.0%
CERS HazPension Fund (as of June 30, 2012)
Asset Market Value Share ofMarket Value
Bonds $486,830,481 29.4%
Short-Term $63,571,191 3.8%
Alternatives $391,397,254 23.6%
Domestic Equities $337,496,190 20.4%
International Equities $377,162,042 22.8%
Total Portfolio $1,656,457,159 100.0%
SPRSPension Fund (as of June 30, 2012)
Asset Market Value Share ofMarket Value
Bonds $66,437,690 26.7%
Short-Term $12,063,254 4.8%
Alternatives $68,345,840 27.4%
Domestic Equities $47,152,589 18.9%
International Equities $55,199,195 22.2%
Total Portfolio $249,198,568 100.0%
CERS Non-HazInsurance Fund (as of June 30, 2012)
Asset Market Value Share ofMarket Value
Bonds $439,238,657 31.0%
Short-Term $82,879,005 5.9%
Alternatives $248,202,862 17.5%
Domestic Equities $330,452,106 23.3%
International Equities $314,441,340 22.2%
Total Portfolio $1,415,213,971 100.0%
CERS HazInsurance Fund (as of June 30, 2012)
Asset Market Value Share ofMarket Value
Bonds $240,596,007 31.3%
Short-Term $40,951,003 5.3%
Alternatives $134,515,461 17.5%
Domestic Equities $179,539,758 23.4%
International Equities $171,955,812 22.4%
Total Portfolio $767,558,041 100.0%
SPRSInsurance Fund (as of June 30, 2012)
Asset Market Value Share ofMarket Value
Bonds $34,979,948 28.6%
Short-Term $8,001,630 6.5%
Alternatives $23,924,642 19.6%
Domestic Equities $27,906,575 22.8%
International Equities $27,360,825 24.4%
Total Portfolio $122,173,621 100.0%

110ACT
111 ACT111111111 ACTACTTAA
Actuarial Section
112 Certifi cation Letter
115 Summary of Actuarial Assumptions & Methods
120 Summary of Actuarial Valuation Results
121 Recommended Employer Contribution Rates
123 Summary of Actuarially Unfunded Liabilities
126 Analysis of Financial Experience
128 Solvency Test
131 Summary of Active Member Valuation Data
133 Summary of Retired Member Valuation Data
134 Summary of Benefi t Provisions
ACTUARIAL TABLE OF CONTENTS
112ACT
Th ese reports describe the current actuarial condition of the Kentucky
Retirement Systems (KRS), determine the calculated employer contribu-
tion rates, and analyze fl uctuations in these contribution rates.
Under state statute, the Board of Trustees must approve the employer
contribution rate for the upcoming fi scal year based upon the results of the
most recent annual valuation. Th ese rates are determined actuarially based
upon current membership data, plan provisions, and the assumptions and
funding policies adopted by the KRS Board. Employer contribution rates
become eff ective one year after the valuation date. Th e recently completed
June 30, 2012 actuarial valuation will be used by the Board of Trustees to
certify the employer contribution rates for the fi scal year beginning July 1,
2013 and ending June 30, 2014.
Funding Objectives & Policies For each retirement system, KRS
administers both a pension and insurance fund to provide for monthly
retirement allowances and retiree insurance benefi ts respectively. Th e total
employer contribution rate is comprised of a contribution to each respec-
tive fund.
Relative to the pension fund, a contribution rate has been established
which consists of the normal cost and an amortization payment on the
unfunded accrued liability (UAL). Th e normal cost is expected to remain
level as a percent of payroll in future years. Th e amortization of any UAL
is made over 30 years from the establishment of the amortization base
using a level percent of payroll amortization method. Prior to the June
30, 2007 actuarial valuation, each year any actuarial gains or losses, along
with any other changes in the actuarial liability (such as the retiree COLA
or other benefi t improvements) were established as a new amortization
base to be amortized over the following 30 years. Eff ective with the June
30, 2007 actuarial valuation, all amortization bases have been combined
and amortized over a single 30-year period beginning June 30, 2007. Th e
amortization period will decrease by one each year going forward (i.e. 29-
year amortization June 30, 2008, 28-year amortization June 30, 2009, and
so on).
Th e fi fty-sixth annual actuarial valuation of the Kentucky Employees Retirement System, the fi fty-third annual actuarial valuation of the County Employees Retirement System, and the fi fty-fourth annual actuarial valuation of the State Police Retirement System have been completed and the reports prepared.
Certifi cation ofActuarial Results
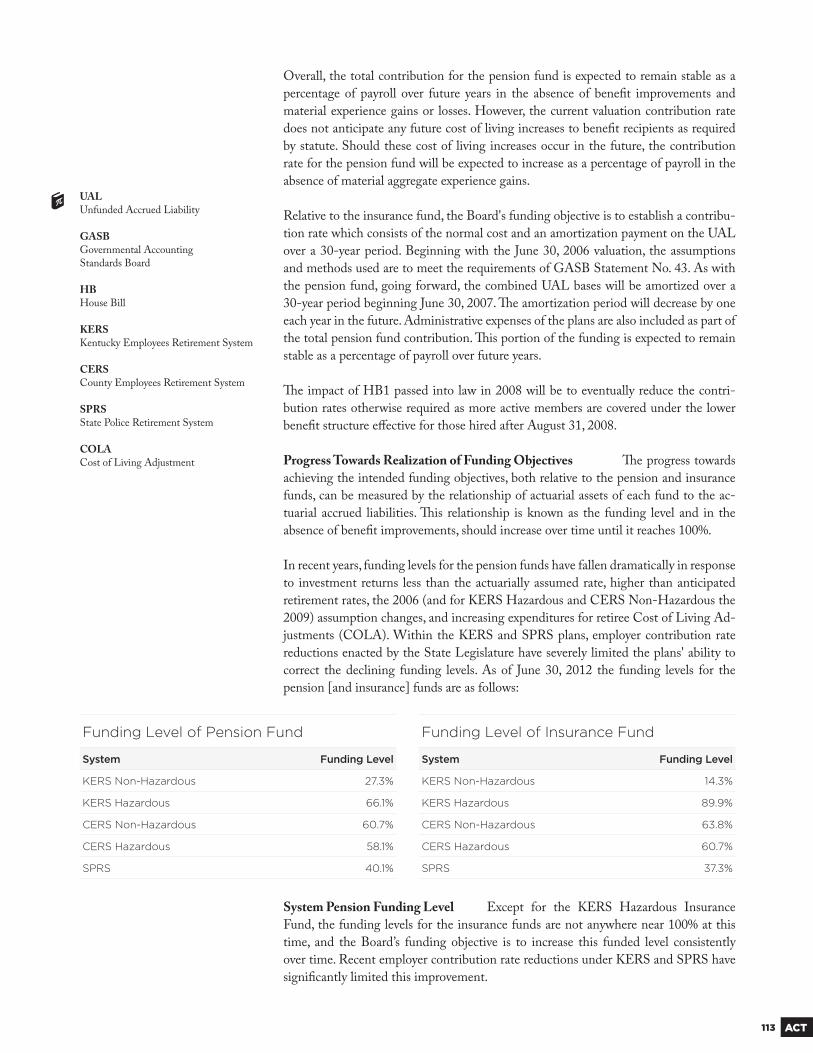
113 ACT
Overall, the total contribution for the pension fund is expected to remain stable as a
percentage of payroll over future years in the absence of benefi t improvements and
material experience gains or losses. However, the current valuation contribution rate
does not anticipate any future cost of living increases to benefi t recipients as required
by statute. Should these cost of living increases occur in the future, the contribution
rate for the pension fund will be expected to increase as a percentage of payroll in the
absence of material aggregate experience gains.
Relative to the insurance fund, the Board's funding objective is to establish a contribu-
tion rate which consists of the normal cost and an amortization payment on the UAL
over a 30-year period. Beginning with the June 30, 2006 valuation, the assumptions
and methods used are to meet the requirements of GASB Statement No. 43. As with
the pension fund, going forward, the combined UAL bases will be amortized over a
30-year period beginning June 30, 2007. Th e amortization period will decrease by one
each year in the future. Administrative expenses of the plans are also included as part of
the total pension fund contribution. Th is portion of the funding is expected to remain
stable as a percentage of payroll over future years.
Th e impact of HB1 passed into law in 2008 will be to eventually reduce the contri-
bution rates otherwise required as more active members are covered under the lower
benefi t structure eff ective for those hired after August 31, 2008.
Progress Towards Realization of Funding Objectives Th e progress towards
achieving the intended funding objectives, both relative to the pension and insurance
funds, can be measured by the relationship of actuarial assets of each fund to the ac-
tuarial accrued liabilities. Th is relationship is known as the funding level and in the
absence of benefi t improvements, should increase over time until it reaches 100%.
In recent years, funding levels for the pension funds have fallen dramatically in response
to investment returns less than the actuarially assumed rate, higher than anticipated
retirement rates, the 2006 (and for KERS Hazardous and CERS Non-Hazardous the
2009) assumption changes, and increasing expenditures for retiree Cost of Living Ad-
justments (COLA). Within the KERS and SPRS plans, employer contribution rate
reductions enacted by the State Legislature have severely limited the plans' ability to
correct the declining funding levels. As of June 30, 2012 the funding levels for the
pension [and insurance] funds are as follows:
UALUnfunded Accrued Liability
GASBGovernmental AccountingStandards Board
HBHouse Bill
KERSKentucky Employees Retirement System
CERSCounty Employees Retirement System
SPRSState Police Retirement System
COLACost of Living Adjustment
Funding Level of Pension Fund
System Funding Level
KERS Non-Hazardous 27.3%
KERS Hazardous 66.1%
CERS Non-Hazardous 60.7%
CERS Hazardous 58.1%
SPRS 40.1%
Funding Level of Insurance Fund
System Funding Level
KERS Non-Hazardous 14.3%
KERS Hazardous 89.9%
CERS Non-Hazardous 63.8%
CERS Hazardous 60.7%
SPRS 37.3%
System Pension Funding Level Except for the KERS Hazardous Insurance
Fund, the funding levels for the insurance funds are not anywhere near 100% at this
time, and the Board’s funding objective is to increase this funded level consistently
over time. Recent employer contribution rate reductions under KERS and SPRS have
signifi cantly limited this improvement.
114ACT
Data In completing the valuation of these systems, we have relied on data pro-
vided by Kentucky Retirement Systems, as well as fi nancial data provided by the plan's
external auditor. We have reviewed this data for reasonableness, and made some general
edit checks to impute certain information that may not have been provided with the
original employee data. However, we have not audited this data. Any schedules of trend
data over the past ten years or less contained in the Actuarial Section, as well as the
Schedule of Funding Progress and Schedule of Employer Contributions in the Finan-
cial Section, have been based on valuation reports fully prepared by the actuary for the
plan at the time of each valuation.
Assumptions & Methods Th e Board of Trustees, in consultation with the
actuary, sets the actuarial assumptions and methods used in the valuation. At least
once every fi ve years the actuary conducts a thorough review of plan experience for
the preceding fi ve years, and then makes recommendations to the Board. Th e actuarial
assumptions and methods used for the funding calculations of the valuation, as adopted
by the Board on August 20, 2009 based on the experience investigation report dated
August 17, 2009, meet the parameters set for disclosure under GASB Statements No.
25 and 43. Th ese assumptions have been adopted by the Board of Trustees of the Ken-
tucky Retirement Systems in accordance with the recommendation of the actuary. Th e
next experience study is scheduled to be completed in January, 2014 and any adjust-
ments will be refl ected in the June 30, 2014 actuarial valuation.
Closing Th e information presented in this letter describes the pertinent issues rela-
tive to the valuation. Th ere are no other specifi c issues that need to be raised beyond
these items in order to fairly assess the funded position of the plan as presented in the
current valuation.
Based on the continuation of current funding policies adopted by the Board, adequate
provision is being determined for the funding of the actuarial liabilities of the Kentucky
Employees Retirement System, the County Employees Retirement System, and the
State Police Retirement System as required by the Kentucky Revised Statutes. Th e
funding rates established by the Board are appropriate for this purpose. However, it is
up to the state legislature to follow through with the required funding. Th e contribu-
tion phase-in anticipated under statute, particularly for KERS Non-Hazardous and
State Police, leave those funds with little or no ability to withstand any signifi cant short
term adverse fi nancial and/or demographic experience.
Th omas J. Cavanaugh FSA, FCA, MAAA, EA // CEO
Cavanaugh Macdonald Consulting, LLC
December 5, 2012
Th e progress towards achieving the intended funding objectives, both relative to the pension and insurance funds, can be measured by the relationship of actuarial assets of each fund to the actuarial accrued liabilities.
115 ACT
As of June 30, 2011 Th e most recent study was com-
pleted in August 2009 and reviewed plan experience for the
period from July 1, 2005 through June 30, 2008. All assump-
tions, with the exception of health care trend rates, used in
the June 30, 2011 actuarial valuation were based on the study
performed in 2009 and in accordance with the actuary's rec-
ommendations. Th e next Experience Study is scheduled to
be completed in January, 2014.
Actuarial Cost Method Th e actuarial valua-
tion was prepared using the entry age normal cost (EANC)
method as required by state statute. Under this method, the
present value of future benefi ts is determined for each mem-
ber and allocated equitably as a level percentage of payroll
from the member's entry age into the plan to the assumed
age of exit from the plan. Th e portion of the present value of
future benefi ts allocated to the current valuation year is called
the normal cost. Th e portion of the present value of future
benefi ts allocated to prior years of service that has accrued to
date is called the actuarial liability. Th e unfunded actuarial li-
ability (UAL) represents the diff erence between the actuarial
liability and the actuarial value of assets as of the valuation
date. Relative to the pension fund and the insurance fund, an
employer contribution rate has been established to be equal
to the sum of the normal cost and the amount needed to am-
ortize the unfunded actuarial liability (UAL) over no more
than a 30-year period.
UAL Amortization Method Th e amortization of
any UAL is made over 30 years from the establishment of the
amortization base using a level percent of payroll amortiza-
tion method. Prior to the June 30, 2007 actuarial valuation,
each year any actuarial gains or losses, along with any other
changes in the actuarial liability (such as the retiree COLA
or other benefi t improvements) were established as a new
amortization base to be amortized over the following 30
years. Eff ective with the June 30, 2007 actuarial valuation,
all amortization bases have been combined and amortized
over a single 30-year period beginning June 30, 2007. Th e
amortization period will decrease by one each year going for-
ward (i.e. 29-year amortization June 30, 2008, 28-year June
30, 2009, and so on.)
Asset Valuation Method Th e actuarial value
of assets recognizes a portion of the diff erence between the
market value of assets and the expected market value of as-
sets, based on the investment return assumption. Th e amount
recognized each year is 20% of the diff erence between mar-
ket value and expected market value. Th e Asset Valuation
Method was adopted in 2006.
Retiree Insurance Funding Policy Th e assumptions,
methods, and funding requirements used in the valuation are
to meet the requirements of GASB Statement No. 43. As
with the pension Fund, going forward, the combined UAL
bases will be amortized over a 30 year period beginning June
30, 2007. Th e amortization period will decrease by one, each
year in the future.
Investment Return Assumption Th e future invest-
ment earnings of plan assets are assumed to accumulate
at a rate of 7.75% per annum. Th is rate consists of a 3.5%
infl ationary component and a 4.25% real rate of return com-
ponent. In accordance with GASB Statement 43, the invest-
ment return assumption has been reduced to a blended rate
of 4.5% for KERS and SPRS insurance funds due to a lack of
pre-funding benefi ts. Th is assumption was adopted in 2006.
Salary Increase Assumptions Active member sala-
ries are assumed to increase at the rates provided in Table
1. Th e rates include a 4.5% percent infl ationary component
and an additional increase due to promotion based upon plan
experience. Th ese assumptions were adopted in 2009.
Summary of Actuarial Assumptions
Th e results of the actuarial valuation are based upon the assumptions and funding policies adopted by the Board and statutory funding requirements. Assumptions and funding policies are reviewed against actual plan experience at least once every fi ve years through the completion of the Actuarial Experience Study.
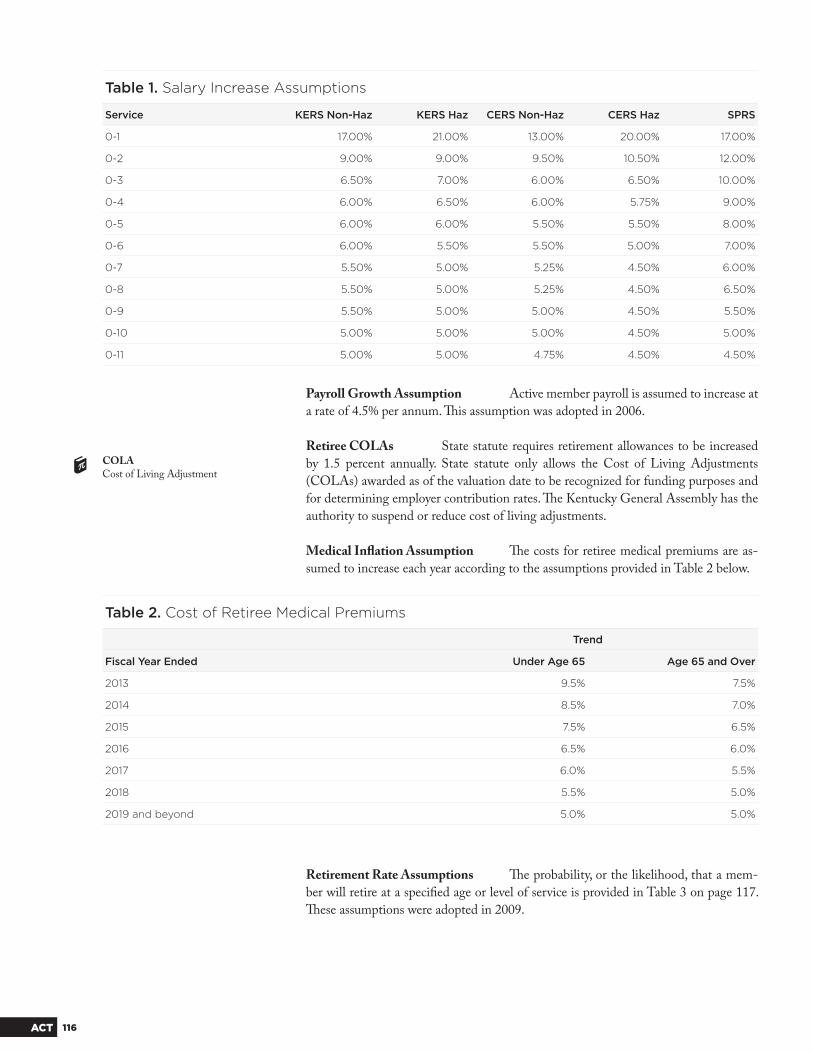
116ACT
Table 1. Salary Increase Assumptions
Service KERS Non-Haz KERS Haz CERS Non-Haz CERS Haz SPRS
0-1 17.00% 21.00% 13.00% 20.00% 17.00%
0-2 9.00% 9.00% 9.50% 10.50% 12.00%
0-3 6.50% 7.00% 6.00% 6.50% 10.00%
0-4 6.00% 6.50% 6.00% 5.75% 9.00%
0-5 6.00% 6.00% 5.50% 5.50% 8.00%
0-6 6.00% 5.50% 5.50% 5.00% 7.00%
0-7 5.50% 5.00% 5.25% 4.50% 6.00%
0-8 5.50% 5.00% 5.25% 4.50% 6.50%
0-9 5.50% 5.00% 5.00% 4.50% 5.50%
0-10 5.00% 5.00% 5.00% 4.50% 5.00%
0-11 5.00% 5.00% 4.75% 4.50% 4.50%
Payroll Growth Assumption Active member payroll is assumed to increase at
a rate of 4.5% per annum. Th is assumption was adopted in 2006.
Retiree COLAs State statute requires retirement allowances to be increased
by 1.5 percent annually. State statute only allows the Cost of Living Adjustments
(COLAs) awarded as of the valuation date to be recognized for funding purposes and
for determining employer contribution rates. Th e Kentucky General Assembly has the
authority to suspend or reduce cost of living adjustments.
Medical Infl ation Assumption Th e costs for retiree medical premiums are as-
sumed to increase each year according to the assumptions provided in Table 2 below.
Table 2. Cost of Retiree Medical Premiums
Trend
Fiscal Year Ended Under Age 65 Age 65 and Over
2013 9.5% 7.5%
2014 8.5% 7.0%
2015 7.5% 6.5%
2016 6.5% 6.0%
2017 6.0% 5.5%
2018 5.5% 5.0%
2019 and beyond 5.0% 5.0%
Retirement Rate Assumptions Th e probability, or the likelihood, that a mem-
ber will retire at a specifi ed age or level of service is provided in Table 3 on page 117.
Th ese assumptions were adopted in 2009.
COLACost of Living Adjustment
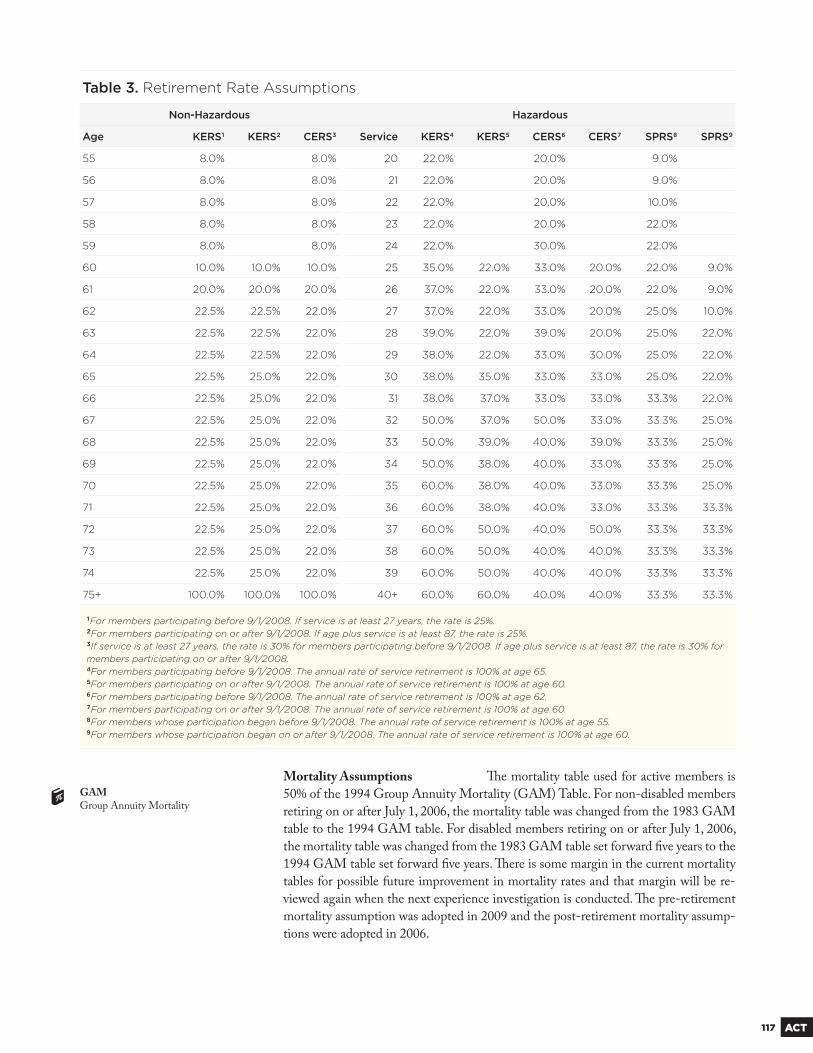
117 ACT
Table 3. Retirement Rate Assumptions
Non-Hazardous Hazardous
Age KERS1 KERS2 CERS3 Service KERS4 KERS5 CERS6 CERS7 SPRS8 SPRS9
55 8.0% 8.0% 20 22.0% 20.0% 9.0%
56 8.0% 8.0% 21 22.0% 20.0% 9.0%
57 8.0% 8.0% 22 22.0% 20.0% 10.0%
58 8.0% 8.0% 23 22.0% 20.0% 22.0%
59 8.0% 8.0% 24 22.0% 30.0% 22.0%
60 10.0% 10.0% 10.0% 25 35.0% 22.0% 33.0% 20.0% 22.0% 9.0%
61 20.0% 20.0% 20.0% 26 37.0% 22.0% 33.0% 20.0% 22.0% 9.0%
62 22.5% 22.5% 22.0% 27 37.0% 22.0% 33.0% 20.0% 25.0% 10.0%
63 22.5% 22.5% 22.0% 28 39.0% 22.0% 39.0% 20.0% 25.0% 22.0%
64 22.5% 22.5% 22.0% 29 38.0% 22.0% 33.0% 30.0% 25.0% 22.0%
65 22.5% 25.0% 22.0% 30 38.0% 35.0% 33.0% 33.0% 25.0% 22.0%
66 22.5% 25.0% 22.0% 31 38.0% 37.0% 33.0% 33.0% 33.3% 22.0%
67 22.5% 25.0% 22.0% 32 50.0% 37.0% 50.0% 33.0% 33.3% 25.0%
68 22.5% 25.0% 22.0% 33 50.0% 39.0% 40.0% 39.0% 33.3% 25.0%
69 22.5% 25.0% 22.0% 34 50.0% 38.0% 40.0% 33.0% 33.3% 25.0%
70 22.5% 25.0% 22.0% 35 60.0% 38.0% 40.0% 33.0% 33.3% 25.0%
71 22.5% 25.0% 22.0% 36 60.0% 38.0% 40.0% 33.0% 33.3% 33.3%
72 22.5% 25.0% 22.0% 37 60.0% 50.0% 40.0% 50.0% 33.3% 33.3%
73 22.5% 25.0% 22.0% 38 60.0% 50.0% 40.0% 40.0% 33.3% 33.3%
74 22.5% 25.0% 22.0% 39 60.0% 50.0% 40.0% 40.0% 33.3% 33.3%
75+ 100.0% 100.0% 100.0% 40+ 60.0% 60.0% 40.0% 40.0% 33.3% 33.3%
1For members participating before 9/1/2008. If service is at least 27 years, the rate is 25%.2For members participating on or after 9/1/2008. If age plus service is at least 87, the rate is 25%.3If service is at least 27 years, the rate is 30% for members participating before 9/1/2008. If age plus service is at least 87, the rate is 30% for members participating on or after 9/1/2008.4For members participating before 9/1/2008. The annual rate of service retirement is 100% at age 65.5For members participating on or after 9/1/2008. The annual rate of service retirement is 100% at age 60.6For members participating before 9/1/2008. The annual rate of service retirement is 100% at age 62.7For members participating on or after 9/1/2008. The annual rate of service retirement is 100% at age 60.8For members whose participation began before 9/1/2008. The annual rate of service retirement is 100% at age 55.9For members whose participation began on or after 9/1/2008. The annual rate of service retirement is 100% at age 60.
Mortality Assumptions Th e mortality table used for active members is
50% of the 1994 Group Annuity Mortality (GAM) Table. For non-disabled members
retiring on or after July 1, 2006, the mortality table was changed from the 1983 GAM
table to the 1994 GAM table. For disabled members retiring on or after July 1, 2006,
the mortality table was changed from the 1983 GAM table set forward fi ve years to the
1994 GAM table set forward fi ve years. Th ere is some margin in the current mortality
tables for possible future improvement in mortality rates and that margin will be re-
viewed again when the next experience investigation is conducted. Th e pre-retirement
mortality assumption was adopted in 2009 and the post-retirement mortality assump-
tions were adopted in 2006.
GAMGroup Annuity Mortality
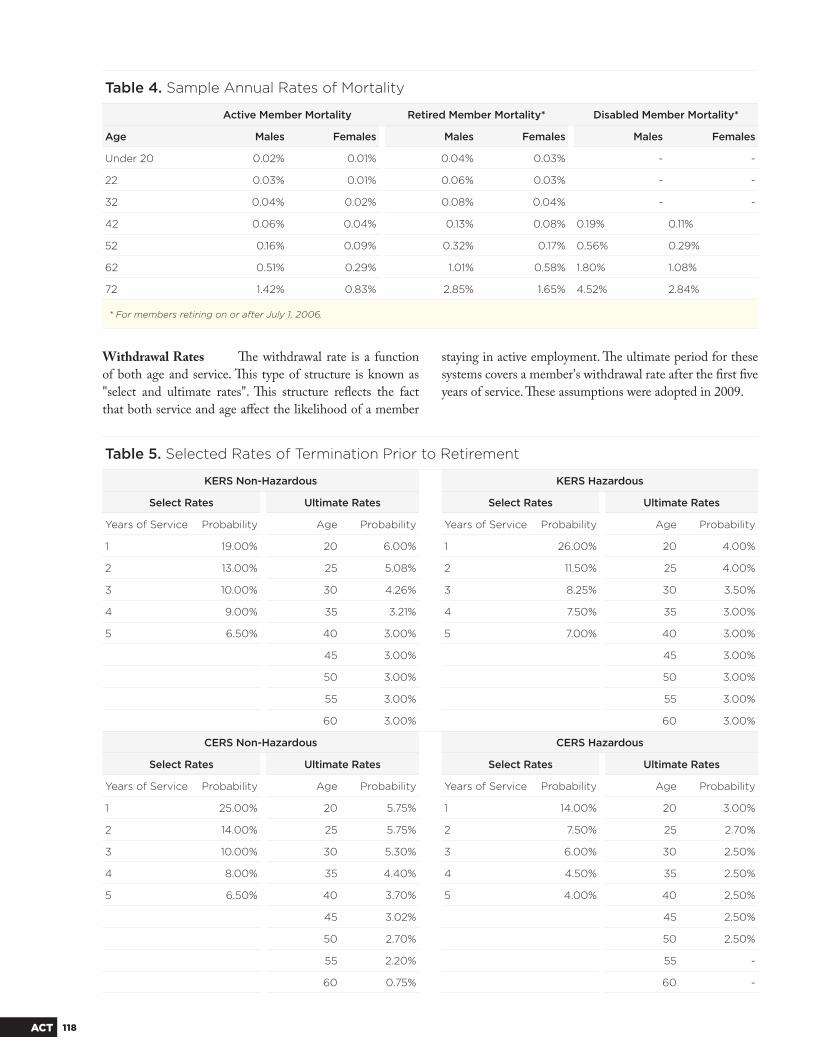
118ACT
Table 4. Sample Annual Rates of Mortality
Active Member Mortality Retired Member Mortality* Disabled Member Mortality*
Age Males Females Males Females Males Females
Under 20 0.02% 0.01% 0.04% 0.03% - -
22 0.03% 0.01% 0.06% 0.03% - -
32 0.04% 0.02% 0.08% 0.04% - -
42 0.06% 0.04% 0.13% 0.08% 0.19% 0.11%
52 0.16% 0.09% 0.32% 0.17% 0.56% 0.29%
62 0.51% 0.29% 1.01% 0.58% 1.80% 1.08%
72 1.42% 0.83% 2.85% 1.65% 4.52% 2.84%
* For members retiring on or after July 1, 2006.
Withdrawal Rates Th e withdrawal rate is a function
of both age and service. Th is type of structure is known as
"select and ultimate rates". Th is structure refl ects the fact
that both service and age aff ect the likelihood of a member
staying in active employment. Th e ultimate period for these
systems covers a member's withdrawal rate after the fi rst fi ve
years of service. Th ese assumptions were adopted in 2009.
Table 5. Selected Rates of Termination Prior to Retirement
KERS Non-Hazardous KERS Hazardous
Select Rates Ultimate Rates Select Rates Ultimate Rates
Years of Service Probability Age Probability Years of Service Probability Age Probability
1 19.00% 20 6.00% 1 26.00% 20 4.00%
2 13.00% 25 5.08% 2 11.50% 25 4.00%
3 10.00% 30 4.26% 3 8.25% 30 3.50%
4 9.00% 35 3.21% 4 7.50% 35 3.00%
5 6.50% 40 3.00% 5 7.00% 40 3.00%
45 3.00% 45 3.00%
50 3.00% 50 3.00%
55 3.00% 55 3.00%
60 3.00% 60 3.00%
CERS Non-Hazardous CERS Hazardous
Select Rates Ultimate Rates Select Rates Ultimate Rates
Years of Service Probability Age Probability Years of Service Probability Age Probability
1 25.00% 20 5.75% 1 14.00% 20 3.00%
2 14.00% 25 5.75% 2 7.50% 25 2.70%
3 10.00% 30 5.30% 3 6.00% 30 2.50%
4 8.00% 35 4.40% 4 4.50% 35 2.50%
5 6.50% 40 3.70% 5 4.00% 40 2.50%
45 3.02% 45 2.50%
50 2.70% 50 2.50%
55 2.20% 55 -
60 0.75% 60 -
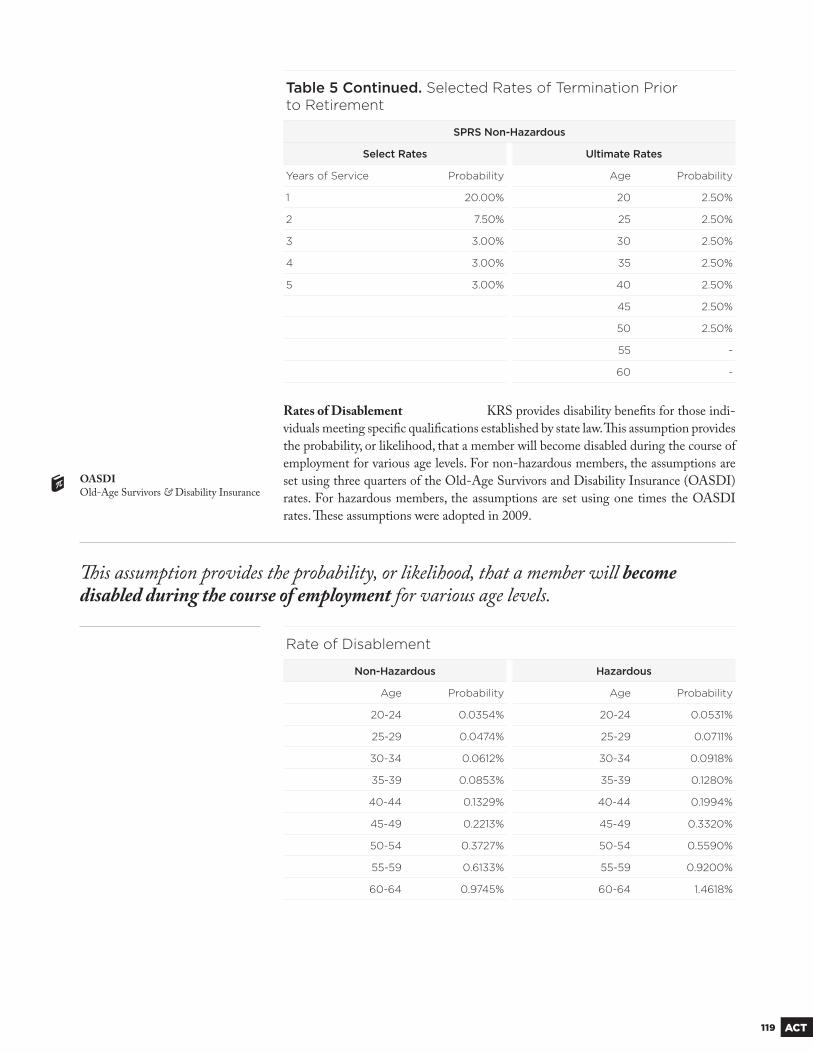
119 ACT
Table 5 Continued. Selected Rates of Termination Priorto Retirement
SPRS Non-Hazardous
Select Rates Ultimate Rates
Years of Service Probability Age Probability
1 20.00% 20 2.50%
2 7.50% 25 2.50%
3 3.00% 30 2.50%
4 3.00% 35 2.50%
5 3.00% 40 2.50%
45 2.50%
50 2.50%
55 -
60 -
Rates of Disablement KRS provides disability benefi ts for those indi-
viduals meeting specifi c qualifi cations established by state law. Th is assumption provides
the probability, or likelihood, that a member will become disabled during the course of
employment for various age levels. For non-hazardous members, the assumptions are
set using three quarters of the Old-Age Survivors and Disability Insurance (OASDI)
rates. For hazardous members, the assumptions are set using one times the OASDI
rates. Th ese assumptions were adopted in 2009.
OASDIOld-Age Survivors & Disability Insurance
Rate of Disablement
Non-Hazardous Hazardous
Age Probability Age Probability
20-24 0.0354% 20-24 0.0531%
25-29 0.0474% 25-29 0.0711%
30-34 0.0612% 30-34 0.0918%
35-39 0.0853% 35-39 0.1280%
40-44 0.1329% 40-44 0.1994%
45-49 0.2213% 45-49 0.3320%
50-54 0.3727% 50-54 0.5590%
55-59 0.6133% 55-59 0.9200%
60-64 0.9745% 60-64 1.4618%
Th is assumption provides the probability, or likelihood, that a member will become disabled during the course of employment for various age levels.
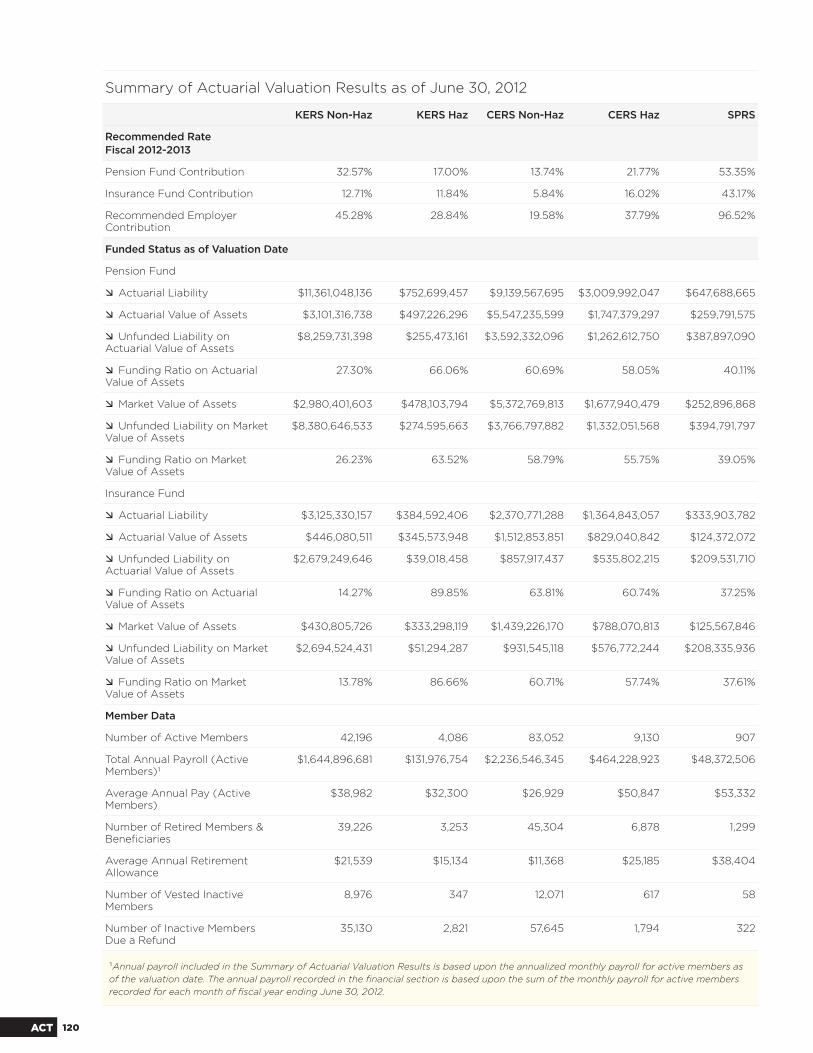
120ACT
Summary of Actuarial Valuation Results as of June 30, 2012
KERS Non-Haz KERS Haz CERS Non-Haz CERS Haz SPRS
Recommended RateFiscal 2012-2013
Pension Fund Contribution 32.57% 17.00% 13.74% 21.77% 53.35%
Insurance Fund Contribution 12.71% 11.84% 5.84% 16.02% 43.17%
Recommended Employer Contribution
45.28% 28.84% 19.58% 37.79% 96.52%
Funded Status as of Valuation Date
Pension Fund
Actuarial Liability $11,361,048,136 $752,699,457 $9,139,567,695 $3,009,992,047 $647,688,665
Actuarial Value of Assets $3,101,316,738 $497,226,296 $5,547,235,599 $1,747,379,297 $259,791,575
Unfunded Liability on Actuarial Value of Assets
$8,259,731,398 $255,473,161 $3,592,332,096 $1,262,612,750 $387,897,090
Funding Ratio on Actuarial Value of Assets
27.30% 66.06% 60.69% 58.05% 40.11%
Market Value of Assets $2,980,401,603 $478,103,794 $5,372,769,813 $1,677,940,479 $252,896,868
Unfunded Liability on Market Value of Assets
$8,380,646,533 $274,595,663 $3,766,797,882 $1,332,051,568 $394,791,797
Funding Ratio on Market Value of Assets
26.23% 63.52% 58.79% 55.75% 39.05%
Insurance Fund
Actuarial Liability $3,125,330,157 $384,592,406 $2,370,771,288 $1,364,843,057 $333,903,782
Actuarial Value of Assets $446,080,511 $345,573,948 $1,512,853,851 $829,040,842 $124,372,072
Unfunded Liability on Actuarial Value of Assets
$2,679,249,646 $39,018,458 $857,917,437 $535,802,215 $209,531,710
Funding Ratio on Actuarial Value of Assets
14.27% 89.85% 63.81% 60.74% 37.25%
Market Value of Assets $430,805,726 $333,298,119 $1,439,226,170 $788,070,813 $125,567,846
Unfunded Liability on Market Value of Assets
$2,694,524,431 $51,294,287 $931,545,118 $576,772,244 $208,335,936
Funding Ratio on Market Value of Assets
13.78% 86.66% 60.71% 57.74% 37.61%
Member Data
Number of Active Members 42,196 4,086 83,052 9,130 907
Total Annual Payroll (Active Members)1
$1,644,896,681 $131,976,754 $2,236,546,345 $464,228,923 $48,372,506
Average Annual Pay (Active Members)
$38,982 $32,300 $26,929 $50,847 $53,332
Number of Retired Members & Benefi ciaries
39,226 3,253 45,304 6,878 1,299
Average Annual Retirement Allowance
$21,539 $15,134 $11,368 $25,185 $38,404
Number of Vested Inactive Members
8,976 347 12,071 617 58
Number of Inactive Members Due a Refund
35,130 2,821 57,645 1,794 322
1Annual payroll included in the Summary of Actuarial Valuation Results is based upon the annualized monthly payroll for active members as of the valuation date. The annual payroll recorded in the fi nancial section is based upon the sum of the monthly payroll for active members recorded for each month of fi scal year ending June 30, 2012.
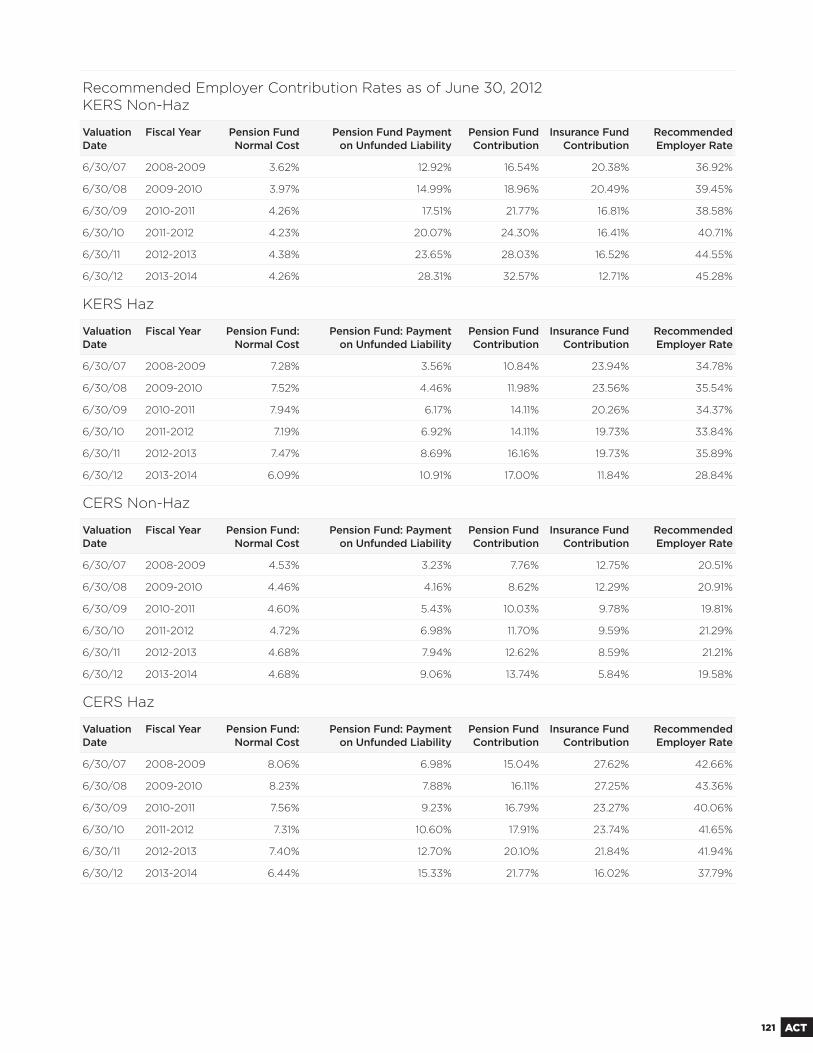
121 ACT
Recommended Employer Contribution Rates as of June 30, 2012KERS Non-Haz
Valuation Date
Fiscal Year Pension Fund Normal Cost
Pension Fund Paymenton Unfunded Liability
Pension Fund Contribution
Insurance Fund Contribution
Recommended Employer Rate
6/30/07 2008-2009 3.62% 12.92% 16.54% 20.38% 36.92%
6/30/08 2009-2010 3.97% 14.99% 18.96% 20.49% 39.45%
6/30/09 2010-2011 4.26% 17.51% 21.77% 16.81% 38.58%
6/30/10 2011-2012 4.23% 20.07% 24.30% 16.41% 40.71%
6/30/11 2012-2013 4.38% 23.65% 28.03% 16.52% 44.55%
6/30/12 2013-2014 4.26% 28.31% 32.57% 12.71% 45.28%
KERS Haz
Valuation Date
Fiscal Year Pension Fund: Normal Cost
Pension Fund: Paymenton Unfunded Liability
Pension Fund Contribution
Insurance Fund Contribution
Recommended Employer Rate
6/30/07 2008-2009 7.28% 3.56% 10.84% 23.94% 34.78%
6/30/08 2009-2010 7.52% 4.46% 11.98% 23.56% 35.54%
6/30/09 2010-2011 7.94% 6.17% 14.11% 20.26% 34.37%
6/30/10 2011-2012 7.19% 6.92% 14.11% 19.73% 33.84%
6/30/11 2012-2013 7.47% 8.69% 16.16% 19.73% 35.89%
6/30/12 2013-2014 6.09% 10.91% 17.00% 11.84% 28.84%
CERS Non-Haz
Valuation Date
Fiscal Year Pension Fund: Normal Cost
Pension Fund: Paymenton Unfunded Liability
Pension Fund Contribution
Insurance Fund Contribution
Recommended Employer Rate
6/30/07 2008-2009 4.53% 3.23% 7.76% 12.75% 20.51%
6/30/08 2009-2010 4.46% 4.16% 8.62% 12.29% 20.91%
6/30/09 2010-2011 4.60% 5.43% 10.03% 9.78% 19.81%
6/30/10 2011-2012 4.72% 6.98% 11.70% 9.59% 21.29%
6/30/11 2012-2013 4.68% 7.94% 12.62% 8.59% 21.21%
6/30/12 2013-2014 4.68% 9.06% 13.74% 5.84% 19.58%
CERS Haz
Valuation Date
Fiscal Year Pension Fund: Normal Cost
Pension Fund: Paymenton Unfunded Liability
Pension Fund Contribution
Insurance Fund Contribution
Recommended Employer Rate
6/30/07 2008-2009 8.06% 6.98% 15.04% 27.62% 42.66%
6/30/08 2009-2010 8.23% 7.88% 16.11% 27.25% 43.36%
6/30/09 2010-2011 7.56% 9.23% 16.79% 23.27% 40.06%
6/30/10 2011-2012 7.31% 10.60% 17.91% 23.74% 41.65%
6/30/11 2012-2013 7.40% 12.70% 20.10% 21.84% 41.94%
6/30/12 2013-2014 6.44% 15.33% 21.77% 16.02% 37.79%
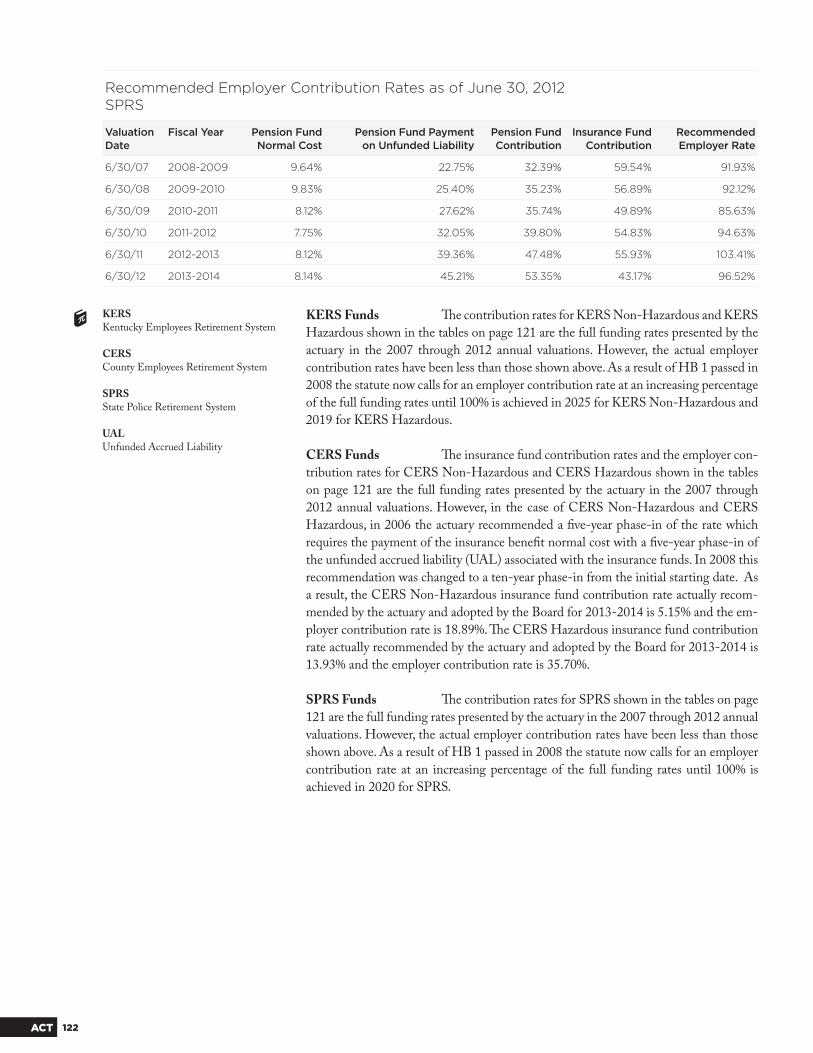
122ACT
KERS Funds Th e contribution rates for KERS Non-Hazardous and KERS
Hazardous shown in the tables on page 121 are the full funding rates presented by the
actuary in the 2007 through 2012 annual valuations. However, the actual employer
contribution rates have been less than those shown above. As a result of HB 1 passed in
2008 the statute now calls for an employer contribution rate at an increasing percentage
of the full funding rates until 100% is achieved in 2025 for KERS Non-Hazardous and
2019 for KERS Hazardous.
CERS Funds Th e insurance fund contribution rates and the employer con-
tribution rates for CERS Non-Hazardous and CERS Hazardous shown in the tables
on page 121 are the full funding rates presented by the actuary in the 2007 through
2012 annual valuations. However, in the case of CERS Non-Hazardous and CERS
Hazardous, in 2006 the actuary recommended a fi ve-year phase-in of the rate which
requires the payment of the insurance benefi t normal cost with a fi ve-year phase-in of
the unfunded accrued liability (UAL) associated with the insurance funds. In 2008 this
recommendation was changed to a ten-year phase-in from the initial starting date. As
a result, the CERS Non-Hazardous insurance fund contribution rate actually recom-
mended by the actuary and adopted by the Board for 2013-2014 is 5.15% and the em-
ployer contribution rate is 18.89%. Th e CERS Hazardous insurance fund contribution
rate actually recommended by the actuary and adopted by the Board for 2013-2014 is
13.93% and the employer contribution rate is 35.70%.
SPRS Funds Th e contribution rates for SPRS shown in the tables on page
121 are the full funding rates presented by the actuary in the 2007 through 2012 annual
valuations. However, the actual employer contribution rates have been less than those
shown above. As a result of HB 1 passed in 2008 the statute now calls for an employer
contribution rate at an increasing percentage of the full funding rates until 100% is
achieved in 2020 for SPRS.
KERSKentucky Employees Retirement System
CERSCounty Employees Retirement System
SPRSState Police Retirement System
UALUnfunded Accrued Liability
Recommended Employer Contribution Rates as of June 30, 2012SPRS
Valuation Date
Fiscal Year Pension Fund Normal Cost
Pension Fund Paymenton Unfunded Liability
Pension Fund Contribution
Insurance Fund Contribution
Recommended Employer Rate
6/30/07 2008-2009 9.64% 22.75% 32.39% 59.54% 91.93%
6/30/08 2009-2010 9.83% 25.40% 35.23% 56.89% 92.12%
6/30/09 2010-2011 8.12% 27.62% 35.74% 49.89% 85.63%
6/30/10 2011-2012 7.75% 32.05% 39.80% 54.83% 94.63%
6/30/11 2012-2013 8.12% 39.36% 47.48% 55.93% 103.41%
6/30/12 2013-2014 8.14% 45.21% 53.35% 43.17% 96.52%
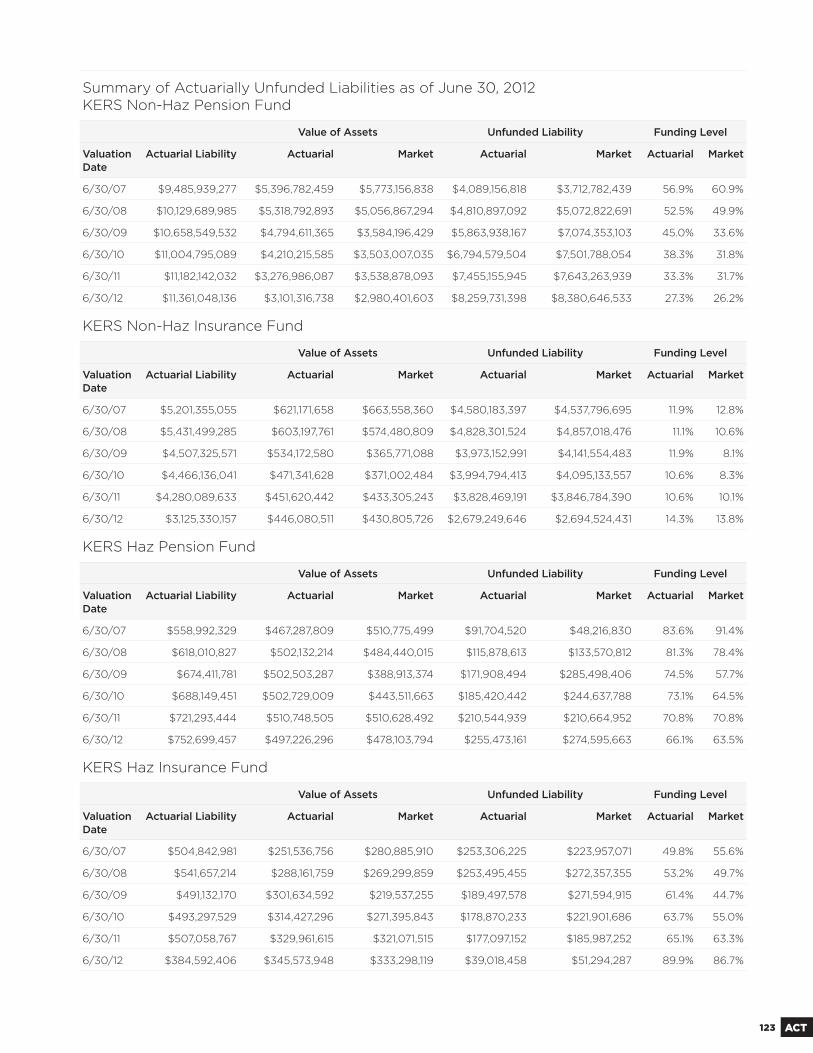
123 ACT
Summary of Actuarially Unfunded Liabilities as of June 30, 2012KERS Non-Haz Pension Fund
Value of Assets Unfunded Liability Funding Level
Valuation Date
Actuarial Liability Actuarial Market Actuarial Market Actuarial Market
6/30/07 $9,485,939,277 $5,396,782,459 $5,773,156,838 $4,089,156,818 $3,712,782,439 56.9% 60.9%
6/30/08 $10,129,689,985 $5,318,792,893 $5,056,867,294 $4,810,897,092 $5,072,822,691 52.5% 49.9%
6/30/09 $10,658,549,532 $4,794,611,365 $3,584,196,429 $5,863,938,167 $7,074,353,103 45.0% 33.6%
6/30/10 $11,004,795,089 $4,210,215,585 $3,503,007,035 $6,794,579,504 $7,501,788,054 38.3% 31.8%
6/30/11 $11,182,142,032 $3,276,986,087 $3,538,878,093 $7,455,155,945 $7,643,263,939 33.3% 31.7%
6/30/12 $11,361,048,136 $3,101,316,738 $2,980,401,603 $8,259,731,398 $8,380,646,533 27.3% 26.2%
KERS Non-Haz Insurance Fund
Value of Assets Unfunded Liability Funding Level
Valuation Date
Actuarial Liability Actuarial Market Actuarial Market Actuarial Market
6/30/07 $5,201,355,055 $621,171,658 $663,558,360 $4,580,183,397 $4,537,796,695 11.9% 12.8%
6/30/08 $5,431,499,285 $603,197,761 $574,480,809 $4,828,301,524 $4,857,018,476 11.1% 10.6%
6/30/09 $4,507,325,571 $534,172,580 $365,771,088 $3,973,152,991 $4,141,554,483 11.9% 8.1%
6/30/10 $4,466,136,041 $471,341,628 $371,002,484 $3,994,794,413 $4,095,133,557 10.6% 8.3%
6/30/11 $4,280,089,633 $451,620,442 $433,305,243 $3,828,469,191 $3,846,784,390 10.6% 10.1%
6/30/12 $3,125,330,157 $446,080,511 $430,805,726 $2,679,249,646 $2,694,524,431 14.3% 13.8%
KERS Haz Pension Fund
Value of Assets Unfunded Liability Funding Level
Valuation Date
Actuarial Liability Actuarial Market Actuarial Market Actuarial Market
6/30/07 $558,992,329 $467,287,809 $510,775,499 $91,704,520 $48,216,830 83.6% 91.4%
6/30/08 $618,010,827 $502,132,214 $484,440,015 $115,878,613 $133,570,812 81.3% 78.4%
6/30/09 $674,411,781 $502,503,287 $388,913,374 $171,908,494 $285,498,406 74.5% 57.7%
6/30/10 $688,149,451 $502,729,009 $443,511,663 $185,420,442 $244,637,788 73.1% 64.5%
6/30/11 $721,293,444 $510,748,505 $510,628,492 $210,544,939 $210,664,952 70.8% 70.8%
6/30/12 $752,699,457 $497,226,296 $478,103,794 $255,473,161 $274,595,663 66.1% 63.5%
KERS Haz Insurance Fund
Value of Assets Unfunded Liability Funding Level
Valuation Date
Actuarial Liability Actuarial Market Actuarial Market Actuarial Market
6/30/07 $504,842,981 $251,536,756 $280,885,910 $253,306,225 $223,957,071 49.8% 55.6%
6/30/08 $541,657,214 $288,161,759 $269,299,859 $253,495,455 $272,357,355 53.2% 49.7%
6/30/09 $491,132,170 $301,634,592 $219,537,255 $189,497,578 $271,594,915 61.4% 44.7%
6/30/10 $493,297,529 $314,427,296 $271,395,843 $178,870,233 $221,901,686 63.7% 55.0%
6/30/11 $507,058,767 $329,961,615 $321,071,515 $177,097,152 $185,987,252 65.1% 63.3%
6/30/12 $384,592,406 $345,573,948 $333,298,119 $39,018,458 $51,294,287 89.9% 86.7%

124ACT
Continued. Summary of Actuarially Unfunded Liabilities as of June 30, 2012CERS Non-Haz Pension Fund
Value of Assets Unfunded Liability Funding Level
Valuation Date
Actuarial Liability Actuarial Market Actuarial Market Actuarial Market
6/30/07 $6,659,446,126 $5,467,824,480 $5,812,935,251 $1,191,621,646 $846,510,875 82.1% 87.3%
6/30/08 $7,304,217,691 $5,731,502,438 $5,431,735,605 $1,572,715,253 $1,872,482,086 78.5% 74.4%
6/30/09 $7,912,913,512 $5,650,789,991 $4,330,593,934 $2,262,123,521 $3,582,319,578 71.4% 54.7%
6/30/10 $8,459,022,280 $5,546,857,291 $4,819,933,717 $2,912,164,989 $3,639,088,563 65.6% 57.0%
6/30/11 $8,918,085,025 $5,629,611,183 $5,577,252,295 $3,288,473,842 $3,340,832,730 63.1% 62.5%
6/30/12 $9,139,567,695 $5,547,235,599 $5,372,769,813 $3,592,332,096 $3,766,797,882 60.7% 58.8%
CERS Non-Haz Insurance Fund
Value of Assets Unfunded Liability Funding Level
Valuation Date
Actuarial Liability Actuarial Market Actuarial Market Actuarial Market
6/30/07 $3,333,966,070 $960,285,900 $1,084,042,781 $2,373,680,170 $2,249,923,289 28.8% 32.5%
6/30/08 $3,583,193,466 $1,168,883,170 $1,105,944,178 $2,414,310,296 $2,477,249,288 32.6% 30.9%
6/30/09 $3,070,386,018 $1,216,631,769 $894,905,841 $1,853,754,249 $2,175,480,177 39.6% 29.2%
6/30/10 $3,158,340,174 $1,293,038,593 $1,096,581,872 $1,865,301,581 $2,061,758,302 40.9% 34.7%
6/30/11 $3,073,973,205 $1,433,450,793 $1,451,984,026 $1,640,522,412 $1,621,989,179 46.6% 47.2%
6/30/12 $2,370,771,288 $1,512,853,851 $1,439,226,170 $857,917,437 $931,545,118 63.8% 60.7%
CERS Haz Pension Fund
Value of Assets Unfunded Liability Funding Level
Valuation Date
Actuarial Liability Actuarial Market Actuarial Market Actuarial Market
6/30/07 $2,208,736,179 $1,639,288,924 $1,754,934,764 $569,447,255 $453,801,415 74.2% 79.5%
6/30/08 $2,403,122,095 $1,750,867,373 $1,644,983,243 $652,254,722 $758,138,852 72.9% 68.5%
6/30/09 $2,578,444,600 $1,751,487,540 $1,320,522,868 $826,957,060 $1,257,921,732 67.9% 51.2%
6/30/10 $2,672,151,907 $1,749,464,388 $1,506,787,429 $922,687,519 $1,165,364,478 65.5% 56.4%
6/30/11 $2,859,041,052 $1,779,545,393 $1,760,602,934 $1,079,495,659 $1,098,438,118 62.2% 61.6%
6/30/12 $3,009,992,047 $1,747,379,297 $1,677,940,479 $1,262,612,750 $1,332,051,568 58.1% 55.8%
CERS Haz Insurance Fund
Value of Assets Unfunded Liability Funding Level
Valuation Date
Actuarial Liability Actuarial Market Actuarial Market Actuarial Market
6/30/07 $1,646,460,011 $512,926,549 $570,155,702 $1,133,533,462 $1,076,304,309 31.2% 34.6%
6/30/08 $1,769,782,957 $613,526,319 $576,414,457 $1,156,256,638 $1,193,368,500 34.7% 32.6%
6/30/09 $1,593,548,263 $651,130,782 $483,269,862 $942,417,481 $1,110,278,401 40.9% 30.3%
6/30/10 $1,674,703,216 $692,769,770 $586,826,965 $981,933,446 $1,087,876,251 41.4% 35.0%
6/30/11 $1,647,702,755 $770,790,274 $774,509,101 $876,912,481 $873,193,654 46.8% 47.0%
6/30/12 $1,364,843,057 $829,040,842 $788,070,813 $535,802,215 $576,772,244 60.7% 57.7%

125 ACT
Continued. Summary of Actuarially Unfunded Liabilities as of June 30, 2012SPRS Pension Fund
Value of Assets Unfunded Liability Funding Level
Valuation Date
Actuarial Liability
Actuarial Market Actuarial Market Actuarial Market
6/30/07 $547,955,286 $348,806,508 $376,381,488 $199,148,778 $171,573,798 63.7% 68.7%
6/30/08 $587,129,257 $350,891,451 $337,358,918 $236,237,806 $249,770,339 59.8% 57.5%
6/30/09 $602,328,868 $329,966,989 $256,571,073 $272,361,879 $345,757,795 54.8% 42.6%
6/30/10 $612,444,806 $304,577,292 $264,944,089 $307,867,514 $347,500,717 49.7% 43.3%
6/30/11 $634,379,401 $285,580,631 $279,934,443 $348,798,770 $354,444,958 45.0% 44.1%
6/30/12 $647,688,665 $259,791,575 $252,896,868 $387,897,090 $394,791,797 40.1% 39.1%
SPRS Insurance Fund
Value of Assets Unfunded Liability Funding Level
Valuation Date
Actuarial Liability
Actuarial Market Actuarial Market Actuarial Market
6/30/07 $432,763,229 $115,215,912 $132,573,898 $317,547,317 $300,189,331 26.6% 30.6%
6/30/08 $445,107,468 $123,961,197 $121,781,967 $321,146,271 $323,325,501 27.9% 27.4%
6/30/09 $364,031,141 $123,526,647 $93,686,940 $240,504,494 $270,344,201 33.9% 25.7%
6/30/10 $434,960,495 $121,175,083 $104,526,550 $313,785,412 $330,433,945 27.9% 24.0%
6/30/11 $438,427,763 $123,687,289 $127,367,947 $314,740,474 $311,059,816 28.2% 29.1%
6/30/12 $333,903,782 $124,372,072 $125,567,846 $209,531,710 $208,3335,936 37.3% 37.6%
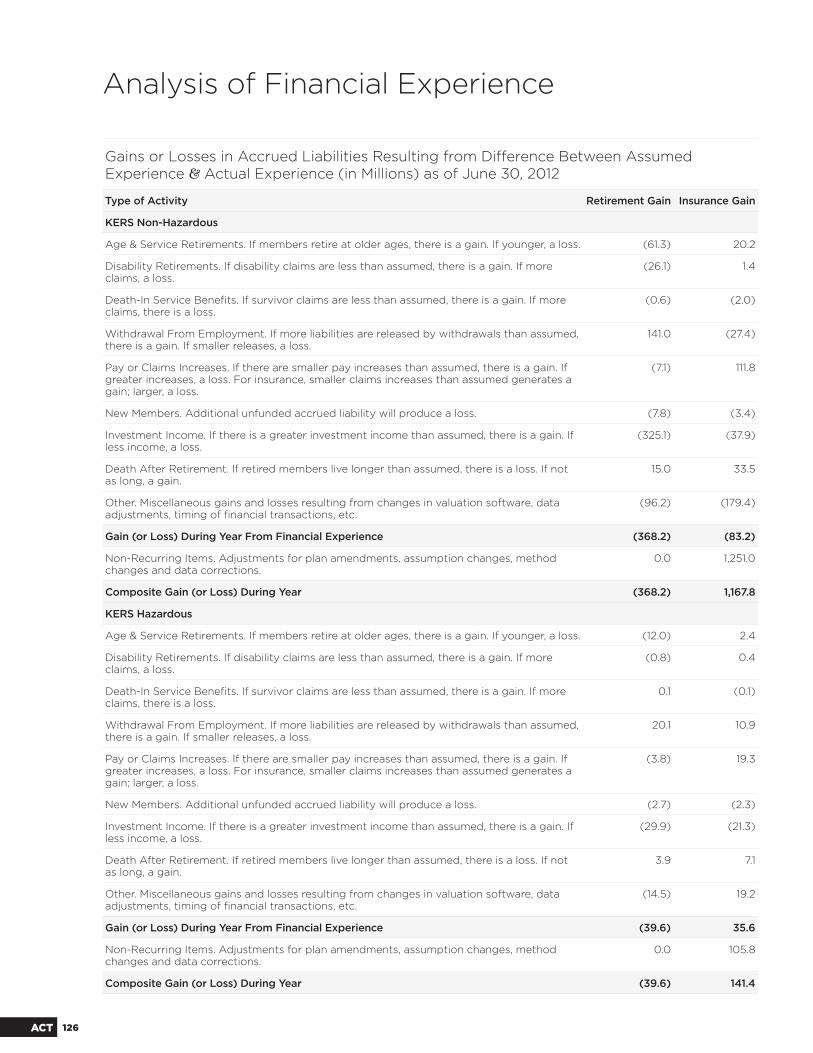
126ACT
Gains or Losses in Accrued Liabilities Resulting from Diff erence Between Assumed Experience & Actual Experience (in Millions) as of June 30, 2012
Type of Activity Retirement Gain Insurance Gain
KERS Non-Hazardous
Age & Service Retirements. If members retire at older ages, there is a gain. If younger, a loss. (61.3) 20.2
Disability Retirements. If disability claims are less than assumed, there is a gain. If more claims, a loss.
(26.1) 1.4
Death-In Service Benefi ts. If survivor claims are less than assumed, there is a gain. If more claims, there is a loss.
(0.6) (2.0)
Withdrawal From Employment. If more liabilities are released by withdrawals than assumed, there is a gain. If smaller releases, a loss.
141.0 (27.4)
Pay or Claims Increases. If there are smaller pay increases than assumed, there is a gain. If greater increases, a loss. For insurance, smaller claims increases than assumed generates a gain; larger, a loss.
(7.1) 111.8
New Members. Additional unfunded accrued liability will produce a loss. (7.8) (3.4)
Investment Income. If there is a greater investment income than assumed, there is a gain. If less income, a loss.
(325.1) (37.9)
Death After Retirement. If retired members live longer than assumed, there is a loss. If not as long, a gain.
15.0 33.5
Other. Miscellaneous gains and losses resulting from changes in valuation software, data adjustments, timing of fi nancial transactions, etc.
(96.2) (179.4)
Gain (or Loss) During Year From Financial Experience (368.2) (83.2)
Non-Recurring Items. Adjustments for plan amendments, assumption changes, method changes and data corrections.
0.0 1,251.0
Composite Gain (or Loss) During Year (368.2) 1,167.8
KERS Hazardous
Age & Service Retirements. If members retire at older ages, there is a gain. If younger, a loss. (12.0) 2.4
Disability Retirements. If disability claims are less than assumed, there is a gain. If more claims, a loss.
(0.8) 0.4
Death-In Service Benefi ts. If survivor claims are less than assumed, there is a gain. If more claims, there is a loss.
0.1 (0.1)
Withdrawal From Employment. If more liabilities are released by withdrawals than assumed, there is a gain. If smaller releases, a loss.
20.1 10.9
Pay or Claims Increases. If there are smaller pay increases than assumed, there is a gain. If greater increases, a loss. For insurance, smaller claims increases than assumed generates a gain; larger, a loss.
(3.8) 19.3
New Members. Additional unfunded accrued liability will produce a loss. (2.7) (2.3)
Investment Income. If there is a greater investment income than assumed, there is a gain. If less income, a loss.
(29.9) (21.3)
Death After Retirement. If retired members live longer than assumed, there is a loss. If not as long, a gain.
3.9 7.1
Other. Miscellaneous gains and losses resulting from changes in valuation software, data adjustments, timing of fi nancial transactions, etc.
(14.5) 19.2
Gain (or Loss) During Year From Financial Experience (39.6) 35.6
Non-Recurring Items. Adjustments for plan amendments, assumption changes, method changes and data corrections.
0.0 105.8
Composite Gain (or Loss) During Year (39.6) 141.4
Analysis of Financial Experience
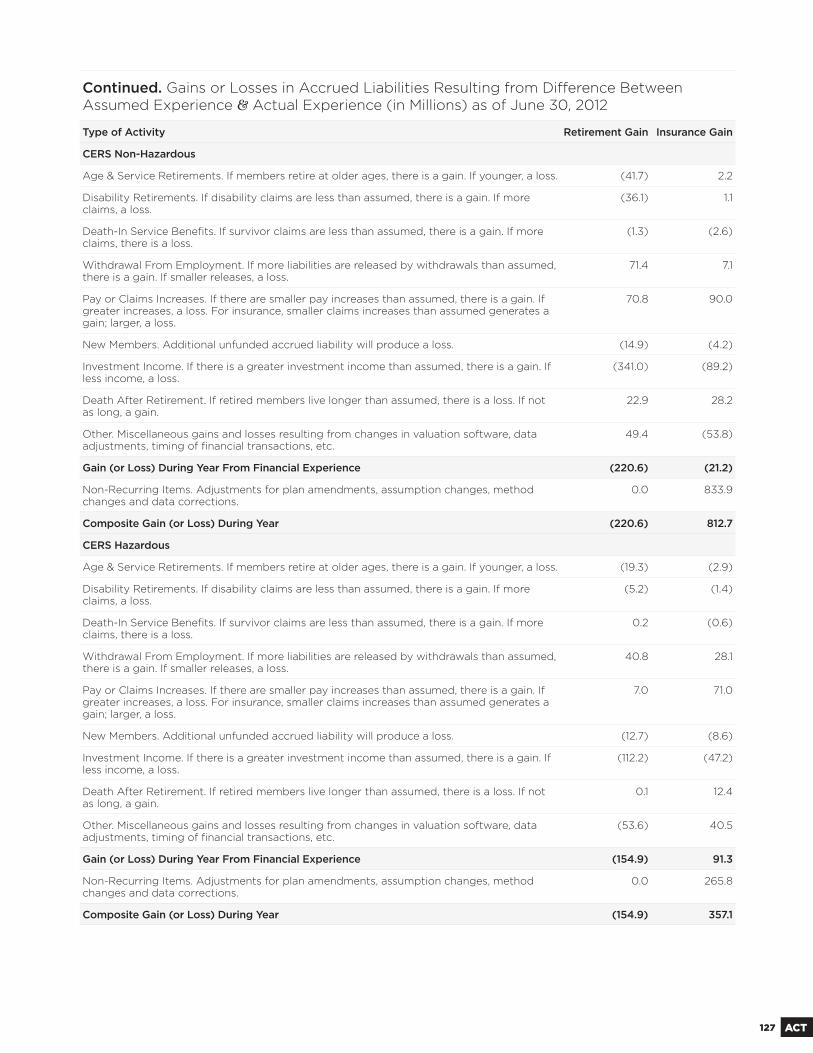
127 ACT
Continued. Gains or Losses in Accrued Liabilities Resulting from Diff erence Between Assumed Experience & Actual Experience (in Millions) as of June 30, 2012
Type of Activity Retirement Gain Insurance Gain
CERS Non-Hazardous
Age & Service Retirements. If members retire at older ages, there is a gain. If younger, a loss. (41.7) 2.2
Disability Retirements. If disability claims are less than assumed, there is a gain. If more claims, a loss.
(36.1) 1.1
Death-In Service Benefi ts. If survivor claims are less than assumed, there is a gain. If more claims, there is a loss.
(1.3) (2.6)
Withdrawal From Employment. If more liabilities are released by withdrawals than assumed, there is a gain. If smaller releases, a loss.
71.4 7.1
Pay or Claims Increases. If there are smaller pay increases than assumed, there is a gain. If greater increases, a loss. For insurance, smaller claims increases than assumed generates a gain; larger, a loss.
70.8 90.0
New Members. Additional unfunded accrued liability will produce a loss. (14.9) (4.2)
Investment Income. If there is a greater investment income than assumed, there is a gain. If less income, a loss.
(341.0) (89.2)
Death After Retirement. If retired members live longer than assumed, there is a loss. If not as long, a gain.
22.9 28.2
Other. Miscellaneous gains and losses resulting from changes in valuation software, data adjustments, timing of fi nancial transactions, etc.
49.4 (53.8)
Gain (or Loss) During Year From Financial Experience (220.6) (21.2)
Non-Recurring Items. Adjustments for plan amendments, assumption changes, method changes and data corrections.
0.0 833.9
Composite Gain (or Loss) During Year (220.6) 812.7
CERS Hazardous
Age & Service Retirements. If members retire at older ages, there is a gain. If younger, a loss. (19.3) (2.9)
Disability Retirements. If disability claims are less than assumed, there is a gain. If more claims, a loss.
(5.2) (1.4)
Death-In Service Benefi ts. If survivor claims are less than assumed, there is a gain. If more claims, there is a loss.
0.2 (0.6)
Withdrawal From Employment. If more liabilities are released by withdrawals than assumed, there is a gain. If smaller releases, a loss.
40.8 28.1
Pay or Claims Increases. If there are smaller pay increases than assumed, there is a gain. If greater increases, a loss. For insurance, smaller claims increases than assumed generates a gain; larger, a loss.
7.0 71.0
New Members. Additional unfunded accrued liability will produce a loss. (12.7) (8.6)
Investment Income. If there is a greater investment income than assumed, there is a gain. If less income, a loss.
(112.2) (47.2)
Death After Retirement. If retired members live longer than assumed, there is a loss. If not as long, a gain.
0.1 12.4
Other. Miscellaneous gains and losses resulting from changes in valuation software, data adjustments, timing of fi nancial transactions, etc.
(53.6) 40.5
Gain (or Loss) During Year From Financial Experience (154.9) 91.3
Non-Recurring Items. Adjustments for plan amendments, assumption changes, method changes and data corrections.
0.0 265.8
Composite Gain (or Loss) During Year (154.9) 357.1

128ACT
Continued. Gains or Losses in Accrued Liabilities Resulting from Diff erence Between Assumed Experience & Actual Experience (in Millions) as of June 30, 2012
Type of Activity Retirement Gain Insurance Gain
SPRS
Age & Service Retirements. If members retire at older ages, there is a gain. If younger, a loss. 2.9 8.0
Disability Retirements. If disability claims are less than assumed, there is a gain. If more claims, a loss.
(0.3) (0.6)
Death-In Service Benefi ts. If survivor claims are less than assumed, there is a gain. If more claims, there is a loss.
0.0 0.0
Withdrawal From Employment. If more liabilities are released by withdrawals than assumed, there is a gain. If smaller releases, a loss.
1.9 4.2
Pay or Claims Increases. If there are smaller pay increases than assumed, there is a gain. If greater increases, a loss. For insurance, smaller claims increases than assumed generates a gain; larger, a loss.
(1.8) 14.2
New Members. Additional unfunded accrued liability will produce a loss. 0.0 0.0
Investment Income. If there is a greater investment income than assumed, there is a gain. If less income, a loss.
(19.1) (6.4)
Death After Retirement. If retired members live longer than assumed, there is a loss. If not as long, a gain.
0.5 2.4
Other. Miscellaneous gains and losses resulting from changes in valuation software, data adjustments, timing of fi nancial transactions, etc.
(7.9) (17.8)
Gain (or Loss) During Year From Financial Experience (23.8) 4.0
Non-Recurring Items. Adjustments for plan amendments, assumption changes, method changes and data corrections.
0.0 102.7
Composite Gain (or Loss) During Year (23.8) 106.7
SOLVENCY
Solvency Test for KERS Non-Hazardous Pension Fund as of June 30, 2012
Actuarial Liabilities Liabilities Covered by Actuarial Assets
ValuationDate
(1) Active Member Contributions
(2) Retirees & Benefi ciaries
(3) Active Members Employer Portion
Actuarial Valueof Assets
(1) (2) (3)
6/30/07 $878,842,180 $6,437,235,593 $2,169,861,504 $5,396,782,459 100.0% 70.2% -
6/30/08 $875,178,068 $7,162,496,700 $2,092,015,217 $5,318,792,893 100.0% 62.0% -
6/30/09 $793,574,765 $8,205,155,691 $1,659,819,076 $4,794,611,365 100.0% 48.8% -
6/30/10 $869,484,042 $8,329,757,802 $1,805,553,245 $4,210,215,585 100.0% 40.1% -
6/30/11 $916,568,932 $8,482,714,356 $1,782,858,744 $3,726,986,087 100.0% 33.1% -
6/30/12 $885,1387,183 $8,708,536,338 $1,767,374,615 $3,101,316,738 100.0% 25.4% --
Solvency Test
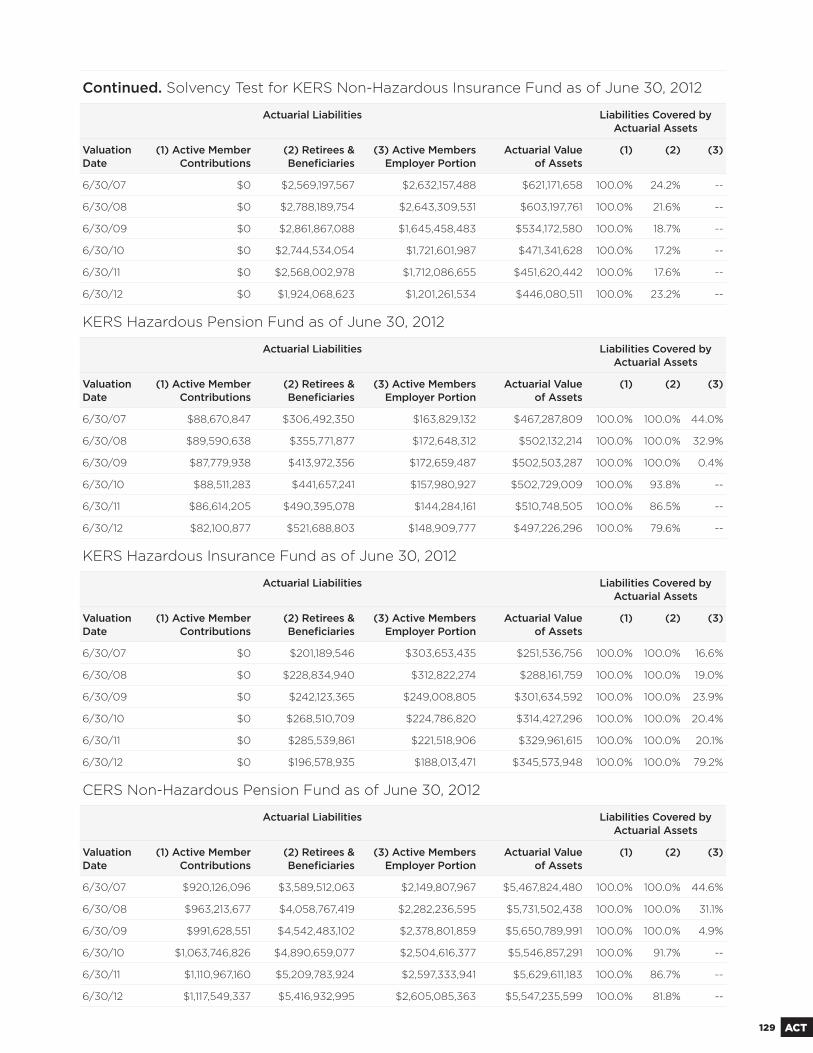
129 ACT
Continued. Solvency Test for KERS Non-Hazardous Insurance Fund as of June 30, 2012
Actuarial Liabilities Liabilities Covered by Actuarial Assets
ValuationDate
(1) Active Member Contributions
(2) Retirees & Benefi ciaries
(3) Active Members Employer Portion
Actuarial Valueof Assets
(1) (2) (3)
6/30/07 $0 $2,569,197,567 $2,632,157,488 $621,171,658 100.0% 24.2% --
6/30/08 $0 $2,788,189,754 $2,643,309,531 $603,197,761 100.0% 21.6% --
6/30/09 $0 $2,861,867,088 $1,645,458,483 $534,172,580 100.0% 18.7% --
6/30/10 $0 $2,744,534,054 $1,721,601,987 $471,341,628 100.0% 17.2% --
6/30/11 $0 $2,568,002,978 $1,712,086,655 $451,620,442 100.0% 17.6% --
6/30/12 $0 $1,924,068,623 $1,201,261,534 $446,080,511 100.0% 23.2% --
KERS Hazardous Pension Fund as of June 30, 2012
Actuarial Liabilities Liabilities Covered by Actuarial Assets
ValuationDate
(1) Active Member Contributions
(2) Retirees & Benefi ciaries
(3) Active Members Employer Portion
Actuarial Valueof Assets
(1) (2) (3)
6/30/07 $88,670,847 $306,492,350 $163,829,132 $467,287,809 100.0% 100.0% 44.0%
6/30/08 $89,590,638 $355,771,877 $172,648,312 $502,132,214 100.0% 100.0% 32.9%
6/30/09 $87,779,938 $413,972,356 $172,659,487 $502,503,287 100.0% 100.0% 0.4%
6/30/10 $88,511,283 $441,657,241 $157,980,927 $502,729,009 100.0% 93.8% --
6/30/11 $86,614,205 $490,395,078 $144,284,161 $510,748,505 100.0% 86.5% --
6/30/12 $82,100,877 $521,688,803 $148,909,777 $497,226,296 100.0% 79.6% --
KERS Hazardous Insurance Fund as of June 30, 2012
Actuarial Liabilities Liabilities Covered by Actuarial Assets
ValuationDate
(1) Active Member Contributions
(2) Retirees & Benefi ciaries
(3) Active Members Employer Portion
Actuarial Valueof Assets
(1) (2) (3)
6/30/07 $0 $201,189,546 $303,653,435 $251,536,756 100.0% 100.0% 16.6%
6/30/08 $0 $228,834,940 $312,822,274 $288,161,759 100.0% 100.0% 19.0%
6/30/09 $0 $242,123,365 $249,008,805 $301,634,592 100.0% 100.0% 23.9%
6/30/10 $0 $268,510,709 $224,786,820 $314,427,296 100.0% 100.0% 20.4%
6/30/11 $0 $285,539,861 $221,518,906 $329,961,615 100.0% 100.0% 20.1%
6/30/12 $0 $196,578,935 $188,013,471 $345,573,948 100.0% 100.0% 79.2%
CERS Non-Hazardous Pension Fund as of June 30, 2012
Actuarial Liabilities Liabilities Covered by Actuarial Assets
ValuationDate
(1) Active Member Contributions
(2) Retirees & Benefi ciaries
(3) Active Members Employer Portion
Actuarial Valueof Assets
(1) (2) (3)
6/30/07 $920,126,096 $3,589,512,063 $2,149,807,967 $5,467,824,480 100.0% 100.0% 44.6%
6/30/08 $963,213,677 $4,058,767,419 $2,282,236,595 $5,731,502,438 100.0% 100.0% 31.1%
6/30/09 $991,628,551 $4,542,483,102 $2,378,801,859 $5,650,789,991 100.0% 100.0% 4.9%
6/30/10 $1,063,746,826 $4,890,659,077 $2,504,616,377 $5,546,857,291 100.0% 91.7% --
6/30/11 $1,110,967,160 $5,209,783,924 $2,597,333,941 $5,629,611,183 100.0% 86.7% --
6/30/12 $1,117,549,337 $5,416,932,995 $2,605,085,363 $5,547,235,599 100.0% 81.8% --
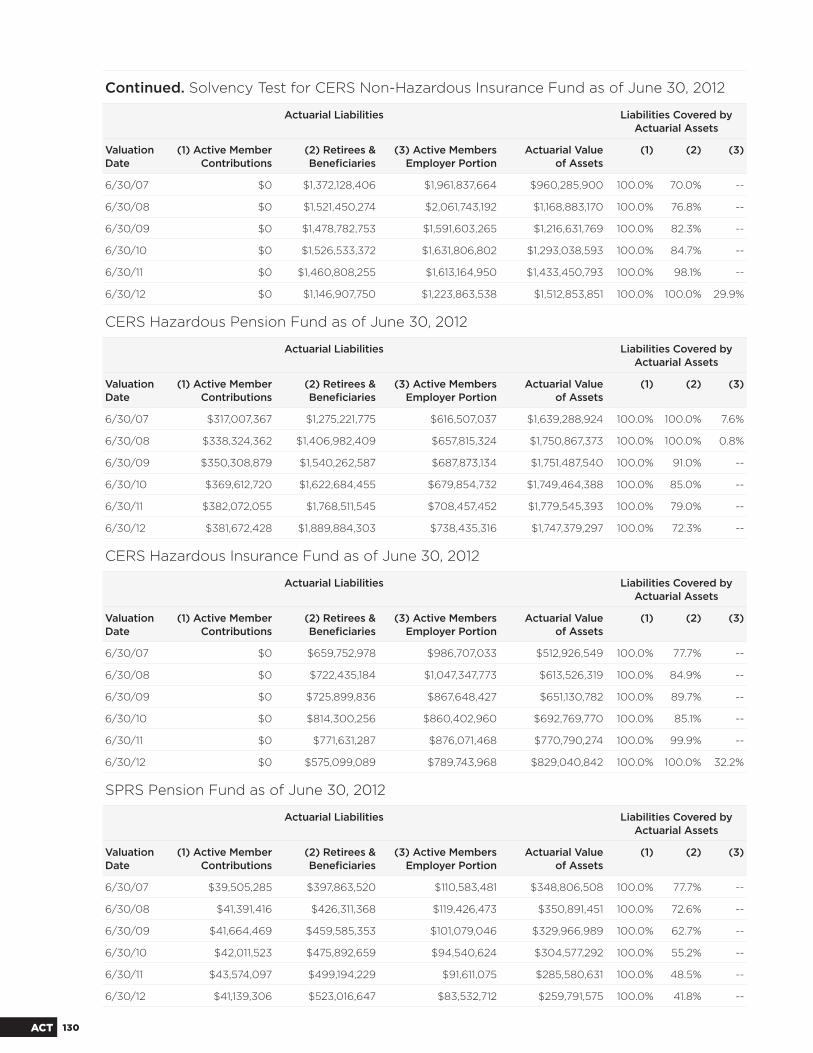
130ACT
Continued. Solvency Test for CERS Non-Hazardous Insurance Fund as of June 30, 2012
Actuarial Liabilities Liabilities Covered by Actuarial Assets
ValuationDate
(1) Active Member Contributions
(2) Retirees & Benefi ciaries
(3) Active Members Employer Portion
Actuarial Valueof Assets
(1) (2) (3)
6/30/07 $0 $1,372,128,406 $1,961,837,664 $960,285,900 100.0% 70.0% --
6/30/08 $0 $1,521,450,274 $2,061,743,192 $1,168,883,170 100.0% 76.8% --
6/30/09 $0 $1,478,782,753 $1,591,603,265 $1,216,631,769 100.0% 82.3% --
6/30/10 $0 $1,526,533,372 $1,631,806,802 $1,293,038,593 100.0% 84.7% --
6/30/11 $0 $1,460,808,255 $1,613,164,950 $1,433,450,793 100.0% 98.1% --
6/30/12 $0 $1,146,907,750 $1,223,863,538 $1,512,853,851 100.0% 100.0% 29.9%
CERS Hazardous Pension Fund as of June 30, 2012
Actuarial Liabilities Liabilities Covered by Actuarial Assets
ValuationDate
(1) Active Member Contributions
(2) Retirees & Benefi ciaries
(3) Active Members Employer Portion
Actuarial Valueof Assets
(1) (2) (3)
6/30/07 $317,007,367 $1,275,221,775 $616,507,037 $1,639,288,924 100.0% 100.0% 7.6%
6/30/08 $338,324,362 $1,406,982,409 $657,815,324 $1,750,867,373 100.0% 100.0% 0.8%
6/30/09 $350,308,879 $1,540,262,587 $687,873,134 $1,751,487,540 100.0% 91.0% --
6/30/10 $369,612,720 $1,622,684,455 $679,854,732 $1,749,464,388 100.0% 85.0% --
6/30/11 $382,072,055 $1,768,511,545 $708,457,452 $1,779,545,393 100.0% 79.0% --
6/30/12 $381,672,428 $1,889,884,303 $738,435,316 $1,747,379,297 100.0% 72.3% --
CERS Hazardous Insurance Fund as of June 30, 2012
Actuarial Liabilities Liabilities Covered by Actuarial Assets
ValuationDate
(1) Active Member Contributions
(2) Retirees & Benefi ciaries
(3) Active Members Employer Portion
Actuarial Valueof Assets
(1) (2) (3)
6/30/07 $0 $659,752,978 $986,707,033 $512,926,549 100.0% 77.7% --
6/30/08 $0 $722,435,184 $1,047,347,773 $613,526,319 100.0% 84.9% --
6/30/09 $0 $725,899,836 $867,648,427 $651,130,782 100.0% 89.7% --
6/30/10 $0 $814,300,256 $860,402,960 $692,769,770 100.0% 85.1% --
6/30/11 $0 $771,631,287 $876,071,468 $770,790,274 100.0% 99.9% --
6/30/12 $0 $575,099,089 $789,743,968 $829,040,842 100.0% 100.0% 32.2%
SPRS Pension Fund as of June 30, 2012
Actuarial Liabilities Liabilities Covered by Actuarial Assets
ValuationDate
(1) Active Member Contributions
(2) Retirees & Benefi ciaries
(3) Active Members Employer Portion
Actuarial Valueof Assets
(1) (2) (3)
6/30/07 $39,505,285 $397,863,520 $110,583,481 $348,806,508 100.0% 77.7% --
6/30/08 $41,391,416 $426,311,368 $119,426,473 $350,891,451 100.0% 72.6% --
6/30/09 $41,664,469 $459,585,353 $101,079,046 $329,966,989 100.0% 62.7% --
6/30/10 $42,011,523 $475,892,659 $94,540,624 $304,577,292 100.0% 55.2% --
6/30/11 $43,574,097 $499,194,229 $91,611,075 $285,580,631 100.0% 48.5% --
6/30/12 $41,139,306 $523,016,647 $83,532,712 $259,791,575 100.0% 41.8% --
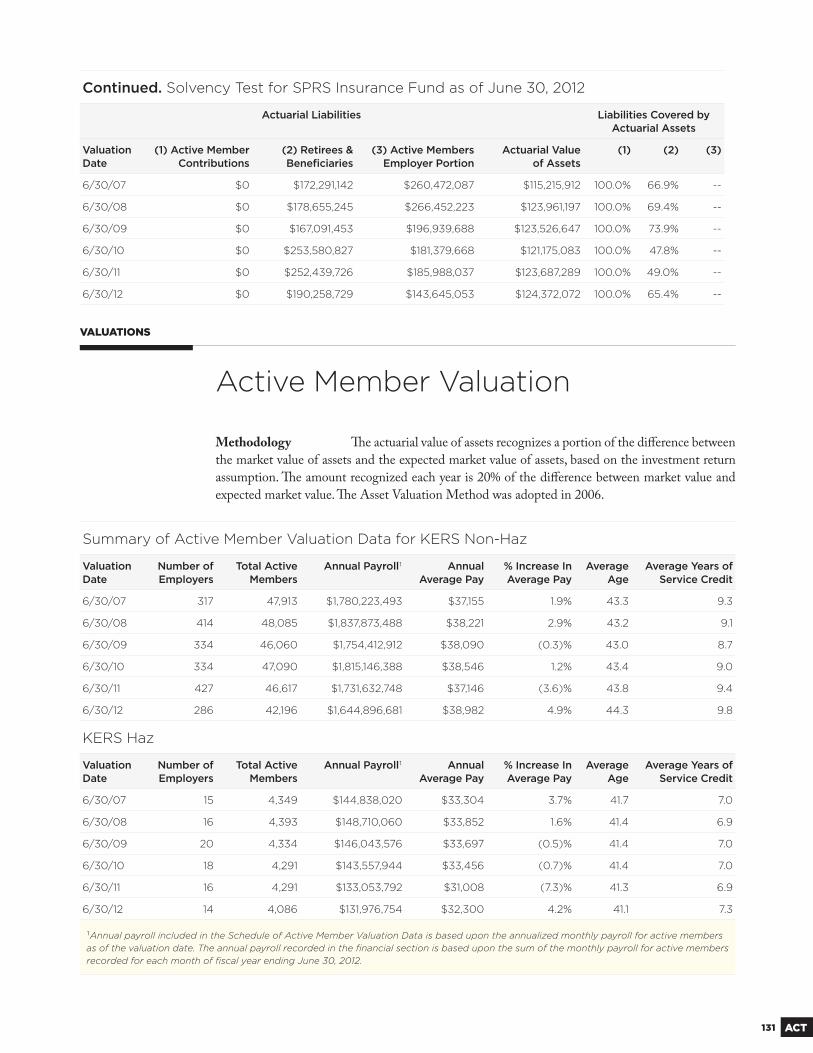
131 ACT
Continued. Solvency Test for SPRS Insurance Fund as of June 30, 2012
Actuarial Liabilities Liabilities Covered by Actuarial Assets
ValuationDate
(1) Active Member Contributions
(2) Retirees & Benefi ciaries
(3) Active Members Employer Portion
Actuarial Valueof Assets
(1) (2) (3)
6/30/07 $0 $172,291,142 $260,472,087 $115,215,912 100.0% 66.9% --
6/30/08 $0 $178,655,245 $266,452,223 $123,961,197 100.0% 69.4% --
6/30/09 $0 $167,091,453 $196,939,688 $123,526,647 100.0% 73.9% --
6/30/10 $0 $253,580,827 $181,379,668 $121,175,083 100.0% 47.8% --
6/30/11 $0 $252,439,726 $185,988,037 $123,687,289 100.0% 49.0% --
6/30/12 $0 $190,258,729 $143,645,053 $124,372,072 100.0% 65.4% --
VALUATIONS
Active Member Valuation
Summary of Active Member Valuation Data for KERS Non-Haz
Valuation Date
Number of Employers
Total Active Members
Annual Payroll1 Annual Average Pay
% Increase In Average Pay
Average Age
Average Years of Service Credit
6/30/07 317 47,913 $1,780,223,493 $37,155 1.9% 43.3 9.3
6/30/08 414 48,085 $1,837,873,488 $38,221 2.9% 43.2 9.1
6/30/09 334 46,060 $1,754,412,912 $38,090 (0.3)% 43.0 8.7
6/30/10 334 47,090 $1,815,146,388 $38,546 1.2% 43.4 9.0
6/30/11 427 46,617 $1,731,632,748 $37,146 (3.6)% 43.8 9.4
6/30/12 286 42,196 $1,644,896,681 $38,982 4.9% 44.3 9.8
KERS Haz
Valuation Date
Number of Employers
Total Active Members
Annual Payroll1 Annual Average Pay
% Increase In Average Pay
Average Age
Average Years of Service Credit
6/30/07 15 4,349 $144,838,020 $33,304 3.7% 41.7 7.0
6/30/08 16 4,393 $148,710,060 $33,852 1.6% 41.4 6.9
6/30/09 20 4,334 $146,043,576 $33,697 (0.5)% 41.4 7.0
6/30/10 18 4,291 $143,557,944 $33,456 (0.7)% 41.4 7.0
6/30/11 16 4,291 $133,053,792 $31,008 (7.3)% 41.3 6.9
6/30/12 14 4,086 $131,976,754 $32,300 4.2% 41.1 7.3
1Annual payroll included in the Schedule of Active Member Valuation Data is based upon the annualized monthly payroll for active members as of the valuation date. The annual payroll recorded in the fi nancial section is based upon the sum of the monthly payroll for active members recorded for each month of fi scal year ending June 30, 2012.
Methodology Th e actuarial value of assets recognizes a portion of the diff erence between
the market value of assets and the expected market value of assets, based on the investment return
assumption. Th e amount recognized each year is 20% of the diff erence between market value and
expected market value. Th e Asset Valuation Method was adopted in 2006.
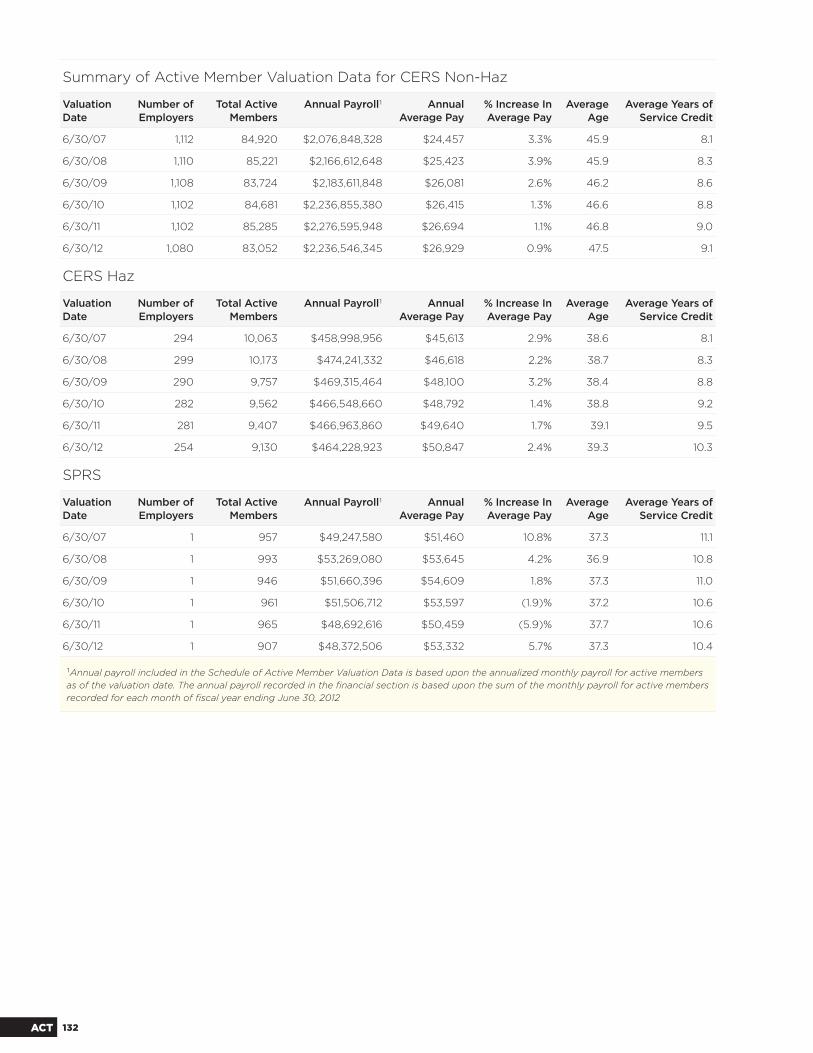
132ACT
Summary of Active Member Valuation Data for CERS Non-Haz
Valuation Date
Number of Employers
Total Active Members
Annual Payroll1 Annual Average Pay
% Increase In Average Pay
Average Age
Average Years of Service Credit
6/30/07 1,112 84,920 $2,076,848,328 $24,457 3.3% 45.9 8.1
6/30/08 1,110 85,221 $2,166,612,648 $25,423 3.9% 45.9 8.3
6/30/09 1,108 83,724 $2,183,611,848 $26,081 2.6% 46.2 8.6
6/30/10 1,102 84,681 $2,236,855,380 $26,415 1.3% 46.6 8.8
6/30/11 1,102 85,285 $2,276,595,948 $26,694 1.1% 46.8 9.0
6/30/12 1,080 83,052 $2,236,546,345 $26,929 0.9% 47.5 9.1
CERS Haz
Valuation Date
Number of Employers
Total Active Members
Annual Payroll1 Annual Average Pay
% Increase In Average Pay
Average Age
Average Years of Service Credit
6/30/07 294 10,063 $458,998,956 $45,613 2.9% 38.6 8.1
6/30/08 299 10,173 $474,241,332 $46,618 2.2% 38.7 8.3
6/30/09 290 9,757 $469,315,464 $48,100 3.2% 38.4 8.8
6/30/10 282 9,562 $466,548,660 $48,792 1.4% 38.8 9.2
6/30/11 281 9,407 $466,963,860 $49,640 1.7% 39.1 9.5
6/30/12 254 9,130 $464,228,923 $50,847 2.4% 39.3 10.3
SPRS
Valuation Date
Number of Employers
Total Active Members
Annual Payroll1 Annual Average Pay
% Increase In Average Pay
Average Age
Average Years of Service Credit
6/30/07 1 957 $49,247,580 $51,460 10.8% 37.3 11.1
6/30/08 1 993 $53,269,080 $53,645 4.2% 36.9 10.8
6/30/09 1 946 $51,660,396 $54,609 1.8% 37.3 11.0
6/30/10 1 961 $51,506,712 $53,597 (1.9)% 37.2 10.6
6/30/11 1 965 $48,692,616 $50,459 (5.9)% 37.7 10.6
6/30/12 1 907 $48,372,506 $53,332 5.7% 37.3 10.4
1Annual payroll included in the Schedule of Active Member Valuation Data is based upon the annualized monthly payroll for active members as of the valuation date. The annual payroll recorded in the fi nancial section is based upon the sum of the monthly payroll for active members recorded for each month of fi scal year ending June 30, 2012
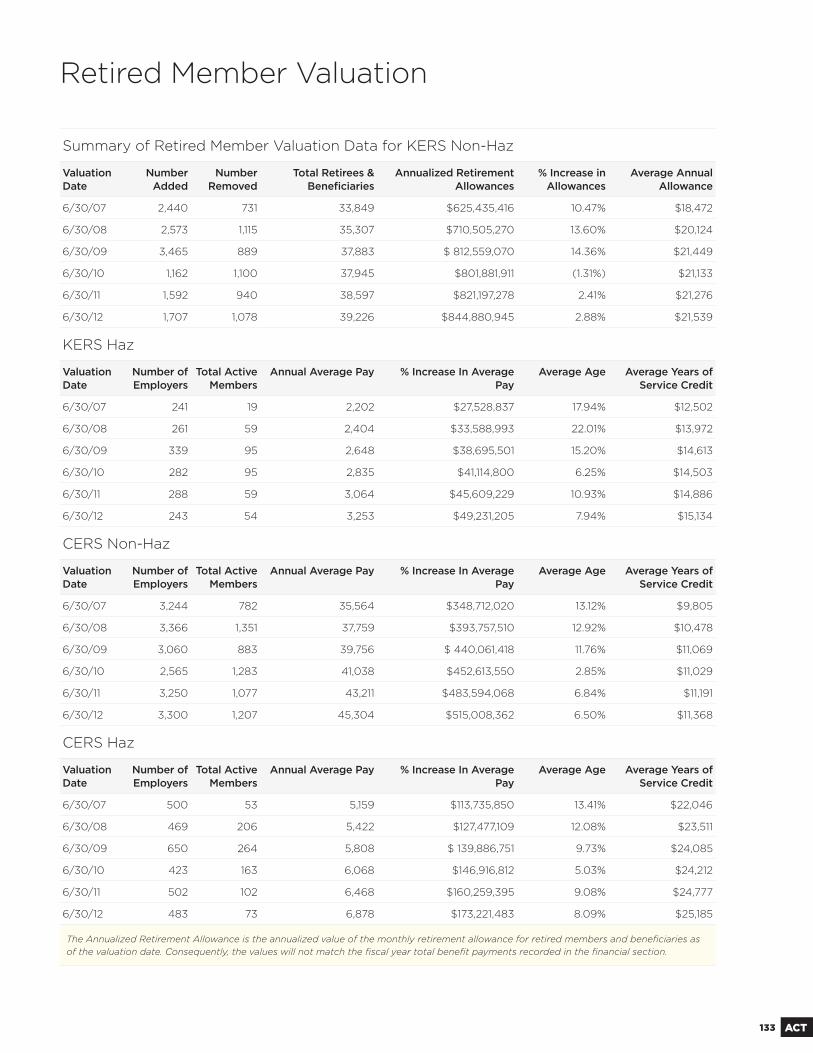
133 ACT
Retired Member Valuation
Summary of Retired Member Valuation Data for KERS Non-Haz
Valuation Date
Number Added
Number Removed
Total Retirees & Benefi ciaries
Annualized Retirement Allowances
% Increase in Allowances
Average Annual Allowance
6/30/07 2,440 731 33,849 $625,435,416 10.47% $18,472
6/30/08 2,573 1,115 35,307 $710,505,270 13.60% $20,124
6/30/09 3,465 889 37,883 $ 812,559,070 14.36% $21,449
6/30/10 1,162 1,100 37,945 $801,881,911 (1.31%) $21,133
6/30/11 1,592 940 38,597 $821,197,278 2.41% $21,276
6/30/12 1,707 1,078 39,226 $844,880,945 2.88% $21,539
KERS Haz
Valuation Date
Number of Employers
Total Active Members
Annual Average Pay % Increase In Average Pay
Average Age Average Years of Service Credit
6/30/07 241 19 2,202 $27,528,837 17.94% $12,502
6/30/08 261 59 2,404 $33,588,993 22.01% $13,972
6/30/09 339 95 2,648 $38,695,501 15.20% $14,613
6/30/10 282 95 2,835 $41,114,800 6.25% $14,503
6/30/11 288 59 3,064 $45,609,229 10.93% $14,886
6/30/12 243 54 3,253 $49,231,205 7.94% $15,134
CERS Non-Haz
Valuation Date
Number of Employers
Total Active Members
Annual Average Pay % Increase In Average Pay
Average Age Average Years of Service Credit
6/30/07 3,244 782 35,564 $348,712,020 13.12% $9,805
6/30/08 3,366 1,351 37,759 $393,757,510 12.92% $10,478
6/30/09 3,060 883 39,756 $ 440,061,418 11.76% $11,069
6/30/10 2,565 1,283 41,038 $452,613,550 2.85% $11,029
6/30/11 3,250 1,077 43,211 $483,594,068 6.84% $11,191
6/30/12 3,300 1,207 45,304 $515,008,362 6.50% $11,368
CERS Haz
Valuation Date
Number of Employers
Total Active Members
Annual Average Pay % Increase In Average Pay
Average Age Average Years of Service Credit
6/30/07 500 53 5,159 $113,735,850 13.41% $22,046
6/30/08 469 206 5,422 $127,477,109 12.08% $23,511
6/30/09 650 264 5,808 $ 139,886,751 9.73% $24,085
6/30/10 423 163 6,068 $146,916,812 5.03% $24,212
6/30/11 502 102 6,468 $160,259,395 9.08% $24,777
6/30/12 483 73 6,878 $173,221,483 8.09% $25,185
The Annualized Retirement Allowance is the annualized value of the monthly retirement allowance for retired members and benefi ciaries as of the valuation date. Consequently, the values will not match the fi scal year total benefi t payments recorded in the fi nancial section.
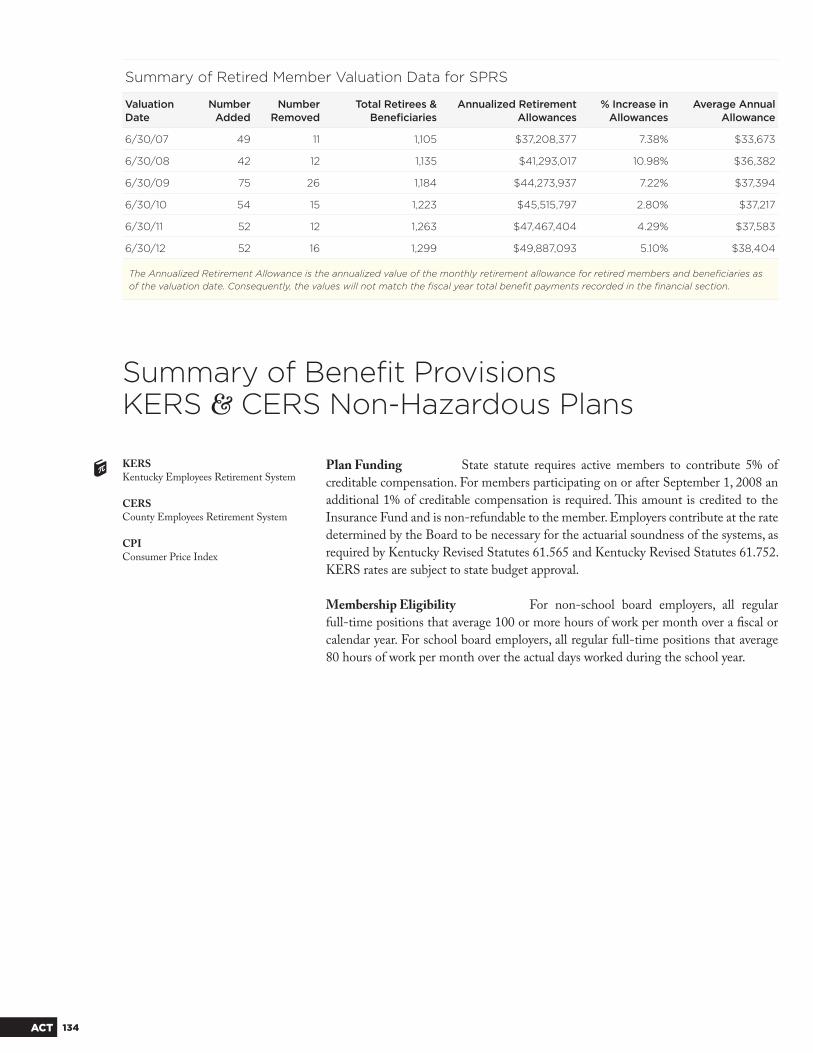
134ACT
Summary of Retired Member Valuation Data for SPRS
Valuation Date
Number Added
Number Removed
Total Retirees & Benefi ciaries
Annualized Retirement Allowances
% Increase in Allowances
Average Annual Allowance
6/30/07 49 11 1,105 $37,208,377 7.38% $33,673
6/30/08 42 12 1,135 $41,293,017 10.98% $36,382
6/30/09 75 26 1,184 $44,273,937 7.22% $37,394
6/30/10 54 15 1,223 $45,515,797 2.80% $37,217
6/30/11 52 12 1,263 $47,467,404 4.29% $37,583
6/30/12 52 16 1,299 $49,887,093 5.10% $38,404
The Annualized Retirement Allowance is the annualized value of the monthly retirement allowance for retired members and benefi ciaries as of the valuation date. Consequently, the values will not match the fi scal year total benefi t payments recorded in the fi nancial section.
Summary of Benefi t ProvisionsKERS & CERS Non-Hazardous Plans
Plan Funding State statute requires active members to contribute 5% of
creditable compensation. For members participating on or after September 1, 2008 an
additional 1% of creditable compensation is required. Th is amount is credited to the
Insurance Fund and is non-refundable to the member. Employers contribute at the rate
determined by the Board to be necessary for the actuarial soundness of the systems, as
required by Kentucky Revised Statutes 61.565 and Kentucky Revised Statutes 61.752.
KERS rates are subject to state budget approval.
Membership Eligibility For non-school board employers, all regular
full-time positions that average 100 or more hours of work per month over a fi scal or
calendar year. For school board employers, all regular full-time positions that average
80 hours of work per month over the actual days worked during the school year.
KERSKentucky Employees Retirement System
CERSCounty Employees Retirement System
CPIConsumer Price Index
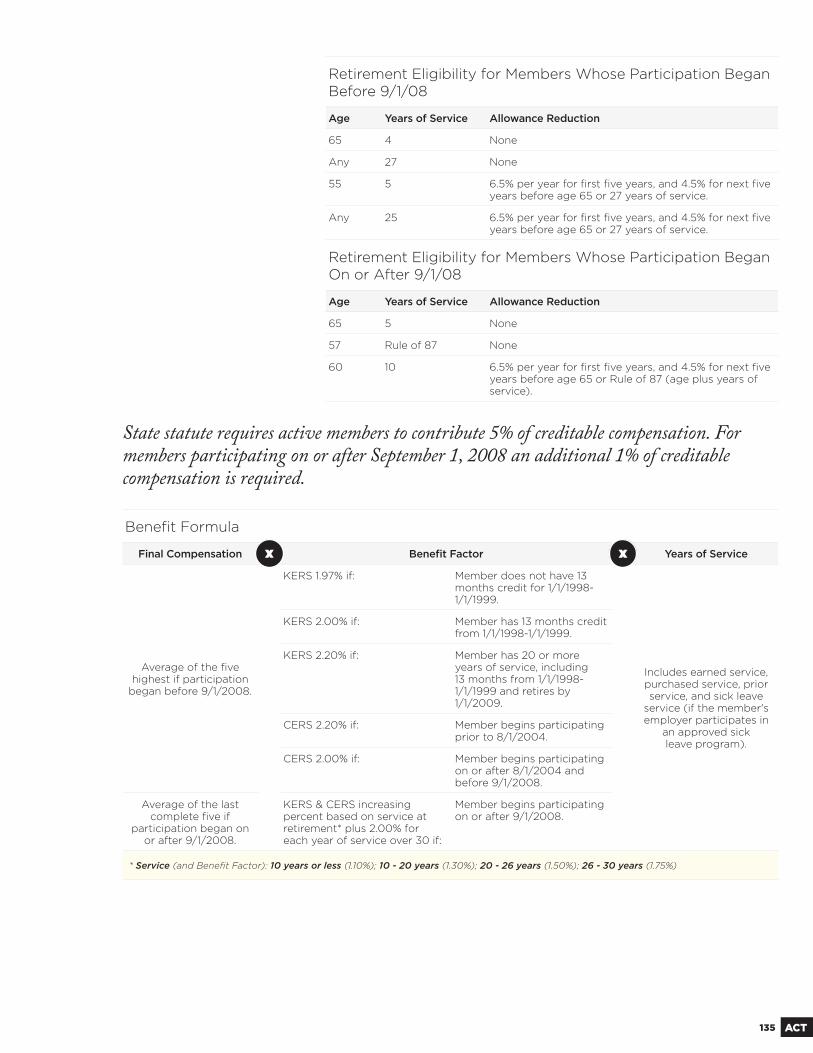
135 ACT
Benefi t Formula
Final Compensation Benefi t Factor Years of Service
Average of the fi ve highest if participation
began before 9/1/2008.
KERS 1.97% if: Member does not have 13 months credit for 1/1/1998-1/1/1999.
Includes earned service, purchased service, prior service, and sick leave
service (if the member's employer participates in
an approved sickleave program).
KERS 2.00% if: Member has 13 months credit from 1/1/1998-1/1/1999.
KERS 2.20% if: Member has 20 or more years of service, including 13 months from 1/1/1998-1/1/1999 and retires by 1/1/2009.
CERS 2.20% if: Member begins participating prior to 8/1/2004.
CERS 2.00% if: Member begins participating on or after 8/1/2004 and before 9/1/2008.
Average of the last complete fi ve if
participation began on or after 9/1/2008.
KERS & CERS increasing percent based on service at retirement* plus 2.00% foreach year of service over 30 if:
Member begins participating on or after 9/1/2008.
* Service (and Benefi t Factor): 10 years or less (1.10%); 10 - 20 years (1.30%); 20 - 26 years (1.50%); 26 - 30 years (1.75%)
x x
Retirement Eligibility for Members Whose Participation Began Before 9/1/08
Age Years of Service Allowance Reduction
65 4 None
Any 27 None
55 5 6.5% per year for fi rst fi ve years, and 4.5% for next fi ve years before age 65 or 27 years of service.
Any 25 6.5% per year for fi rst fi ve years, and 4.5% for next fi ve years before age 65 or 27 years of service.
Retirement Eligibility for Members Whose Participation Began On or After 9/1/08
Age Years of Service Allowance Reduction
65 5 None
57 Rule of 87 None
60 10 6.5% per year for fi rst fi ve years, and 4.5% for next fi ve years before age 65 or Rule of 87 (age plus years of service).
State statute requires active members to contribute 5% of creditable compensation. For members participating on or after September 1, 2008 an additional 1% of creditable compensation is required.
136ACT
Post-Retirement Death Benefi ts If the member is receiving a monthly benefi t
based on at least four (4) years of creditable service, the retirement system will pay a
$5,000 death benefi t payment to the benefi ciary named by the member specifi cally for
this benefi t.
Disability Benefi ts Members participating before 8/1/2004 may retire on ac-
count of disability provided the member has at least 60 months of service credit and
is not eligible for an unreduced benefi t. Additional service credit may be added for
computation of benefi ts under the benefi t formula. Members participating on or af-
ter 8/1/2004 may retire on account of disability provided the member has at least 60
months of service credit. Benefi ts are computed as the higher of 20% of Final Rate of
Pay or the amount calculated under the Benefi t Formula based upon actual service.
Members disabled as a result of a single duty-related injury or act of violence related to
their job may be eligible for special benefi ts.
Pre-Retirement Death Benefi ts Th e benefi ciary of a deceased active member
will be eligible for a monthly benefi t if the member was: (1) eligible for retirement at
the time of death or, (2) under the age of 55 with at least 60 months of service credit
and currently working for a participating agency at the time of death or (3) no longer
working for a participating agency but at the time of death had at least 144 months
of service credit. If the benefi ciary of a deceased active member is not eligible for a
monthly benefi t, the benefi ciary will receive a lump sum payment of the member's
contributions and any accumulated interest.
Cost of Living Adjustment Monthly retirement allowances are increased
July 1 each year by one and one-half percent (1.5%). Th e Kentucky General Assembly
has the authority to suspend or reduce COLAs. HB 265 of 2012 eliminated the July 1,
2012 and July 1, 2013 COLAs for all retirees.
Insurance Benefi ts For members participating prior to July 1, 2003, KRS pays a
percentage of the monthly premium for single coverage based upon the service credit
accrued at retirement. Members participating on or after July 1, 2003 and before Sep-
tember 1, 2008 are required to earn at least 10 years of service credit in order to be eli-
gible for insurance benefi ts at retirement. Members participating on or after September
1, 2008 are required to earn at least 15 years of service credit in order to be eligible for
insurance benefi ts at retirement. Th e monthly health insurance contribution will be $10
for each year of earned service increased by the CPI prior to July 1, 2008, and by 1.5%
annually from July 1, 2008.
Refunds Upon termination of employment, a refund of member contributions and
accumulated interest is available to the member.
Interest on Accounts Active member accounts have been credited with interest on
July 1 of each year at 3% compounded annually through June 30, 1981; 6% thereafter
through June 30, 1986; 4% thereafter through June 30, 2003, and 2.5% thereafter. For
employees hired prior to September 1, 2008, the interest paid is set by the Board of
Trustees and will not be less than 2.0%, for employees hired on or after September 1,
2008, interest will be credited at a rate of 2.5%.
COLACost of Living Adjustment
CPIConsumer Price Index
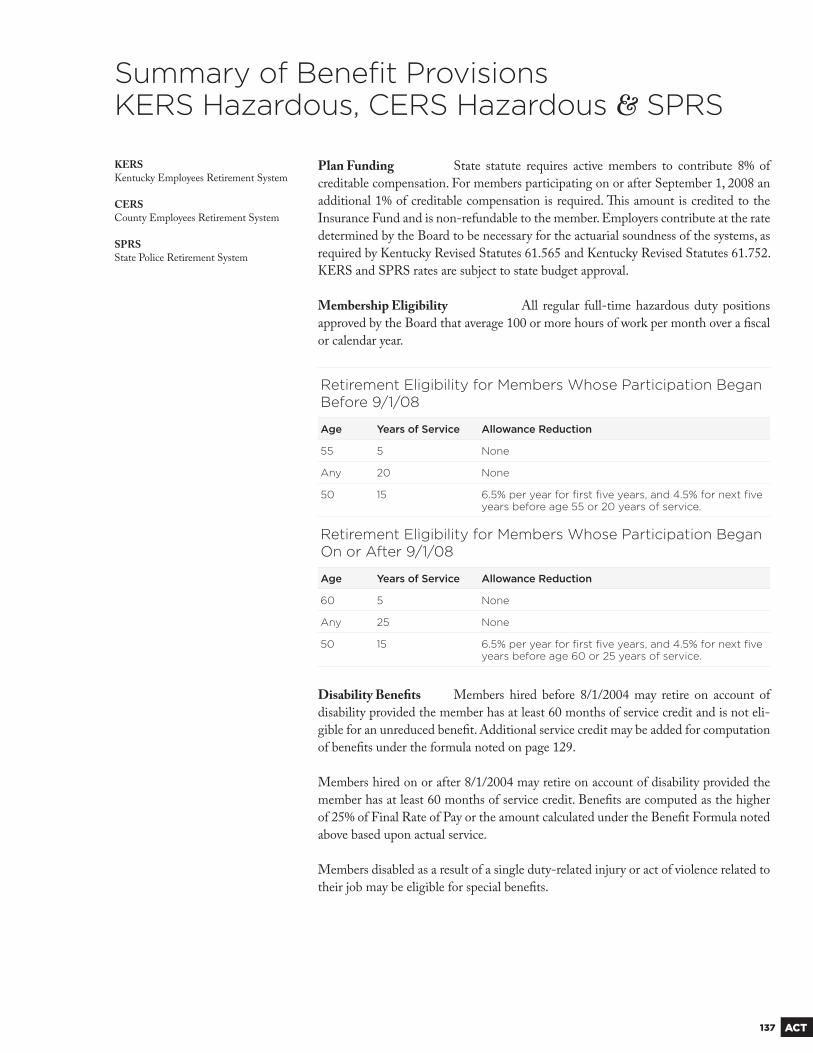
137 ACT
Summary of Benefi t ProvisionsKERS Hazardous, CERS Hazardous & SPRS
Plan Funding State statute requires active members to contribute 8% of
creditable compensation. For members participating on or after September 1, 2008 an
additional 1% of creditable compensation is required. Th is amount is credited to the
Insurance Fund and is non-refundable to the member. Employers contribute at the rate
determined by the Board to be necessary for the actuarial soundness of the systems, as
required by Kentucky Revised Statutes 61.565 and Kentucky Revised Statutes 61.752.
KERS and SPRS rates are subject to state budget approval.
Membership Eligibility All regular full-time hazardous duty positions
approved by the Board that average 100 or more hours of work per month over a fi scal
or calendar year.
Retirement Eligibility for Members Whose Participation Began Before 9/1/08
Age Years of Service Allowance Reduction
55 5 None
Any 20 None
50 15 6.5% per year for fi rst fi ve years, and 4.5% for next fi ve years before age 55 or 20 years of service.
Retirement Eligibility for Members Whose Participation Began On or After 9/1/08
Age Years of Service Allowance Reduction
60 5 None
Any 25 None
50 15 6.5% per year for fi rst fi ve years, and 4.5% for next fi ve years before age 60 or 25 years of service.
KERSKentucky Employees Retirement System
CERSCounty Employees Retirement System
SPRSState Police Retirement System
Disability Benefi ts Members hired before 8/1/2004 may retire on account of
disability provided the member has at least 60 months of service credit and is not eli-
gible for an unreduced benefi t. Additional service credit may be added for computation
of benefi ts under the formula noted on page 129.
Members hired on or after 8/1/2004 may retire on account of disability provided the
member has at least 60 months of service credit. Benefi ts are computed as the higher
of 25% of Final Rate of Pay or the amount calculated under the Benefi t Formula noted
above based upon actual service.
Members disabled as a result of a single duty-related injury or act of violence related to
their job may be eligible for special benefi ts.
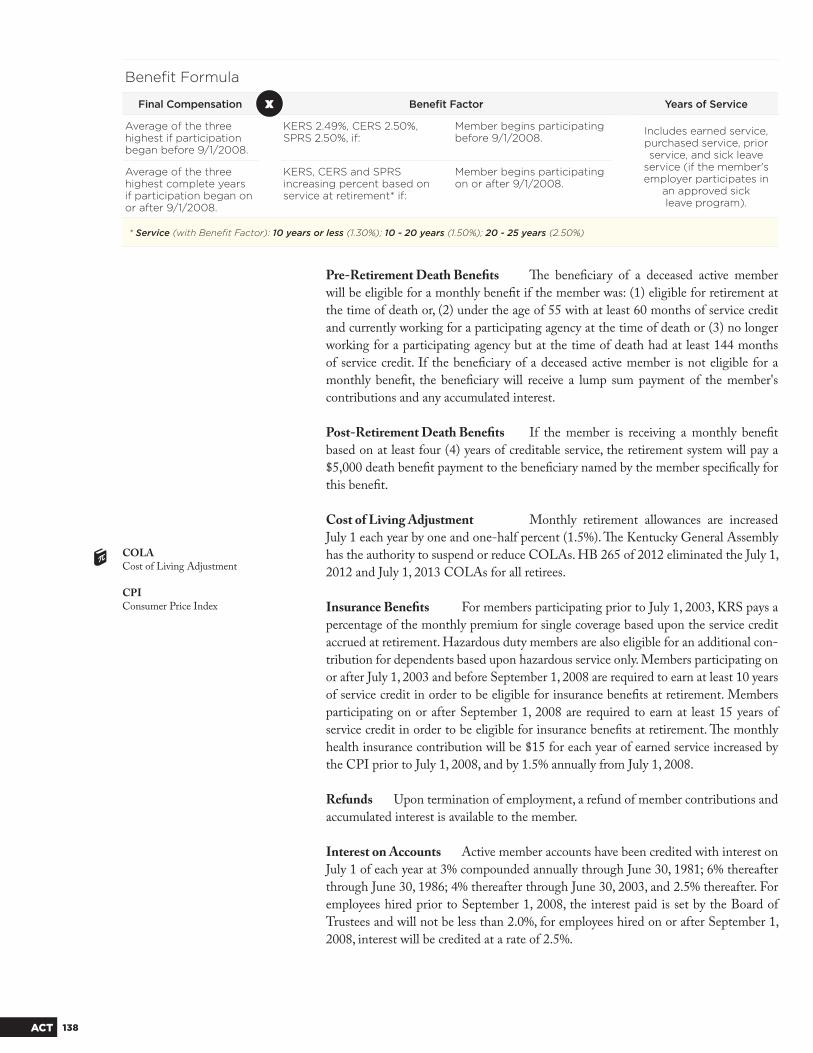
138ACT
Benefi t Formula
Final Compensation Benefi t Factor Years of Service
Average of the three highest if participation began before 9/1/2008.
KERS 2.49%, CERS 2.50%,SPRS 2.50%, if:
Member begins participating before 9/1/2008.
Includes earned service, purchased service, prior service, and sick leave
service (if the member's employer participates in
an approved sickleave program).
Average of the three highest complete years if participation began on or after 9/1/2008.
KERS, CERS and SPRS increasing percent based on service at retirement* if:
Member begins participating on or after 9/1/2008.
* Service (with Benefi t Factor): 10 years or less (1.30%); 10 - 20 years (1.50%); 20 - 25 years (2.50%)
x
Pre-Retirement Death Benefi ts Th e benefi ciary of a deceased active member
will be eligible for a monthly benefi t if the member was: (1) eligible for retirement at
the time of death or, (2) under the age of 55 with at least 60 months of service credit
and currently working for a participating agency at the time of death or (3) no longer
working for a participating agency but at the time of death had at least 144 months
of service credit. If the benefi ciary of a deceased active member is not eligible for a
monthly benefi t, the benefi ciary will receive a lump sum payment of the member's
contributions and any accumulated interest.
Post-Retirement Death Benefi ts If the member is receiving a monthly benefi t
based on at least four (4) years of creditable service, the retirement system will pay a
$5,000 death benefi t payment to the benefi ciary named by the member specifi cally for
this benefi t.
Cost of Living Adjustment Monthly retirement allowances are increased
July 1 each year by one and one-half percent (1.5%). Th e Kentucky General Assembly
has the authority to suspend or reduce COLAs. HB 265 of 2012 eliminated the July 1,
2012 and July 1, 2013 COLAs for all retirees.
Insurance Benefi ts For members participating prior to July 1, 2003, KRS pays a
percentage of the monthly premium for single coverage based upon the service credit
accrued at retirement. Hazardous duty members are also eligible for an additional con-
tribution for dependents based upon hazardous service only. Members participating on
or after July 1, 2003 and before September 1, 2008 are required to earn at least 10 years
of service credit in order to be eligible for insurance benefi ts at retirement. Members
participating on or after September 1, 2008 are required to earn at least 15 years of
service credit in order to be eligible for insurance benefi ts at retirement. Th e monthly
health insurance contribution will be $15 for each year of earned service increased by
the CPI prior to July 1, 2008, and by 1.5% annually from July 1, 2008.
Refunds Upon termination of employment, a refund of member contributions and
accumulated interest is available to the member.
Interest on Accounts Active member accounts have been credited with interest on
July 1 of each year at 3% compounded annually through June 30, 1981; 6% thereafter
through June 30, 1986; 4% thereafter through June 30, 2003, and 2.5% thereafter. For
employees hired prior to September 1, 2008, the interest paid is set by the Board of
Trustees and will not be less than 2.0%, for employees hired on or after September 1,
2008, interest will be credited at a rate of 2.5%.
COLACost of Living Adjustment
CPIConsumer Price Index

139 ACT

140STAT

141 STAT11114114141141 STASTATT
142 Membership by System
144 Participating Employers
146 Average Monthly Benefi t
147 Plan Net Assets
148 Changes in Plan Net Assets
153 Schedule of Benefi t Expenses by Type
158 Analysis of Initial Retirees
159 Payments Options Selected by Members
160 Employer Contribution Rates
161 Retired Reemployed
162 Insurance Contracts by Type
164 Retirement Payments by County
Statistical TABLE OF CONTENTS
ii ii llSSSSSSSSSSSSSSSSSSSttttttttttttttttaaaaaaaaaaaaaaaaaaaattttttttttttttttttiiiiiiiiiiiiiiiiiiiissssssssssssssssssssssssssssssttttttttttttttttttttttiiiiiiiiiiiiiiccccccccccccccccccccccccccaaaaaaaaaaaaaaaaaaaaaaaaallllllllllllllllll nnnnnnnnSSSSSSSSSSSSSSSSSSSSSSSSSSSSSSSSSSSSSSSeeeeeeeeeeeeeeeeeeeeeeeeeeeeeeeeccccccccccccccccccccccccccccccttttttttttttttttttttttttiiiiiiiiiiiiiiiiiiiiiiiiioooooooooooooooooooooooooooooooonnnnnnnnnnnnnnnnnnnnnnnn
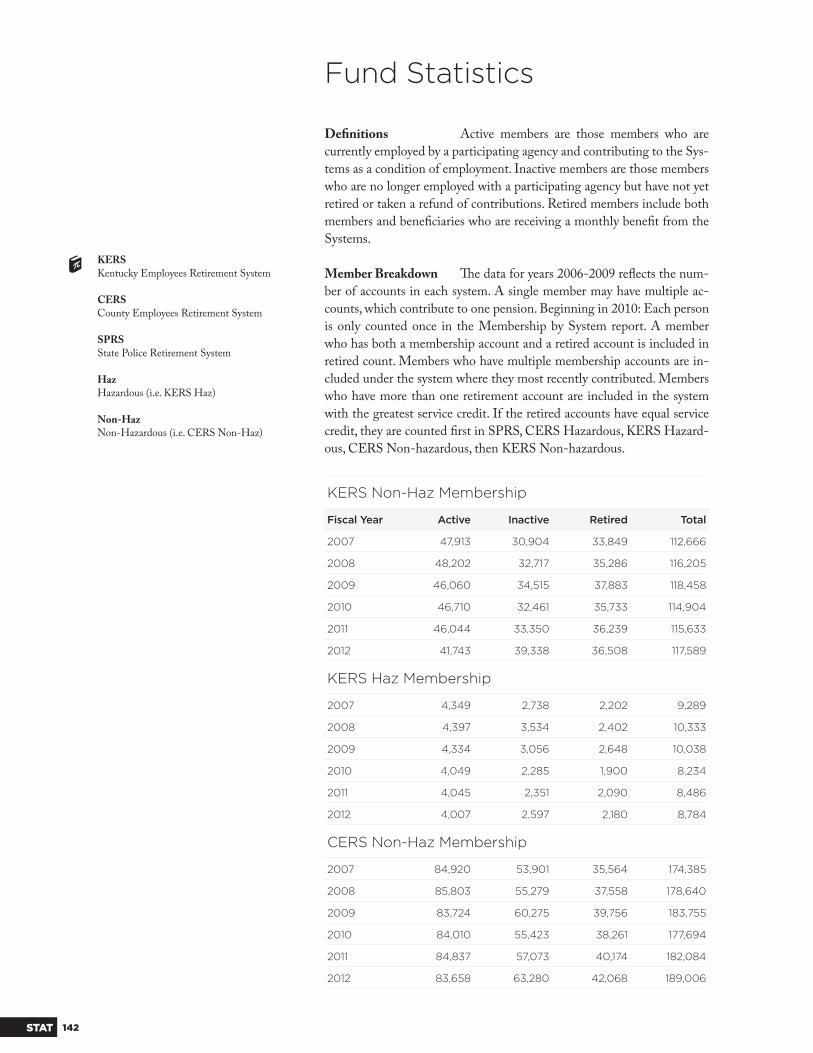
142STAT
Fund Statistics
KERS Non-Haz Membership
Fiscal Year Active Inactive Retired Total
2007 47,913 30,904 33,849 112,666
2008 48,202 32,717 35,286 116,205
2009 46,060 34,515 37,883 118,458
2010 46,710 32,461 35,733 114,904
2011 46,044 33,350 36,239 115,633
2012 41,743 39,338 36,508 117,589
KERS Haz Membership
2007 4,349 2,738 2,202 9,289
2008 4,397 3,534 2,402 10,333
2009 4,334 3,056 2,648 10,038
2010 4,049 2,285 1,900 8,234
2011 4,045 2,351 2,090 8,486
2012 4,007 2,597 2,180 8,784
CERS Non-Haz Membership
2007 84,920 53,901 35,564 174,385
2008 85,803 55,279 37,558 178,640
2009 83,724 60,275 39,756 183,755
2010 84,010 55,423 38,261 177,694
2011 84,837 57,073 40,174 182,084
2012 83,658 63,280 42,068 189,006
Defi nitions Active members are those members who are
currently employed by a participating agency and contributing to the Sys-
tems as a condition of employment. Inactive members are those members
who are no longer employed with a participating agency but have not yet
retired or taken a refund of contributions. Retired members include both
members and benefi ciaries who are receiving a monthly benefi t from the
Systems.
Member Breakdown Th e data for years 2006-2009 refl ects the num-
ber of accounts in each system. A single member may have multiple ac-
counts, which contribute to one pension. Beginning in 2010: Each person
is only counted once in the Membership by System report. A member
who has both a membership account and a retired account is included in
retired count. Members who have multiple membership accounts are in-
cluded under the system where they most recently contributed. Members
who have more than one retirement account are included in the system
with the greatest service credit. If the retired accounts have equal service
credit, they are counted fi rst in SPRS, CERS Hazardous, KERS Hazard-
ous, CERS Non-hazardous, then KERS Non-hazardous.
KERSKentucky Employees Retirement System
CERSCounty Employees Retirement System
SPRSState Police Retirement System
HazHazardous (i.e. KERS Haz)
Non-HazNon-Hazardous (i.e. CERS Non-Haz)
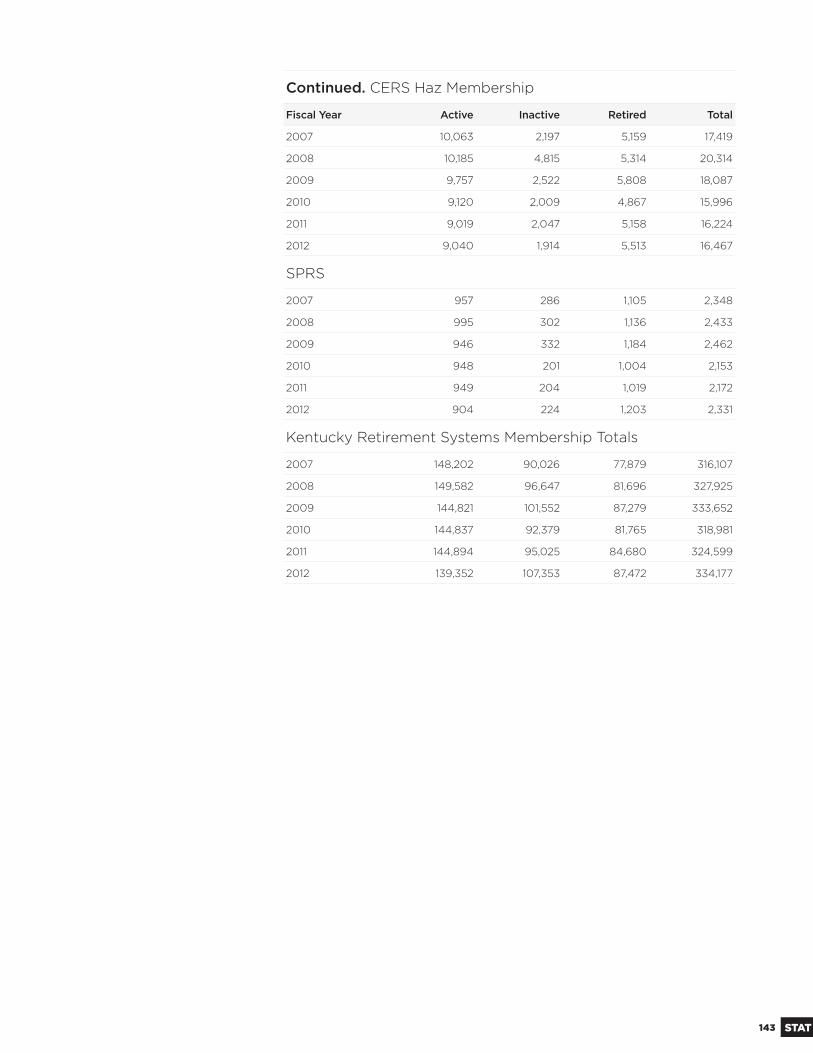
143 STAT
Continued. CERS Haz Membership
Fiscal Year Active Inactive Retired Total
2007 10,063 2,197 5,159 17,419
2008 10,185 4,815 5,314 20,314
2009 9,757 2,522 5,808 18,087
2010 9,120 2,009 4,867 15,996
2011 9,019 2,047 5,158 16,224
2012 9,040 1,914 5,513 16,467
SPRS
2007 957 286 1,105 2,348
2008 995 302 1,136 2,433
2009 946 332 1,184 2,462
2010 948 201 1,004 2,153
2011 949 204 1,019 2,172
2012 904 224 1,203 2,331
Kentucky Retirement Systems Membership Totals
2007 148,202 90,026 77,879 316,107
2008 149,582 96,647 81,696 327,925
2009 144,821 101,552 87,279 333,652
2010 144,837 92,379 81,765 318,981
2011 144,894 95,025 84,680 324,599
2012 139,352 107,353 87,472 334,177

144STAT
Schedule of Participating Employersin KERS
Agency Classifi cation Number of Agencies
Number of Employees
County Attorneys 61 353
Health Departments 57 3,449
Master Commissioner 32 74
Non-P1 State Agencies 39 1381
Other Retirement Systems 2 288
P1 State Agencies 135 31751
Regional Mental Health Units 13 5823
Universities 7 3929
Total 346 47,048
Schedule of Participating Employersin SPRS
Kentucky State Police - Uniformed Offi cers
1 909
Schedule of Participating Employersin CERS
Agency Classifi cation Number of Agencies
Number of Employees
Airport Boards 5 504
Ambulance Services 21 434
Area Development Districts 14 690
Boards of Education 174 49363
Cities 219 10146
Community Action Agencies 22 2816
Conservation Districts 45 61
County Attorneys 68 690
County Clerks 16 596
Development Authorities 6 10
Fire Departments 39 757
Fiscal Courts 117 10884
Health Departments 1 283
Housing Authorities 41 435
Jailers 2 33
Libraries 86 1159
Other Retirement Systems 2 3
P1 State Agencies 1 1696
Parks and Recreation 8 62
Planning Commissions 16 206
Police Departments 2 15
Riverport Authorities 5 67
Sanitation Districts 9 348
Sheriff Departments 12 980
Special Districts & Boards 54 1564
Tourist Commissions 22 177
Urban Government Agencies 2 6763
Utility Boards 119 3894
Total 1,128 94,636
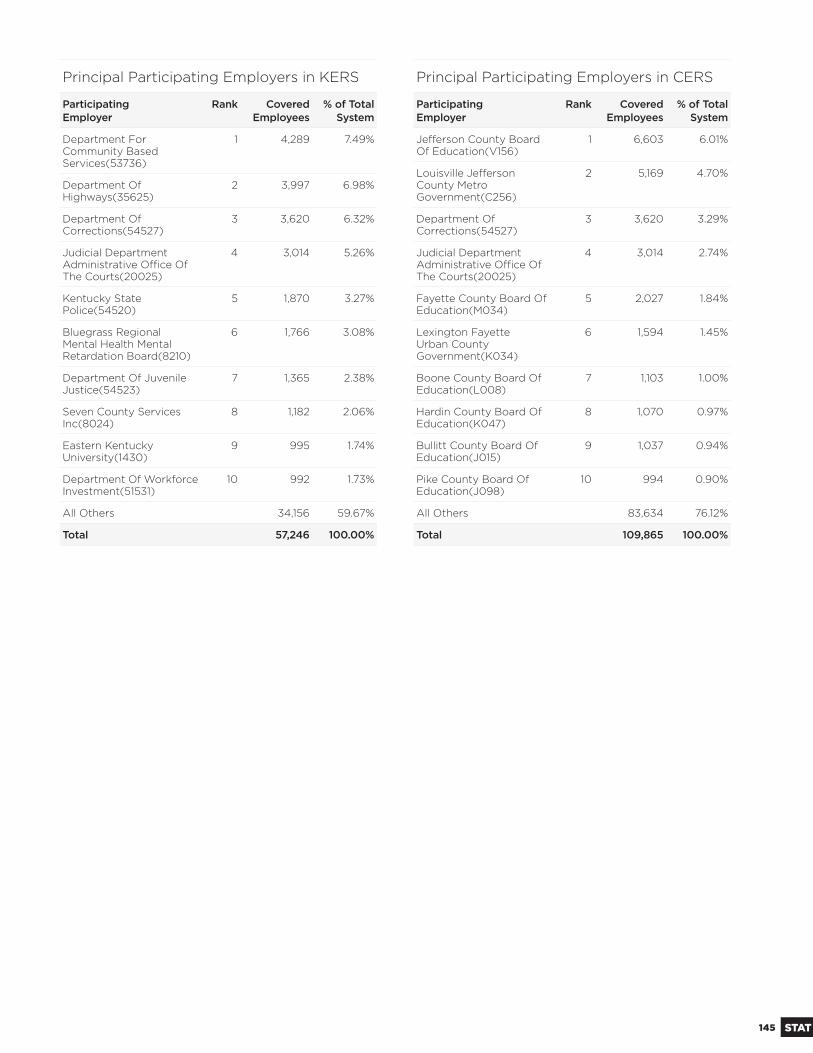
145 STAT
Principal Participating Employers in KERS
ParticipatingEmployer
Rank Covered Employees
% of Total System
Department For Community Based Services(53736)
1 4,289 7.49%
Department Of Highways(35625)
2 3,997 6.98%
Department Of Corrections(54527)
3 3,620 6.32%
Judicial Department Administrative Offi ce Of The Courts(20025)
4 3,014 5.26%
Kentucky State Police(54520)
5 1,870 3.27%
Bluegrass Regional Mental Health Mental Retardation Board(8210)
6 1,766 3.08%
Department Of Juvenile Justice(54523)
7 1,365 2.38%
Seven County Services Inc(8024)
8 1,182 2.06%
Eastern Kentucky University(1430)
9 995 1.74%
Department Of Workforce Investment(51531)
10 992 1.73%
All Others 34,156 59.67%
Total 57,246 100.00%
Principal Participating Employers in CERS
ParticipatingEmployer
Rank Covered Employees
% of Total System
Jeff erson County Board Of Education(V156)
1 6,603 6.01%
Louisville Jeff erson County Metro Government(C256)
2 5,169 4.70%
Department Of Corrections(54527)
3 3,620 3.29%
Judicial Department Administrative Offi ce Of The Courts(20025)
4 3,014 2.74%
Fayette County Board Of Education(M034)
5 2,027 1.84%
Lexington Fayette Urban County Government(K034)
6 1,594 1.45%
Boone County Board Of Education(L008)
7 1,103 1.00%
Hardin County Board Of Education(K047)
8 1,070 0.97%
Bullitt County Board Of Education(J015)
9 1,037 0.94%
Pike County Board Of Education(J098)
10 994 0.90%
All Others 83,634 76.12%
Total 109,865 100.00%
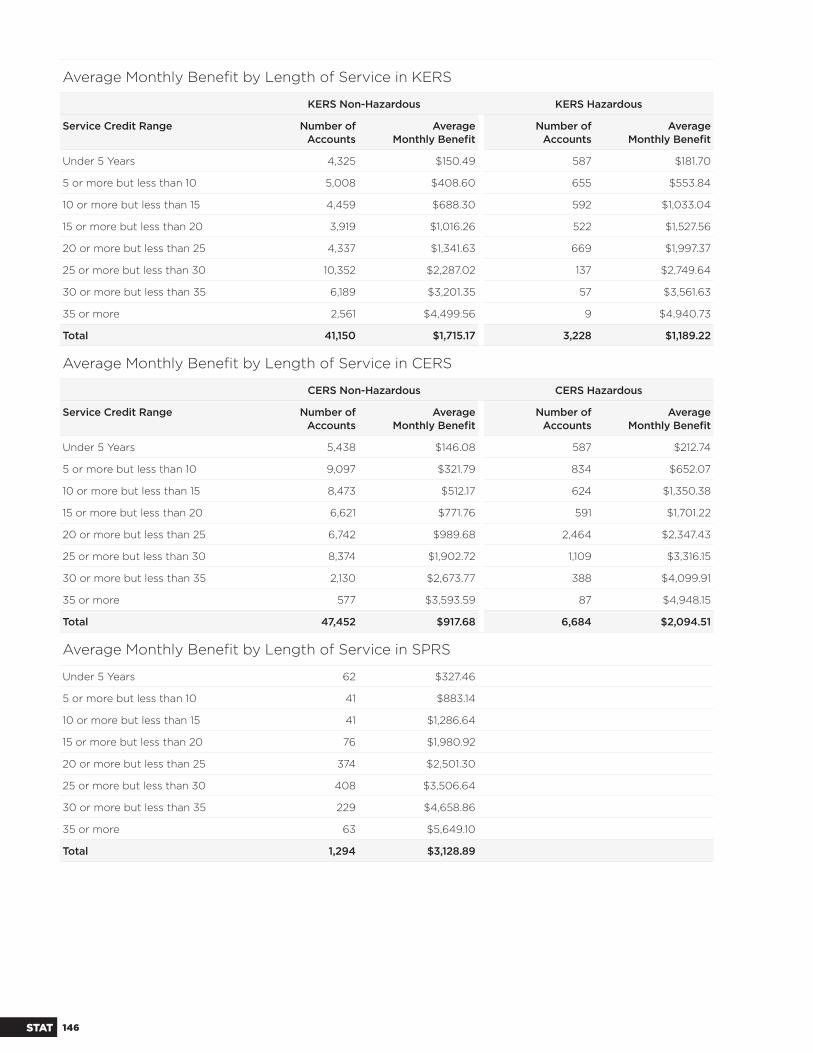
146STAT
Average Monthly Benefi t by Length of Service in KERS
KERS Non-Hazardous KERS Hazardous
Service Credit Range Number ofAccounts
AverageMonthly Benefi t
Number ofAccounts
AverageMonthly Benefi t
Under 5 Years 4,325 $150.49 587 $181.70
5 or more but less than 10 5,008 $408.60 655 $553.84
10 or more but less than 15 4,459 $688.30 592 $1,033.04
15 or more but less than 20 3,919 $1,016.26 522 $1,527.56
20 or more but less than 25 4,337 $1,341.63 669 $1,997.37
25 or more but less than 30 10,352 $2,287.02 137 $2,749.64
30 or more but less than 35 6,189 $3,201.35 57 $3,561.63
35 or more 2,561 $4,499.56 9 $4,940.73
Total 41,150 $1,715.17 3,228 $1,189.22
Average Monthly Benefi t by Length of Service in CERS
CERS Non-Hazardous CERS Hazardous
Service Credit Range Number ofAccounts
AverageMonthly Benefi t
Number ofAccounts
AverageMonthly Benefi t
Under 5 Years 5,438 $146.08 587 $212.74
5 or more but less than 10 9,097 $321.79 834 $652.07
10 or more but less than 15 8,473 $512.17 624 $1,350.38
15 or more but less than 20 6,621 $771.76 591 $1,701.22
20 or more but less than 25 6,742 $989.68 2,464 $2,347.43
25 or more but less than 30 8,374 $1,902.72 1,109 $3,316.15
30 or more but less than 35 2,130 $2,673.77 388 $4,099.91
35 or more 577 $3,593.59 87 $4,948.15
Total 47,452 $917.68 6,684 $2,094.51
Average Monthly Benefi t by Length of Service in SPRS
Under 5 Years 62 $327.46
5 or more but less than 10 41 $883.14
10 or more but less than 15 41 $1,286.64
15 or more but less than 20 76 $1,980.92
20 or more but less than 25 374 $2,501.30
25 or more but less than 30 408 $3,506.64
30 or more but less than 35 229 $4,658.86
35 or more 63 $5,649.10
Total 1,294 $3,128.89
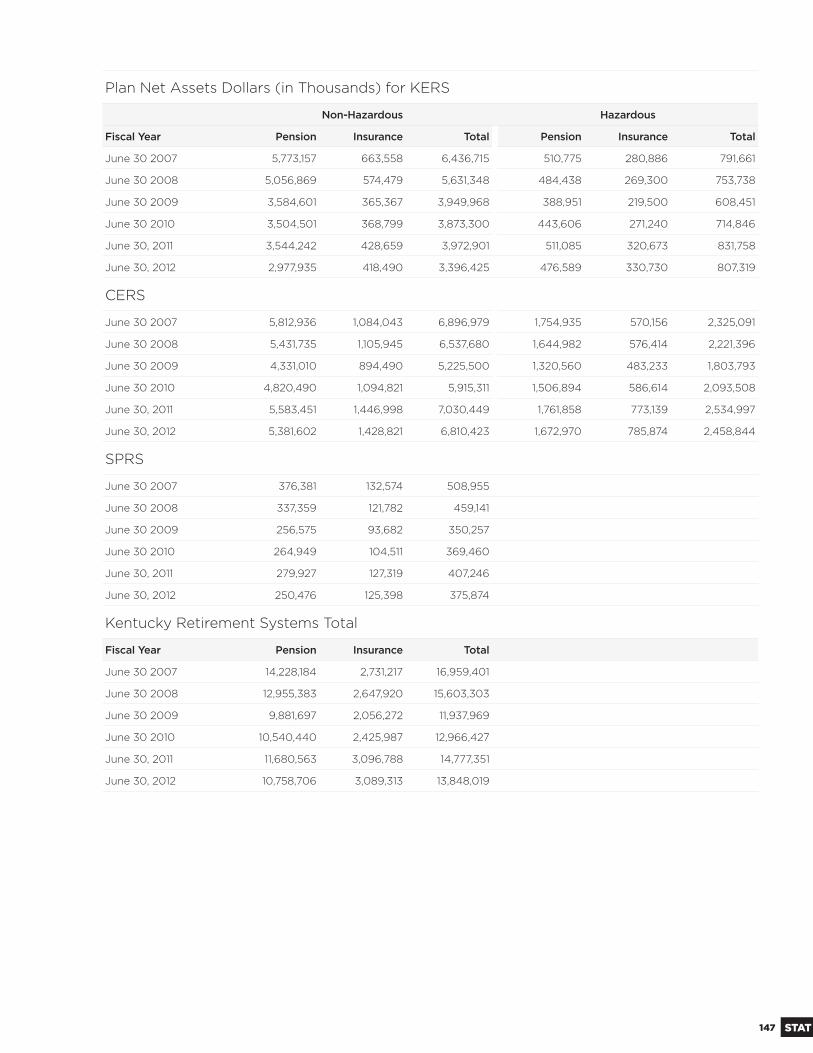
147 STAT
Plan Net Assets Dollars (in Thousands) for KERS
Non-Hazardous Hazardous
Fiscal Year Pension Insurance Total Pension Insurance Total
June 30 2007 5,773,157 663,558 6,436,715 510,775 280,886 791,661
June 30 2008 5,056,869 574,479 5,631,348 484,438 269,300 753,738
June 30 2009 3,584,601 365,367 3,949,968 388,951 219,500 608,451
June 30 2010 3,504,501 368,799 3,873,300 443,606 271,240 714,846
June 30, 2011 3,544,242 428,659 3,972,901 511,085 320,673 831,758
June 30, 2012 2,977,935 418,490 3,396,425 476,589 330,730 807,319
CERS
June 30 2007 5,812,936 1,084,043 6,896,979 1,754,935 570,156 2,325,091
June 30 2008 5,431,735 1,105,945 6,537,680 1,644,982 576,414 2,221,396
June 30 2009 4,331,010 894,490 5,225,500 1,320,560 483,233 1,803,793
June 30 2010 4,820,490 1,094,821 5,915,311 1,506,894 586,614 2,093,508
June 30, 2011 5,583,451 1,446,998 7,030,449 1,761,858 773,139 2,534,997
June 30, 2012 5,381,602 1,428,821 6,810,423 1,672,970 785,874 2,458,844
SPRS
June 30 2007 376,381 132,574 508,955
June 30 2008 337,359 121,782 459,141
June 30 2009 256,575 93,682 350,257
June 30 2010 264,949 104,511 369,460
June 30, 2011 279,927 127,319 407,246
June 30, 2012 250,476 125,398 375,874
Kentucky Retirement Systems Total
Fiscal Year Pension Insurance Total
June 30 2007 14,228,184 2,731,217 16,959,401
June 30 2008 12,955,383 2,647,920 15,603,303
June 30 2009 9,881,697 2,056,272 11,937,969
June 30 2010 10,540,440 2,425,987 12,966,427
June 30, 2011 11,680,563 3,096,788 14,777,351
June 30, 2012 10,758,706 3,089,313 13,848,019

148STAT
Changes in Plan Net Assets (in Thousands) for KERS Non-Haz Pension Fund
Additions 2007 2008 2009 2010 2011 2012
Members' Contributions $116,254 $116,487 $108,362 $90,780 $109,879 $96,418
Employers' Contributions 88,249 104,655 112,383 144,051 185,558 211,071
Health Insurance Contributions (HB1) - - 404 1,799 2,441 5,337
Net Investment Income 784,652 (221,578) (867,675) 526,209 599,790 9,789
Total Additions 989,155 (436) (646,526) 762,839 $897,668 322,615
Deductions
Benefi t Payments 640,201 699,052 808,513 825,627 838,372 858,151
Refunds 9,489 9,076 9,127 8,887 10,931 12,004
Administrative Expenses 7,070 7,724 8,102 8,424 8,558 8,776
Capital Project Expenses - - - - 67 8
Other Expenses - - - - - -
Total Deductions 656,773 715,852 825,742 842,938 857,928 878,939
Total Changes in Plan Net Assets $332,382 $(716,288) $(1,472,268) $(80,099) $39,740 $(556,324)
KERS Non-Haz Insurance Fund
Additions 2007 2008 2009 2010 2011 2012
Employers' Contributions $64,014 $56,745 $74,434 $$92,679 $123,256 $146,844
Net Investment Income 78,877 (38,965) (154,894) 50,765 77,225 (4,803)
Member Drug Reimbursement 10,744 6,634 8,168 8,551 10,025 7,856
Insurance Appropriation - - - - - -
Premiums Rec'd from Retirees 12,196 12,940 12,320 13,588 15,826 15,666
Total Additions 165,831 37,354 (59,972) 165,583 $226,332 $165,563
Deductions
Benefi t Payments 111,659 122,946 145,036 157,819 161,804 163,841
Administrative Expenses 3,199 3,487 4,104 4,333 4,667 5,203
Insurance Appropriation - - - - -
Total Deductions 114,858 126,433 149,140 162,152 166,471 169,044
Total Changes in Plan Net Assets $50,973 $(89,079) $(209,112) $3,431 $59,861 169,044
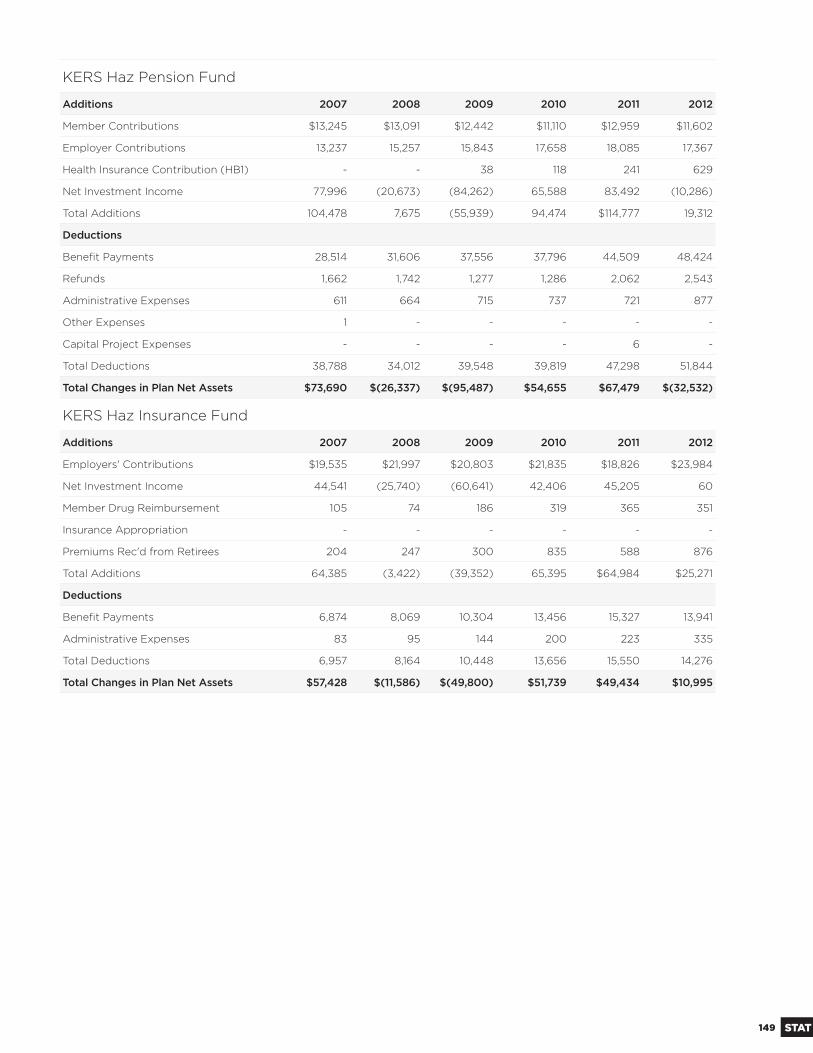
149 STAT
KERS Haz Pension Fund
Additions 2007 2008 2009 2010 2011 2012
Member Contributions $13,245 $13,091 $12,442 $11,110 $12,959 $11,602
Employer Contributions 13,237 15,257 15,843 17,658 18,085 17,367
Health Insurance Contribution (HB1) - - 38 118 241 629
Net Investment Income 77,996 (20,673) (84,262) 65,588 83,492 (10,286)
Total Additions 104,478 7,675 (55,939) 94,474 $114,777 19,312
Deductions
Benefi t Payments 28,514 31,606 37,556 37,796 44,509 48,424
Refunds 1,662 1,742 1,277 1,286 2,062 2,543
Administrative Expenses 611 664 715 737 721 877
Other Expenses 1 - - - - -
Capital Project Expenses - - - - 6 -
Total Deductions 38,788 34,012 39,548 39,819 47,298 51,844
Total Changes in Plan Net Assets $73,690 $(26,337) $(95,487) $54,655 $67,479 $(32,532)
KERS Haz Insurance Fund
Additions 2007 2008 2009 2010 2011 2012
Employers' Contributions $19,535 $21,997 $20,803 $21,835 $18,826 $23,984
Net Investment Income 44,541 (25,740) (60,641) 42,406 45,205 60
Member Drug Reimbursement 105 74 186 319 365 351
Insurance Appropriation - - - - - -
Premiums Rec'd from Retirees 204 247 300 835 588 876
Total Additions 64,385 (3,422) (39,352) 65,395 $64,984 $25,271
Deductions
Benefi t Payments 6,874 8,069 10,304 13,456 15,327 13,941
Administrative Expenses 83 95 144 200 223 335
Total Deductions 6,957 8,164 10,448 13,656 15,550 14,276
Total Changes in Plan Net Assets $57,428 $(11,586) $(49,800) $51,739 $49,434 $10,995

150STAT
CERS Non-Haz Pension Fund
Additions 2007 2008 2009 2010 2011 2012
Members' Contributions $121,979 $125,014 $122,518 $106,558 $144,861 $119,123
Employers' Contributions 124,261 150,925 179,286 207,076 247,968 270,664
Health Insurance Contribution (HB1) - - 415 1,345 3,216 5,101
Net Investment Income 760,541 (228,020) (927,090) 669,072 887,514 (3,349)
Total Additions 1,009,736 47,919 (624,871) 984,051 $1,283,559 $391,539
Deductions
Benefi t Payments 356,648 403,958 451,304 470,249 494,344 524,385
Refunds 11,396 11,924 10,719 10,001 11,816 12,765
Administrative Expenses 12,197 13,238 13,831 14,323 14,324 16,740
Capital Project Expenses - - - - 112 9
Other Expenses 22 - - - - -
Total Deductions 389,263 429,120 475,854 494,571 520,596 553,899
Total Changes in Plan Net Assets $620,473 $(381,201) $(1,100,725) $489,478 $762,963 $(162,360)
CERS Non-Haz Insurance Fund
Additions 2007 2008 2009 2010 2011 2012
Employer Contributions $147,609 $196,110 $123,761 $166,032 $185,639 $164,297
Net Investment Income 188,055 (95,924) (244,148) 136,528 274,743 (32,992)
Member Drug Reimbursement 9,623 6,003 7,624 9,157 10,449 8,443
Insurance Appropriation - - - - - -
Premiums Rec'd from Retirees 13,997 15,104 14,356 16,216 18,053 17,493
Total Additions 359,284 121,293 (98,407) 327,933 $488,884 $157,241
Deductions 2007 2008 2009 2010 2011 2012
Benefi t Payments 85,199 95,966 108,995 123,133 131,945 141,694
Administrative Expenses 3,040 3,425 4,053 4,469 4,763 5,545
Total Deductions 88,239 99,391 113,048 127,602 136,708 147,239
Total Changes in Plan Net Assets $271,045 $21,902 $(211,455) $200,331 $352,176 $10,002

151 STAT
CERS Haz Pension Fund
Additions 2007 2008 2009 2010 2011 2012
Members' Contributions $43,650 $44,260 $42,582 $37,200 $53,918 $41,797
Employers' Contributions 61,553 72,155 78,151 82,887 84,595 77,311
Health Insurance Contribution (HB1) - - 37 174 1,157 811
Net Investment Income 240,035 (97,393) (302,748) 206,073 286,688 (24,724)
Total Additions 345,238 19,022 (181,978) 326,334 $426,358 95,195
Deductions
Benefi t Payments 115,604 125,191 138,810 136,810 167,540 169,352
Refunds 2,563 2,641 2,436 1,956 2,654 3,516
Administrative Expenses 1,073 1,143 1,198 1,234 1,191 1,319
Capital Project Expenses - - - - 9 -
Other Expenses 2 - - - - -
Total Deductions 119,242 128,975 142,444 140,000 171,394 174,187
Total Changes in Plan Net Assets $225,996 $(109,953) $(324,422) $186,334 $254,964 $(79,992)
CERS Haz Insurance Fund
Additions 2007 2008 2009 2010 2011 2012
Employers' Contributions $70,073 $90,113 $70,783 $82,970 $98,203 $90,204
Net Investment Income 90,041 (48,529) (123,461) 67,288 139,242 (16,127)
Member Drug Reimbursement 657 420 628 1,493 972 871
Insurance Appropriation - - - - - -
Premiums Rec'd from Retirees 191 222 330 508 516 695
Total Additions 160,962 42,226 (51,720) 152,259 $238,933 $75,643
Deductions
Benefi t Payments 31,607 35,604 41,017 48,321 51,831 50,155
Administrative Expenses 320 364 444 554 580 688
Total Deductions 31,927 35,968 41,461 48,875 52,411 50,843
Total Changes in Plan Net Assets $129,035 $6,258 $(93,181) $103,384 $186,522 $24,800
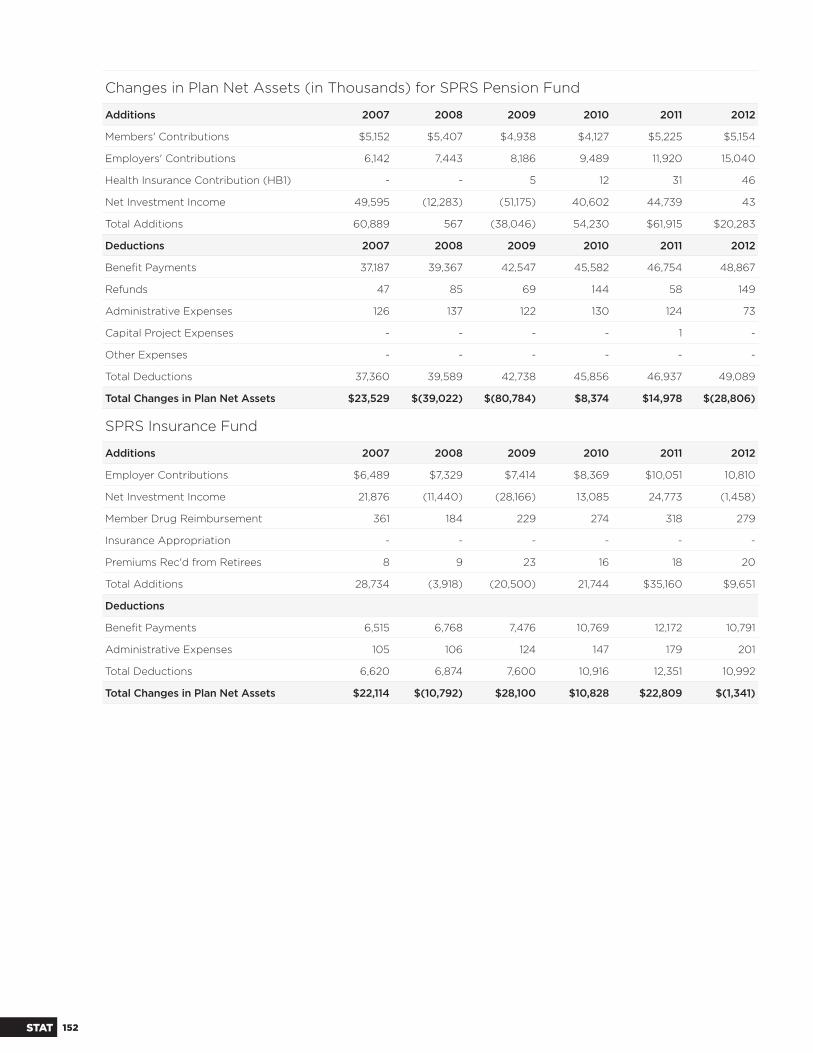
152STAT
Changes in Plan Net Assets (in Thousands) for SPRS Pension Fund
Additions 2007 2008 2009 2010 2011 2012
Members' Contributions $5,152 $5,407 $4,938 $4,127 $5,225 $5,154
Employers' Contributions 6,142 7,443 8,186 9,489 11,920 15,040
Health Insurance Contribution (HB1) - - 5 12 31 46
Net Investment Income 49,595 (12,283) (51,175) 40,602 44,739 43
Total Additions 60,889 567 (38,046) 54,230 $61,915 $20,283
Deductions 2007 2008 2009 2010 2011 2012
Benefi t Payments 37,187 39,367 42,547 45,582 46,754 48,867
Refunds 47 85 69 144 58 149
Administrative Expenses 126 137 122 130 124 73
Capital Project Expenses - - - - 1 -
Other Expenses - - - - - -
Total Deductions 37,360 39,589 42,738 45,856 46,937 49,089
Total Changes in Plan Net Assets $23,529 $(39,022) $(80,784) $8,374 $14,978 $(28,806)
SPRS Insurance Fund
Additions 2007 2008 2009 2010 2011 2012
Employer Contributions $6,489 $7,329 $7,414 $8,369 $10,051 10,810
Net Investment Income 21,876 (11,440) (28,166) 13,085 24,773 (1,458)
Member Drug Reimbursement 361 184 229 274 318 279
Insurance Appropriation - - - - - -
Premiums Rec'd from Retirees 8 9 23 16 18 20
Total Additions 28,734 (3,918) (20,500) 21,744 $35,160 $9,651
Deductions
Benefi t Payments 6,515 6,768 7,476 10,769 12,172 10,791
Administrative Expenses 105 106 124 147 179 201
Total Deductions 6,620 6,874 7,600 10,916 12,351 10,992
Total Changes in Plan Net Assets $22,114 $(10,792) $28,100 $10,828 $22,809 $(1,341)
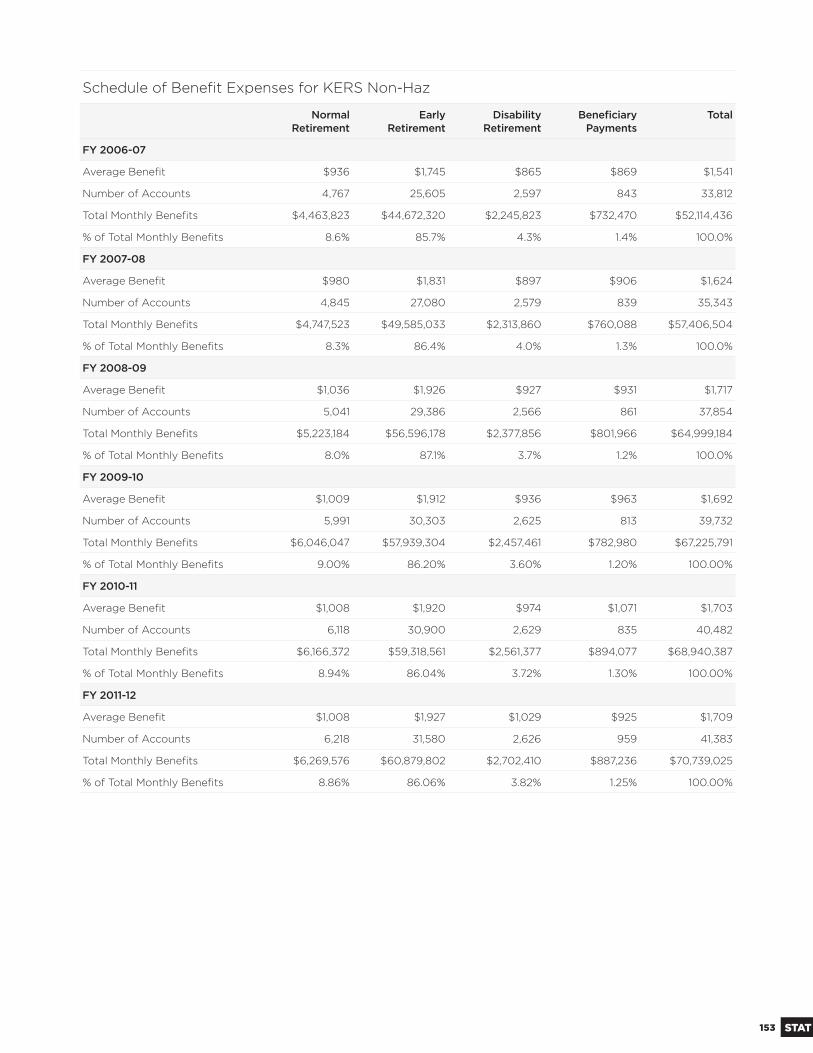
153 STAT
Schedule of Benefi t Expenses for KERS Non-Haz
NormalRetirement
EarlyRetirement
DisabilityRetirement
Benefi ciaryPayments
Total
FY 2006-07
Average Benefi t $936 $1,745 $865 $869 $1,541
Number of Accounts 4,767 25,605 2,597 843 33,812
Total Monthly Benefi ts $4,463,823 $44,672,320 $2,245,823 $732,470 $52,114,436
% of Total Monthly Benefi ts 8.6% 85.7% 4.3% 1.4% 100.0%
FY 2007-08
Average Benefi t $980 $1,831 $897 $906 $1,624
Number of Accounts 4,845 27,080 2,579 839 35,343
Total Monthly Benefi ts $4,747,523 $49,585,033 $2,313,860 $760,088 $57,406,504
% of Total Monthly Benefi ts 8.3% 86.4% 4.0% 1.3% 100.0%
FY 2008-09
Average Benefi t $1,036 $1,926 $927 $931 $1,717
Number of Accounts 5,041 29,386 2,566 861 37,854
Total Monthly Benefi ts $5,223,184 $56,596,178 $2,377,856 $801,966 $64,999,184
% of Total Monthly Benefi ts 8.0% 87.1% 3.7% 1.2% 100.0%
FY 2009-10
Average Benefi t $1,009 $1,912 $936 $963 $1,692
Number of Accounts 5,991 30,303 2,625 813 39,732
Total Monthly Benefi ts $6,046,047 $57,939,304 $2,457,461 $782,980 $67,225,791
% of Total Monthly Benefi ts 9.00% 86.20% 3.60% 1.20% 100.00%
FY 2010-11
Average Benefi t $1,008 $1,920 $974 $1,071 $1,703
Number of Accounts 6,118 30,900 2,629 835 40,482
Total Monthly Benefi ts $6,166,372 $59,318,561 $2,561,377 $894,077 $68,940,387
% of Total Monthly Benefi ts 8.94% 86.04% 3.72% 1.30% 100.00%
FY 2011-12
Average Benefi t $1,008 $1,927 $1,029 $925 $1,709
Number of Accounts 6,218 31,580 2,626 959 41,383
Total Monthly Benefi ts $6,269,576 $60,879,802 $2,702,410 $887,236 $70,739,025
% of Total Monthly Benefi ts 8.86% 86.06% 3.82% 1.25% 100.00%

154STAT
Schedule of Benefi t Expenses for KERS Haz
NormalRetirement
EarlyRetirement
DisabilityRetirement
Benefi ciaryPayments
Total
FY 2006-07
Average Benefi t $862 $1,391 $540 $731 $1,038
Number of Accounts 1,116 854 167 76 2,213
Total Monthly Benefi ts $962,085 $1,188,289 $90,109 $55,536 $2,296,019
% of Total Monthly Benefi ts 41.9% 51.8% 3.9% 2.4% 100.0%
FY 2007-08
Average Benefi t $912 $1,455 $549 $751 $1,094
Number of Accounts 1,231 952 173 78 2,434
Total Monthly Benefi ts $1,123,281 $1,384,856 $94,999 $58,567 $2,661,703
% of Total Monthly Benefi ts 42.2% 52.0% 3.6% 2.2% 100.0%
FY 2008-09
Average Benefi t $941 $1,517 $576 $778 $1,143
Number of Accounts 1,353 1,066 173 74 2,666
Total Monthly Benefi ts $1,272,796 $1,617,453 $99,607 $57,607 $3,047,462
% of Total Monthly Benefi ts 41.8% 53.1% 3.3% 1.8% 100.0%
FY 2009-10
Average Benefi t $933 $1,489 $593 843 $1,137
Number of Accounts 1,446 1,146 157 75 2,824
Total Monthly Benefi ts $1,348,511 $1,706,876 $93,064 $63,194 $3,211,645
% of Total Monthly Benefi ts 42.00% 53.10% 2.90% 2.00% 100.00%
FY 2010-11
Average Benefi t $957 $1,526 $600 $814 $1,166
Number of Accounts 1,571 1,240 158 79 3,048
Total Monthly Benefi ts $1,503,160 $1,892,300 $94,766 $64,299 $3,554,525
% of Total Monthly Benefi ts 42.29% 53.24% 2.66% 1.81% 100.00%
FY 2011-12
Average Benefi t $976.67 $1,541.49 $581 $721 $1,179
Number of Accounts 1,657 1,339 180 92 3,268
Total Monthly Benefi ts $1,618,343 $2,064,050 $104,644 $66,409 $3,853,449
% of Total Monthly Benefi ts 42.00% 53.56% 2.72% 1.72% 100.00%
These tables (pages 153-154) include individuals receiving a monthly benefi t as of June 30 in the indicated fi scal year. Retired reemployed members and individuals deceased prior to June 2012 are not included; therefore, the numbers in this section may diff er slightly from the numbers in the Financial and Actuarial Sections. The information for the current year will diff er from the benefi t payment totals listed in the Deduction by Source. A single member may have multiple accounts, which contribute to one pension.

155 STAT
Schedule of Benefi t Expenses for CERS Non-Haz
NormalRetirement
EarlyRetirement
DisabilityRetirement
Benefi ciaryPayments
Total
FY 2006-07
Average Benefi t $509 $938 $747 $540 $817
Number of Accounts 7,694 23,460 3,612 864 35,630
Total Monthly Benefi ts $3,919,356 $21,999,359 $2,696,721 $484,037 $29,099,472
% of Total Monthly Benefi ts 13.5% 75.6% 9.2% 1.7% 100.0%
FY 2007-08
Average Benefi t $523 $978 $776 $582 $852
Number of Accounts 8,109 25,070 3,679 876 37,734
Total Monthly Benefi ts $4,241,906 24,530,372 2,856,173 510,523 32,138,704
% of Total Monthly Benefi ts 13.2% 76.3% 8.9% 1.6% 100.0%
FY 2008-09
Average Benefi t $547 $1,021 $804 $613 $890
Number of Accounts 8,471 26,720 3,728 917 39,836
Total Monthly Benefi ts $4,634,447 $27,268,861 $2,998,565 $561,804 $35,463,676
% of Total Monthly Benefi ts 13.1% 76.9% 8.5% 1.5% 100.0%
FY 2009-10
Average Benefi t $570 $1,022 $835 $623 $898
Number of Accounts 9,418 28,747 3,951 836 42,952
Total Monthly Benefi ts $5,372,501 $29,377,417 $3,298,478 $520,995 $38,569,391
% of Total Monthly Benefi ts 13.90% 76.20% 8.60% 1.30% 100.00%
FY 2010-11
Average Benefi t $577 $1,031 $847 $651 $906
Number of Accounts 10,054 30,224 4,095 873 45,246
Total Monthly Benefi ts $5,802,568 $31,149,398 $3,469,974 $568,188 $40,990,128
% of Total Monthly Benefi ts 14.16% 75.99% 8.47% 1.38% 100.00%
FY 2011-12
Average Benefi t $587 $1,039 $870 $636 $914
Number of Accounts 10,620 31,797 4,280 1,052 47,749
Total Monthly Benefi ts $6,237,369 $33,041,035 $3,724,859 $669,377 $43,672,642
% of Total Monthly Benefi ts 14.28% 75.66% 8.53% 1.53% 100.00%
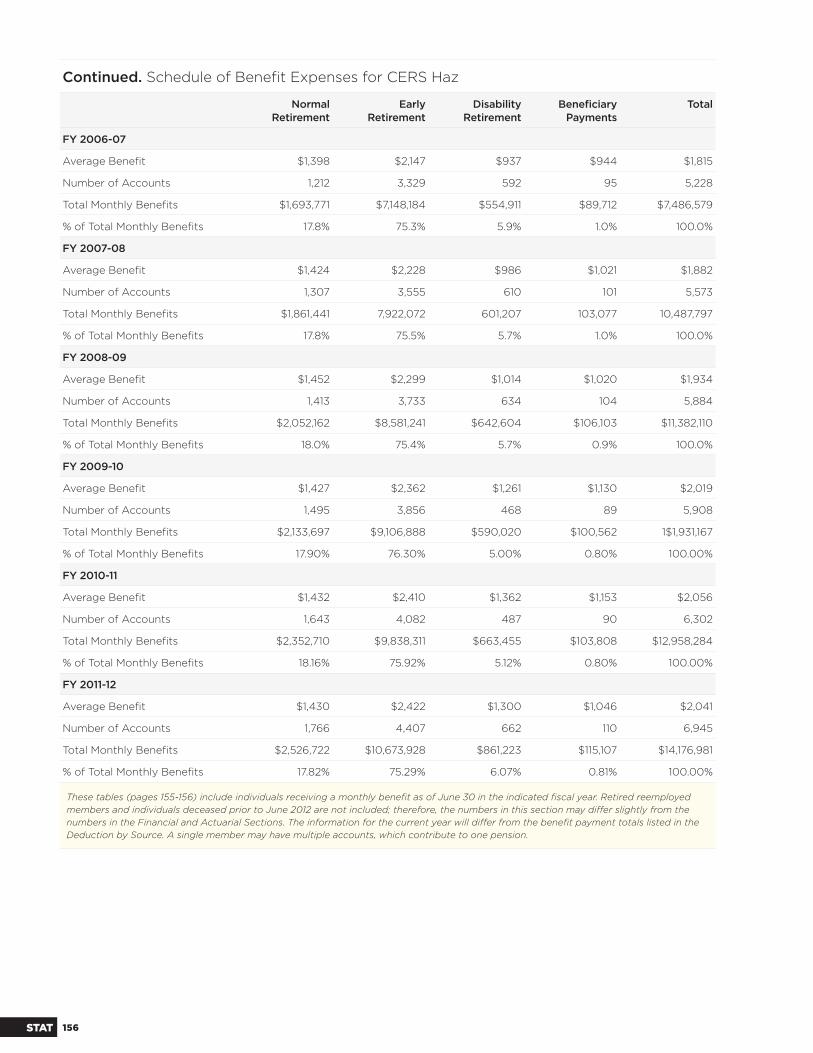
156STAT
Continued. Schedule of Benefi t Expenses for CERS Haz
NormalRetirement
EarlyRetirement
DisabilityRetirement
Benefi ciaryPayments
Total
FY 2006-07
Average Benefi t $1,398 $2,147 $937 $944 $1,815
Number of Accounts 1,212 3,329 592 95 5,228
Total Monthly Benefi ts $1,693,771 $7,148,184 $554,911 $89,712 $7,486,579
% of Total Monthly Benefi ts 17.8% 75.3% 5.9% 1.0% 100.0%
FY 2007-08
Average Benefi t $1,424 $2,228 $986 $1,021 $1,882
Number of Accounts 1,307 3,555 610 101 5,573
Total Monthly Benefi ts $1,861,441 7,922,072 601,207 103,077 10,487,797
% of Total Monthly Benefi ts 17.8% 75.5% 5.7% 1.0% 100.0%
FY 2008-09
Average Benefi t $1,452 $2,299 $1,014 $1,020 $1,934
Number of Accounts 1,413 3,733 634 104 5,884
Total Monthly Benefi ts $2,052,162 $8,581,241 $642,604 $106,103 $11,382,110
% of Total Monthly Benefi ts 18.0% 75.4% 5.7% 0.9% 100.0%
FY 2009-10
Average Benefi t $1,427 $2,362 $1,261 $1,130 $2,019
Number of Accounts 1,495 3,856 468 89 5,908
Total Monthly Benefi ts $2,133,697 $9,106,888 $590,020 $100,562 1$1,931,167
% of Total Monthly Benefi ts 17.90% 76.30% 5.00% 0.80% 100.00%
FY 2010-11
Average Benefi t $1,432 $2,410 $1,362 $1,153 $2,056
Number of Accounts 1,643 4,082 487 90 6,302
Total Monthly Benefi ts $2,352,710 $9,838,311 $663,455 $103,808 $12,958,284
% of Total Monthly Benefi ts 18.16% 75.92% 5.12% 0.80% 100.00%
FY 2011-12
Average Benefi t $1,430 $2,422 $1,300 $1,046 $2,041
Number of Accounts 1,766 4,407 662 110 6,945
Total Monthly Benefi ts $2,526,722 $10,673,928 $861,223 $115,107 $14,176,981
% of Total Monthly Benefi ts 17.82% 75.29% 6.07% 0.81% 100.00%
These tables (pages 155-156) include individuals receiving a monthly benefi t as of June 30 in the indicated fi scal year. Retired reemployed members and individuals deceased prior to June 2012 are not included; therefore, the numbers in this section may diff er slightly from the numbers in the Financial and Actuarial Sections. The information for the current year will diff er from the benefi t payment totals listed in the Deduction by Source. A single member may have multiple accounts, which contribute to one pension.
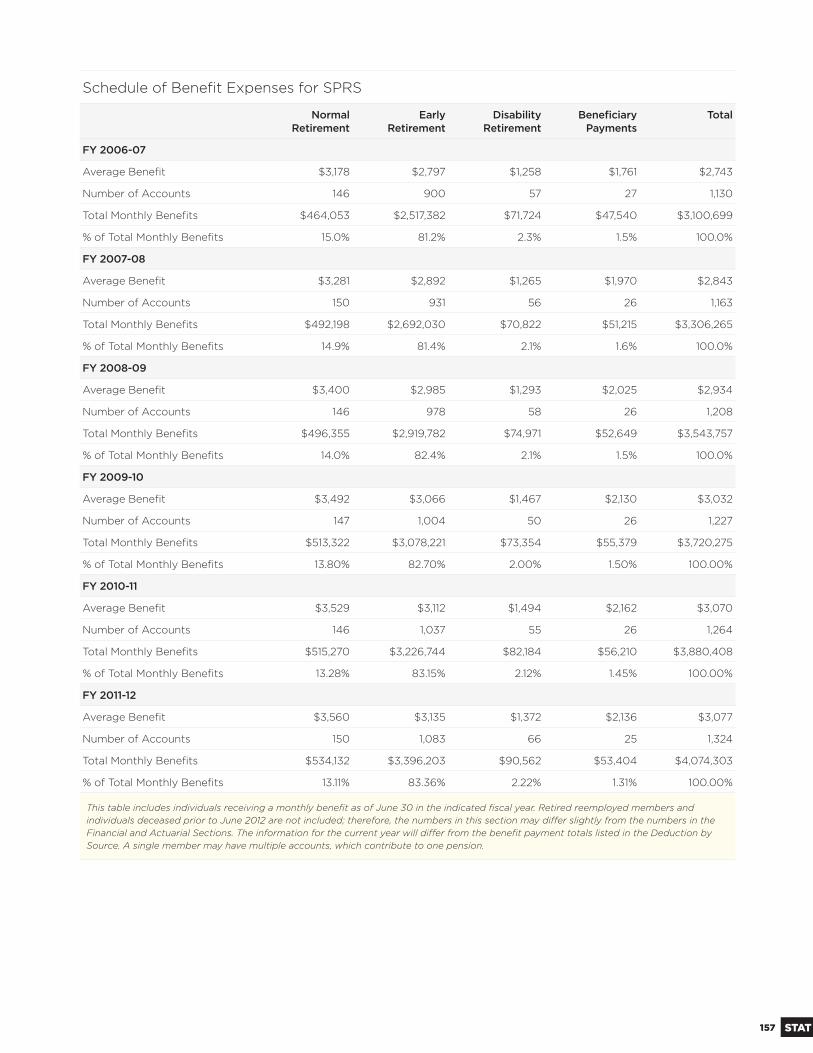
157 STAT
Schedule of Benefi t Expenses for SPRS
NormalRetirement
EarlyRetirement
DisabilityRetirement
Benefi ciaryPayments
Total
FY 2006-07
Average Benefi t $3,178 $2,797 $1,258 $1,761 $2,743
Number of Accounts 146 900 57 27 1,130
Total Monthly Benefi ts $464,053 $2,517,382 $71,724 $47,540 $3,100,699
% of Total Monthly Benefi ts 15.0% 81.2% 2.3% 1.5% 100.0%
FY 2007-08
Average Benefi t $3,281 $2,892 $1,265 $1,970 $2,843
Number of Accounts 150 931 56 26 1,163
Total Monthly Benefi ts $492,198 $2,692,030 $70,822 $51,215 $3,306,265
% of Total Monthly Benefi ts 14.9% 81.4% 2.1% 1.6% 100.0%
FY 2008-09
Average Benefi t $3,400 $2,985 $1,293 $2,025 $2,934
Number of Accounts 146 978 58 26 1,208
Total Monthly Benefi ts $496,355 $2,919,782 $74,971 $52,649 $3,543,757
% of Total Monthly Benefi ts 14.0% 82.4% 2.1% 1.5% 100.0%
FY 2009-10
Average Benefi t $3,492 $3,066 $1,467 $2,130 $3,032
Number of Accounts 147 1,004 50 26 1,227
Total Monthly Benefi ts $513,322 $3,078,221 $73,354 $55,379 $3,720,275
% of Total Monthly Benefi ts 13.80% 82.70% 2.00% 1.50% 100.00%
FY 2010-11
Average Benefi t $3,529 $3,112 $1,494 $2,162 $3,070
Number of Accounts 146 1,037 55 26 1,264
Total Monthly Benefi ts $515,270 $3,226,744 $82,184 $56,210 $3,880,408
% of Total Monthly Benefi ts 13.28% 83.15% 2.12% 1.45% 100.00%
FY 2011-12
Average Benefi t $3,560 $3,135 $1,372 $2,136 $3,077
Number of Accounts 150 1,083 66 25 1,324
Total Monthly Benefi ts $534,132 $3,396,203 $90,562 $53,404 $4,074,303
% of Total Monthly Benefi ts 13.11% 83.36% 2.22% 1.31% 100.00%
This table includes individuals receiving a monthly benefi t as of June 30 in the indicated fi scal year. Retired reemployed members and individuals deceased prior to June 2012 are not included; therefore, the numbers in this section may diff er slightly from the numbers in the Financial and Actuarial Sections. The information for the current year will diff er from the benefi t payment totals listed in the Deduction by Source. A single member may have multiple accounts, which contribute to one pension.
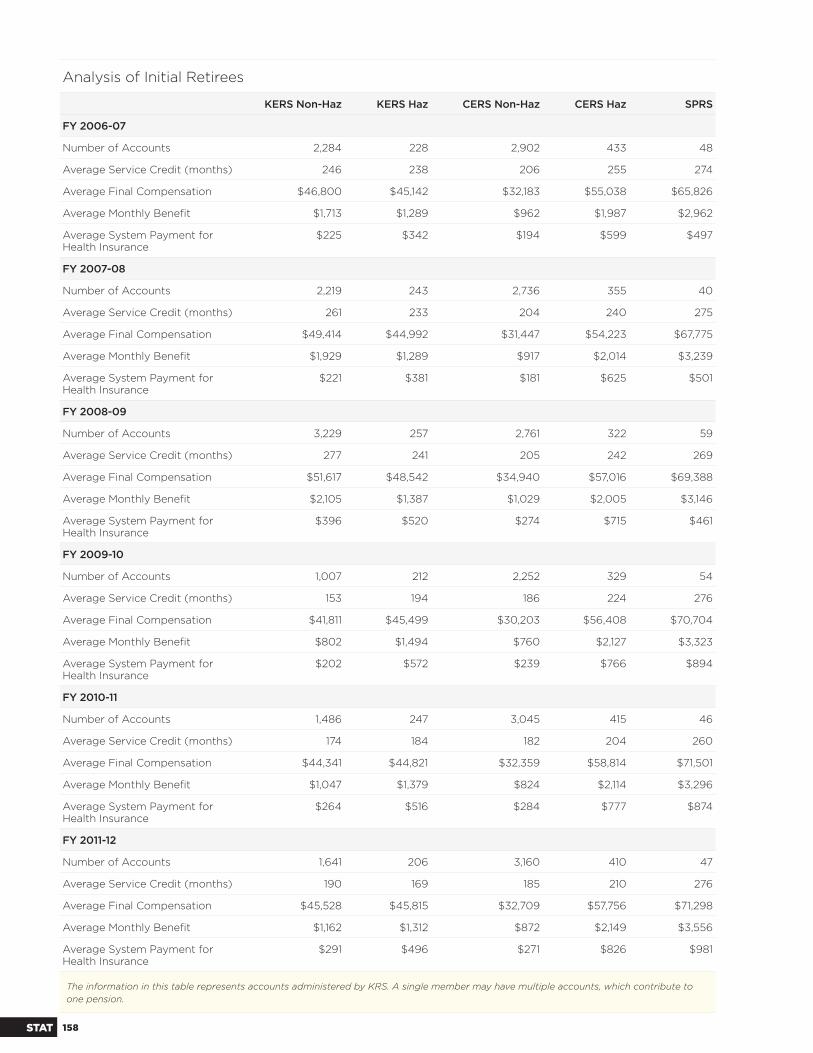
158STAT
Analysis of Initial Retirees
KERS Non-Haz KERS Haz CERS Non-Haz CERS Haz SPRS
FY 2006-07
Number of Accounts 2,284 228 2,902 433 48
Average Service Credit (months) 246 238 206 255 274
Average Final Compensation $46,800 $45,142 $32,183 $55,038 $65,826
Average Monthly Benefi t $1,713 $1,289 $962 $1,987 $2,962
Average System Payment for Health Insurance
$225 $342 $194 $599 $497
FY 2007-08
Number of Accounts 2,219 243 2,736 355 40
Average Service Credit (months) 261 233 204 240 275
Average Final Compensation $49,414 $44,992 $31,447 $54,223 $67,775
Average Monthly Benefi t $1,929 $1,289 $917 $2,014 $3,239
Average System Payment for Health Insurance
$221 $381 $181 $625 $501
FY 2008-09
Number of Accounts 3,229 257 2,761 322 59
Average Service Credit (months) 277 241 205 242 269
Average Final Compensation $51,617 $48,542 $34,940 $57,016 $69,388
Average Monthly Benefi t $2,105 $1,387 $1,029 $2,005 $3,146
Average System Payment for Health Insurance
$396 $520 $274 $715 $461
FY 2009-10
Number of Accounts 1,007 212 2,252 329 54
Average Service Credit (months) 153 194 186 224 276
Average Final Compensation $41,811 $45,499 $30,203 $56,408 $70,704
Average Monthly Benefi t $802 $1,494 $760 $2,127 $3,323
Average System Payment for Health Insurance
$202 $572 $239 $766 $894
FY 2010-11
Number of Accounts 1,486 247 3,045 415 46
Average Service Credit (months) 174 184 182 204 260
Average Final Compensation $44,341 $44,821 $32,359 $58,814 $71,501
Average Monthly Benefi t $1,047 $1,379 $824 $2,114 $3,296
Average System Payment for Health Insurance
$264 $516 $284 $777 $874
FY 2011-12
Number of Accounts 1,641 206 3,160 410 47
Average Service Credit (months) 190 169 185 210 276
Average Final Compensation $45,528 $45,815 $32,709 $57,756 $71,298
Average Monthly Benefi t $1,162 $1,312 $872 $2,149 $3,556
Average System Payment for Health Insurance
$291 $496 $271 $826 $981
The information in this table represents accounts administered by KRS. A single member may have multiple accounts, which contribute to one pension.
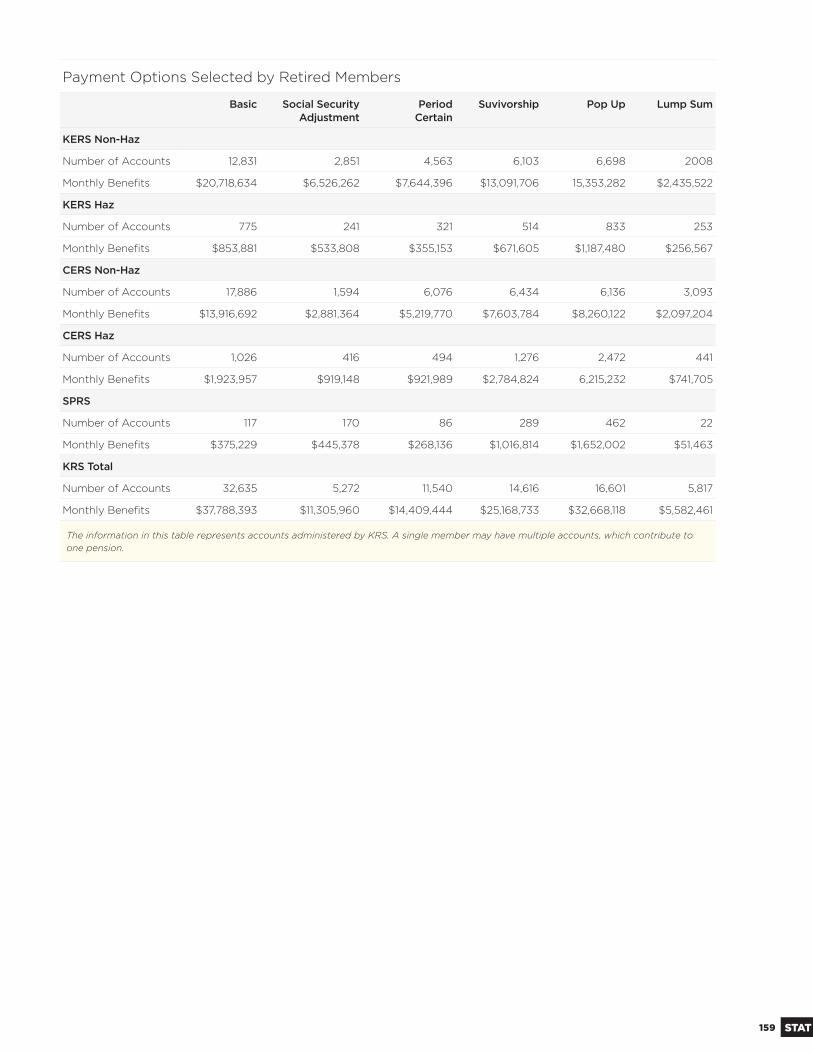
159 STAT
Payment Options Selected by Retired Members
Basic Social Security Adjustment
Period Certain
Suvivorship Pop Up Lump Sum
KERS Non-Haz
Number of Accounts 12,831 2,851 4,563 6,103 6,698 2008
Monthly Benefi ts $20,718,634 $6,526,262 $7,644,396 $13,091,706 15,353,282 $2,435,522
KERS Haz
Number of Accounts 775 241 321 514 833 253
Monthly Benefi ts $853,881 $533,808 $355,153 $671,605 $1,187,480 $256,567
CERS Non-Haz
Number of Accounts 17,886 1,594 6,076 6,434 6,136 3,093
Monthly Benefi ts $13,916,692 $2,881,364 $5,219,770 $7,603,784 $8,260,122 $2,097,204
CERS Haz
Number of Accounts 1,026 416 494 1,276 2,472 441
Monthly Benefi ts $1,923,957 $919,148 $921,989 $2,784,824 6,215,232 $741,705
SPRS
Number of Accounts 117 170 86 289 462 22
Monthly Benefi ts $375,229 $445,378 $268,136 $1,016,814 $1,652,002 $51,463
KRS Total
Number of Accounts 32,635 5,272 11,540 14,616 16,601 5,817
Monthly Benefi ts $37,788,393 $11,305,960 $14,409,444 $25,168,733 $32,668,118 $5,582,461
The information in this table represents accounts administered by KRS. A single member may have multiple accounts, which contribute to one pension.
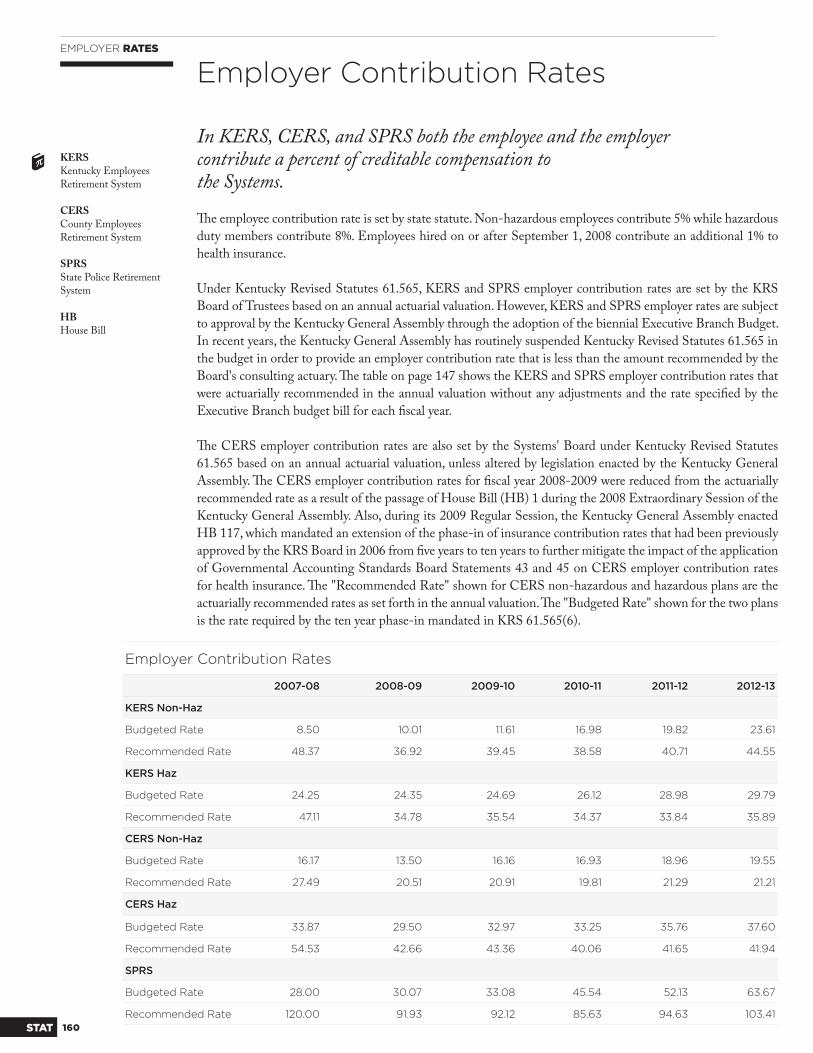
160STAT
Th e employee contribution rate is set by state statute. Non-hazardous employees contribute 5% while hazardous
duty members contribute 8%. Employees hired on or after September 1, 2008 contribute an additional 1% to
health insurance.
Under Kentucky Revised Statutes 61.565, KERS and SPRS employer contribution rates are set by the KRS
Board of Trustees based on an annual actuarial valuation. However, KERS and SPRS employer rates are subject
to approval by the Kentucky General Assembly through the adoption of the biennial Executive Branch Budget.
In recent years, the Kentucky General Assembly has routinely suspended Kentucky Revised Statutes 61.565 in
the budget in order to provide an employer contribution rate that is less than the amount recommended by the
Board's consulting actuary. Th e table on page 147 shows the KERS and SPRS employer contribution rates that
were actuarially recommended in the annual valuation without any adjustments and the rate specifi ed by the
Executive Branch budget bill for each fi scal year.
Th e CERS employer contribution rates are also set by the Systems' Board under Kentucky Revised Statutes
61.565 based on an annual actuarial valuation, unless altered by legislation enacted by the Kentucky General
Assembly. Th e CERS employer contribution rates for fi scal year 2008-2009 were reduced from the actuarially
recommended rate as a result of the passage of House Bill (HB) 1 during the 2008 Extraordinary Session of the
Kentucky General Assembly. Also, during its 2009 Regular Session, the Kentucky General Assembly enacted
HB 117, which mandated an extension of the phase-in of insurance contribution rates that had been previously
approved by the KRS Board in 2006 from fi ve years to ten years to further mitigate the impact of the application
of Governmental Accounting Standards Board Statements 43 and 45 on CERS employer contribution rates
for health insurance. Th e "Recommended Rate" shown for CERS non-hazardous and hazardous plans are the
actuarially recommended rates as set forth in the annual valuation. Th e "Budgeted Rate" shown for the two plans
is the rate required by the ten year phase-in mandated in KRS 61.565(6).
EMPLOYER RATES
Employer Contribution Rates
KERSKentucky Employees Retirement System
CERSCounty Employees Retirement System
SPRSState Police Retirement System
HBHouse Bill
In KERS, CERS, and SPRS both the employee and the employer contribute a percent of creditable compensation tothe Systems.
Employer Contribution Rates
2007-08 2008-09 2009-10 2010-11 2011-12 2012-13
KERS Non-Haz
Budgeted Rate 8.50 10.01 11.61 16.98 19.82 23.61
Recommended Rate 48.37 36.92 39.45 38.58 40.71 44.55
KERS Haz
Budgeted Rate 24.25 24.35 24.69 26.12 28.98 29.79
Recommended Rate 47.11 34.78 35.54 34.37 33.84 35.89
CERS Non-Haz
Budgeted Rate 16.17 13.50 16.16 16.93 18.96 19.55
Recommended Rate 27.49 20.51 20.91 19.81 21.29 21.21
CERS Haz
Budgeted Rate 33.87 29.50 32.97 33.25 35.76 37.60
Recommended Rate 54.53 42.66 43.36 40.06 41.65 41.94
SPRS
Budgeted Rate 28.00 30.07 33.08 45.54 52.13 63.67
Recommended Rate 120.00 91.93 92.12 85.63 94.63 103.41
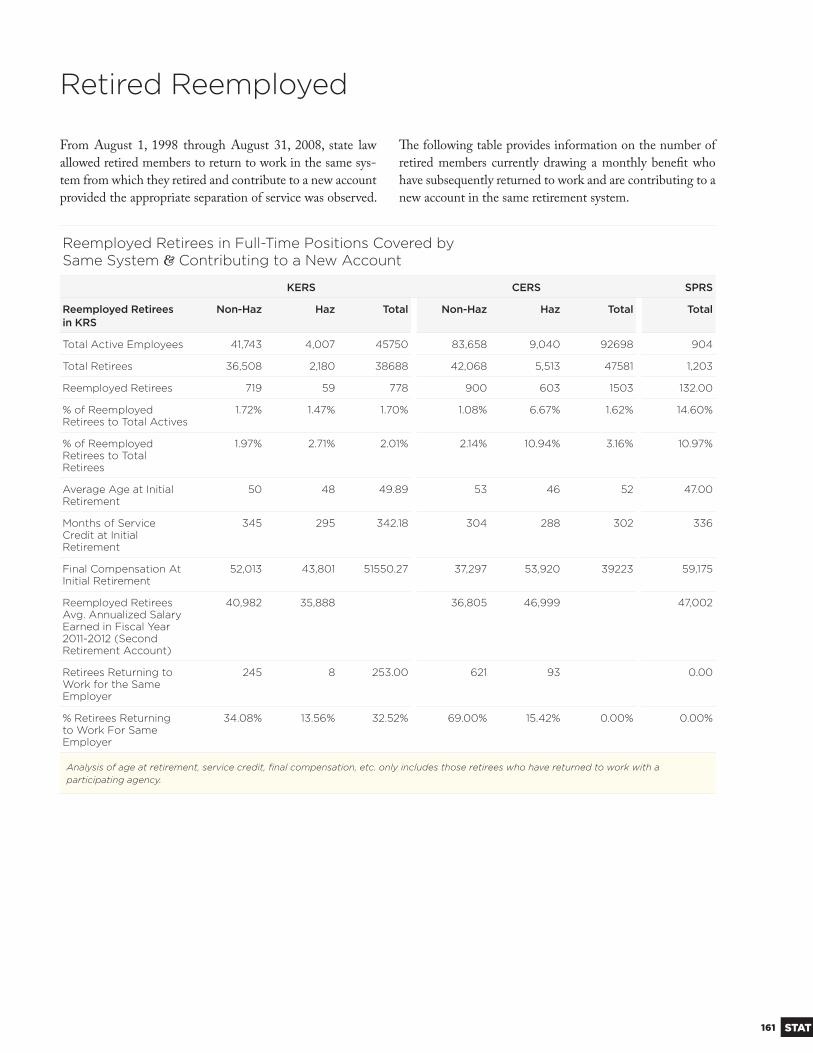
161 STAT
From August 1, 1998 through August 31, 2008, state law
allowed retired members to return to work in the same sys-
tem from which they retired and contribute to a new account
provided the appropriate separation of service was observed.
Th e following table provides information on the number of
retired members currently drawing a monthly benefi t who
have subsequently returned to work and are contributing to a
new account in the same retirement system.
Retired Reemployed
Reemployed Retirees in Full-Time Positions Covered bySame System & Contributing to a New Account
KERS CERS SPRS
Reemployed Retireesin KRS
Non-Haz Haz Total Non-Haz Haz Total Total
Total Active Employees 41,743 4,007 45750 83,658 9,040 92698 904
Total Retirees 36,508 2,180 38688 42,068 5,513 47581 1,203
Reemployed Retirees 719 59 778 900 603 1503 132.00
% of Reemployed Retirees to Total Actives
1.72% 1.47% 1.70% 1.08% 6.67% 1.62% 14.60%
% of Reemployed Retirees to Total Retirees
1.97% 2.71% 2.01% 2.14% 10.94% 3.16% 10.97%
Average Age at Initial Retirement
50 48 49.89 53 46 52 47.00
Months of Service Credit at Initial Retirement
345 295 342.18 304 288 302 336
Final Compensation At Initial Retirement
52,013 43,801 51550.27 37,297 53,920 39223 59,175
Reemployed Retirees Avg. Annualized Salary Earned in Fiscal Year 2011-2012 (Second Retirement Account)
40,982 35,888 36,805 46,999 47,002
Retirees Returning to Work for the Same Employer
245 8 253.00 621 93 0.00
% Retirees Returning to Work For Same Employer
34.08% 13.56% 32.52% 69.00% 15.42% 0.00% 0.00%
Analysis of age at retirement, service credit, fi nal compensation, etc. only includes those retirees who have returned to work with a participating agency.
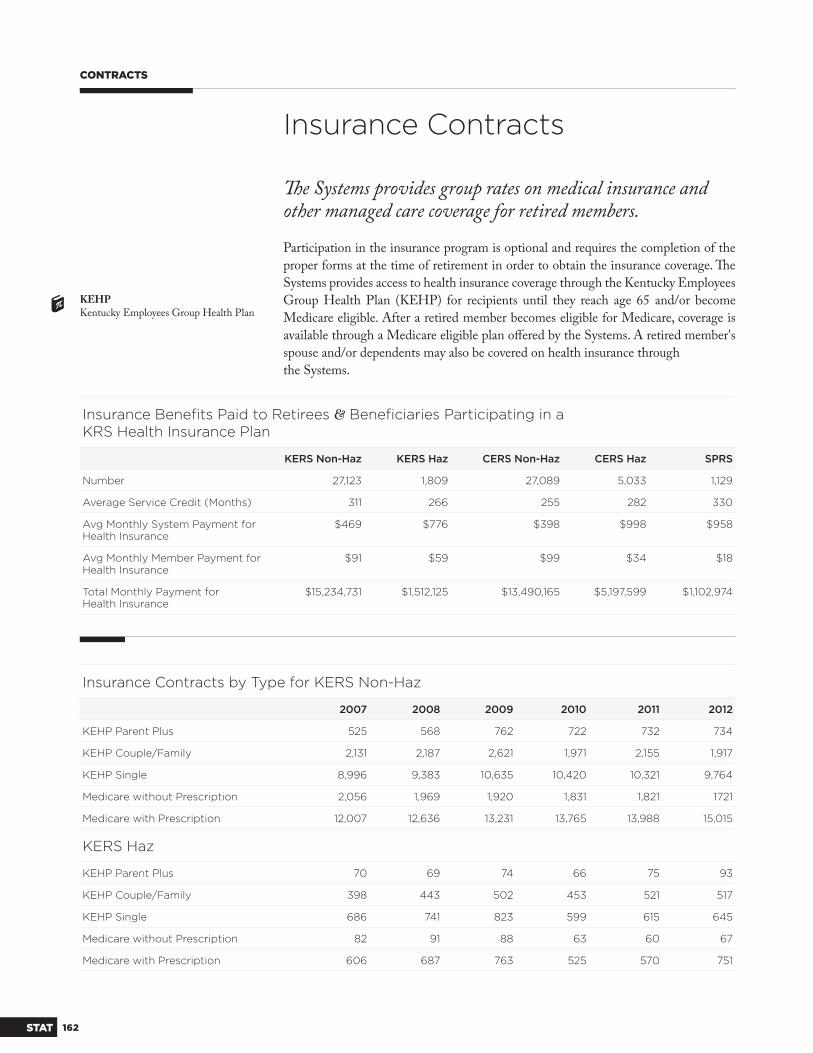
162STAT
Participation in the insurance program is optional and requires the completion of the
proper forms at the time of retirement in order to obtain the insurance coverage. Th e
Systems provides access to health insurance coverage through the Kentucky Employees
Group Health Plan (KEHP) for recipients until they reach age 65 and/or become
Medicare eligible. After a retired member becomes eligible for Medicare, coverage is
available through a Medicare eligible plan off ered by the Systems. A retired member's
spouse and/or dependents may also be covered on health insurance through
the Systems.
CONTRACTS
Insurance Contracts
KEHPKentucky Employees Group Health Plan
Th e Systems provides group rates on medical insurance and other managed care coverage for retired members.
Insurance Benefi ts Paid to Retirees & Benefi ciaries Participating in aKRS Health Insurance Plan
KERS Non-Haz KERS Haz CERS Non-Haz CERS Haz SPRS
Number 27,123 1,809 27,089 5,033 1,129
Average Service Credit (Months) 311 266 255 282 330
Avg Monthly System Payment for Health Insurance
$469 $776 $398 $998 $958
Avg Monthly Member Payment for Health Insurance
$91 $59 $99 $34 $18
Total Monthly Payment forHealth Insurance
$15,234,731 $1,512,125 $13,490,165 $5,197,599 $1,102,974
Insurance Contracts by Type for KERS Non-Haz
2007 2008 2009 2010 2011 2012
KEHP Parent Plus 525 568 762 722 732 734
KEHP Couple/Family 2,131 2,187 2,621 1,971 2,155 1,917
KEHP Single 8,996 9,383 10,635 10,420 10,321 9,764
Medicare without Prescription 2,056 1,969 1,920 1,831 1,821 1721
Medicare with Prescription 12,007 12,636 13,231 13,765 13,988 15,015
KERS Haz
KEHP Parent Plus 70 69 74 66 75 93
KEHP Couple/Family 398 443 502 453 521 517
KEHP Single 686 741 823 599 615 645
Medicare without Prescription 82 91 88 63 60 67
Medicare with Prescription 606 687 763 525 570 751
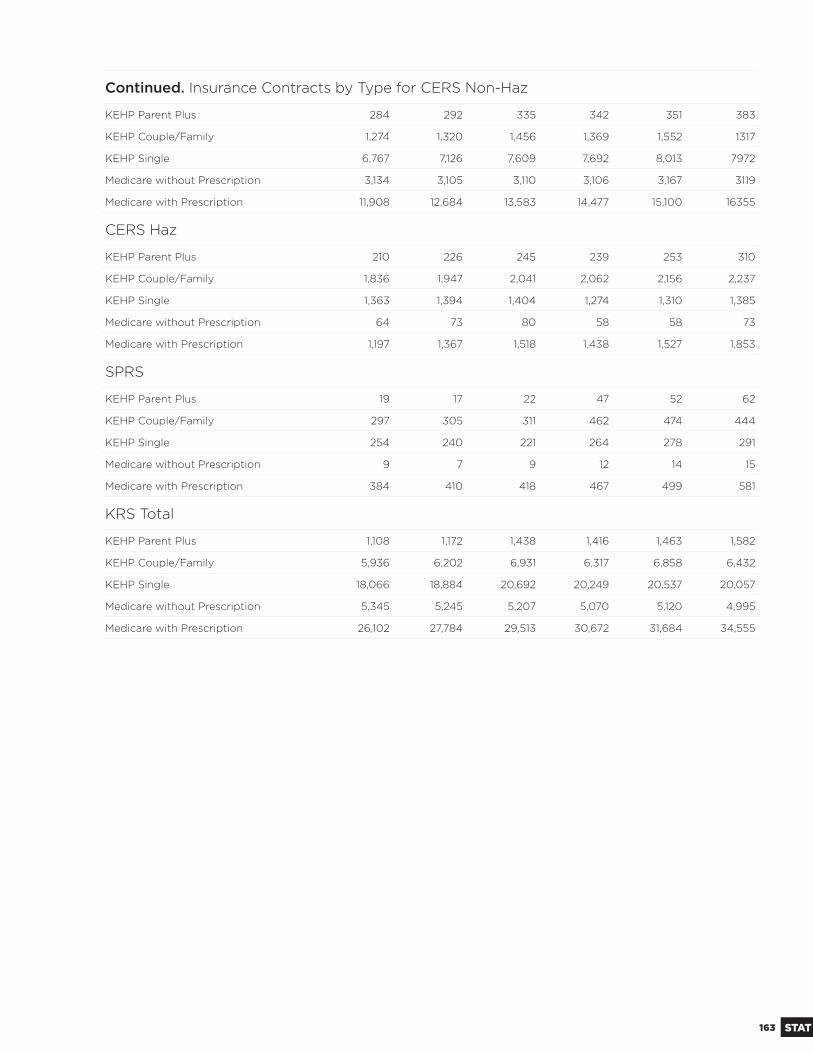
163 STAT
Continued. Insurance Contracts by Type for CERS Non-Haz
KEHP Parent Plus 284 292 335 342 351 383
KEHP Couple/Family 1,274 1,320 1,456 1,369 1,552 1317
KEHP Single 6,767 7,126 7,609 7,692 8,013 7972
Medicare without Prescription 3,134 3,105 3,110 3,106 3,167 3119
Medicare with Prescription 11,908 12,684 13,583 14,477 15,100 16355
CERS Haz
KEHP Parent Plus 210 226 245 239 253 310
KEHP Couple/Family 1,836 1,947 2,041 2,062 2,156 2,237
KEHP Single 1,363 1,394 1,404 1,274 1,310 1,385
Medicare without Prescription 64 73 80 58 58 73
Medicare with Prescription 1,197 1,367 1,518 1,438 1,527 1,853
SPRS
KEHP Parent Plus 19 17 22 47 52 62
KEHP Couple/Family 297 305 311 462 474 444
KEHP Single 254 240 221 264 278 291
Medicare without Prescription 9 7 9 12 14 15
Medicare with Prescription 384 410 418 467 499 581
KRS Total
KEHP Parent Plus 1,108 1,172 1,438 1,416 1,463 1,582
KEHP Couple/Family 5,936 6,202 6,931 6,317 6,858 6,432
KEHP Single 18,066 18,884 20,692 20,249 20,537 20,057
Medicare without Prescription 5,345 5,245 5,207 5,070 5,120 4,995
Medicare with Prescription 26,102 27,784 29,513 30,672 31,684 34,555
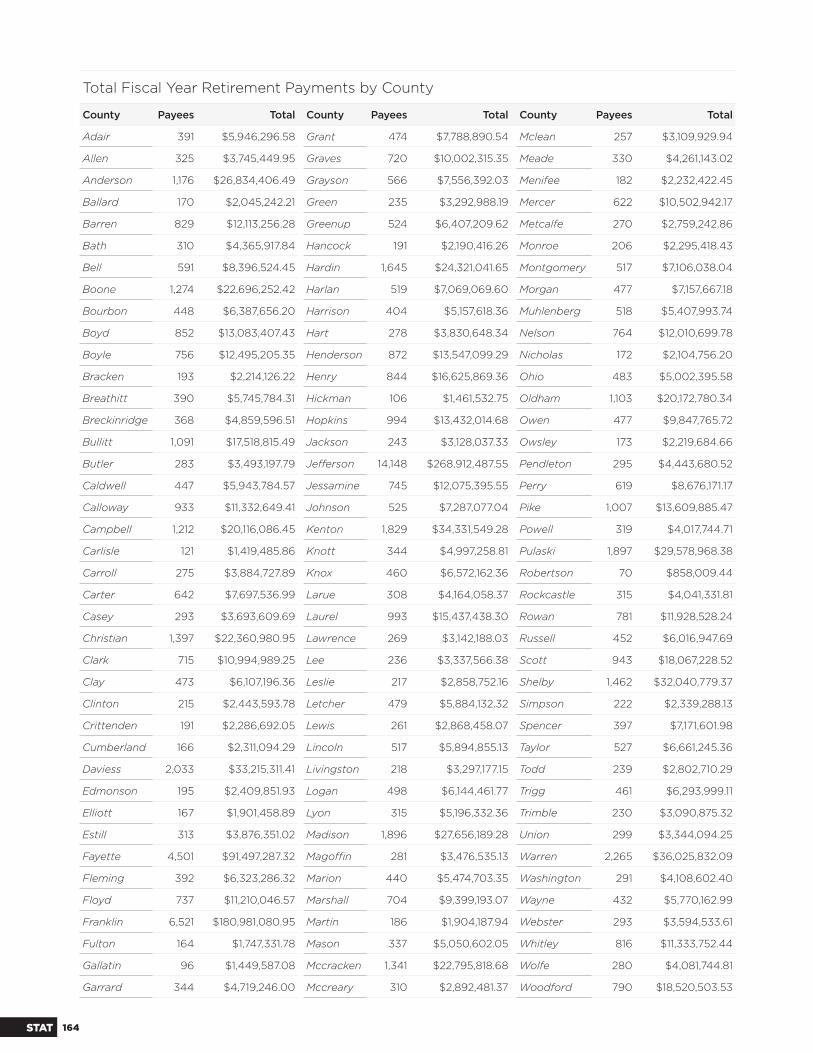
164STAT
Total Fiscal Year Retirement Payments by County
County Payees Total County Payees Total County Payees Total
Adair 391 $5,946,296.58 Grant 474 $7,788,890.54 Mclean 257 $3,109,929.94
Allen 325 $3,745,449.95 Graves 720 $10,002,315.35 Meade 330 $4,261,143.02
Anderson 1,176 $26,834,406.49 Grayson 566 $7,556,392.03 Menifee 182 $2,232,422.45
Ballard 170 $2,045,242.21 Green 235 $3,292,988.19 Mercer 622 $10,502,942.17
Barren 829 $12,113,256.28 Greenup 524 $6,407,209.62 Metcalfe 270 $2,759,242.86
Bath 310 $4,365,917.84 Hancock 191 $2,190,416.26 Monroe 206 $2,295,418.43
Bell 591 $8,396,524.45 Hardin 1,645 $24,321,041.65 Montgomery 517 $7,106,038.04
Boone 1,274 $22,696,252.42 Harlan 519 $7,069,069.60 Morgan 477 $7,157,667.18
Bourbon 448 $6,387,656.20 Harrison 404 $5,157,618.36 Muhlenberg 518 $5,407,993.74
Boyd 852 $13,083,407.43 Hart 278 $3,830,648.34 Nelson 764 $12,010,699.78
Boyle 756 $12,495,205.35 Henderson 872 $13,547,099.29 Nicholas 172 $2,104,756.20
Bracken 193 $2,214,126.22 Henry 844 $16,625,869.36 Ohio 483 $5,002,395.58
Breathitt 390 $5,745,784.31 Hickman 106 $1,461,532.75 Oldham 1,103 $20,172,780.34
Breckinridge 368 $4,859,596.51 Hopkins 994 $13,432,014.68 Owen 477 $9,847,765.72
Bullitt 1,091 $17,518,815.49 Jackson 243 $3,128,037.33 Owsley 173 $2,219,684.66
Butler 283 $3,493,197.79 Jeff erson 14,148 $268,912,487.55 Pendleton 295 $4,443,680.52
Caldwell 447 $5,943,784.57 Jessamine 745 $12,075,395.55 Perry 619 $8,676,171.17
Calloway 933 $11,332,649.41 Johnson 525 $7,287,077.04 Pike 1,007 $13,609,885.47
Campbell 1,212 $20,116,086.45 Kenton 1,829 $34,331,549.28 Powell 319 $4,017,744.71
Carlisle 121 $1,419,485.86 Knott 344 $4,997,258.81 Pulaski 1,897 $29,578,968.38
Carroll 275 $3,884,727.89 Knox 460 $6,572,162.36 Robertson 70 $858,009.44
Carter 642 $7,697,536.99 Larue 308 $4,164,058.37 Rockcastle 315 $4,041,331.81
Casey 293 $3,693,609.69 Laurel 993 $15,437,438.30 Rowan 781 $11,928,528.24
Christian 1,397 $22,360,980.95 Lawrence 269 $3,142,188.03 Russell 452 $6,016,947.69
Clark 715 $10,994,989.25 Lee 236 $3,337,566.38 Scott 943 $18,067,228.52
Clay 473 $6,107,196.36 Leslie 217 $2,858,752.16 Shelby 1,462 $32,040,779.37
Clinton 215 $2,443,593.78 Letcher 479 $5,884,132.32 Simpson 222 $2,339,288.13
Crittenden 191 $2,286,692.05 Lewis 261 $2,868,458.07 Spencer 397 $7,171,601.98
Cumberland 166 $2,311,094.29 Lincoln 517 $5,894,855.13 Taylor 527 $6,661,245.36
Daviess 2,033 $33,215,311.41 Livingston 218 $3,297,177.15 Todd 239 $2,802,710.29
Edmonson 195 $2,409,851.93 Logan 498 $6,144,461.77 Trigg 461 $6,293,999.11
Elliott 167 $1,901,458.89 Lyon 315 $5,196,332.36 Trimble 230 $3,090,875.32
Estill 313 $3,876,351.02 Madison 1,896 $27,656,189.28 Union 299 $3,344,094.25
Fayette 4,501 $91,497,287.32 Magoffi n 281 $3,476,535.13 Warren 2,265 $36,025,832.09
Fleming 392 $6,323,286.32 Marion 440 $5,474,703.35 Washington 291 $4,108,602.40
Floyd 737 $11,210,046.57 Marshall 704 $9,399,193.07 Wayne 432 $5,770,162.99
Franklin 6,521 $180,981,080.95 Martin 186 $1,904,187.94 Webster 293 $3,594,533.61
Fulton 164 $1,747,331.78 Mason 337 $5,050,602.05 Whitley 816 $11,333,752.44
Gallatin 96 $1,449,587.08 Mccracken 1,341 $22,795,818.68 Wolfe 280 $4,081,744.81
Garrard 344 $4,719,246.00 Mccreary 310 $2,892,481.37 Woodford 790 $18,520,503.53
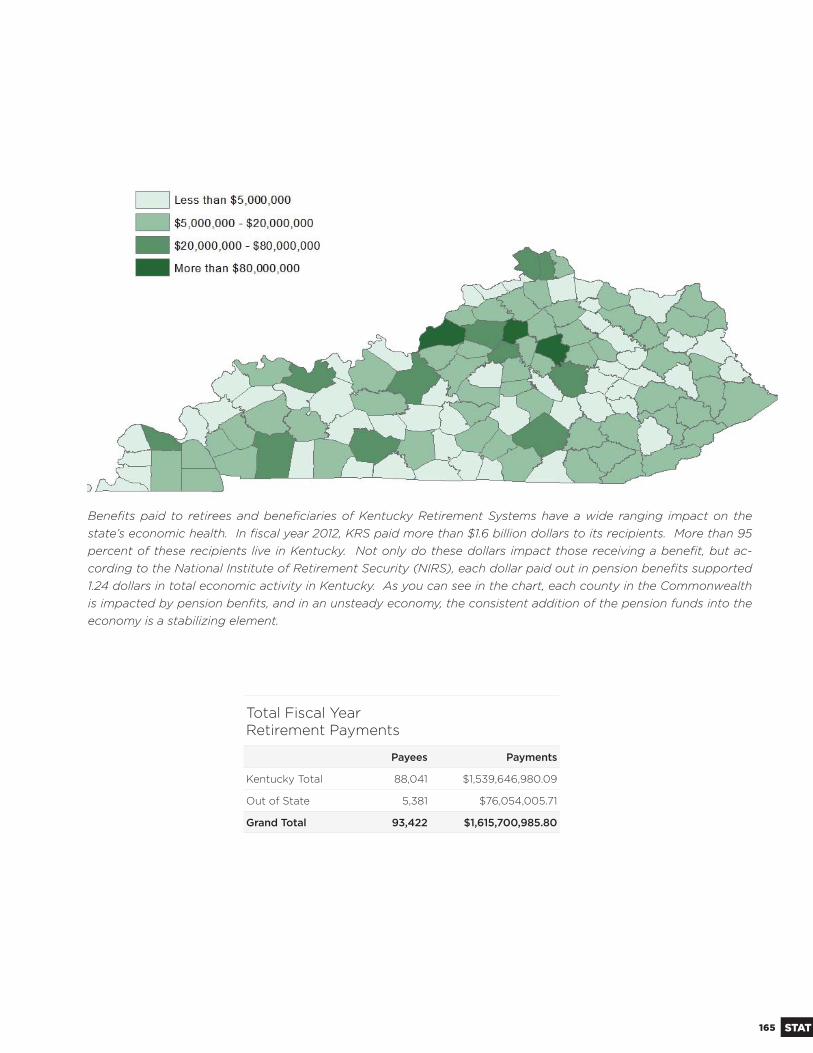
165 STAT
Total Fiscal YearRetirement Payments
Payees Payments
Kentucky Total 88,041 $1,539,646,980.09
Out of State 5,381 $76,054,005.71
Grand Total 93,422 $1,615,700,985.80
Benefi ts paid to retirees and benefi ciaries of Kentucky Retirement Systems have a wide ranging impact on the state’s economic health. In fi scal year 2012, KRS paid more than $1.6 billion dollars to its recipients. More than 95 percent of these recipients live in Kentucky. Not only do these dollars impact those receiving a benefi t, but ac-cording to the National Institute of Retirement Security (NIRS), each dollar paid out in pension benefi ts supported 1.24 dollars in total economic activity in Kentucky. As you can see in the chart, each county in the Commonwealth is impacted by pension benfi ts, and in an unsteady economy, the consistent addition of the pension funds into the economy is a stabilizing element.