


Languages
Pages
Legal


Climate Change and Water Resources
Dr. N. Sai Bhaskar Reddy, CEO, GEO http://e-geo.org
Center for Climate Change and Environment Advisory (CCCEA)Dr. MCR HRD Institute of AP, India
16th
Aug
ust 2
012

Present carbon cycle
SPEED OF EXCHANGE PROCESS
Very fast (less than 1 year)
Fast (1 to 10 years)
Slow (10 to 100 years)
Very slow (more than 100 years)
Storage and flux of carbon(in billions of tones)

Human activity influence
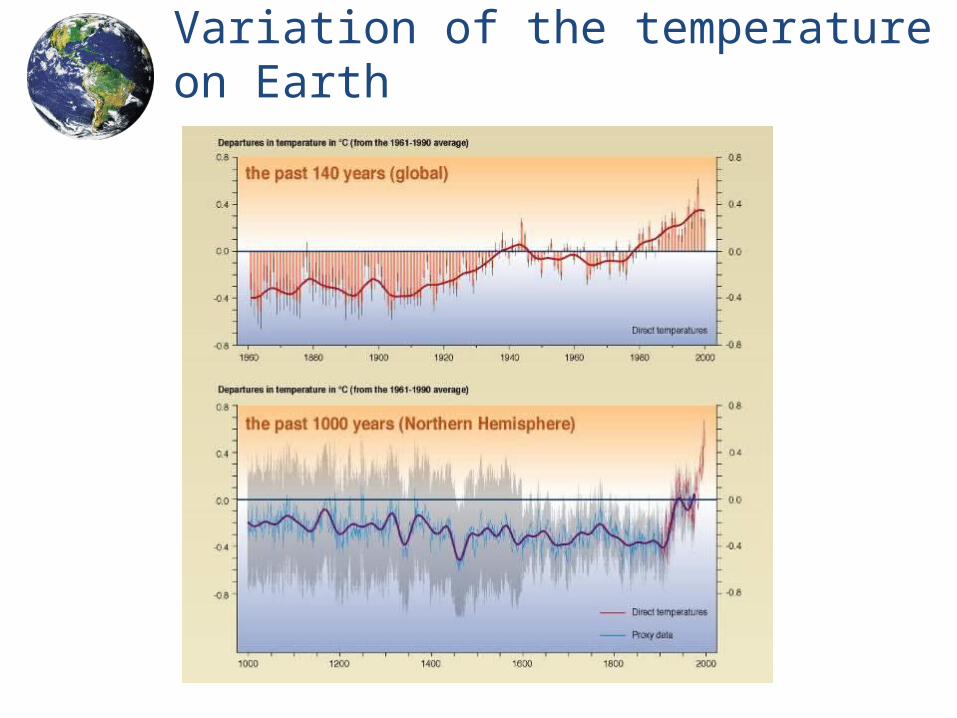
Variation of the temperature on Earth

Temperature trends (1976 to 2000)
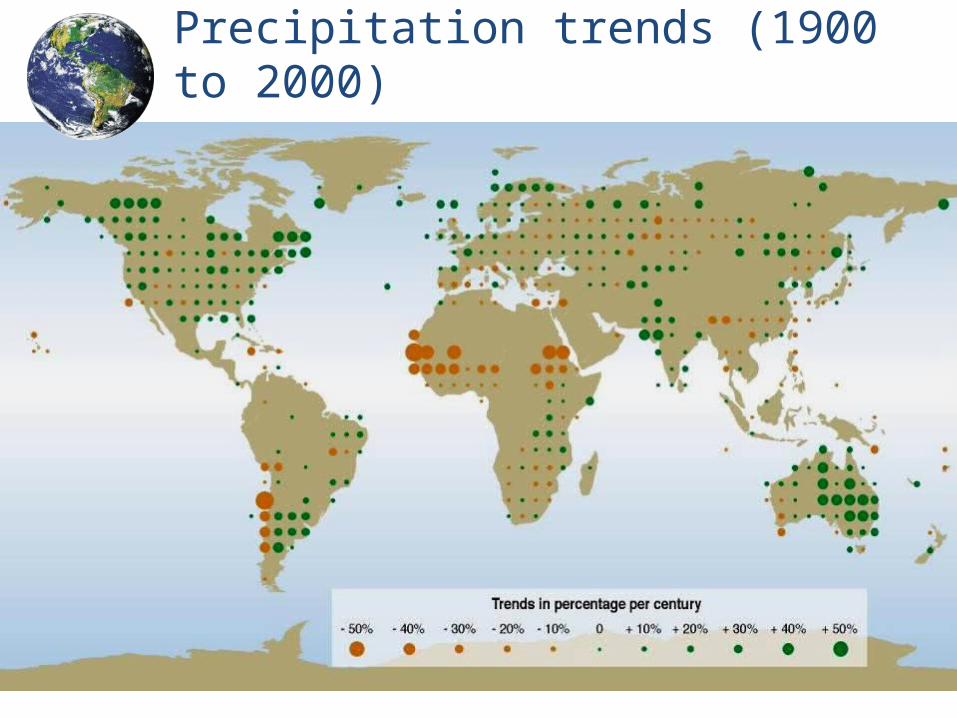
Precipitation trends (1900 to 2000)

Source : IPCC/SRESA2
5 degrees = What separates us from the last glacial era (-15 000 BC)
Models’ forecasts : +1,4 to +5,8 degrees by 2100.
TEMPERATURE PRECIPITATIONS
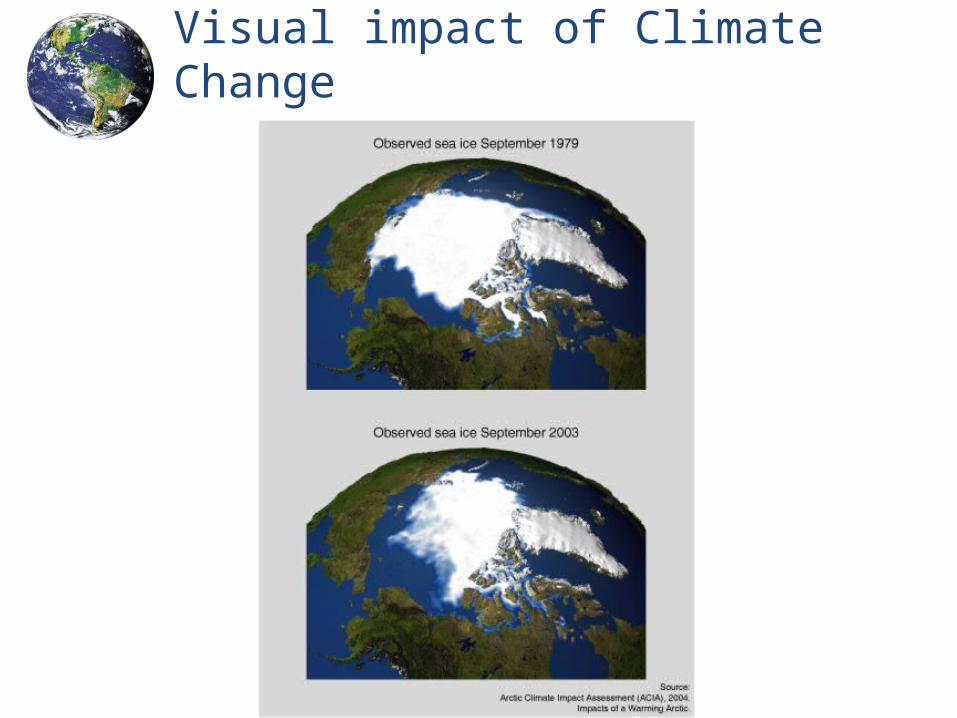
Visual impact of Climate Change

Impact of Climate Change on society
Climate change will cause heavier tropical cyclones.
…Katrina, Rita, Stan, Wilma…

Cost of extreme weather events

Less visual but with major impact
> Temperature increase> Sea level rise> More rain
Agriculture and food securityCrop yields, irrigation demands...
ForestComposition, health and productivity...
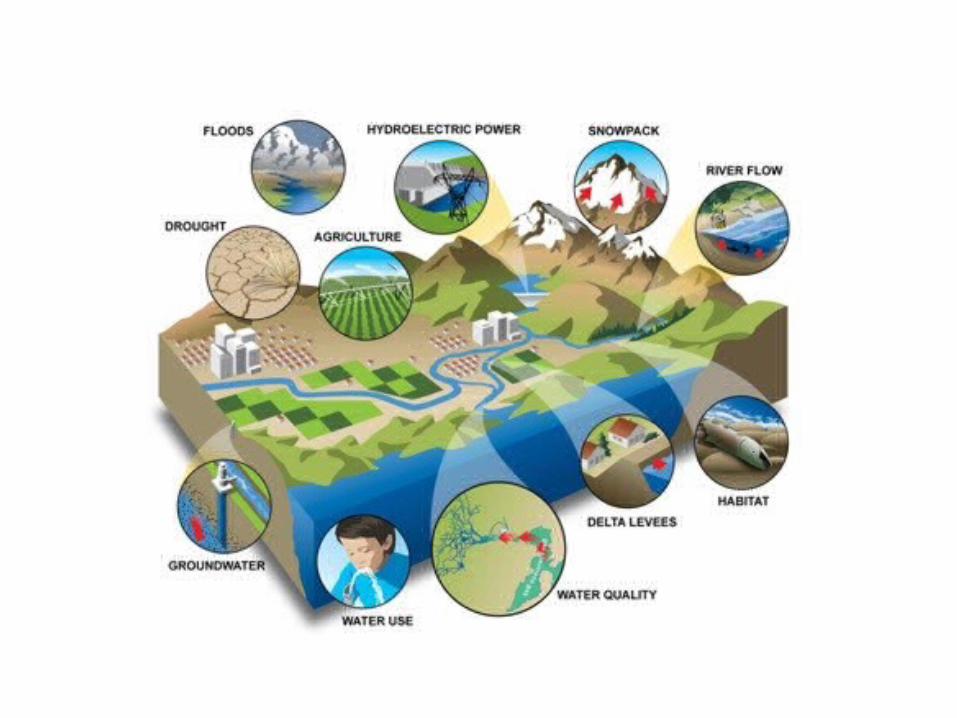
Water resourcesWater supply, water quality...
Coastal areas Erosion, inundation, cost of prevention...
Species and natural areasBiodiversity, modification of ecosystems...
Human healthInfectious diseases, human settlements...
Consequences of climate change:
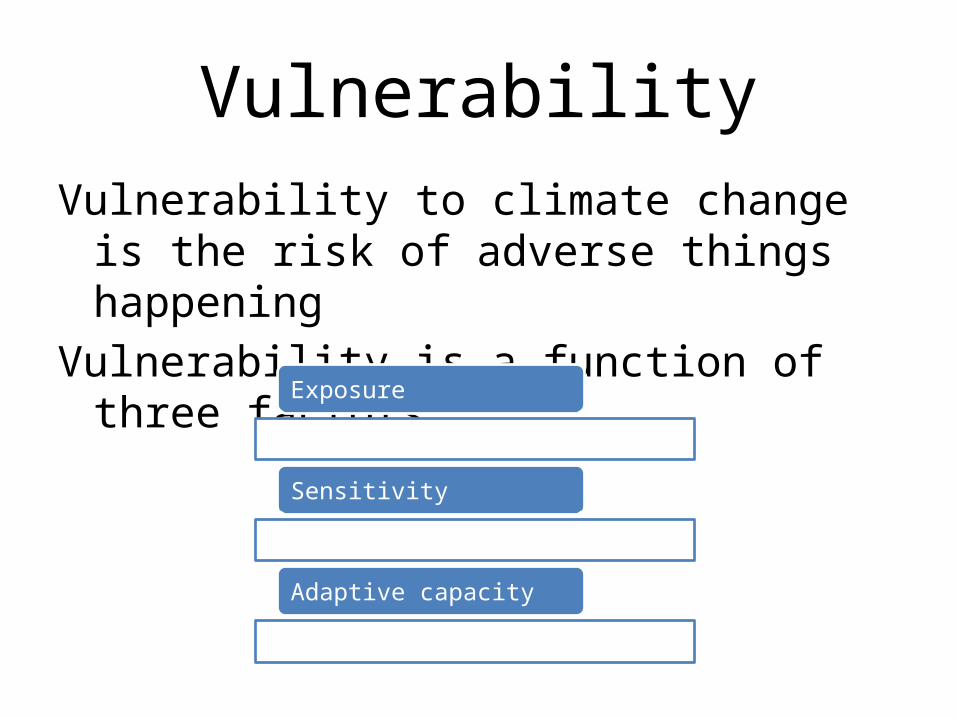
VulnerabilityVulnerability to climate change is the risk of
adverse things happening Vulnerability is a function of three factors:
Exposure
Sensitivity
Adaptive capacity

Exposure
•Exposure is what is at risk from climate change, e.g.,
– Population– Resources– Property
•It is also the climate change that an affected system will face, e.g.,
– Sea level– Temperature– Precipitation– Extreme events

Sensitivity
• Biophysical effect of climate change– Change in crop yield, runoff,
energy demand• It considers the socioeconomic
context, e.g., the agriculture system
• Grain crops typically are sensitive
• Manufacturing typically is much less sensitive

Adaptive Capacity
• Capability to adapt• Function of:
– Wealth– Technology – Education– Institutions– Information– Infrastructure– “Social capital”
• Having adaptive capacity does not mean it is used effectively
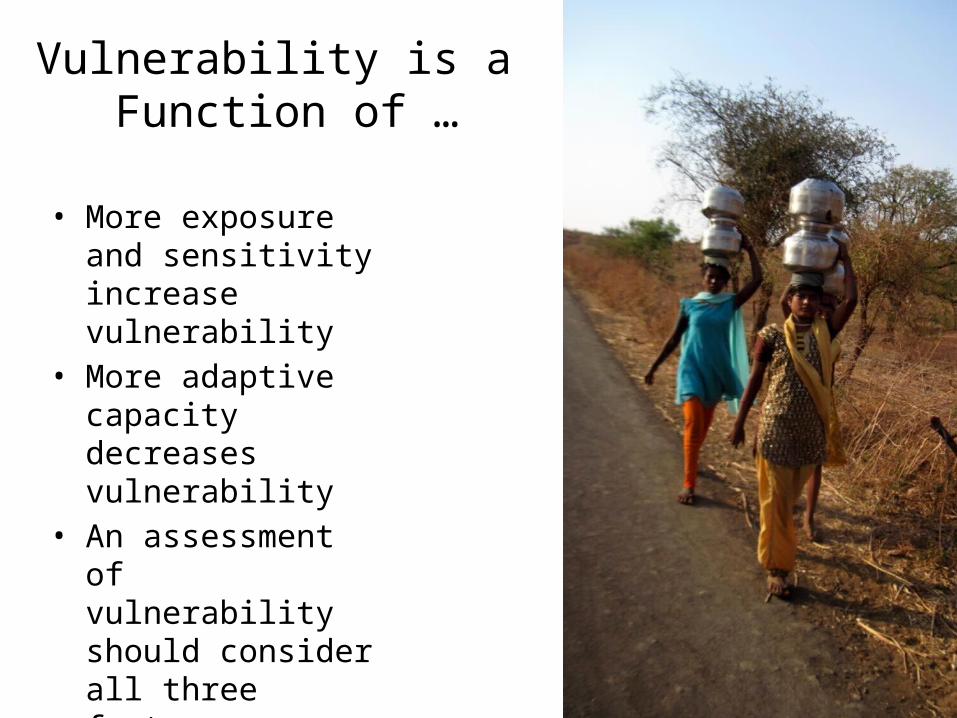
Vulnerability is a Function of …
• More exposure and sensitivity increase vulnerability
• More adaptive capacity decreases vulnerability
• An assessment of vulnerability should consider all three factors

Adaptation“adjustment in natural or human
systems in response to actual or expected climatic stimuli or their effects, which moderates harm of exploits beneficial opportunities”
(Third Assessment Report, Working Group II)
Includes “actual” (realized) or “expected” (future) changes in climate

Adaptation (continued)
Two types of adaptationAutonomous adaptation or reactive adaptation tends to be what people and systems do as impacts of climate change become apparent
Anticipatory or proactive adaptation are measures taken to reduce potential risks of future climate change

SL framework: Determinants of adaptive capacity
Livelihood resources
Examples
Human Knowledge, Skills
Social Women’s savings and loans groups, farmer- CBOs
Physical Irrigation infrastructure, seed and grain storage facilities
Natural Reliable water source, productive land
Financial Micro-insurance, diversified income sources
Policies, institutions and power structures
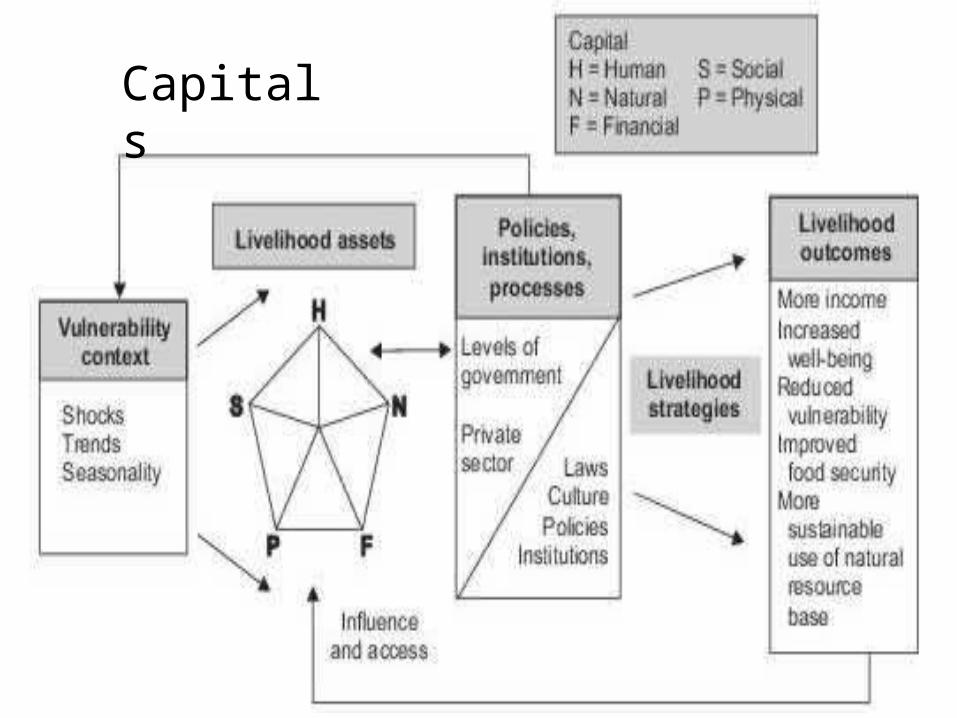
Capitals

Indian poverty
• Poverty is widespread in India, with the nation estimated to have a third of the world's poor. According to a 2005 World Bank estimate, 41.6% of the total Indian population falls below the international poverty line of US$ 1.25 a day (PPP, in nominal terms 21.6 a day in urban areas and 14.3 in rural areas).[1] A recent report by the Oxford Poverty and Human Development Initiative states that 8 Indian states have more poor than 26 poorest African nations combined which totals to more than 410 million poor in the poorest African countries.[2]


What is being done and how effective is it?1. Communities continuously finding better options to reduce their
vulnerability 2. Few responses decrease the sensitivity of the system 3. Majority are short-term fixes - reduce vulnerability temporarily but
decreases the resilience of the system

Climate Changes in India
• Increase in surface temperature by 0.4 degree C over the past century.
• Warming trend along the west coast, in central India, the interior peninsula, and northeastern India.
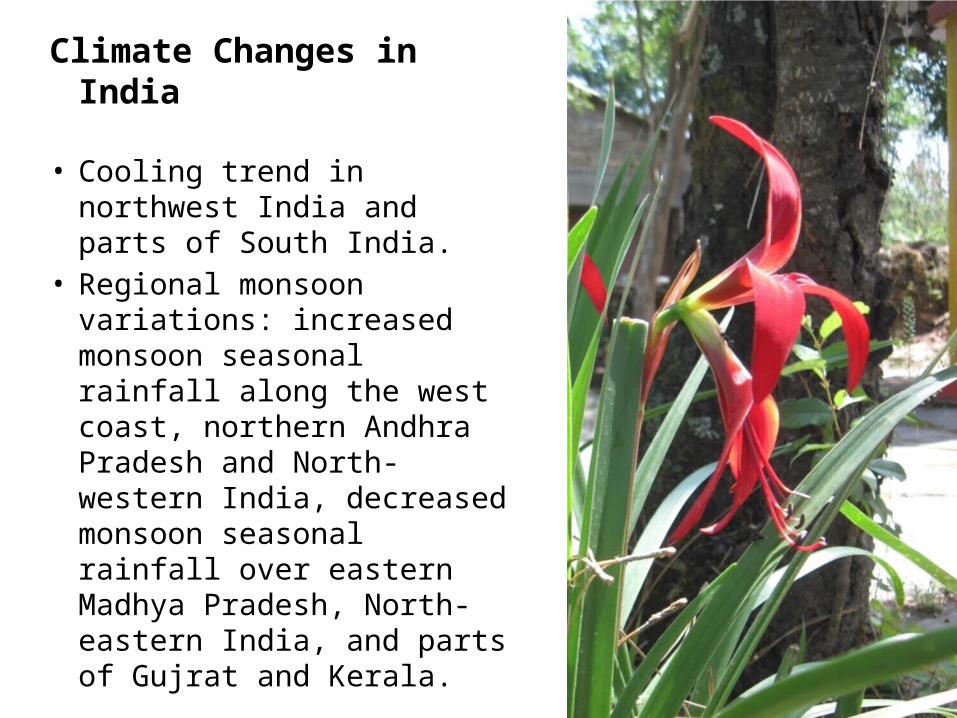
Climate Changes in India
• Cooling trend in northwest India and parts of South India.
• Regional monsoon variations: increased monsoon seasonal rainfall along the west coast, northern Andhra Pradesh and North-western India, decreased monsoon seasonal rainfall over eastern Madhya Pradesh, North-eastern India, and parts of Gujrat and Kerala.

Climate Changes in India
• Observed trends of multi-decadal periods of more frequent droughts, followed by less severe droughts.
• Studies have shown a rising trend in the frequency of heavy rain events and decrease in frequency of moderate events over central India from 1951 to 2000.
26

Climate Changes in India
• Records of coastal tide gauges in the north Indian ocean for the last 40 years has revealed an estimated sea level rise between 1.06-1.75 mm per year.
• The available monitoring data on Himalayan glaciers indicates recession of some glaciers. 27

Per-capita Carbon –dioxide emission (Metric Tons)
USA Europe Japan China Russia India World average
0
5
10
15
20
25
20.01
9.4 9.87
3.6
11.71
1.02
4.25
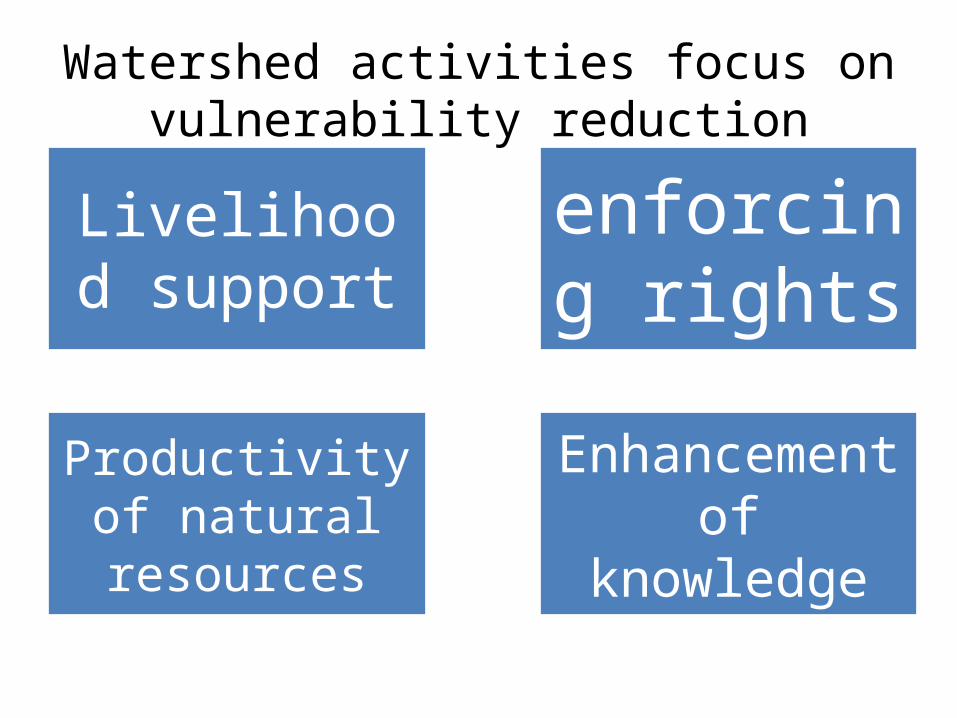
Watershed activities focus on vulnerability reduction
Livelihood support
enforcing rights
Productivity of natural
resources
Enhancement of knowledge


Every drop counts
Methods of waterharvesting

The Barefoot College, Tilonia

Freshwater management in India
Anupma Sharma
Water Conservation
Watershed management
Water quality conservation
Inter basin water transfer
GW management
Recycle and reuse of water
Public involvement and capacity building

.ppt (36)
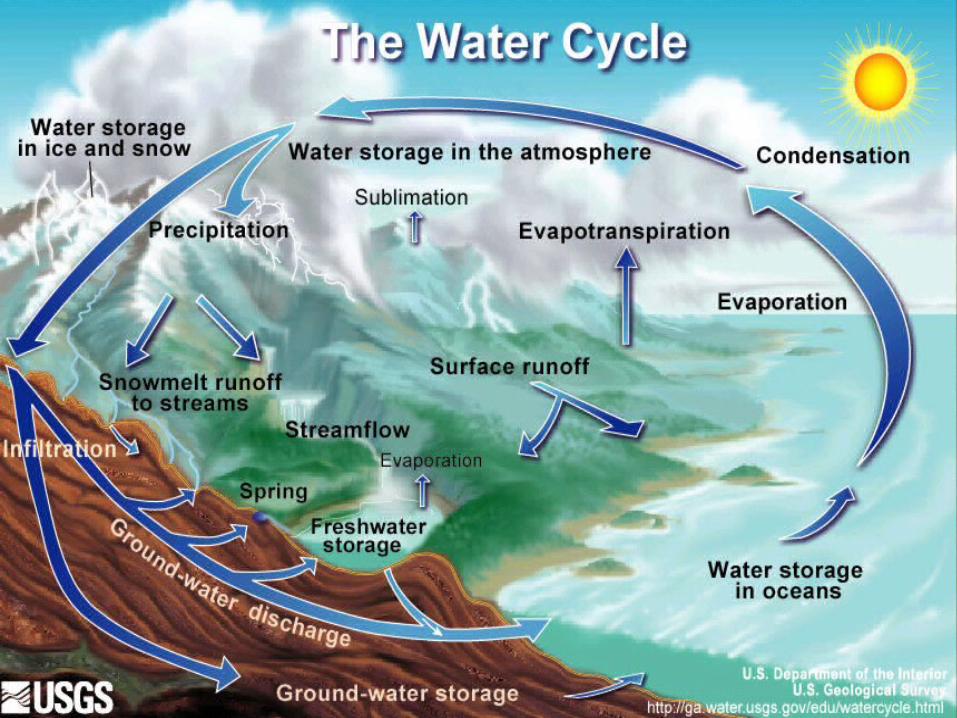
Condensation
Precipitation
Evaporation
Surface Water
Infiltration
Evapotranspiration
Let’s take a look atThe Water
Cycle
Consumption
Surface Runoff
Groundwater
Sea water intrusion

WATERSHED DEVELOPMENT PROGRAMME (WDP)
Improve and sustain productivity and production potentials of the dry/semi-arid regions of India through adoption of appropriate production and conservation technologies.
Meet the needs of local rural communities for food, fuel, fodder and timber. Improve all types of lands, i.e., Government, Forest, Community and Private Lands falling within a watershed.
WATERSHED DEVELOPMENT PROGRAMME (WDP)
WDPs, in short: A holistic approach to improve and develop the economic and natural resource base of dry/semi-arid/fragile regions. In a watershed development program the watershed is the unit for development rather than political or administrative boundaries

WDP Activities
• i)Land Development: Levelling and terracing, improving soil quality and productivity; and watershed reclamation.
• ii)Water Development: Promote in situ water harvesting and conservation, establish percolation ponds and open wells, tanks, small reservoirs, and improving water quality.

WDP Activities
• iii)Enterprises/Activities: Evolve appropriate farming systems, encourage a crop mix of high value/high yield crops, social/agro-forestry, other income-generating activities like dairying, poultry-keeping, etc.

Some Illustrations of Benefits of WDPs
• -Replacing seasonal/annual crops with agro-silvi, agrohorti, silvi-horti; systems on hill slopes/degraded lands. Benefits: reduce soil erosion; arrest surface run-offs.
• -Training water to store excess water run-offs in farm ponds/percolation tanks. Benefits: improve groundwater recharge.
• -Construction of earthen or vegetative bunds or barriers to surface run-offs in a watershed. Benefits: help in moisture conservation.

Climate Change will put additional stress in
rural areas

In the life of a farmer climate Variability and
Extreme events are more important
than climate change

Government departments (AP)• Agriculture and Co-Operation• Animal Husbandry and Fisheries• Backward Classes Welfare• Consumer Affairs Food & Civil Supplies• Energy• Environment, Forests, Science and Technology• FinanceFinance (PMU)Finance (Project Wing)• General Administration• Health, Medical and Family Welfare• Higher Education• Home• Housing• Industries and Commerce• Information Technology and Communications• Infrastructure and Investment• Irrigation
• Labour, Employment Training and Factories• Law• Minorities Welfare• Municipal Administration and Urban
Development• Panchayat Raj and Rural Development• Planning• Public Enterprises• Rain Shadow Areas Development• Revenue• School Education (SE Wing)• School Education (SSA Wing)• Social Welfare• Transport, Roads and Buildings• Women Development, Child Welfare and
Disabled Welfare• Youth Advancement, Tourism and Culture
http://www.aponline.gov.in/apportal/departments/portallistoforgsbydepts.aspx?i=3

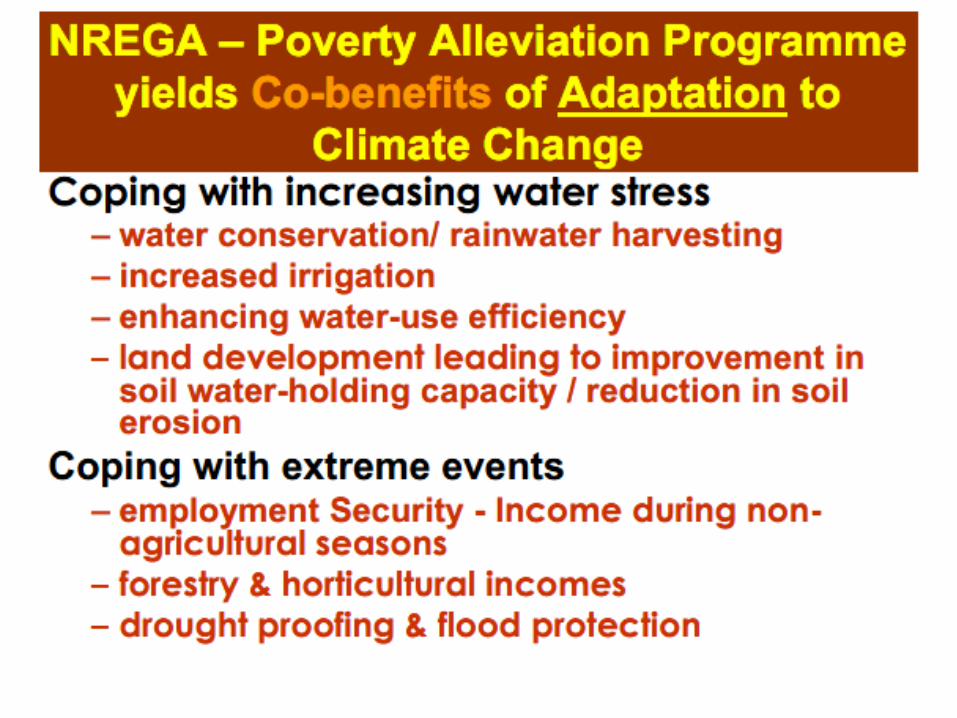
MGNREGA• 'National Rural Employment Guarantee Act'2005 (NREGA)• Act guarantees 100 days of employment in a financial year to
every household• a social safety net for the vulnerable groups and an
opportunity to combine growth with equity• Structured towards harnessing the rural work-force, not as
recipients of doles, but as productive partners in our economic process
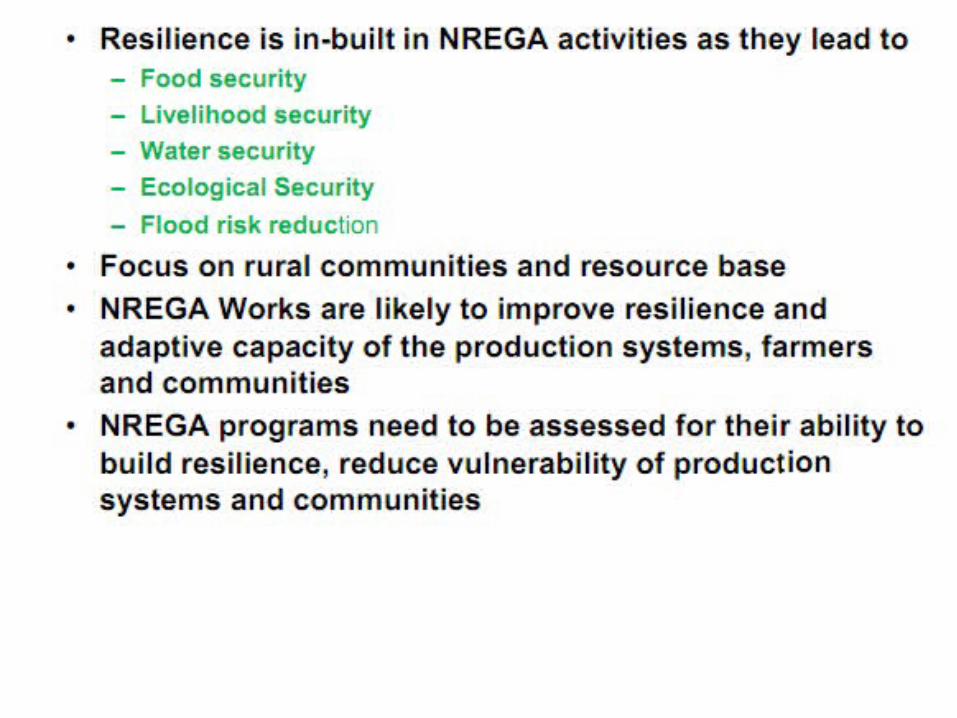
• assets created result in sustained employment for the area for future growth employment and self-sufficiency
• Operationalised from 2nd February, 2006 in 200 selected districts, extended to 130 more districts in 2007-08.
• The remaining districts (around 275) of the country under the ambit of NREGA from 1st of April, 2008

Agriculture• India ‘s population is 1.21 billion in 2011. 67% are rural. Majority
are in agriculture. • Importance of agriculture in Indian economy. Although it
contributes only 15% of GDP, the share of workers is about 55%.• Marginal and small farmers dominate• Major crops are rice, wheat, maize, coarse cereals, groundnut,
cotton, sugarcane, fruits and vegetables• 60% of cultivated area is rainfed as only 40% of area is under
irrigation.• Rural poverty is 41%in 2004-05. • Agriculture is a ‘State Subject’. In other words, the policies of
provinces are also important

Climate Change / Variability in Semi-arid regions
Precipitation is less than potential evapotranspiration.
Low annual rainfall of 25 to 60 centimeters and having scrubby vegetation with short, coarse grasses; not completely arid.

Climate Change / Variability in Semi-arid regions
Climate Variability and extremes are an expected characteristic of semi-arid lands.
The people vulnerable to droughts, which trigger frequent subsistence crises
Increasing crop failures, dislocation, famine, poverty, increases stratification and the social inequities.

Major challenges of Agriculture
Climate change - variability - extremes
Soil fertility Water management
Impact of hazardous pesticides and
nitrogen fertilizers
Burning of crop residue
Alkalinity of soils

Crop Water
Soil Climate
Energy Environment

Vulnerability of poor in rural areas
Two-thirds of households derive income directly from natural sources
Natural resources are threatened by stresses Biotic & Abiotic
Agriculture & natural resource based livelihoods at immediate risk
Rural poor do not have resources to cope

Nature of Works
Water based
• » Water conservation • » Water harvesting• » Micro and minor irrigation works• » Provision of irrigation facilities• » Desilting of tanks• » Renovation of traditional water bodies• » Flood control and protection works
Land based
• » Land development
Forest/ Agro--Forestry
• » Afforestation• » Horticulture
Infrastructure
• » Rural roads


Conservation technologies
Stress-tolerant, climate-resilient varieties of seeds, drip irrigation, zero-tillage, raised-bed planting, laser-levelling, Systems of Rice Intensification (SRI), can build adaptive capacities to cope with increasing water stress, providing “more crop per drop”.

AFPRO 59Human / Social Natural / Environmental / Physical Economic / Political
SCENARIO 1
Policies/Structures Vulnerability Adaptability
Rural Poverty Livelihoods Diversification
Appropriate Skills Water Management
Agriculture Production Water Resources
Energy
Climate Change
Community Empowerment
Bio Diversity
“VULNERABILITY ASSESSMENT AND ENHANSING ADAPTIVE CAPACITY TO CLIMATE
CHANGE IN SEMI-ARID AREAS OF INDIA”

GSBC PROJECT INTEGRATED APPROACH

Major challenges of Agriculture
Climate change - variability - extremes
Soil fertility Water management
Impact of hazardous pesticides and
nitrogen fertilizers
Burning of crop residue
Alkalinity of soils

Mahabubnagar District Rainfall Pattern
y = -4.6207x + 851.14
R2 = 0.1374
0
100
200
300
400
500
600
700
800
900
1000
1100
1200
130019
5152
1952
5319
5354
1954
5519
5556
1956
5719
5758
1958
5919
5960
1960
6119
6162
1962
6319
6364
1964
6519
6566
1966
6719
6768
1968
6919
6970
1970
7119
7172
1972
7319
7374
1974
7519
7576
1976
7719
7778
1978
7919
7980
1980
8119
8182
1982
8319
8384
1984
8519
8586
1986
8719
8788
1988
8919
8990
1990
9119
9192
1992
9319
9394
1994
9519
9596
1996
9719
9798
1998
9919
9900
2000
0120
0102
2002
0320
0304
2004
0520
0506
2006
0720
0708
2008
0920
0910
2010
1120
1112
2012
1320
1314

FACILITATION RESEARCH
ACTIVITY
CAPACITYDEVELOPMENT
Field level interventions
CULTURAL
SPIRITUA
L
BELIEFS
RITUALS
FESTIVAL
S
ALTARS
CREMATION
SOURCES (BIOMAS
S)
GOOD STOVES• T
LUDs
• Other stoves
CROP
RESIDUE
POULTRY
LITTER
WASTE MANAGEMENT• S
ludge
PRACTICES
FOOD
PRESERVING FOOD
CLEANING
MEDICINE
MATTRESS
TOOTH POWDERAIR
QUALITY• CO2
/ CH4
WATER TREATME
NT
AQUARIUM /
TERRARIUMS
BIOCHAR BRICKS
BIOCHAR URINALS
SOAK PITS
FILTERING MEDIA
INSECT REPELLEN
T
SOIL AMENDMENT
INCREASED PRODUCTION
SOIL TEMPERATURE
REGULATED
MOISTURE RETENTION
WATER CONSERVATION
NITROGEN / PHOSPHOROUS
RETENTION
NURSERIESPESTICIDES ADBSORBTION
SOIL MICROBES DENSITY INCREASE
BIOCHAR COMPOST
EARTHWORMS INCREASE
TERMITES / ANTS REPULSION
CARBON SEQUESTRATION
ANIMAL
S
POULTRY - CH4 REDUCTION
LIVESTOCK
- URIN
E AND DUN
G
FYM /
COMPOST
BIOMASS
BIOCHAR
ENERGY
BIOCHARCULTURE
Dr. N. Sai Bhaskar Reddy, GEOhttp://e-geo.org | http://biocharculture.com
SOIL
BIOCHAR
BIOCHAR COMPOST
AGRICUTURE
PADDY METHANE EMISSIONS REDUCTION
PESTICIDE & COMPLEX
CHEMICALS AFFECTS
MITIGATION
EMMISIONS REDUCTION FROM FARM
YARD MANURES AND
COMPOSTS
CROP RESIDUE MANAGEMENT
ANIMALS
APPLICATION IN ANIMAL
PLACES TO TAP URINE,
SANITATION AND
EMISSIONS REDUCTION
RUMINANT ANIMALS METHANE EMISSIONS
REDUCTION AS FEED ADDITIVE
SOAKING IN WITH ANIMALS
URINE AND EXCRETA -
VALUE ADDITION
ENERGY
SOURCE FROM EFFICIENT TLUD COOK STOVES
AS BY PRODUCT FROM GASIFIER
STOVES, BOILERS ETC
CHARCOAL PRODUCTION
FROM BIOMASS /
WASTE MANAGEMENT
HABITAT
BIOCHAR BRICKS
BIOCHAR IN AQUARIUMS
BIOCHAR IN POULTRY FARMS
BIOCHAR IN FRIDGES,
MATTRESSES, ETC.
SANITATION
BIOCHAR URINALS
BIOCHAR TOILETS
BIOCHAR IN CATTLE SHEDS
CLEANING PLATES / UTENSILS
BATHING
HEALTH
CLEANING TEETH
BIOCHAR TABLETS
BIOCHAR IN FOOD AS PART
OF FOOD PREPARATIONS
WATER
WATER PURIFICATION – COLOR, ODOR, REMOVAL OF
HARMFUL ELEMENTS,
ETC.
RITUAL / SPIRITUAL / RELIGIOUS / PRACTICES
FIRE / ALTAR / YAGNAS /
AGNIHOTRA
FIRE DURING FESTIVALS
CREMATIONS
NATURAL / ARTIFICIAL
FIRES IN FORESTS /
FIELDS, ETC.
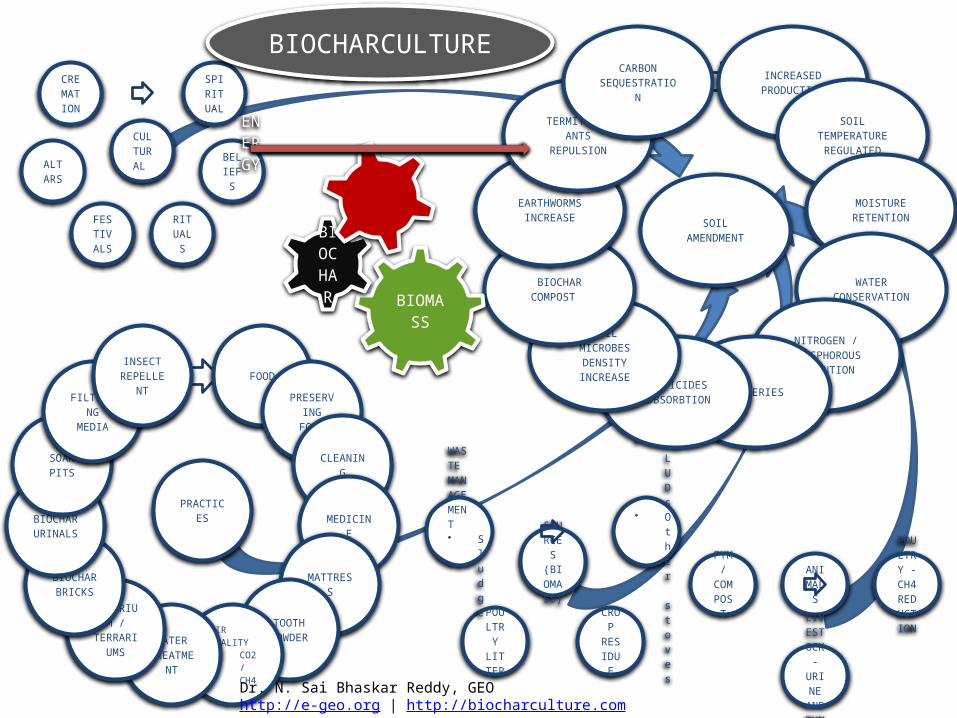
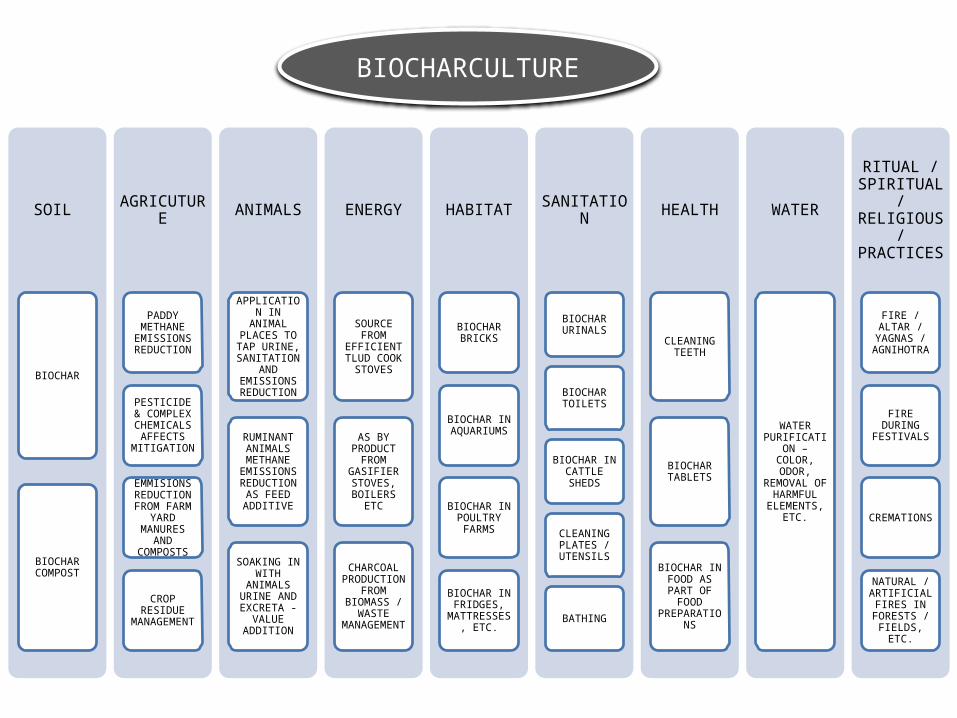
BIOCHARCULTURE

Biocharculture
Biocharculture is the process of using Biochar, including cultivation of crops
•Biochar is the charcoal produced from carbonaceous source material. Sink for atmospheric carbon dioxide in terrestrial ecosystems•Biocharculture is one of the means to integrate for sustainable cultivation and carbon sequestration.•Biochar is usually produced at around temperatures 300 to 600 degrees centigrade for example as found in the common biomass cook stoves.•Because of its macromolecular structure dominated by aromatic C, Biochar is more recalcitrant to microbial decomposition than uncharred organic matter

Biocharculture Adaptation benefitsSecuring the crop from
drought and climate variabiiity
Reclaim the degraded soils, water conservation,
Lessen the impact of hazardous pesticides
and complex chemicals & to reduce plant
uptake.
reducing emissions and increasing the
sequestration of greenhouse gases
Conversion of crop residue into Biochar an
option and address carbon sequestration
Increase in crop yieldincreases in C, N, pH, and available P to the
plantsImpacts of Biochar last more than 1000 years.
Temperature regulation in the soil
Reduction in leaching of the bio / chem fertilizers applied
Increase in the soil microbes / worms at the biochar and soil
interface

CONTROL AND BIOCHAR - OKRA
Farmers focus80% ON CROP20% ON SOIL

BIOCHAR COMPOST
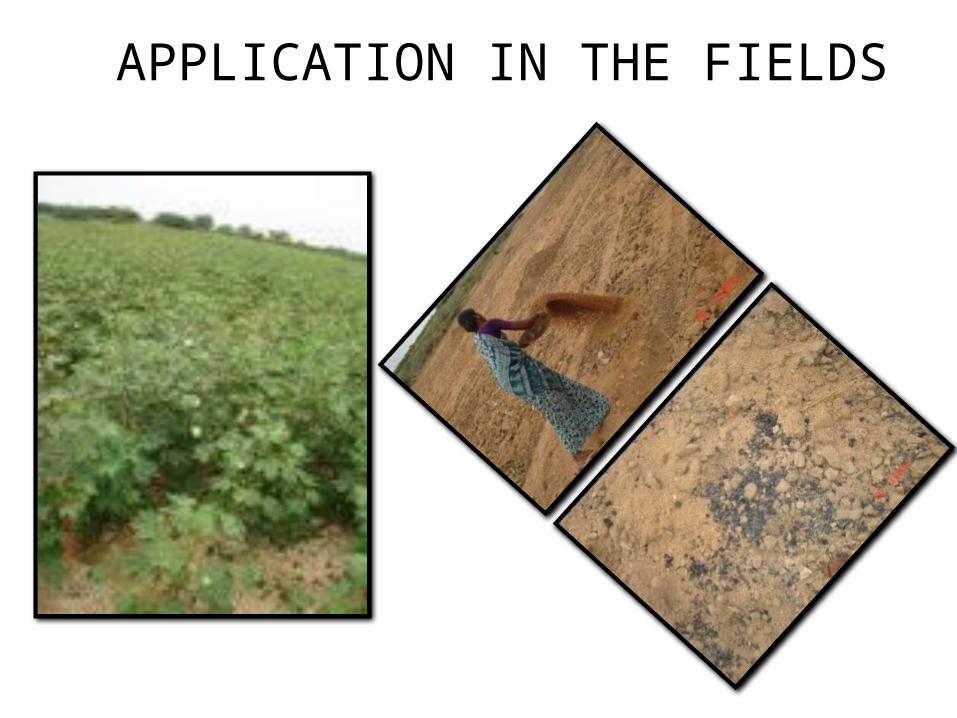
APPLICATION IN THE FIELDS

OKRA - CONTROL AND BIOCHAR PLOTS
CONTROL BIOCHAR COMPOST 4 KGS 8 KGS 12 KGS
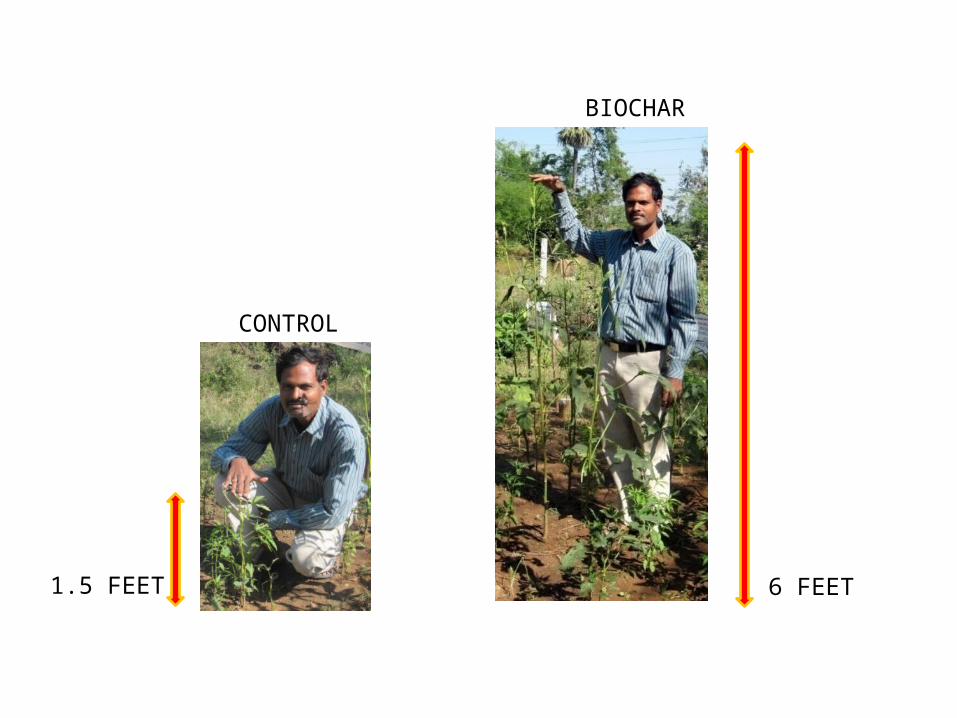
1.5 FEET 6 FEET
CONTROL
BIOCHAR
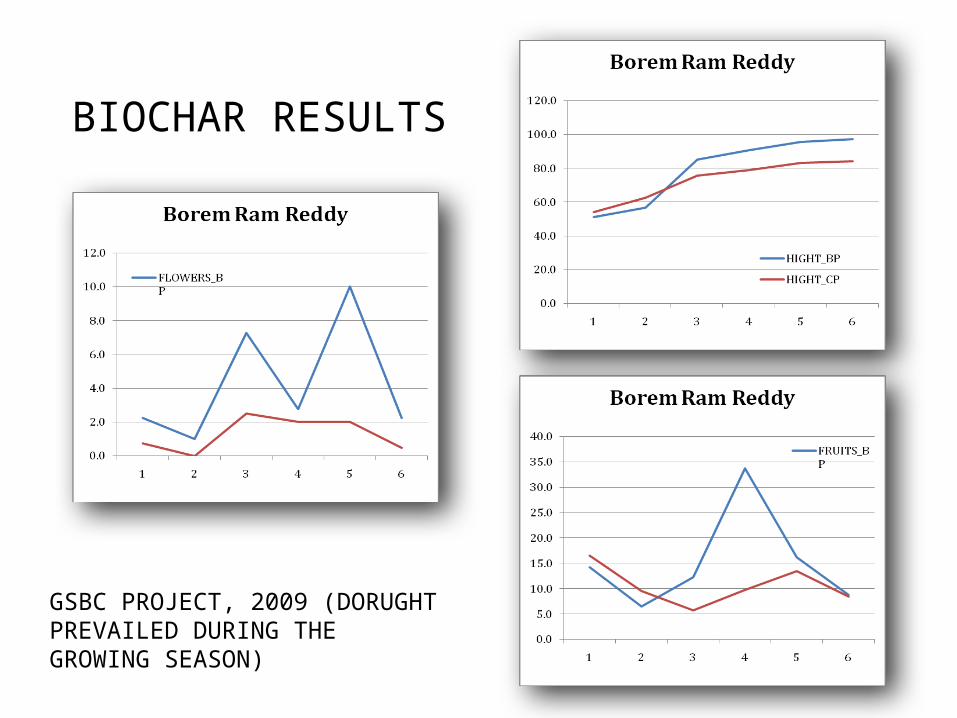
BIOCHAR RESULTS
GSBC PROJECT, 2009 (DORUGHT PREVAILED DURING THE GROWING SEASON)

Methane Emissions from paddy fields

Biochar – livestock urine

BIOCHAR URINALS
TAPPING NITROGEN FROM URINE OF ANIMALS AND PEOPLE USING BIOCHAR

OTHER BIOCHAR APPLICATIONS
BIOCHAR BRICKS, GREEN BUILDINGS

Bone
Brick pieces
Pottaryshards
Biochar /Charcoal
Slag
Quartz
Soil


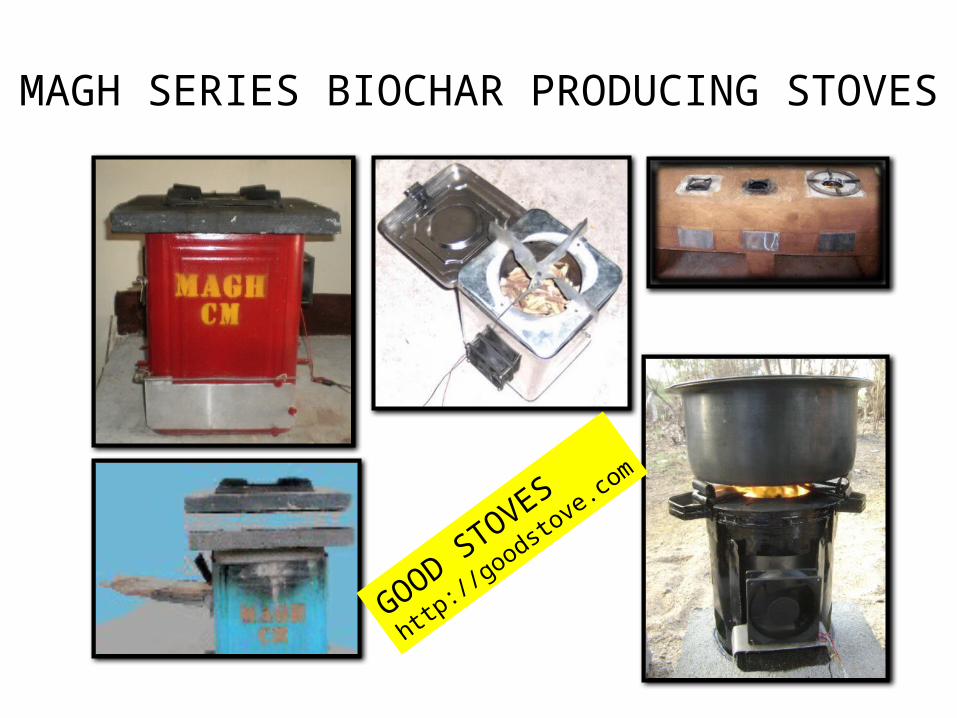
MAGH SERIES BIOCHAR PRODUCING STOVES
GOOD STOVES
http://goodsto
ve.com

MAGH SERIES BIOCHAR PRODUCING STOVES

Thank you…
Top Related