


Languages
Pages
Legal

Document 11
1
CITY OF OTTAWA NATURAL LANDSCAPE LINKAGE ANALYSIS
SUMMARY
In the last Official Plan Review, which culminated in Official Plan Amendment 76 in 2009, the City
introduced new policies about natural features into Section 2.4.2 of the Official Plan, to ensure
consistency with the Provincial Policy Statement (2005). The significant wetlands, woodlands and other
identified features need linkages to connect them into a functioning natural heritage system (NHS).
While linear features such as watercourses and floodplains are considered potential linkages, and are
included on the Natural Heritage System Overlay (Schedules L1, L2 and L3) for that reason, a linkage
needs to be identified through planning or environmental studies in order to meet the criteria in the
Official Plan. City staff has recently completed a City-wide analysis of linkage features, and is
recommending some revisions to Schedules L1, L2 and L3 of the Official Plan as a result. This document
describes the process by which staff identified the linkages and the proposed revisions to the NHS
Overlay.
As part of a Terms of Settlement with the Greenspace Alliance, signed and dated January 26, 2012,
regarding an urban boundary issue before the Ontario Municipal Board as part of Official Plan
Amendment 76, the City agreed as follows:
The City of Ottawa acknowledges that, in principle, natural heritage connectivity at multiple
scales is an appropriate consideration in decisions regarding expansion of the urban boundary,
in order for consistency with the Provincial Policy Statement, 2005.
The City commits to an explicit consideration of impacts on the connectivity of the natural
heritage system at multiple scales during any future analyses and Official Plan Amendments
regarding possible expansion of the urban boundary.
The City will include explicit consideration of natural heritage connectivity at multiple scales in
the Terms of Reference for any new or updated subwatershed studies.
Prior to the next comprehensive Official Plan Review in 2014, the City will identify and map
existing and conceptual natural heritage linkages at a City-wide scale, including consideration of
regional linkages outside the City boundaries. The city will carry out this work either in
partnership with other organizations or agencies (e.g. The Nature Conservancy of Canada or the
National Capital Commission) or on its own.
City staff has completed a natural landscape linkage analysis. Through this analysis, staff identified
natural “linkage” features that qualify as part of the City’s natural heritage system under Policy 2.4.2
(1j). These features consist of remnant woodlands or floodplains lying within existing or potential
natural linkage areas identified in the natural linkage analysis. Although they would not necessarily
qualify as part of the natural heritage system under other sub-sections of 2.4.2 (1), they contribute to
the overall connectivity of the natural heritage system. If these areas are not already designated in the
Natural Heritage System Overlay, then staff proposes to add them to Schedules L1, L2 and L3 as part of
the current Comprehensive Official Plan Review. Inclusion of these features in Schedules L1, L2 and L3
Document 11
2
would not modify any policy of the Official Plan, nor would it alter the underlying land use designation
or zoning of any land.
Consultation
The City opened the consultation discussion with a Stakeholder Workshop on the City of Ottawa’s
Natural Linkages Analysis and the Nature Conservancy of Canada’s Ottawa Valley Conservation Plan,
held on March 27, 2013. A further Agency Consultation meeting was held on September 11, 2013 on the
Natural Linkages Analysis and proposed changes to Schedule L.
In addition, work was also carried out in partnership with The Nature Conservancy of Canada. The City
has contributed to the preparation of The Nature Conservancy of Canada’s Ottawa Valley Natural Area
Conservation Plan, which identified areas of regional connectivity and lands of high ecological value, in
both Ontario and Quebec.
Summary of Process
The natural landscape linkage analysis focused on the rural area and the National Capital Greenbelt. The
urban natural heritage system linkages are addressed in the Greenspace Master Plan (2006). The
Federal Ottawa Airport Authority lands will be addressed in the Airport’s Land Use Master Plan.
The natural landscape linkage analysis employed methods and tools commonly used in conservation
land use planning for the identification of natural landscape linkages and corridors at a regional scale.
The analysis was performed using ESRI ArcGIS 10 software. It generally consisted of a “least cost
corridor” analysis, in which 1 km wide linkages were identified between core natural features. Linkages
were identified as those connecting landscapes between the features offering the least resistance to the
dispersal and movement of plants and animals.
The analysis followed the following guiding principles, which come from research and studies in fields of
Landscape Ecology and Conservation Biology:
Short linkages are better than long linkages;
Wide linkages are better than narrow linkages;
Continuous linkages are better than discontinuous linkages;
Straight linkages are better than crooked linkages.
Linkages function best if they, themselves, provide viable habitat.
These principles are also consistent with the guidance provided by the Ontario Ministry of Natural
Resources in the Natural Heritage Reference Manual (2010).
Landscape linkages are often defined in relation to a target species or group of species. In this case, the
City did not identify any target species, but based the analysis on a general assessment of the extent to
which certain land cover types facilitate or impede the movement of plant and animals.
Document 11
3
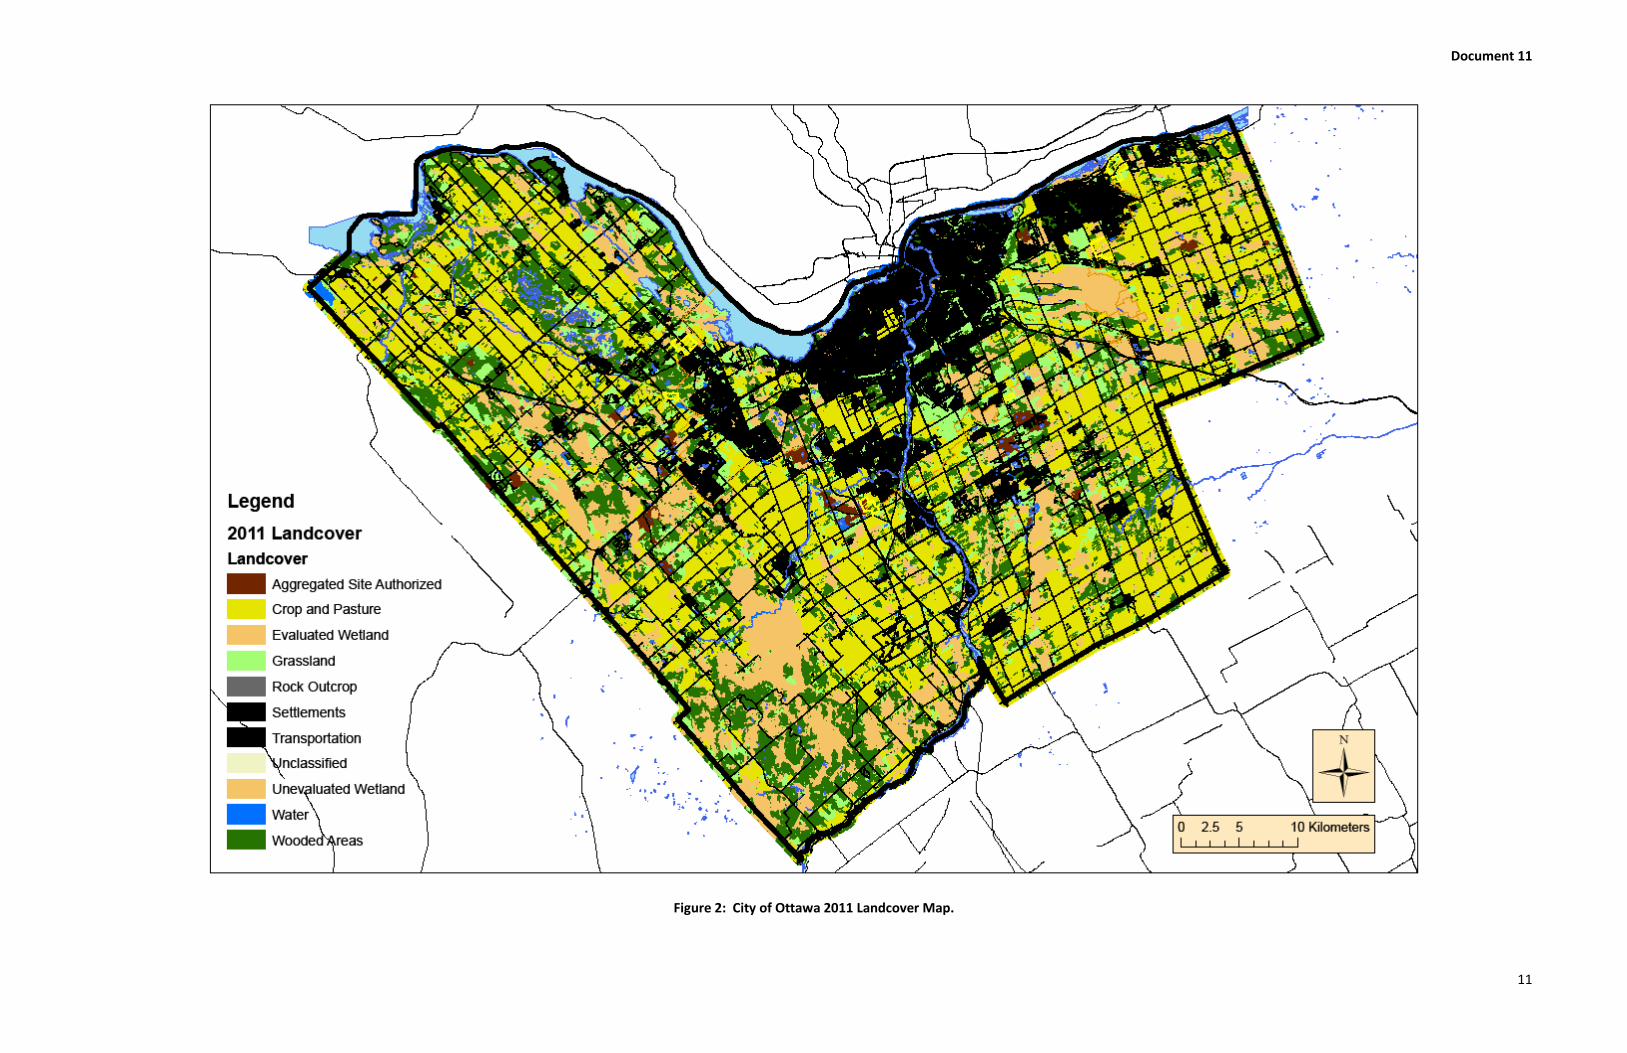
The landcover mapping used for the project was produced by the environmental consulting company
Morrison Hershfield, under contract to the City, using the City’s 2011 color aerial photography (20 cm
resolution). The land cover map followed a process and standards developed by the Rideau Valley
Conservation Authority for use in Eastern Ontario. They are derived from, and consistent with, the
Ecological Land Classification (ELC) system and the Southern Ontario Land Resource Inventory System
(SOLRIS), which are the standard mapping systems used by the Province of Ontario and Ontario’s
Conservation Authorities. The landcover map appears as Figure 2 at the end of this document.
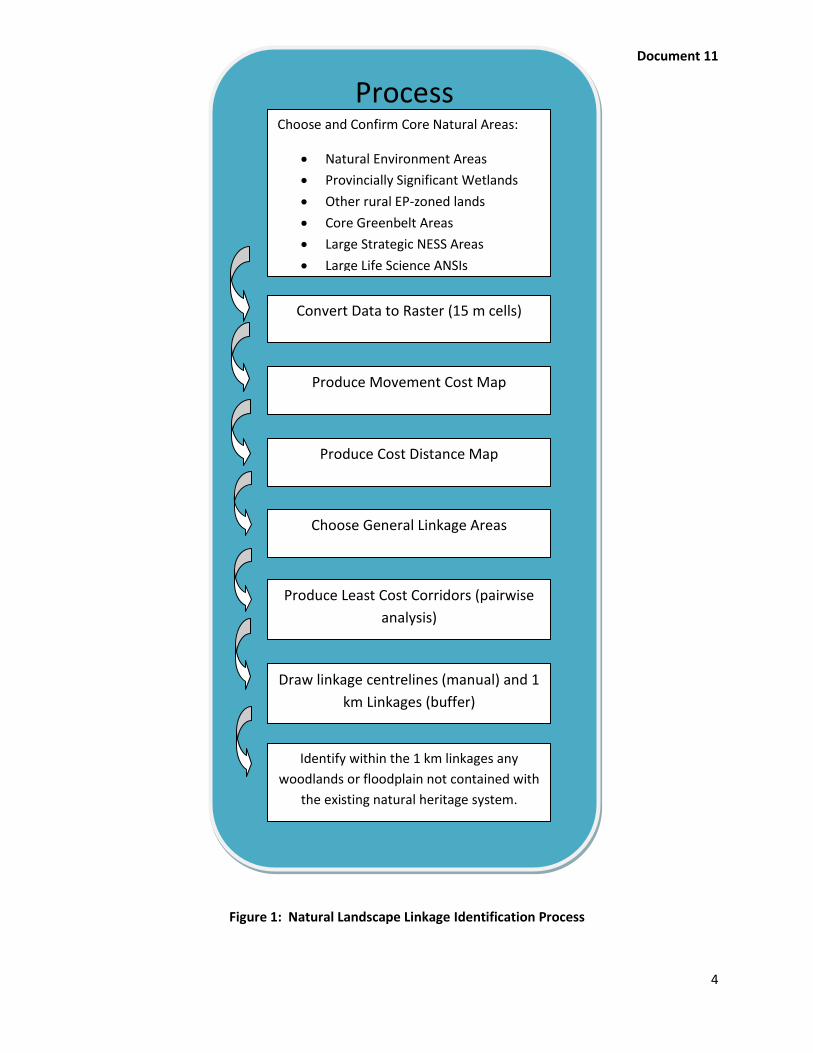
Figure 1 outlines the process and methodology that staff followed in conducting the natural landcover
linkage analysis. Several concepts are important for understanding the methodology. The process,
methodology and concepts are discussed following the figure.
Document 11
4
Figure 1: Natural Landscape Linkage Identification Process
Process Choose and Confirm Core Natural Areas:
Natural Environment Areas
Provincially Significant Wetlands
Other rural EP-zoned lands
Core Greenbelt Areas
Large Strategic NESS Areas
Large Life Science ANSIs
Convert Data to Raster (15 m cells)
Produce Movement Cost Map
Produce Cost Distance Map
Choose General Linkage Areas
Produce Least Cost Corridors (pairwise
analysis)
Draw linkage centrelines (manual) and 1
km Linkages (buffer)
Identify within the 1 km linkages any
woodlands or floodplain not contained with
the existing natural heritage system.
Document 11
5
Methodology
Raster Analysis
All of the landscape linkage analysis was performed using raster maps. A raster map is analogous to a
digital photograph, in that the map consists of individual pixels or cells which only become apparent
when one zooms in very close to the image (i.e. at high resolution). The pixels or cells are square and
arranged in rows and columns, similar to a chess board. This analysis used a cell size of 15 m x 15 m, or
225 m2. It required 12.7 million pixels to produce a raster map of the City of Ottawa, or the equivalent
of a 12.7 megapixel digital photograph.
Once a map has been converted to a raster format, it becomes possible to perform mathematical
operations on each pixel in that map using GIS software. This process is analogous to the use of photo-
processing software to modify a digital photograph.
Core Natural Areas
Natural heritage systems consist of core natural areas and connecting landscapes (i.e. natural linkages).
Core natural areas consist of large, contiguous natural vegetation communities such as woodlands,
wetlands, natural grasslands, savannas, dunes, rock barrens, etc.... These areas generally provide
sufficient quality habitat to support a diverse range of native flora and fauna.
The boundaries of core natural areas often change over time, as vegetation communities change in
response to natural succession, natural disturbances and human disturbances. Therefore, the landscape
linkage analysis began with a review of the City’s core natural areas and their boundaries. The review
included Natural Environment Areas designated in Schedule A of the Official Plan, provincially significant
wetlands, rural lands zoned “Environmental Protection” (EP), core natural areas within the National
Capital Greenbelt, large features identified in the old Region of Ottawa-Carleton Natural Environment
Systems Strategy (NESS), and large Life Science Areas of Natural and Scientific Interest (ANSIs) identified
by the Province of Ontario. The identification of core natural areas included consideration of features
beyond Ottawa’s boundaries, such as the Larose Forest, the Limerick Forest, Gatineau Park, Goodwood
Marsh and Pakenham Mountain, to ensure that regional linkages to these external features could also
be captured. Each core area was closely examined using 2011 aerial photography, topographic
information, and other land use information.
Where the extent of a core natural area had increased or decreased visibly since its original mapping,
the boundaries of the feature were revised to reflect the changes. In the NCC Greenbelt, revisions were
also guided by natural land designations in the draft Greenbelt Master Plan, which reflect recent
ecological studies by the NCC. Core natural areas included areas designated as “Core Natural Areas” in
the draft Greenbelt Master Plan, as well as existing, contiguous natural areas within the Greenbelt
designated as “Natural Link”. The final core natural areas used in the analysis appear in the figures at
the end of this document.
Document 11
6
In most cases, the boundaries of the core natural areas are already reflected in the existing natural
heritage overlay in Schedules L1, L2 and L3. In some cases, however, minor additions to Schedules L1,
L2 and L3 are necessary to reflect the revised boundaries. These additions are included in the proposed
amendments to Schedules L1, L2 and L3.
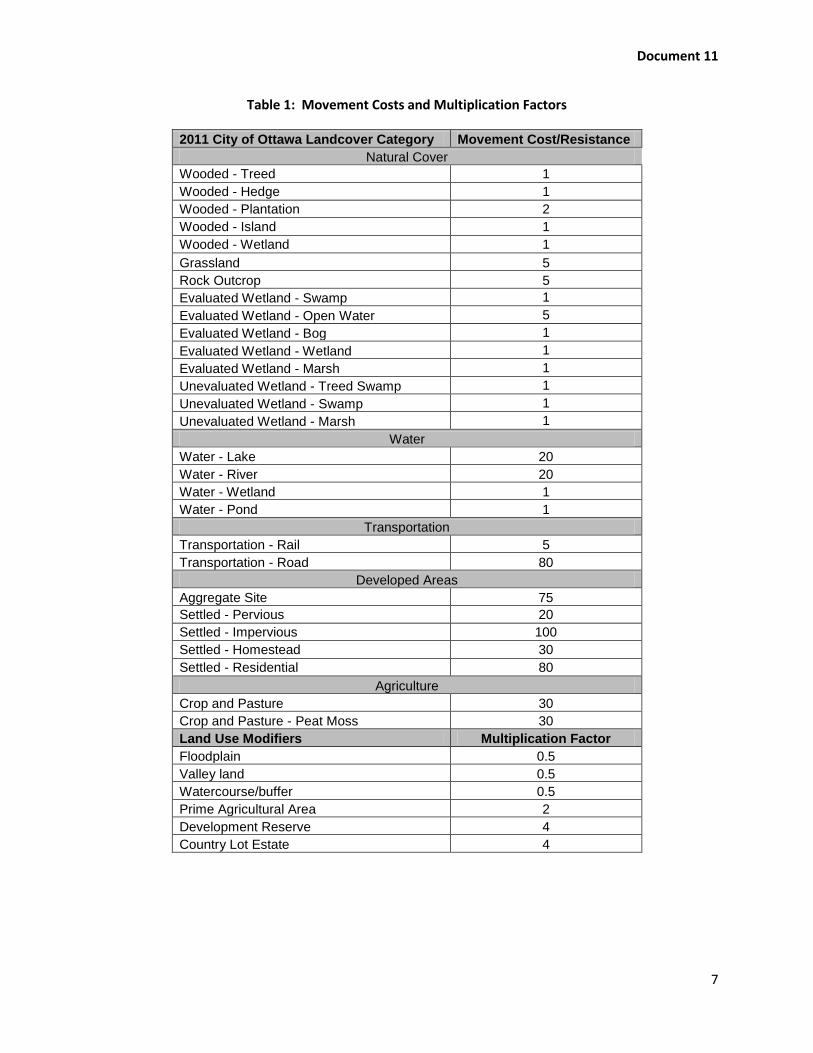
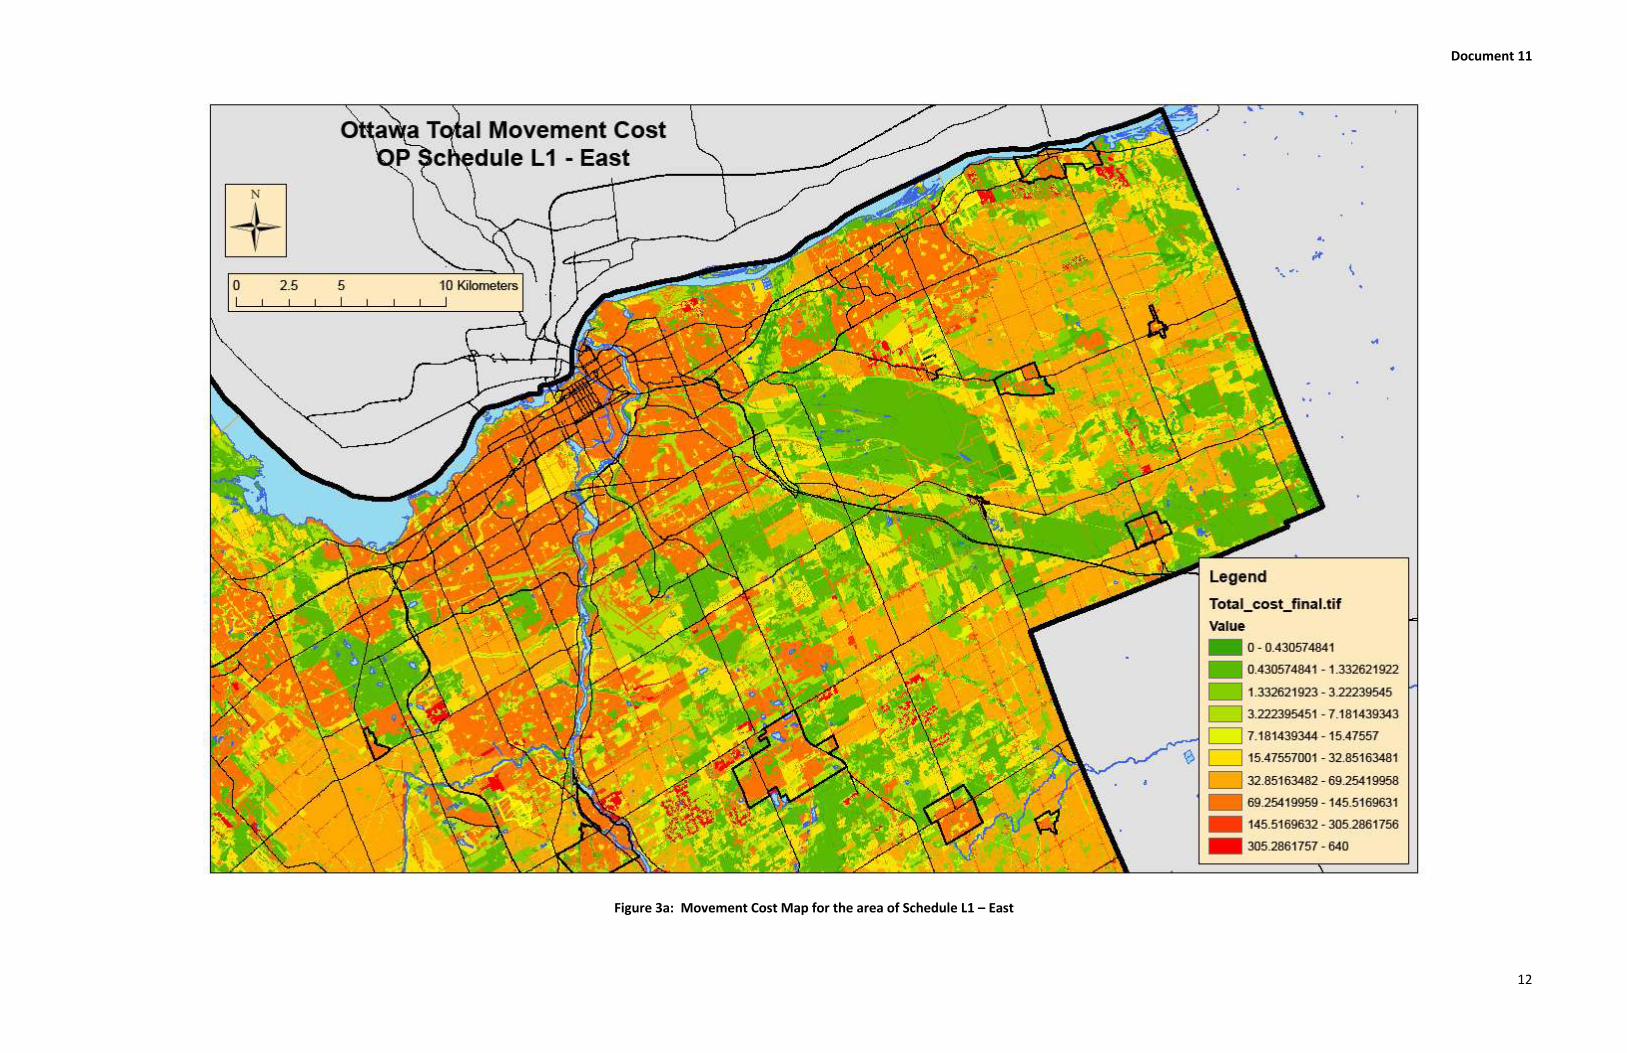
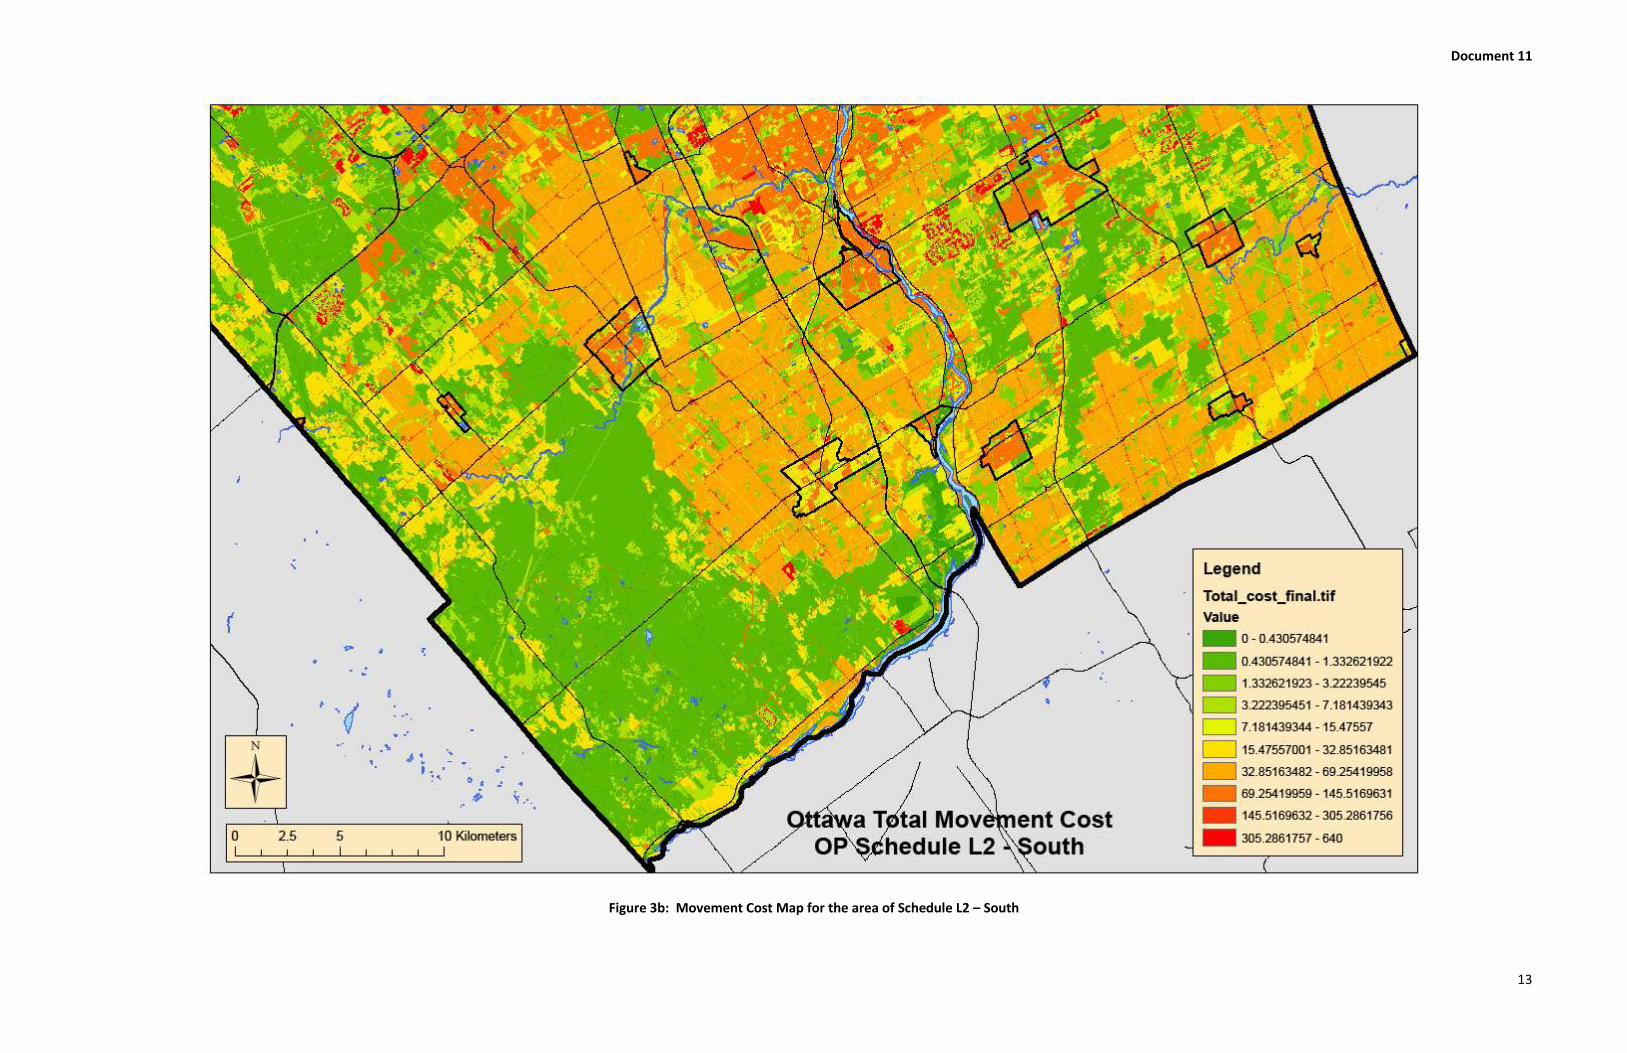
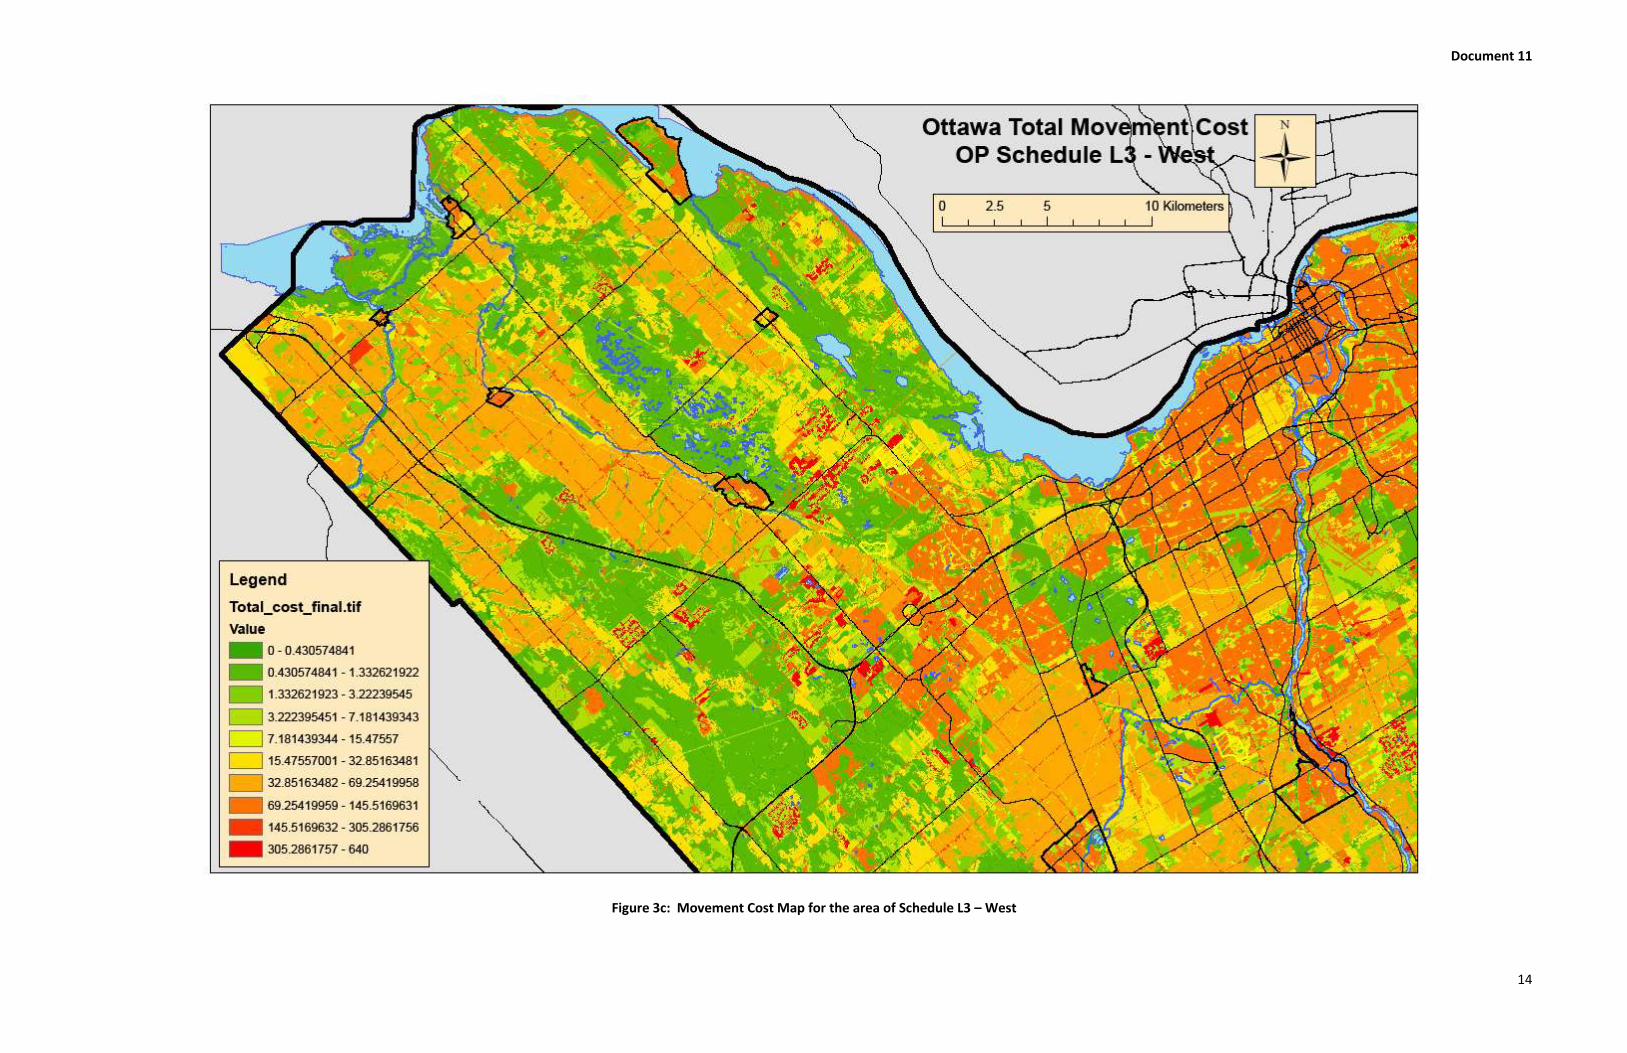
Movement Cost
The first map to be produced in a landscape linkage analysis is a movement cost map. In a movement
cost map, every pixel in the map is assigned a numerical value representing the cost to an animal of
moving through that pixel. These costs are normally set relative to each other. For example, on a
typical scale from 1 to 100, a forested pixel may be assigned a relative movement cost of 1, an
agricultural field may be assigned a relative movement cost of 30, and a fully-developed, urban pixel
may be assigned a relative movement cost of 100.
The value of a pixel in a movement cost map may also be modified by multiplication factors representing
other considerations, such as foreseeable future uses or land ownership. For example, in identifying
lands for long-term protection as natural linkages, preference may be given to lands in public ownership.
A multiplication factor of 0.5 might be applied to the movement cost of map pixels in areas of public
ownership in order to favour their selection. Table 1 provides the movement costs and multiplication
factors used in this natural landscape linkage analysis, using land cover categories from the 2011 land
cover mapping and other land use planning data from the City. The movement cost map appears as
Figures 3a, 3b and 3c at the end of this document.
Document 11
7
Table 1: Movement Costs and Multiplication Factors
2011 City of Ottawa Landcover Category Movement Cost/Resistance
Natural Cover
Wooded - Treed 1
Wooded - Hedge 1
Wooded - Plantation 2
Wooded - Island 1
Wooded - Wetland 1
Grassland 5
Rock Outcrop 5
Evaluated Wetland - Swamp 1
Evaluated Wetland - Open Water 5
Evaluated Wetland - Bog 1
Evaluated Wetland - Wetland 1
Evaluated Wetland - Marsh 1
Unevaluated Wetland - Treed Swamp 1
Unevaluated Wetland - Swamp 1
Unevaluated Wetland - Marsh 1
Water
Water - Lake 20
Water - River 20
Water - Wetland 1
Water - Pond 1
Transportation
Transportation - Rail 5
Transportation - Road 80
Developed Areas
Aggregate Site 75
Settled - Pervious 20
Settled - Impervious 100
Settled - Homestead 30
Settled - Residential 80
Agriculture
Crop and Pasture 30
Crop and Pasture - Peat Moss 30
Land Use Modifiers Multiplication Factor
Floodplain 0.5
Valley land 0.5
Watercourse/buffer 0.5
Prime Agricultural Area 2
Development Reserve 4
Country Lot Estate 4
Document 11
8
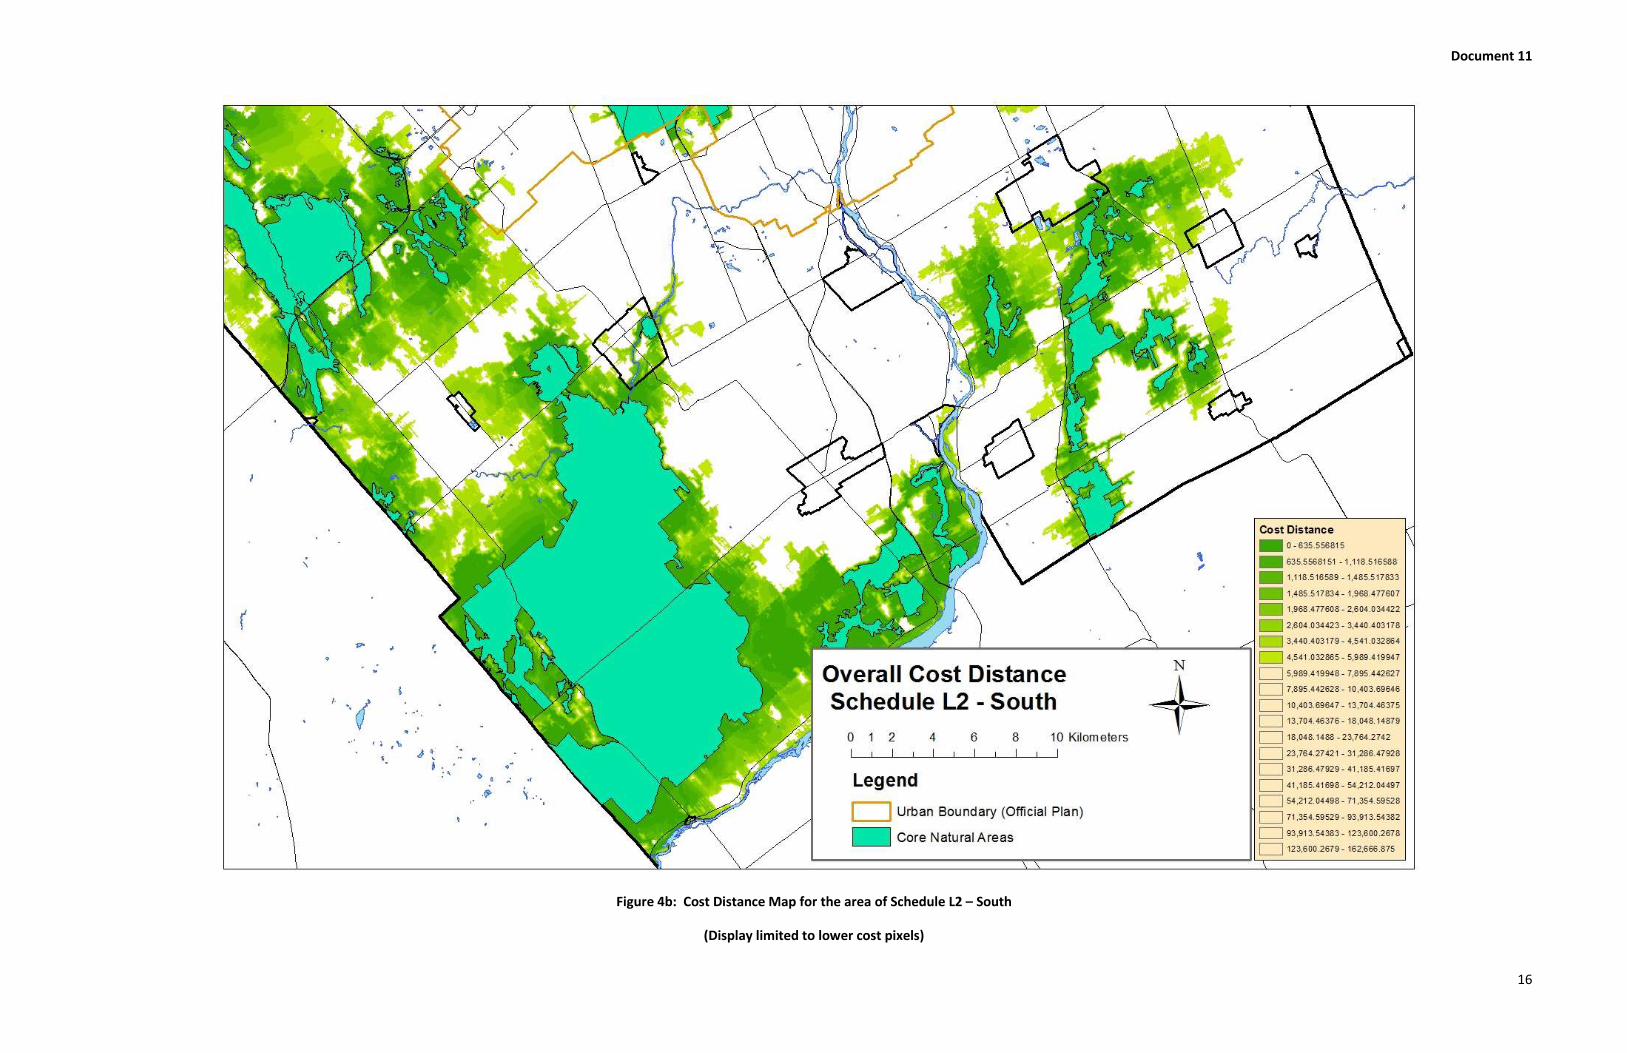
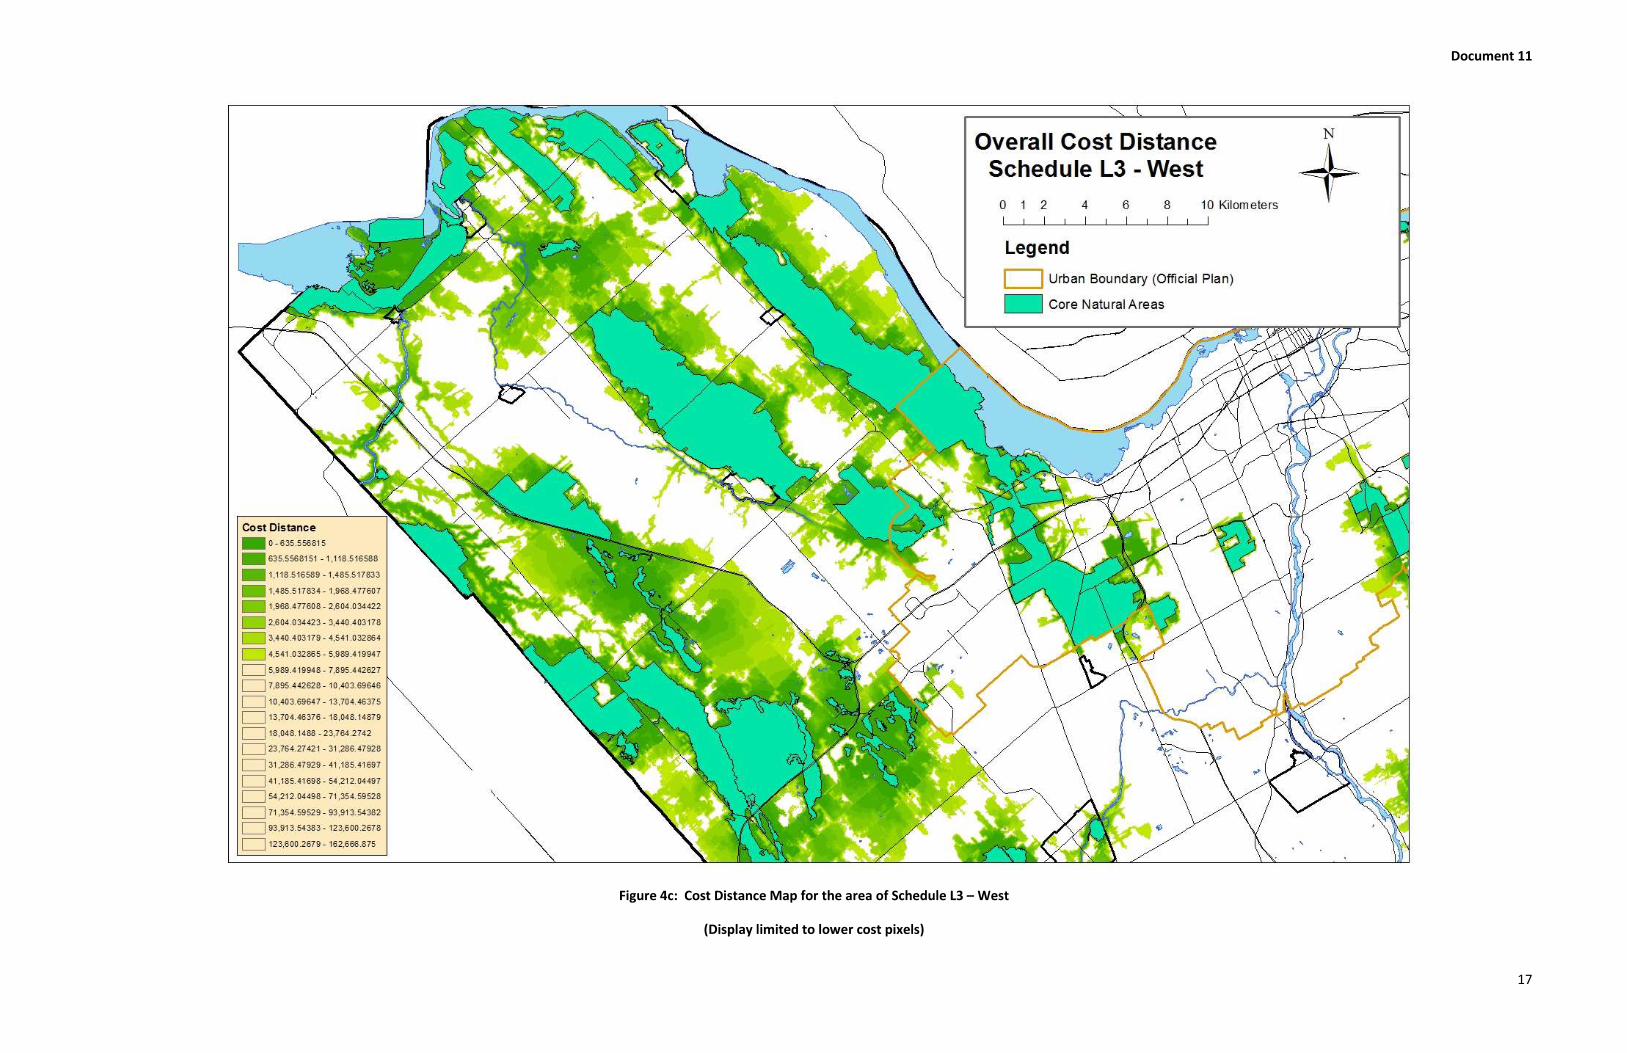
Cost Distance Map
A cost distance map represents the cumulative movement cost for an animal travelling to a defined
destination on a movement cost map. For example, let us assume that an animal must traverse four
map pixels (a, b, c, d) from its origin (pixel a) to the defined destination (pixel d). If the movement costs
for pixels a, b and c were 1, 5 and 50 respectively, then the total cost distance between pixels a and d
would be 1 + 5 + 50 = 56. Therefore, on the cost distance map, pixel a would have a cost distance value
of 56. As one moves closer to the destination, the total cost distance decreases. Pixel b would have a
cost distance value of 55 (5 + 50) and pixel c would have a cost distance of 50. Pixel d, as the assigned
destination, would have a cumulative movement cost of 0.
For this natural landscape linkage analysis, the cost distance value for each pixel was calculated as the
cumulative movement cost to the nearest core natural area. The cost distance map was used as a
screening tool to identify existing and potential natural landscape linkages for a more detailed least cost
corridor analysis. The cost distance map appears as Figures 4a, 4b and 4c at the end of this document.
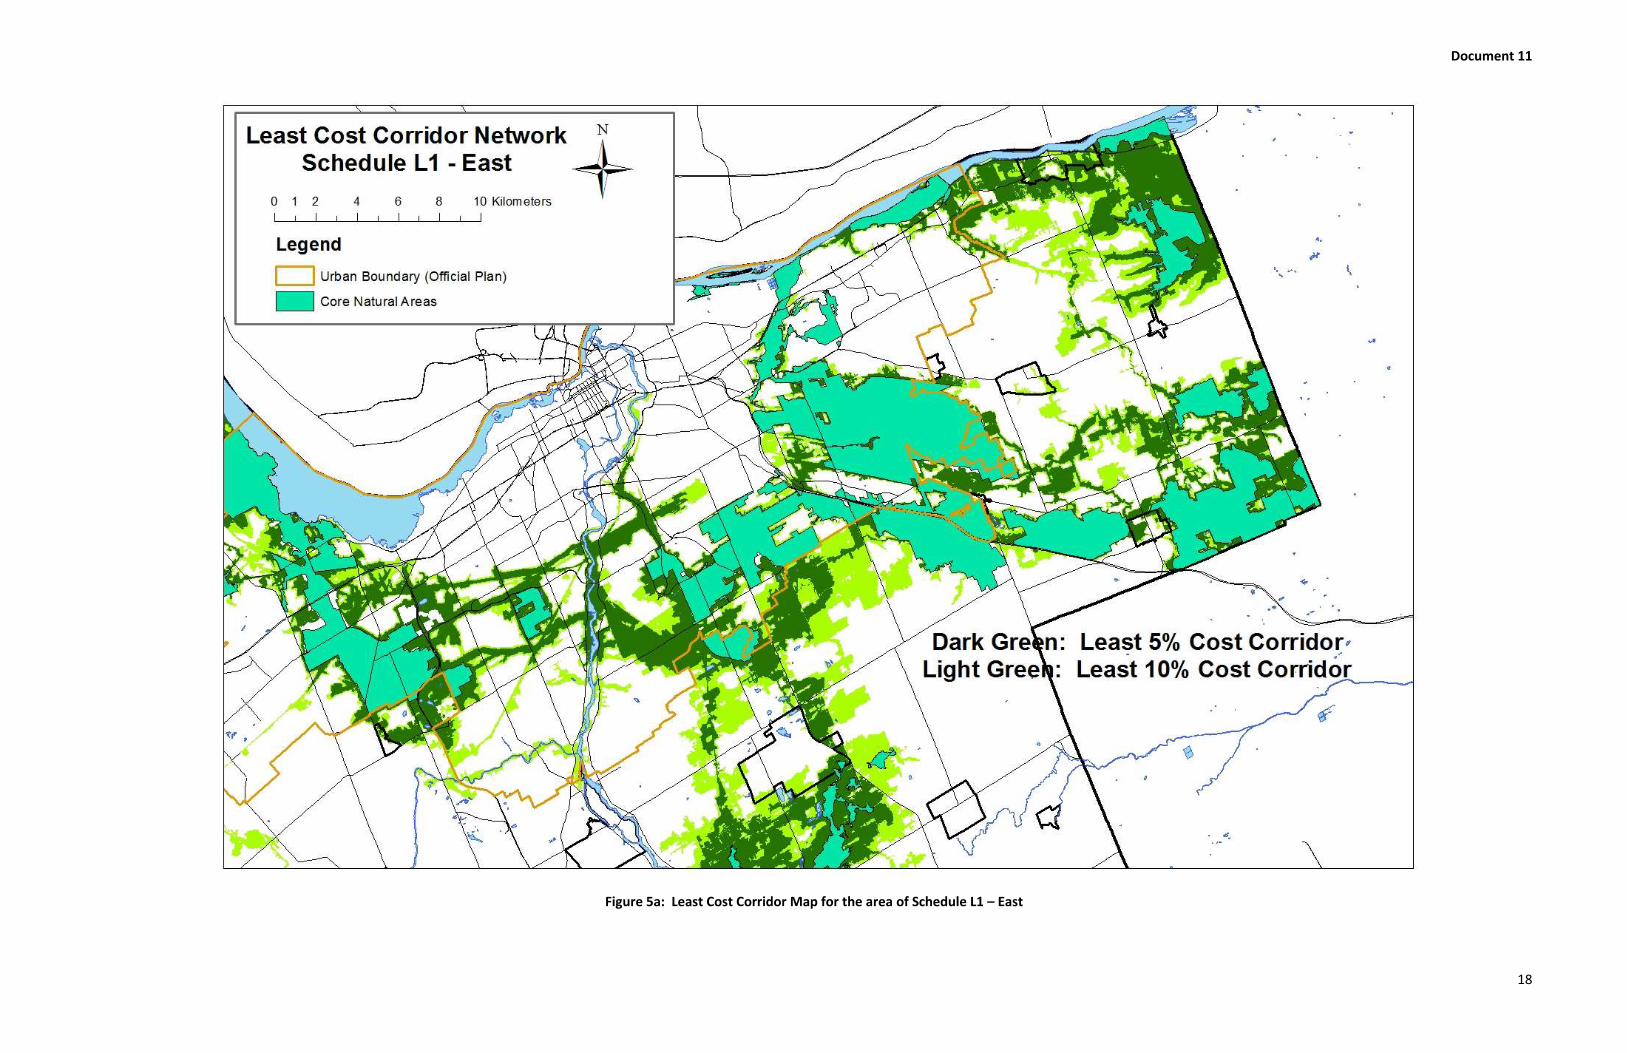
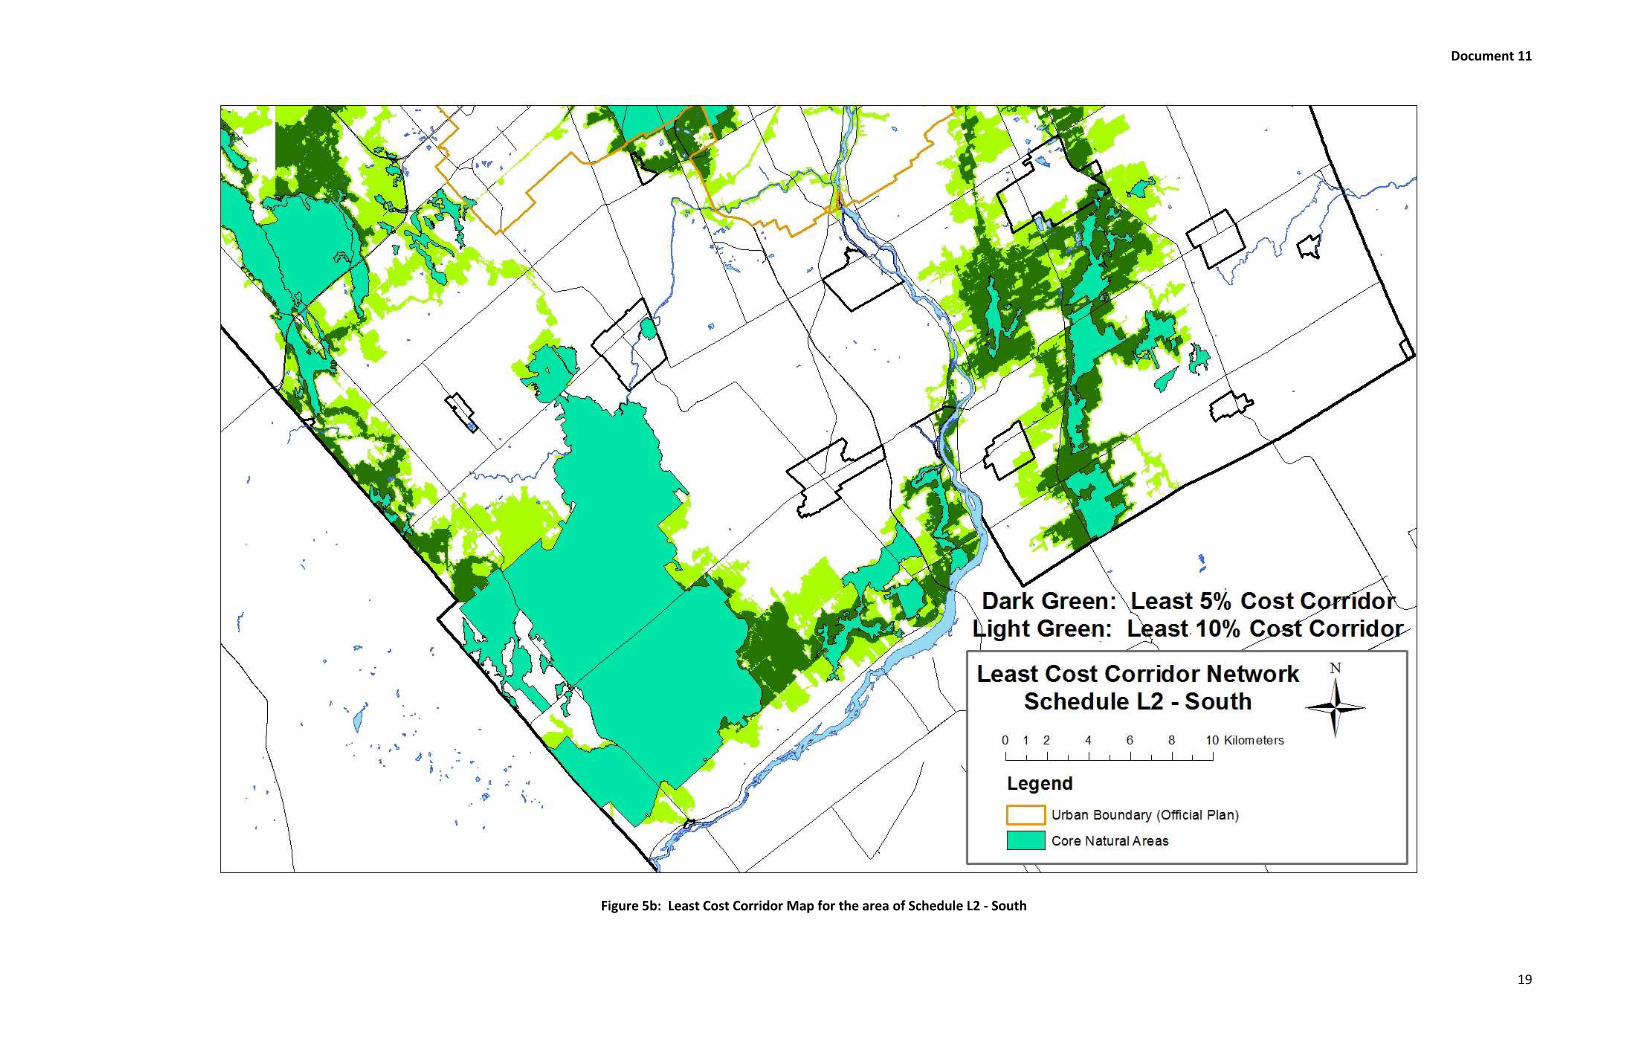
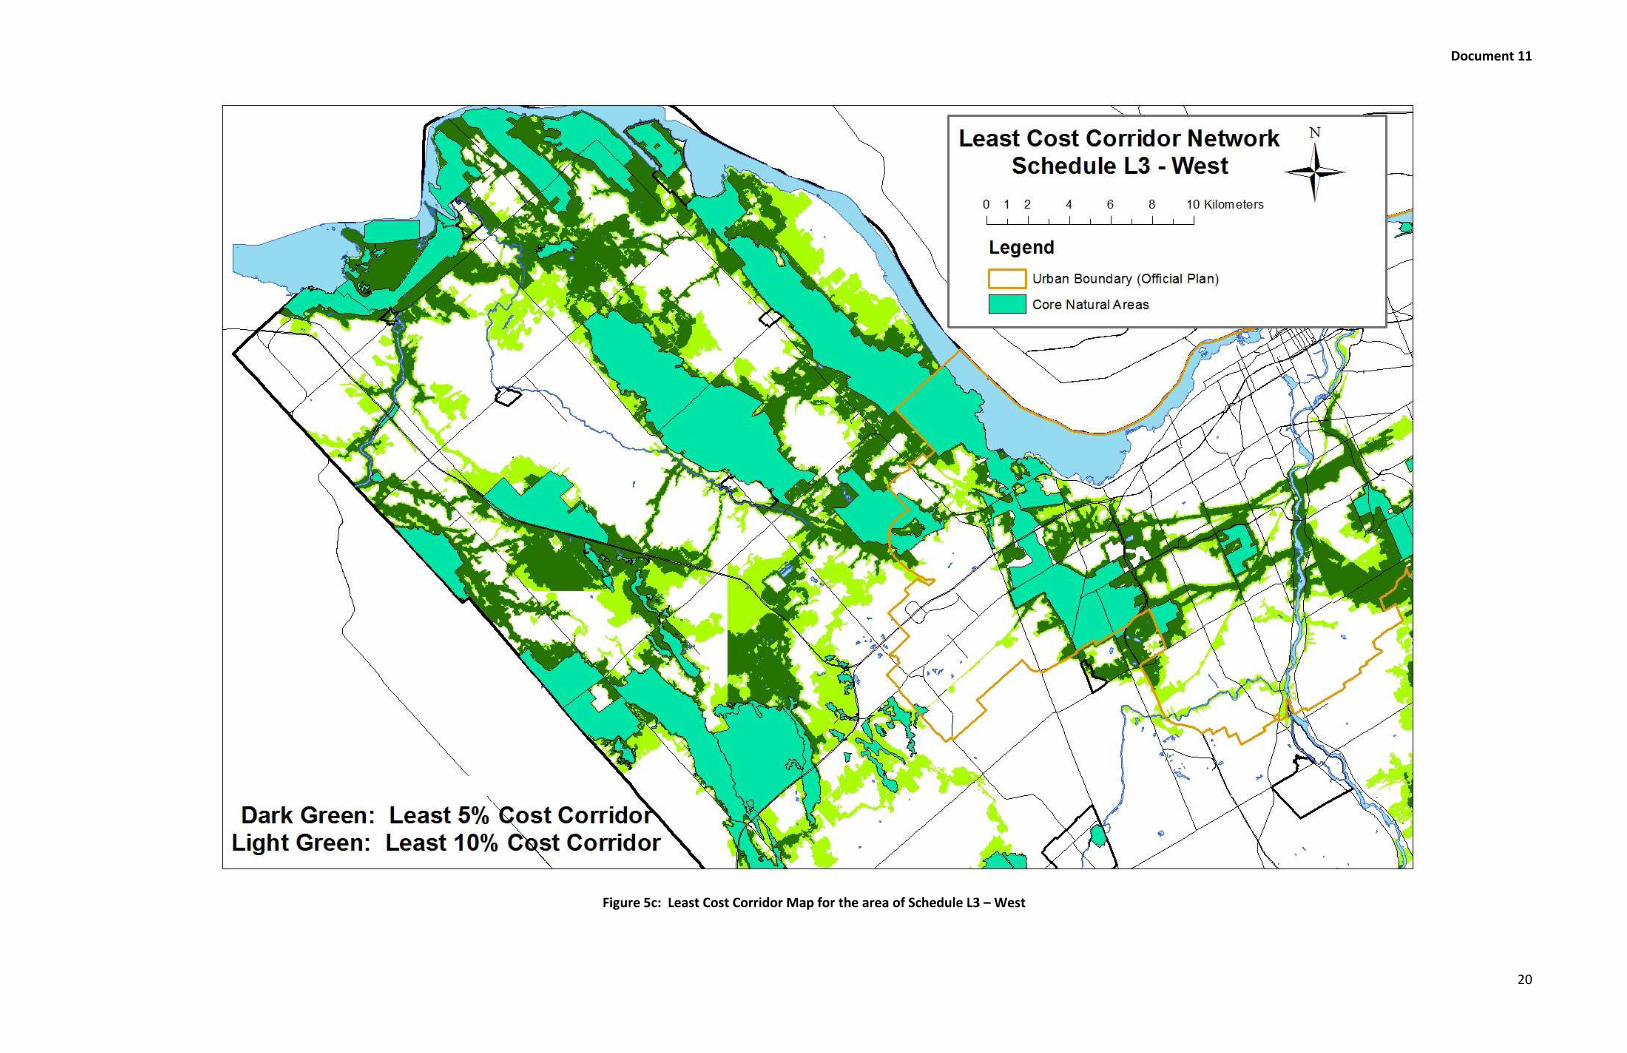
Least Cost Corridor
A least cost corridor map represents the total movement cost between two defined areas on a map.
Unlike a least cost path analysis, which traces only a single line of pixels between the defined
destinations, a least cost corridor analysis can be used to identify broader linkages. It works by
overlapping two cost distance maps – one cost distance map for each destination. Each pixel is then
assigned a value equal to the sum of its value from each cost distance map.
For example, let us assume that pixel a has a cost distance of 256 relative to destination A and a cost
distance of 125 relative to destination B. The value of the pixel in a least cost corridor analysis for A and
B would be 256 + 125 = 381.
The final step in a least cost corridor analysis is to establish the width of the corridor. This is normally
done by restricting the least cost corridor to those pixels below a certain threshold. This is usually done
using percentages (or more precisely, quantiles). For example, the least cost corridor may be restricted
to the 5% or 10% of pixels with the lowest scores.
Based upon the overall cost distance map, 39 pairs of core natural areas were identified for least cost
corridor analyses. Each of the 39 least cost corridor analyses required the preparation of two new least
cost distance maps. All of the least cost corridor analyses, including the preparation of the new cost
distance maps, were performed at the same spatial extent (824 km2) and map scale (1:130,000). The
actual area subject to the analyses varied somewhat due to overlap with the City’s boundaries (analyses
were only performed on areas within the City boundary).
Several pairs of core conservation areas were chosen for least cost corridor analyses even though the
overall cost distance map did not show high potential for connectedness. Pinhey Forest, within the
National Capital Greenbelt, was chosen for least cost corridor analyses because of the declared intention
of the National Capital Commission to identify and improve natural linkages to this important core,
Document 11
9
greenbelt area. The Leitrim Wetland and Osgoode Swamp were also chosen for a least cost corridor
analysis because the area presents the best opportunity for a north – south linkage on the east side of
the Rideau River, particularly in the future when existing mineral aggregate areas are exhausted and
rehabilitated.
Figures 5a, 5b and 5c display the 39, overlapping least cost corridor analyses. The figures display the
best 10% and 5% solutions.
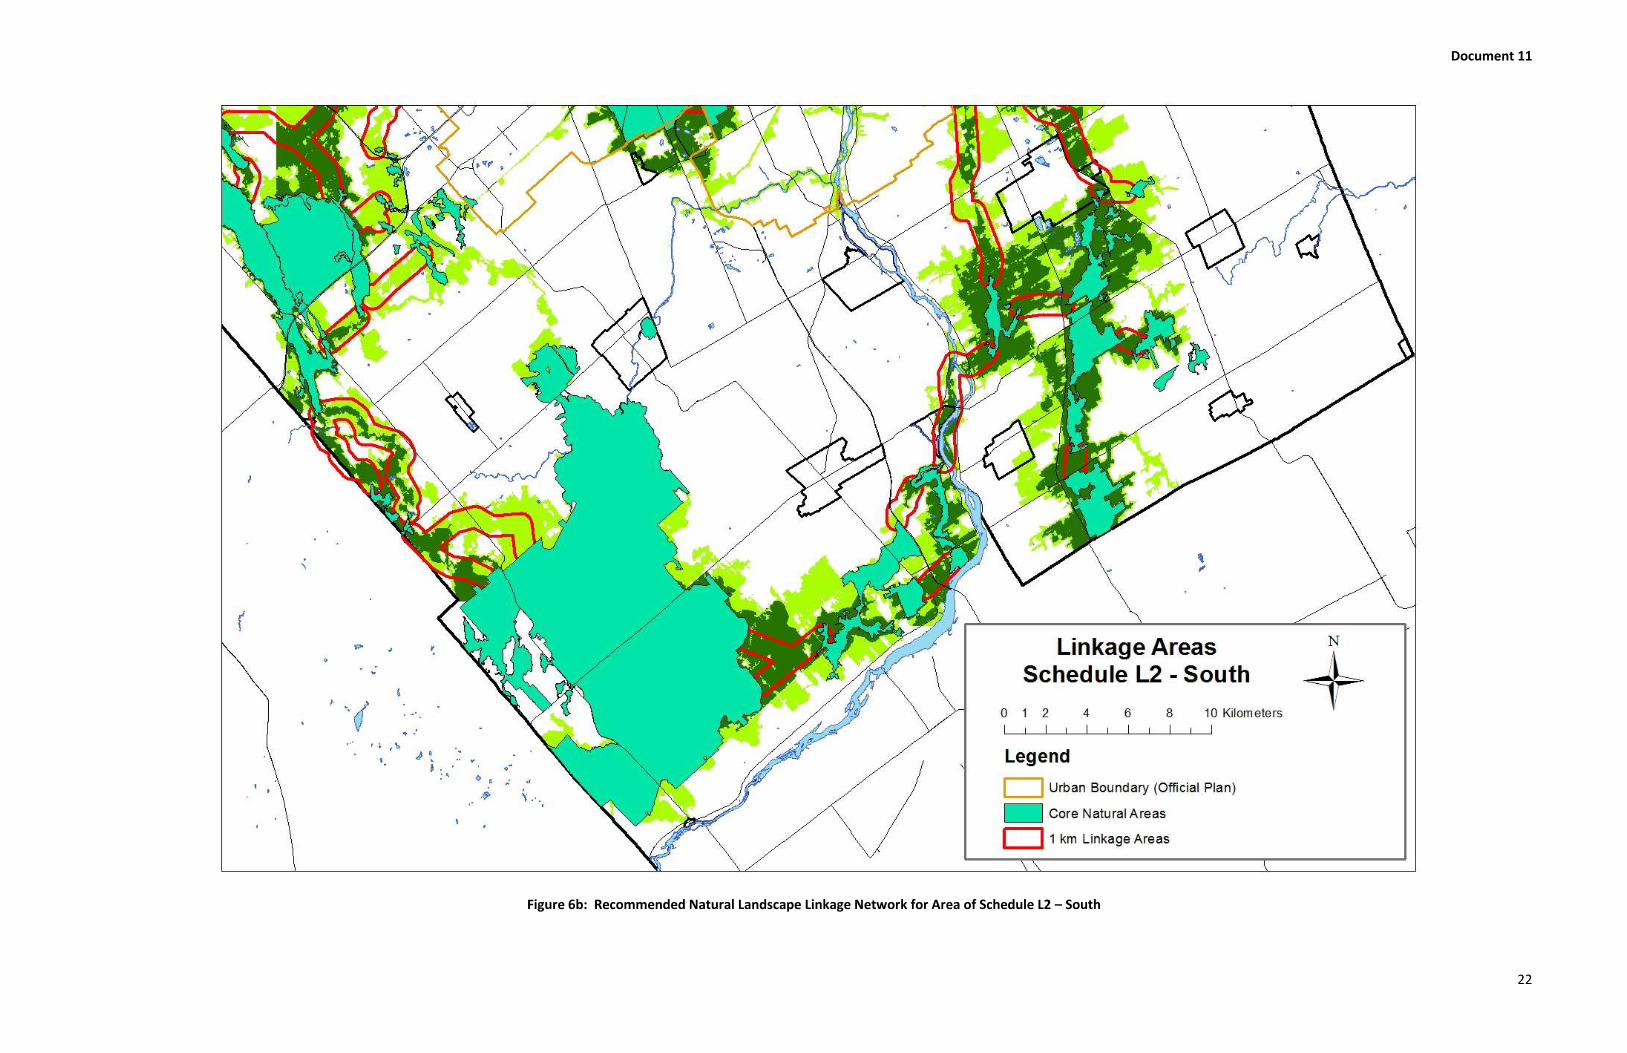
Identification of Linkages
The next analytical step was the identification of existing and potential linkages. This was a semi-
automatic process. First, staff manually drew lines between the core natural areas, following the
apparent path of least resistance shown in the least cost corridor analysis. Staff then “buffered” these
lines by 500 m on each side to create a 1 km wide linkage area.
The linkages vary in quality from areas that remain entirely natural, through areas that are a mix of
natural and non-natural land cover types, to areas that are predominantly non-natural vegetation. The
latter linkages are best described as having long-term potential for restoration, generally as a result of
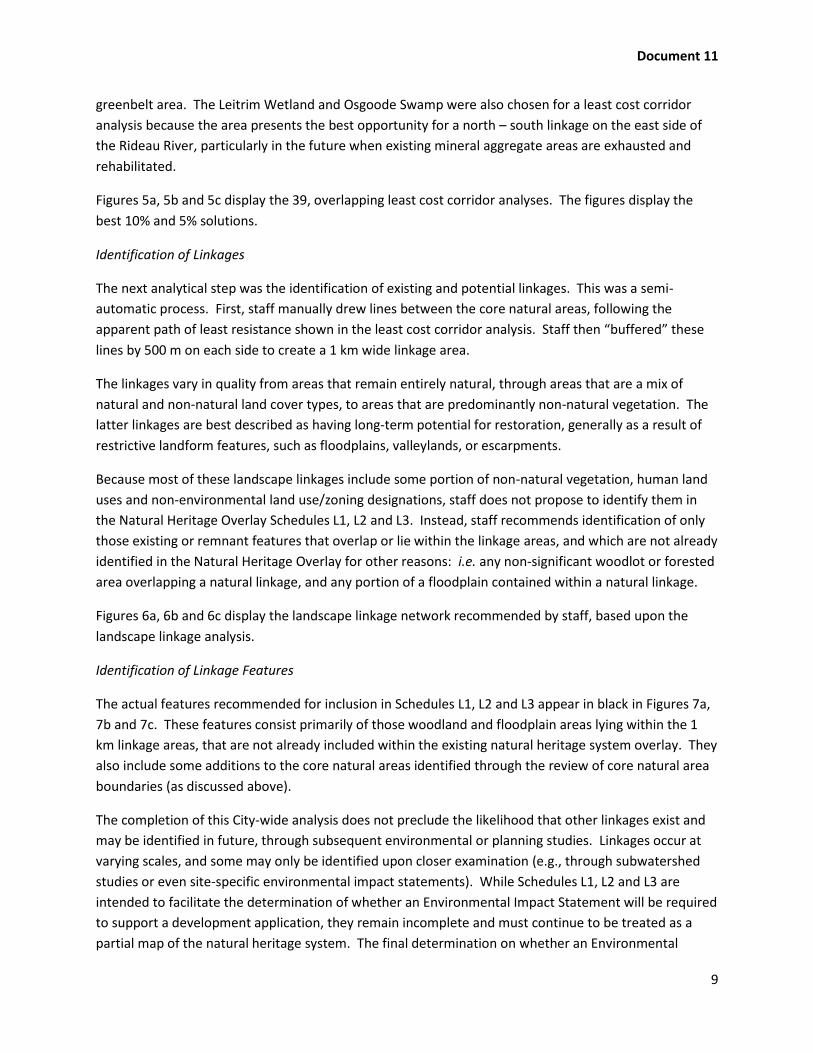
restrictive landform features, such as floodplains, valleylands, or escarpments.
Because most of these landscape linkages include some portion of non-natural vegetation, human land
uses and non-environmental land use/zoning designations, staff does not propose to identify them in
the Natural Heritage Overlay Schedules L1, L2 and L3. Instead, staff recommends identification of only
those existing or remnant features that overlap or lie within the linkage areas, and which are not already
identified in the Natural Heritage Overlay for other reasons: i.e. any non-significant woodlot or forested
area overlapping a natural linkage, and any portion of a floodplain contained within a natural linkage.
Figures 6a, 6b and 6c display the landscape linkage network recommended by staff, based upon the
landscape linkage analysis.
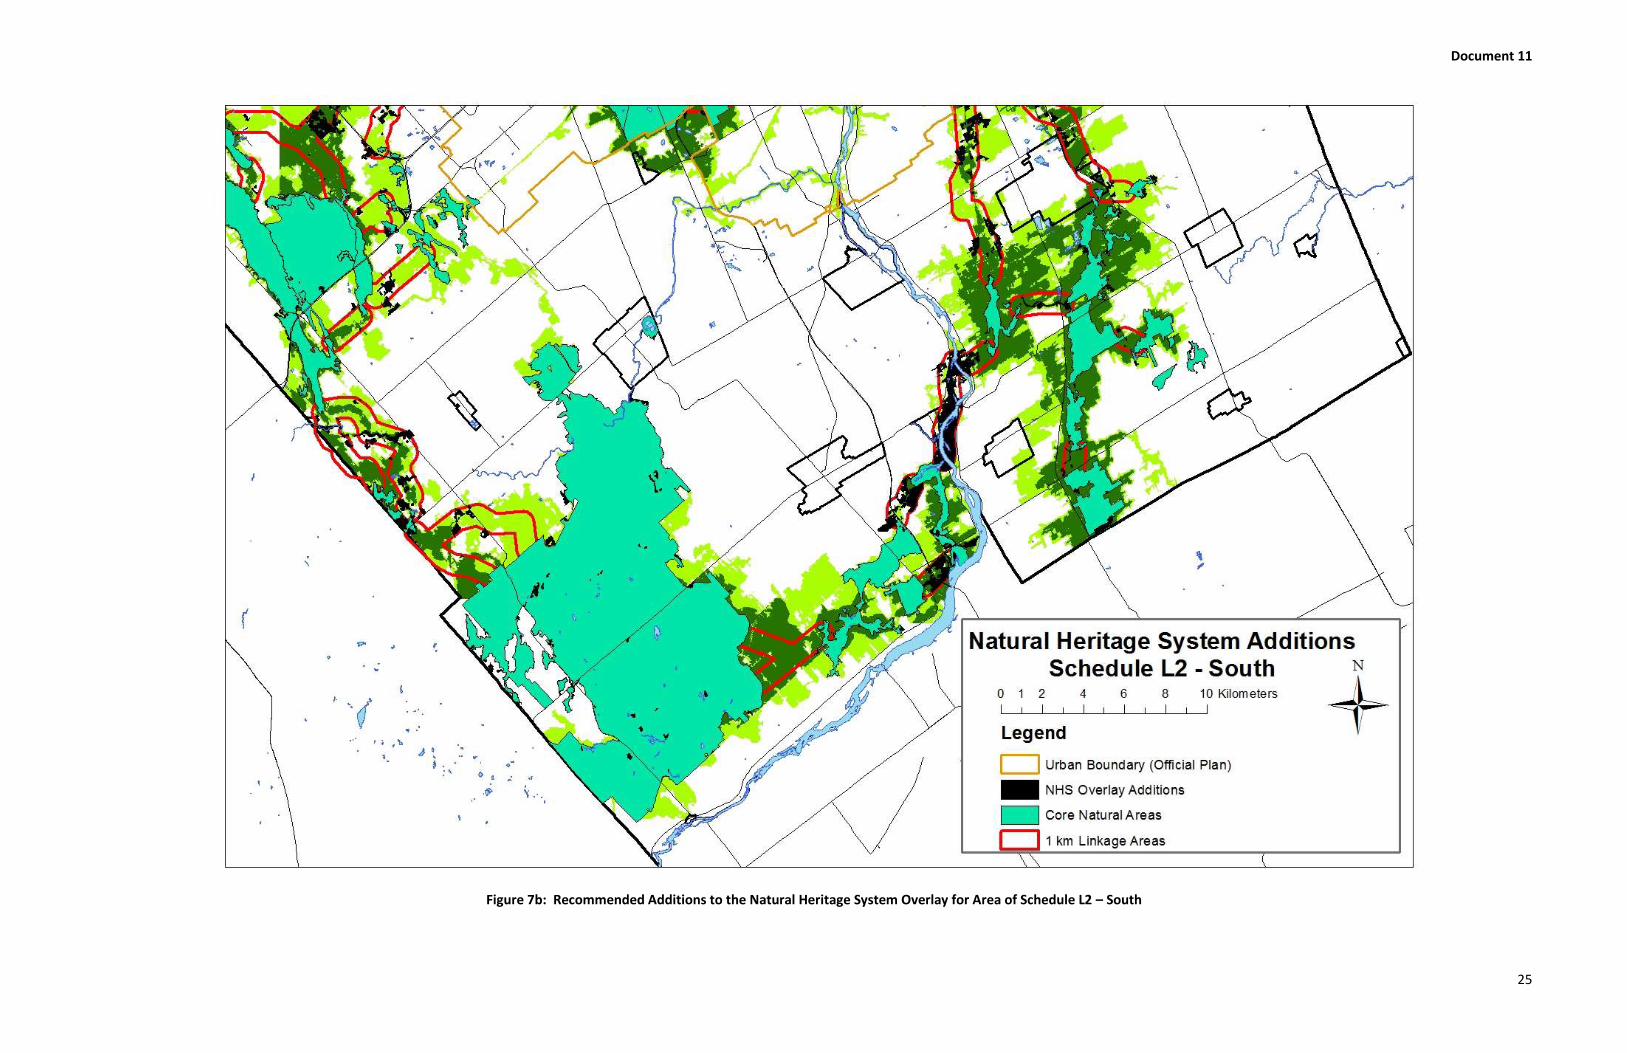
Identification of Linkage Features
The actual features recommended for inclusion in Schedules L1, L2 and L3 appear in black in Figures 7a,
7b and 7c. These features consist primarily of those woodland and floodplain areas lying within the 1
km linkage areas, that are not already included within the existing natural heritage system overlay. They
also include some additions to the core natural areas identified through the review of core natural area
boundaries (as discussed above).
The completion of this City-wide analysis does not preclude the likelihood that other linkages exist and
may be identified in future, through subsequent environmental or planning studies. Linkages occur at
varying scales, and some may only be identified upon closer examination (e.g., through subwatershed
studies or even site-specific environmental impact statements). While Schedules L1, L2 and L3 are
intended to facilitate the determination of whether an Environmental Impact Statement will be required
to support a development application, they remain incomplete and must continue to be treated as a
partial map of the natural heritage system. The final determination on whether an Environmental

Document 11
10
Impact Statement is needed will continue to be made by staff as part of the pre-application consultation
process, in accordance with the City’s Environmental Impact Statement Guidelines.
Document 11
11
Figure 2: City of Ottawa 2011 Landcover Map.
Document 11
12
Figure 3a: Movement Cost Map for the area of Schedule L1 – East
Document 11
13
Figure 3b: Movement Cost Map for the area of Schedule L2 – South
Document 11
14
Figure 3c: Movement Cost Map for the area of Schedule L3 – West

Document 11
15
Figure 4a: Cost Distance Map for the area of Schedule L1 – East
(Display limited to lower cost pixels)
Document 11
16
Figure 4b: Cost Distance Map for the area of Schedule L2 – South
(Display limited to lower cost pixels)
Document 11
17
Figure 4c: Cost Distance Map for the area of Schedule L3 – West
(Display limited to lower cost pixels)
Document 11
18
Figure 5a: Least Cost Corridor Map for the area of Schedule L1 – East
Document 11
19
Figure 5b: Least Cost Corridor Map for the area of Schedule L2 - South
Document 11
20
Figure 5c: Least Cost Corridor Map for the area of Schedule L3 – West

Document 11
21
Figure 6a: Recommended Natural Landscape Linkage Network for Area of Schedule L1 – East
Document 11
22
Figure 6b: Recommended Natural Landscape Linkage Network for Area of Schedule L2 – South

Document 11
23
Figure 6c: Recommended Natural Landscape Linkage Network for Area of Schedule L3 – West

Document 11
24
Figure 7a: Recommended Additions to the Natural Heritage System Overlay for Area of Schedule L1 – East
Document 11
25
Figure 7b: Recommended Additions to the Natural Heritage System Overlay for Area of Schedule L2 – South

Document 11
26
Figure 7b: Recommended Additions to the Natural Heritage System Overlay for Area of Schedule L3 - West
Top Related