


Languages
Pages
Legal


1
Annual Reports
2009-10
Compiled Compiled Compiled Compiled ByByByBy
Md. Mohidul Hasan
Dr. M. Hossain
&
Dr. M.S. Kadian
Tuber Crops Research Centre (TCRC) Bangladesh agricultural research institute (BARI)
Joydebpur, Gazipur-1701, Bangladesh
Tel: +88 02 9252534
Fax: +88 02 9262908
International Potato Center (CIP), SWCA
CIP Local Office
TCRC, BARI,
Joyebpur, Gazipur-1701
Bangladesh

2
CONTENTSCONTENTSCONTENTSCONTENTS
Expt. no. Title of the Experiment
Page no.
1 Secondary Yield Trial (SYT) with Late Blight Disease
Resistance CIP Potato Germplasm
1
2 Screening of Potato Varieties and CIP Germplasm Against
Heat Tolerance
7
3 Degeneration Study of Virus Resistance CIP Germplasm in
Bangladesh
12
4 Screening of Potato Varieties and CIP Germplasm
Against Salt Tolerance
18
5 Screening of CIP Clones Against Drought Tolerance
22
3
EXECUTIVE SUMMARY
Seven CIP clones viz., LB-3, LB-4, LB-6, LB-7, LB-8, LB-12 and LB-14 were evaluated against
late blight disease of potato under field condition at Bogra, Jamalpur and Munshiganj and variety
Diamant was used as check. Among the tested clones the highest average yield (38.59 t/ha) was
obtained in line LB-7 followed by LB-8. Considering late blight infection and the yield
contributing characters for 2007-08, 2008-09 and 2009-10, three clones LB-3, LB-6 and LB-7
were selected for advanced yield trial in next season.
Five CIP germplasms, like LB-1, LB-2, LB-7, LB-14 and LB-12 one TCRC improved potato
variety Diamant and one local variety Dohazari Sada were evaluated at Pahartoli, Chittagong for
their suitability against heat tolerance. Among all the studied varieties/germplasm, LB-7 was the
highest yielder (22.98 t/ha) followed by LB-1 & Diamant (20.81 t/ha).
Eleven CIP clones viz. CIP-1, CIP-2, CIP-3, CIP-4, CIP-5, CIP-6, CIP-8, CIP-9, CIP-10, CIP-13
and CIP-14 with as check variety Diamant were evaluated at Jamalpur and Jessore respectively
during 2009-10 for their suitability against virus resistant. At Jamalpur the highest tuber yield was
obtained from CIP-10 (51.97 t/ha) followed by CIP-8 with ware practice. At Jessore the highest
yield was obtained from CIP-9 (48.40 t/ha) with improved practice followed by CIP-2 (42.08 t/ha)
Seven CIP germplasm viz (LB-3, LB-4, LB-6, LB-7, LB-8, LB- 12, LB-14) one TCRC improved
potato variety Diamant and one local variety Dohazari Sada were evaluated at Ukhia, Cox’s Bazar,
for their suitability against salt tolerance. At 40 DAP the salinity in the soil was (8.9 ds/m) and all
the cones died.
In drought tolerance trial, Seven( LB-1, LB-2, LB-3, LB-7, LB-9, LB-12 and LB-14) and eleven
CIP-101, CIP-102, CIP-111, CIP-117, CIP-124, CIP-126, CIP-129, CIP-130, CIP-134, CIP-137
and CIP-139) CIP clones with as checked variety Lalpakri, Lalashil and Diamant were evaluated at
Bogra and Dinajpur respectively for their suitability against drought tolerance. Considering yield
and yield attributes, the CIP clones LB-7 produced 34.3 t/ha with normal irrigation on the other
hand 33.8 t/ha produced under one irrigation practiced at Bogra. At Dinajpur the highest yield
CIP-101 (47.62 t/ha) and (42.00 t/ha) was higher produced with normal irrigation (three irrigation)
and one irrigation respectively.

4
Experiment 1: Secondary Yield Trial (SYT) With Late Blight Disease
Resistance CIP Potato Germplasm
T.K. Dey, M. Hossain, B.K. Goswami, M.H. Reja, M.A. Haque, M.M. Rahaman, E.H.M.S. Rahaman,
M. M. Hasan and M.S. Kadian
Abstract
Seven CIP clones LB 3 (391058.175), LB 4 (393077.159), LB 6 (393280.64), LB 7 (393371.58),
LB 8 (395011.2), LB 12 (396031.119) and LB 14 (396244.12) were evaluated against late blight
disease of potato under field condition at Bogra, Jamalpur and Munshiganj and variety Diamant
was used as check. There was no late blight infection in any germplasms due to unfavorable
condition of disease development in current season. Among the tested clones the highest average
yield (38.59 t/ha) was obtained in line LB-7 followed by LB-8. Considering late blight infection
and the yield contributing characters for 2007-08, 2008-09 and 2009-10, three clones LB-3, LB-6
and LB-7 were selected for advanced yield trial in next season.
Introduction
Late blight caused by Phytophthora infestans is one of the most destructive diseases of
potato. Late blight is a serious problem for potato production in Bangladesh. The disease
causes serious yield loss depending upon the stages of plant growth, susceptibility of
variety, and aggressiveness of the pathogen and prevailing environmental factors (Dey et.
al., 1995, Hossain et al., 2002). Cultivation of resistant varieties/cultivars is the best option
against any plant disease. So, the present study was undertaken to find out resistant
source(s) if any in the newly introduced international Potato Centre (CIP) potato clones
against late blight disease.
Materials and Methods
Seven CIP clones were evaluated for late blight resistant at three locations namely Spices Research
Center, Bogra, RARS Jamalpur and TCRSC, Munshiganj. The CIP clones included in the late
blight trial were LB 3 (391058.175), LB 4 (393077.159), LB 6 (393280.64), LB 7 (393371.58), LB
8 (395011.2), LB 12 (396031.119) and LB 14 (396244.12) and the variety Diamant was used as
check. Plant spacing was 60 cm X 25 cm, Plot size 2.4 m X 3.0 m in RCB design with 3
replications. The date of planting was 24.11.2009 at Bogra and Jamalpur, and 22.11.2009 was at
Munshiganj. Fertilizers were applied @ 325-220-250-120 kg/ha of Urea, TSP, MP and Gypsum,
respectively. Full amount of TSP, MP and Gypsum and 50% of urea were applied as basal and the
remaining amount of urea was side dressed at 35 DAP. Weeding, irrigation, earthing-up and other
intercultural operations were done as and when necessary. No fungicide was used in the trial. Late
blight data were taken on per cent foliage infection visually under natural condition. The crop was

5
harvested at 90 DAP in all locations. The date of planting 17, 18, 20 February 2010 at Bogra,
Jamalpur and Munshiganj respectively. All the data yield and yield contributing characters were
recorded and was statistically analyzed MSTATC program. Plant vigor was recorded on 1-5 scale,
where 1 is very poor vigor and 5 is highly vigorous.
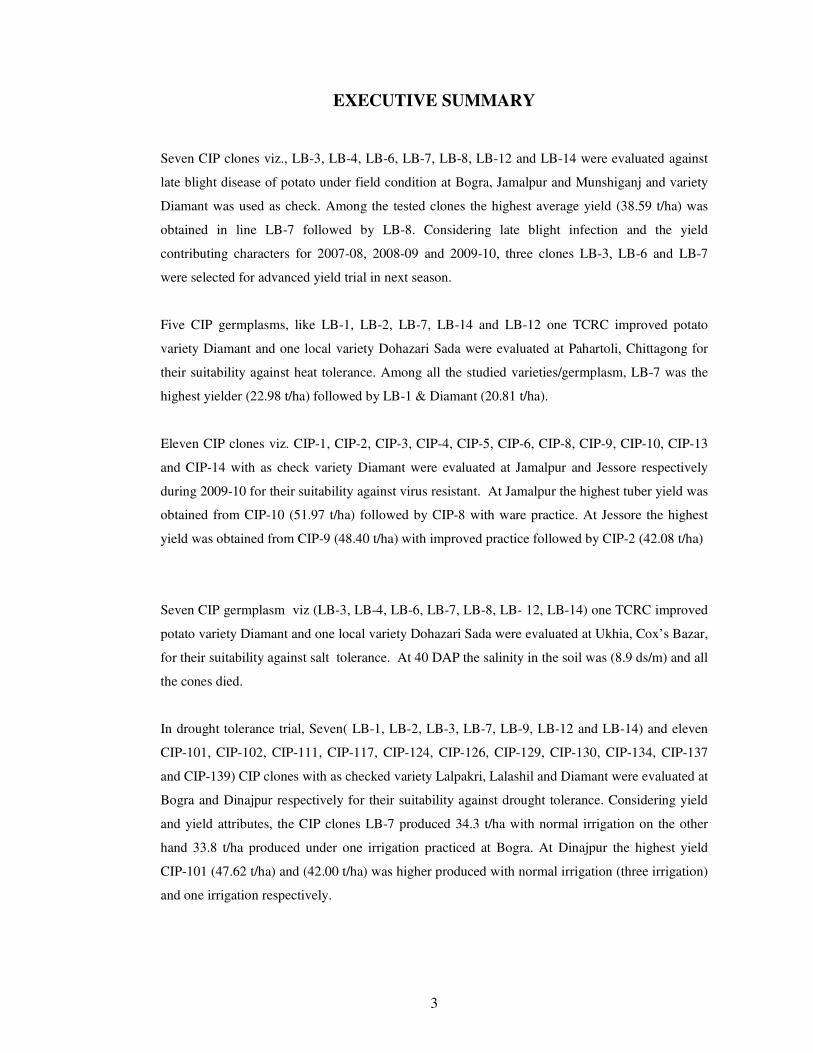
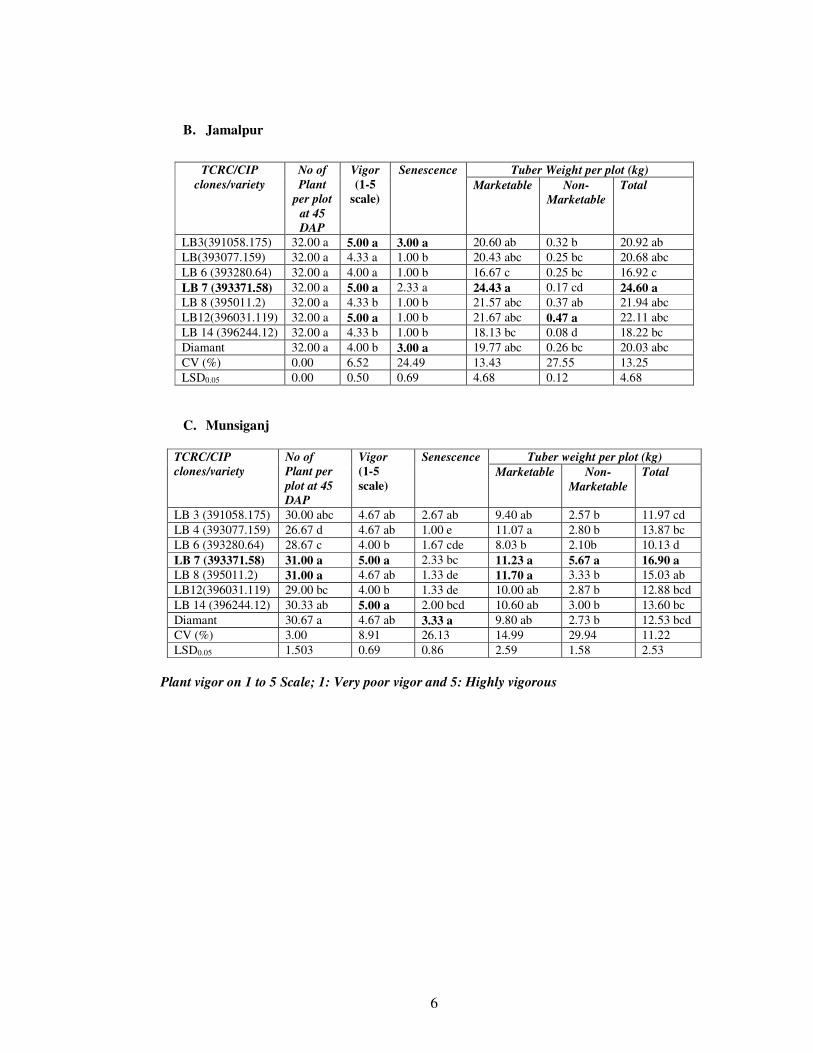
Results and Discussion
There was a significant difference of the CIP lines towards growth parameter and different yield
contributing characters of potato. The details of the results were presented in (Table 1.1 to 1.6). In
this year there are no infection of late blight in all CIP clones including check variety of Diamant
due to unfavorable environment condition for late blight development. The weather of this year in
Bangladesh was not favourable for late blight.
Number of plant per plot at 45 days after planting (DAP), vigor (1-5 scale), senescence, tuber
weight (kg), tuber number , marketable t/ha, yield t/ha, average tuber weight (g), dry matter
percent (DM%) and average tuber weight (g) varied significantly at 90 DAP at Bogra and
Jamalpur and Munshiganj (Table 1.1 & 1.2).
Table 1.1 Performance of CIP late blight resistant clones at three locations in Bangladesh
during 2009-10
A. Bogra
CIP/ TCRC
clones/variety
No of Plant
per plot at
45 DAP
Vigor
(1-5
scale)
Senescence Tuber weight per plot (kg)
Marketable Non-
Marketable
Total
LB 3 (391058.175) 30.67 ab 5.00 a 2.67 ab 10.38 b 0.36 a 10.75 bc
LB 4 (393077.159) 21.67 c 4.33 a 1.00 d 7.80 c 0.17 a 7.97 d
LB 6 (393280.64) 28.33 b 4.67 a 1.67 cd 10.20 b 0.19 a 10.39 c
LB 7 (393371.58) 31.00 ab 5.00 a 2.33 abc 12.92 a 0.19 a 13.11 a
LB 8 (395011.2) 30.33 ab 4.67 a 1.00 d 11.10 ab 0.25 a 11.35 abc
LB12(396031.119) 31.67 a 4.33 a 1.00 d 11.60 ab 0.30 a 11.90 abc
LB 14 (396244.12) 22.00 c 4.33 a 2.00 bc 7.80 c 0.10 a 7.90 d
Diamant 31.67 a 4.67 a 3.00 a 12.10 ab 0.16 a 12.26 ab
CV (%) 5.64 11.56 28.85 9.70 81.12 9.14
LSD0.05 2.71 0.90 0.89 1.71 0.30 1.65
6
B. Jamalpur
TCRC/CIP
clones/variety
No of
Plant
per plot
at 45
DAP
Vigor
(1-5
scale)
Senescence Tuber Weight per plot (kg)
Marketable Non-
Marketable
Total
LB3(391058.175) 32.00 a 5.00 a 3.00 a 20.60 ab 0.32 b 20.92 ab
LB(393077.159) 32.00 a 4.33 a 1.00 b 20.43 abc 0.25 bc 20.68 abc
LB 6 (393280.64) 32.00 a 4.00 a 1.00 b 16.67 c 0.25 bc 16.92 c
LB 7 (393371.58) 32.00 a 5.00 a 2.33 a 24.43 a 0.17 cd 24.60 a
LB 8 (395011.2) 32.00 a 4.33 b 1.00 b 21.57 abc 0.37 ab 21.94 abc
LB12(396031.119) 32.00 a 5.00 a 1.00 b 21.67 abc 0.47 a 22.11 abc
LB 14 (396244.12) 32.00 a 4.33 b 1.00 b 18.13 bc 0.08 d 18.22 bc
Diamant 32.00 a 4.00 b 3.00 a 19.77 abc 0.26 bc 20.03 abc
CV (%) 0.00 6.52 24.49 13.43 27.55 13.25
LSD0.05 0.00 0.50 0.69 4.68 0.12 4.68
C. Munsiganj
TCRC/CIP
clones/variety
No of
Plant per
plot at 45
DAP
Vigor
(1-5
scale)
Senescence Tuber weight per plot (kg)
Marketable Non-
Marketable
Total
LB 3 (391058.175) 30.00 abc 4.67 ab 2.67 ab 9.40 ab 2.57 b 11.97 cd
LB 4 (393077.159) 26.67 d 4.67 ab 1.00 e 11.07 a 2.80 b 13.87 bc
LB 6 (393280.64) 28.67 c 4.00 b 1.67 cde 8.03 b 2.10b 10.13 d
LB 7 (393371.58) 31.00 a 5.00 a 2.33 bc 11.23 a 5.67 a 16.90 a
LB 8 (395011.2) 31.00 a 4.67 ab 1.33 de 11.70 a 3.33 b 15.03 ab
LB12(396031.119) 29.00 bc 4.00 b 1.33 de 10.00 ab 2.87 b 12.88 bcd
LB 14 (396244.12) 30.33 ab 5.00 a 2.00 bcd 10.60 ab 3.00 b 13.60 bc
Diamant 30.67 a 4.67 ab 3.33 a 9.80 ab 2.73 b 12.53 bcd
CV (%) 3.00 8.91 26.13 14.99 29.94 11.22
LSD0.05 1.503 0.69 0.86 2.59 1.58 2.53
Plant vigor on 1 to 5 Scale; 1: Very poor vigor and 5: Highly vigorous
7
Table 1.3 Yield performance of CIP late blight resistant clones at three locations in
Bangladesh during 2009-10
A. Bogra
TCRC/
CIP clones/
Variety
Tuber Number per Plot Marketable
t/ha
Yield
t/ha
Avg.
tuber
weight
(g)
DM (%)
Marketable Non-
Marketable
Total
LB 3 165.33 c 29.00 abcd 194.33 c 22.57 b 23.37 b 55.41 cd 20.24 ab
LB 4 115.00 d 17.33 cd 132.33 d 23.88 ab 24.37 ab 59.98 bc 17.35 cd
LB 6 205.33 ab 42.00 abc 247.33 ab 23.98 ab 24.42 b 42.07 e 18.53 bc
LB 7 205.00 ab 31.67 abcd 236.67 b 27.78 a 28.18 a 55.37 cd 19.30 abc
LB 8 198.00 b 47.33 ab 245.33 b 24.51 ab 25.04 ab 46.55 de 19.33 abc
LB 12 231.67 a 49.33 a 281.00 a 24.44 ab 25.06 ab 42.48 e 20.87 a
LB 14 77.33 e 13.00 d 90.33 e 23.52 b 23.84 b 90.34 a 16.09 d
Diamant 160.00 c 23.33 bcd 183.33 c 25.48 ab 25.89 ab 67.45 b 19.44 ab
CV (%) 10.53 42.20 9.92 8.75 8.05 11.43 5.73
LSD0.05 30.18 22.54 33.75 3.62 3.40 11.10 1.83
B. Jamalpur
TCRC/
CIP
clones/
Variety
Tuber Number per Plot Marketable
t/ha
Yield
t/ha
Avg. tuber
weight (g)
DM (%)
Marketable Non-
Marketable
Total
LB 3 219.67 b 40.33 bc 260.00 abc 47.08 ab 47.75 ab 88.35 bc 20.67 a
LB 4 181.00 d 31.00cd 212.00 bcd 42.57 abc 43.08 abc 97.91 b 18.33 a
LB 6 161.33 e 38.67 c 200.00 cd 34.75 c 35.24 c 83.25 bc 21.00 a
LB 7 255.00 a 20.33 cd 275.33 ab 50.90 a 51.25 a 90.12 bc 20.33 a
LB 8 254.67 a 58.00 ab 312.67 a 44.93 abc 45.70 abc 70.87 c 20.33 a
LB 12 256.67 a 68.33 a 325.00 a 45.14 abc 46.07 abc 68.53 c 20.67 a
LB 14 138.67 f 11.33 d 150.00 d 37.78 bc 37.95 bc 123.85 a 19.00 a
Diamant 198.33 c 30.00 cd 228.33 bc 41.18 abc 41.52 abc 89.45 bc 19.67 a
CV (%) 14.92 29.26 14.68 13.43 13.23 15.50 7.04
LSD0.05 52.46 18.41 60.85 9.76 9.737 23.32 2.38
D. Munsiganj
TCRC/
CIP
clones/
Variety
Tuber Number per Plot Marketable
t/ha
Yield t/ha Avg.
tuber
weight
(g)
DM (%)
Marketable Non-
Marketable
Total
LB 3 145.67 ab 64.00 ab 209.67 abc 20.82 b 26.52 cd 57.17 bc 19.30 abc
LB 4 151.00 ab 39.67 b 190.67 bc 27.75 a 34.72 ab 74.32 a 17.93 bc
LB 6 144.67 ab 73.67 ab 218.33 abc 18.81 b 23.69 d 46.26 c 17.70 c
LB 7 168.67 ab 95.33 a 264.00 a 24.16 ab 36.34 a 64.91 ab 20.60 a
LB 8 183.00 ab 75.67 ab 258.67 a 25.16 ab 32.33 abc 58.19 bc 19.20 abc
LB 12 195.00 a 73.67 ab 268.67 a 23.02 ab 29.56 bcd 48.35 c 19.70 ab
LB 14 184.33 ab 67.67 ab 252.00 ab 23.35 ab 29.91 bcd 55.38 bc 19.03 abc
Diamant 140.00 b 42.33 b 182.33 c 21.31 ab 27.23 cd 69.06 ab 18.17 bc
CV (%) 17.31 32.80 14.74 15.58 11.13 14.44 5.17
LSD0.05 47.96 36.84 57.39 6.07 5.65 14.44 1.66
8
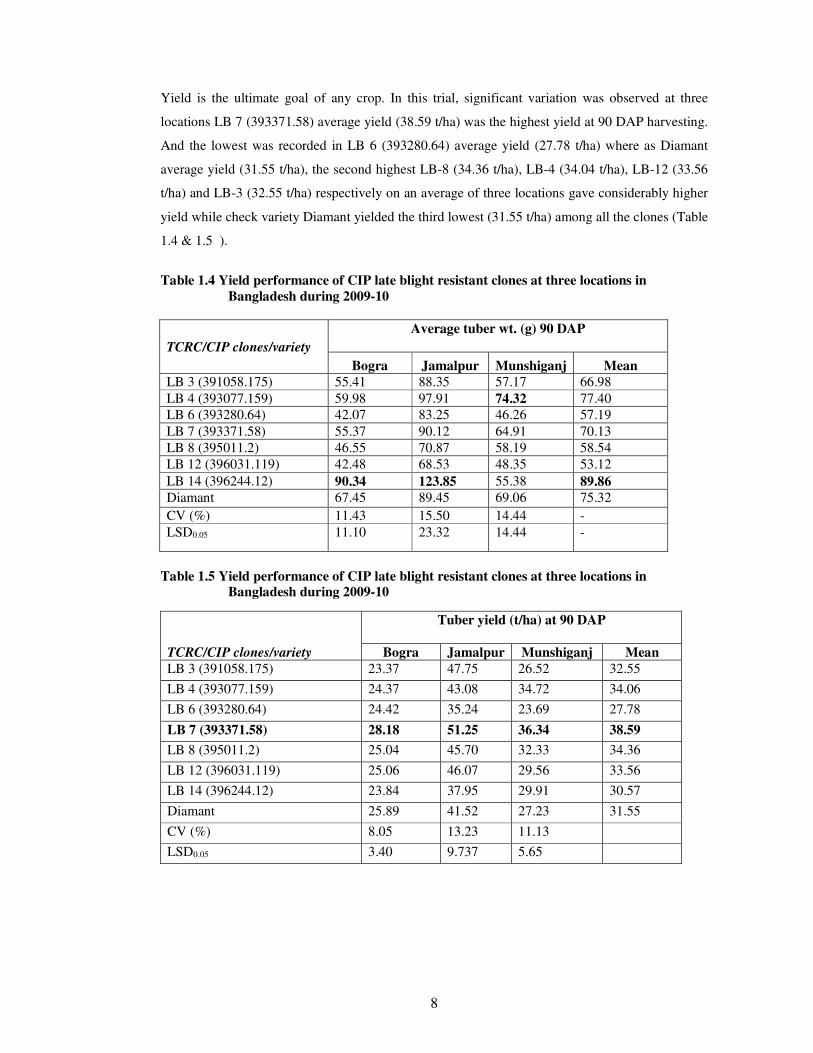
Yield is the ultimate goal of any crop. In this trial, significant variation was observed at three
locations LB 7 (393371.58) average yield (38.59 t/ha) was the highest yield at 90 DAP harvesting.
And the lowest was recorded in LB 6 (393280.64) average yield (27.78 t/ha) where as Diamant
average yield (31.55 t/ha), the second highest LB-8 (34.36 t/ha), LB-4 (34.04 t/ha), LB-12 (33.56
t/ha) and LB-3 (32.55 t/ha) respectively on an average of three locations gave considerably higher
yield while check variety Diamant yielded the third lowest (31.55 t/ha) among all the clones (Table
1.4 & 1.5 ).
Table 1.4 Yield performance of CIP late blight resistant clones at three locations in
Bangladesh during 2009-10
TCRC/CIP clones/variety
Average tuber wt. (g) 90 DAP
Bogra Jamalpur Munshiganj Mean
LB 3 (391058.175) 55.41 88.35 57.17 66.98
LB 4 (393077.159) 59.98 97.91 74.32 77.40
LB 6 (393280.64) 42.07 83.25 46.26 57.19
LB 7 (393371.58) 55.37 90.12 64.91 70.13
LB 8 (395011.2) 46.55 70.87 58.19 58.54
LB 12 (396031.119) 42.48 68.53 48.35 53.12
LB 14 (396244.12) 90.34 123.85 55.38 89.86
Diamant 67.45 89.45 69.06 75.32
CV (%) 11.43 15.50 14.44 -
LSD0.05 11.10 23.32 14.44 -
Table 1.5 Yield performance of CIP late blight resistant clones at three locations in
Bangladesh during 2009-10
TCRC/CIP clones/variety
Tuber yield (t/ha) at 90 DAP
Bogra Jamalpur Munshiganj Mean
LB 3 (391058.175) 23.37 47.75 26.52 32.55
LB 4 (393077.159) 24.37 43.08 34.72 34.06
LB 6 (393280.64) 24.42 35.24 23.69 27.78
LB 7 (393371.58) 28.18 51.25 36.34 38.59
LB 8 (395011.2) 25.04 45.70 32.33 34.36
LB 12 (396031.119) 25.06 46.07 29.56 33.56
LB 14 (396244.12) 23.84 37.95 29.91 30.57
Diamant 25.89 41.52 27.23 31.55
CV (%) 8.05 13.23 11.13
LSD0.05 3.40 9.737 5.65

9
Table 1.6 Participatory yield trial of CIP late blight resistant clones at two farmer’s field in
Bangladesh during 2009-10
Name of the
clones/variety
Yield t/ha
Bogra Munshiganj Jamalpur Mean
LB 3 (391058.175) 19.07 30.0 26.33 25.13
LB 4 (393077.159) 24.31 25.5 38.89 29.57
LB 6 (393280.64) 26.32 15.6 26.67 22.86
LB 7 (393371.58) 35.45 33.3 43.33 37.36
LB 8 (395011.2) 18.10 30.0 30.14 26.08
LB 12 (396031.119) 27.91 - 33.06 30.37
LB 14 (396244.12) 23.67 35.5 34.58 31.25
Diamant 22.61 32.2 25.42 26.74
Remarks & farmers reaction: At farmers yield trial LB-7 was the highest yielder and they also like red skin uniform shaped LB-
12.
Conclusion: Considering the above factors shown in the above table revealed that clones CIP LB-7 produced
the highest yield followed LB-4 and LB-8. Moreover, skin color, flesh color and shape of the
potatoes were good and remarkable in LB-6 and LB-7. So these materials can be tested for
advanced yield trial.
References
Dey, T.K., Ali, M.S. and M.A. Hoque. 1995. Efficacy of fungicides in controlling late blight of potato.
Bangladesh Journal of Agricultural Research, 20(1): 62-66.
Hossain M., Dey T.K., Haque M.A., Rahman M.M. and M.S. Ali. 2002. Studies on the Late Blight Disease
of Potato in Bangladesh . Abstract in the Proceedings of the GILB Conference held at Germany
from 11-13 July, 2002.
Experiment 2: Screening of Potato Varieties and CIP Germplasm Against
Heat Tolerance
M. Dhar, M. Hossain, B.C. Kundu, A.T.M.T. Islam, S. Abdullah, M.H. Rahman, E.H.M.S. Rahaman,
M. M. Hasan and M.S. Kadian
Abstract
Five CIP germplasms, one TCRC improved potato variety and one local variety were evaluated at
Pahartoli, Chittagong during 2009-10 for their suitability against heat tolerance. Among the
improved variety Diamant, local variety Dohazari Sada and all the CIP germplasms found to be
promising against heat tolerance.

10
Introduction
A rise in temperature leads to increased transpiration in the plants, thus raising their demand for
water. In many of the drier potato growing regions this will cause water stress, leading yields to
decline. Temperature has a crucial influence on starch deposition in potato tubers. The ideal
temperature range is between 15 and 18°C. Overnight temperatures above 22°C severely hamper
tuber development. By contrast, the impact of climate change on potato yields is expected to be
favourable in cultivation areas at higher altitudes. In many of these areas the climatic conditions
for potato growing are improving due to the rising temperatures. Winter season in Bangladesh is
vary short November to March. In the later stage temperature raises very fast so potato plants can
not survive in high temperature. So, we have studied the to identify the potato varieties/germplasm
suitable for cultivation under temperature and extensive study on heat-tolerant expression in
potatoes using commercially important potato cultivars aspect in Bangladesh.
Materials and Methods
One improved (Diamant) & local (Dohazari Sada) variety and five promising CIP germplasms
such as LB-1 (391004.18), LB-2 (391046.14), LB-7 (393371.58), LB- 12 (396031.119) and LB-14
(396244.12) were evaluated against heat tolerance at ARS, Pahartali, Chittagong during 2009-10.
Brief of the experiments are shown in table 2.1. Total number of tuber 30 per plot. Fertilizers were
applied @ 325-220-250-120 kg/ha of Urea, TSP, MP and Gypsum, respectively. Full amount of
TSP, MP and Gypsum and 50% of urea were applied as basal and the remaining amount of urea
was side dressed at 35 DAP. Weeding, irrigation, earthing-up and other intercultural operations
were done as per TCRC recommendation. The crop was harvested at 90 DAP. All the yield and
yield contributing characters data were recorded and were analyzed statistically. Plant vigor was
recorded on 1-5 scale, where 1 is very poor vigor and 5 is highly vigorous.
Table 2.1. Experiments in brief of heat tolerance trial at Pahartali, Chittagong during 2009-
10
Plant spacing : 60 cm X 25 cm
Plot size : 1.8 m X 2.0 m
Design : RCB
Replication : 3.00
Plot to plot : 0.60 m
Rep-rep distance : 1.0 m
No of rows per plot : 3
No of tubers per row : 10
Date of planting : 26.12.2009
Date of halm pulling : 15.03.2010
Date of harvesting : 23.03.2010

11
Results and Discussion
All the yield and yield contributing characters of the studied varieties and germplasms varied
significantly. All the varieties showed more than 85% emergence except LB-12 which had the
lowest germination (18.06%). Considering plant vigour, LB-12, Diamant and Dohazri Sada was
the robust while LB-1 & LB-14 showed less vigour but there was no significant variation. Plant
heights at 60 DAP varied significantly and it was ranged from 38.07 to 60.07 cm. Number of stems
per plant at 45 DAP was not varied significance among the studied varieties/germplasm. The local
variety Dohazari Sada was looked as indigenous type and had the highest number of compound
leaves/plant (252.87), while 97-40 to 145.87 was recorded among the CIP germplasms/varieties.
All the CIP germplasms had good number of compound leaves per plants. Percent ground
coverage showed more than 80% except Diamant. There was no significant effect of senescence
percent at 60 DAP but it was varied significance at 67 and 74 DAP of the studied
varieties/germplasm on the heat tolerance trial (Table 2.2).
Table 2.2 Morphological character of heat tolerance trial at Pahartoli, Chittagong
TCRC/CIP
clones/variety
Emergence
(%)
Plant
vigor*
Plant height (cm) at DAP Stems/plant
at 45 DAP 45 60
LB-1(391004.18) 100.00 a 4.67 a 34.00 c 38.07 c 8.80a
LB-2 (391046.14) 92.22 a 4.33 a 41.33 ab 60.07 a 6.93a
LB-7 (393371.58) 98.89 a 4.67 a 42.87 a 52.00 ab 4.47a
LB-14 (396244.12) 95.56 a 4.33 a 45.13 a 54.80 ab 9.67a
LB-12 (396031.119) 21.11 b 5.00 a 25.30 d 45.77 bc 3.48a
Diamant 97.78 a 5.00 a 34.67 bc 38.93 c 8.92a
Dohazari Sada 98.89 a 5.00 a 35.80 bc 54.40 abc 6.80a
CV (%) 7.11 0.76 10.10 14.66 52.72
LSD 0.05 9.70 9.45 6.37 12.27 6.294
Continue
TCRC/CIP clones/variety Compound
leaves/plant
PGC Senescence (%) at DAP
60 67 74
LB-1(391004.18) 97.40 bc 90.00 a 4.67a 2.33c 2.33c
LB-2 (391046.14) 145.87 b 90.00 a 4.33a 3.00bc 3.00bc
LB-7 (393371.58) 88.07 bc 95.00 a 4.67a 3.33ab 3.33ab
LB-14 (396244.12) 139.70 bc 93.33 a 4.33a 3.00bc 3.00bc
LB-12 (396031.119) 101.97 bc 80.00 b 5.00a 3.33ab 3.33ab
Diamant 80.53 c 91.67 a 5.00a 2.33 c 2.33c
Dohazari Sada 252.87 a 96.67 a 5.00a 4.00 a 4.00a
CV (%) 26.43 5.79 9.45 11.04 15.19
LSD 0.05 58.28 8.977 0.76 0.742 0.788
* Plant vigor on 1 to 5 Scale; where 1 is very poor vigor and 5 is highly vigorous

12
Number and weight of marketable and non-marketable tubers per plot showed significant effect
among the studied varieties/germplasm (Table 2.3). The highest number of tubers/plot
(marketable) was recorded in local variety Dohazari Sada (538.67) as the tubers were medium to
very small in size. LB-7 (10.34 kg) was the highest value of total weight of tuber (kg) per plot
followed by LB-1 and Diamant.
Table 2.3 Yield attributes of heat tolerance trial at Pahartoli, Chittagong
TCRC/CIP
clones/variety
Number of tubers/plot Weight of tubers per plot (kg)
Marketable Non-
Marketable
Total Marketable Non-
Marketable
Total
LB-1 (391004.18) 183.33 b 136.33 b 319.67 b 5.60 a 2.26 ab 7.86 ab LB-2 (391046.14) 79.67 c 125.00 b 204.67 bc 5.33 a 2.57 a 7.91 ab
LB-7 (393371.58) 134.67 bc 113.67 b 248.34 bc 7.63 a 2.71 a 10.34 a
LB-14 (396244.12) 119.00 bc 161.33 b 280.33 bc 5.78 a 2.86 a 8.64 ab
LB12(396031.119) 61.00 c 68.67 b 129.67 c 1.11 b 1.23 b 2.34 c
Diamant 129.00 bc 110.33 b 239.33 bc 6.80 a 2.56 a 9.36 ab
Dohazari Sada 538.67 a 467.33 a 1006.00 a 5.67 a 1.84 ab 7.51 b
CV (%) 28.79 39.17 26.85 28.64 29.59 17.69 LSD 0.05 87.25 112.7 157.9 2.64 1.15 2.39
Tubers weight per plant had varied effect among the varieties and highest weight was obtained
from the CIP germplasm LB-7 (561.00 g) followed by improved variety Diamant, LB-12 (499.67
g), while lowest was recorded in Dohazari Sada (343.00 g). Considering average tuber weight, it
was also varied and ranges from 5.56 g (Dohazari Sada) to 49.94 g (LB-12). Average tuber weight
was also found better in LB-7 (45.75 g) and Diamant (44.57 g). Percentage of dry matter had no
significant effect among the variety/germplasm and highest was recorded in LB-14 (20.00 %)
followed by LB-7 (19.00%) & LB-1 (18.33%). Among all the studied varieties/germplasm, LB-7
was the highest yielder (22.98 t/ha) followed by LB-1 & Diamant (20.81 t/ha) which was
significantly similar while local variety Dohazari Sada gave lowest yield (16.68 t/ha). CIP
germplasm LB-7 (22.98 t/ha) was found promising and gave comparatively better yield than
popular variety Diamant (20.81 t/ha) (Table 2.4).
Among the CIP germplasm, oblong to oval tubers was observed in LB-1 and LB-2, while tubers of
LB-7 and LB-14 had a round-oval-oblong-segregated shaped. Over all ranking of the tubers among
the CIP germplasm, LB-1, LB-7 & LB-12 ranked first followed by, LB-2, Dohazari Sada and
Diamant. (Table 2.5). Over all performance of the popular variety Diamant in heat tolerance trial
was not good but further investigation is needed for conclusion. Environmental data were
presented at annexure –A.

13
Table 2.4 Yield attributes of heat tolerance trial at Pahartali, Chittagong
TCRC/CIP
clones/variety
Tubers
wt. /
Plant (g)
Tubers
number
/
Plant
Average
tuber
wt. (g)
%Dry
Matter
Yield (t/ha)
Marketable Non-
Marketable
Total
LB-1 (391004.18) 431.33 ab 15.60 b 28.21 cd 18.33 a 12.33 a 5.03 ab 17.36ab
LB-2 (391046.14) 439.33 ab 12.13 b 37.07 bc 17.67 a 11.67 a 5.72 a 17.39ab
LB-7 (393371.58) 561.00 a 12.47 b 45.75 ab 19.00 a 17.00 a 6.02 a 23.02 a
LB-14 (396244.12) 470.67 ab 19.27 b 24.69 d 20.00 a 13.00 a 6.35 a 19.35ab
LB12(396031.119) 499.67 a 10.07 b 49.94 a 18.00 a 2.33 b 2.74 b 5.07 c
Diamant 507.67 a 11.53 b 44.57 ab 18.00 a 15.00 a 5.70 a 20.07ab
Dohazari Sada 343.00 b 64.17 a 5.56 e 18.67 a 12.67 a 4.09 ab 16.76 b
CV (%) 17.89 37.56 18.09 9.23 28.15 29.61 17.70
LSD 0.05 141.60 13.27 10.38 2.911 5.754 2.568 5.31
Table 2.5 Observations for heat tolerance trial at Chittagong during 2009-10 cropping
season
TCRC/CIP
clones/variety Observations
LB 1 (391004.18) Yellow skin, oblong, fleet eyes, rotten 4%, cut worm 4%, scab 4%, yellow flesh (4*)
LB 2 (391046.14) Yellow skin, flat round to oval, medium to large tubers, fleet eyes, 11% scab, 2%
cutworm, 9% rotten , heat sprout <1%, yellow flesh (3*)
LB 7 (393371.58) Yellow skin, segregated shaped with round-long-flat, fleet & picked eyes, medium to
large tubers, 6% scab, 8% cut worm, 4% rotten, 2% greening, white flesh (4*)
LB12(396031.119) Red skin, round, medium deep eyes, medium to large size tuber, medium size tuber,
<1% scab, 10% cut worm, 6% rotten, yellow flesh (4*)
LB 14 (396244.12) Yellow skin, oblong-oval-round, fleet eyes, medium to large size, 30% rotten, 20%
scab, 18% cutworm, heat sprout 9%, greening 5%, yellow flesh (1*)
Dohazari Sada Mixed with yellow & pink tuber, round, pronounced picked & deep eyes, small to
medium size, less disease and pest, <1% cut worm, <3% rotten, yellow flesh (3*)
Diamant Yellow skin, oblong tuber, fleet eyes, 4% scab, 10% cut worm, 7% rotten, heat
sprout 2%, yellow flesh (3*)
*over all ranking of the tubers was done using 1-5 scale, where 1 is poor quality and 5 is the best
References
Hijmans, R.J. 2003. The effect of climate change on global potato production. American Journal of Potato
Research. 80: 271-280.
Steyn, J.M., H.F. Du Plessis and P.S. Hammes. 1998. A field screening technique for drought tolerance
studies in potatoes. Potato Research. 41: 295-203.
14
Experiment 3: Degeneration Study of Virus Resistance CIP Germplasm in
Bangladesh
M. Hossain, T.K. Dey, B.C. Kundu, A.T.M.T. Islam, S. Abdullah, B.K. Goswami, E.H.M.S.
Rahaman, M.M. Hasan and M.S. Kadian
Abstract
Eleven CIP clones viz. CIP-1, CIP-2, CIP-3, CIP-4, CIP-5, CIP-6, CIP-8, CIP-9, CIP-10, CIP-13
and CIP-14 with as check variety Diamant were evaluated at Jamalpur and Jessore respectively
during 2009-10 for their suitability against virus resistant. The study was done through improved
and ware practices. At Jamalpur the highest tuber yield was obtained from CIP-10 (51.97 t/ha)
with ware practice whereas Diamant (36.87 t/ha) produced with ware practice. At Jessore the
highest yield was obtained from CIP-9 (48.40 t/ha) with improved practice whereas check variety
Diamant (30.63 t/ha) with improved practice. Virus data will be recorded in next season.
Introduction
Potato (Solanum tuberosum) is the most important commercial crop in Bangladesh. Unfortunately,
potato crops suffer from many fungal bacterial and viral diseases in the country. Among the virus
diseases, potato leaf roll virus (PLRV) and potato virus Y (PVY) are the most important. In
Bangladesh reduction of tuber yield due to PLRV and PVY is reported to rise up to 78% and 85 %
respectively (Hossain et al., 1989 and Hossain and Ali 1993). So the present study was undertaken
to estimate the degeneration of CIP clones due to virus diseases.
Materials and Methods
An experiment was conducted at two locations (Jamalpur and Jessore) during Rabi season 2009-
2010 to evaluate the degeneration effect of virus resistance CIP potato germplasms, viz. CIP-1
(CIP 390637.1), CIP-2 (CIP 391846.5), CIP-3 (CIP 394034.7), CIP-4 (CIP 394611.112), CIP-5
(CIP 394613.139), CIP-6 (CIP 395192.1), CIP-8 (CIP 395195.7), CIP-9 (CIP 397006.18), CIP-10
(CIP 397029.21), CIP-13 (CIP 397073.7), and CIP-14 (CIP 397079.6) with a check variety
Diamant for virus registrant. Design was followed RCB and each treatment was replicated six (6)
times with spacing 60 cm X 25 cm. The plot size 1.8 m X 1.25 m, the date of planting 25
December at Jamalpur and 6 December at Jessore, 2009. Distance in between two treatments: 3m
and there five rows of wheat were planted as boarder plant. There were two treatments; T1:
improved practice, T2: ware practice. In improved practices, insecticides admire was sprayed in
15 days interval. In ware practice the insecticide was not sprayed. Fertilizers were applied @ 325-
220-250-120 kg/ha of Urea, TSP, MP and Gypsum, respectively. Full amount of TSP, MP and
Gypsum and 50% of urea were applied as basal and the remaining amount of urea was side dressed

15
at 35 DAP. Weeding, spraying and other intercultural operations were done as and when
necessary. The crop was harvested at 80 DAP. All the yield and yield contributing characters data
were recorded and were statistically analyzed. Plant vigor was recorded on 1-5 scale, where 1 is
very poor vigor and 5 is highly vigorous. Senescence of the crop was recorded on 1 to 5 scale
where, 5=0-20%; 4=21-40%; 3= 41-60%; 2= 61-80% and 1= 81-100%).
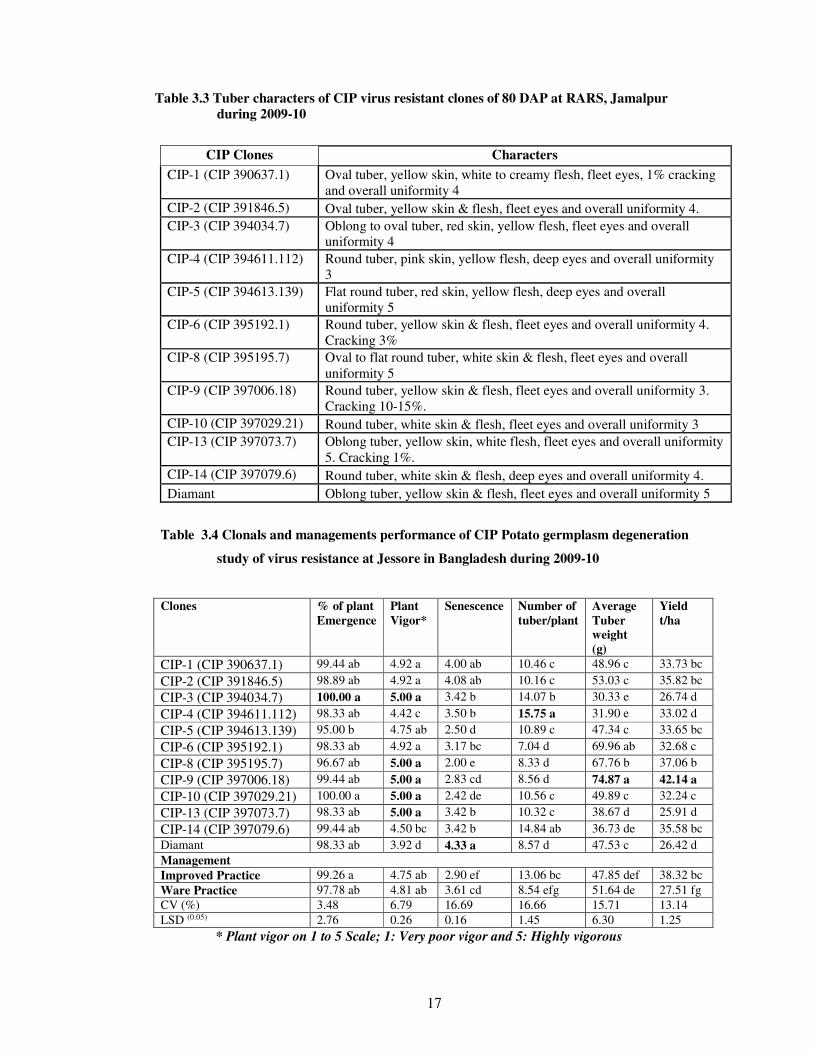
Results and discussion
There was a significant difference of the CIP clones towards growth parameter and different yield
contributing characters of potato. The details of the results were presented in 5.1 to 5.3 for
Jamalpur and Table 3.4 to 3.6 for Jessore. Percent of plant emergence, plant vigor (1-5 scale),
senescence, number of tuber per plant, average tuber weight (g), yield t/ha and dry matter percent
(DM%) varied significantly at 90 DAP at Jamalpur and Jessore. At Jamalpur, interaction effects
between clones and managements the tuber production maximum (51.97 t/ha) was obtained from
CIP-10 with ware practiced followed by CIP-8 and CIP-14, the lowest yield recorded from CIP-3
(30.75 t/ha) with ware practiced. At Jessore effect of interaction the maximum yield (48.40 t/ha)
was obtained from CIP-9 with improved practice followed by the CIP-2 and the lowest yield
(19.53 t/ha) was obtained from CIP-13 with ware practiced (Table 3.6).
Table 3.1 Clonals and managements performance of CIP Potato germplasm degeneration
study of virus resistance at Jamalpur in Bangladesh during 2009-10
* Plant vigor on 1 to 5 Scale; 1: Very poor vigor and 5: Highly vigorous
Value in the column having common letter(s) do not differ significantly at 5% level by DMRT
Clones % of plant Emergence
Plant Vigor *
Senescence Number of tuber/plant
Average Tuber weight (g)
Yield t/ha DM (%)
CIP 1 95.56 a 3.33 d 1.83 b 11 a 74.65 de 48.13 ab 14.00 CIP 2 98.33 a 3.33 d 1.83 b 9 bcd 87.99 bcd 50.06 a 15.00 CIP 3 96.11 a 2.75 e 1.17 c 9 cd 59.90 f 34.56 d 17.00 CIP 4 96.67 a 3.50 d 1.5 bc 11 a 60.32 f 43. 48 abc 19.00 CIP 5 87.78 b 4.00 c 1.33 bc 7 def 89.63 bc 41.13 bcd 20.00 CIP 6 95.00 a 4.00 c 1.17 bc 6 fg 114.59 a 43.51 abc 18.00 CIP 8 95.56 a 5.00 a 1.00 cd 8 de 99.78 b 49.95 a 15.00 CIP 9 88.89 b 4.58 ab 1.33 bc 5 g 122.14 a 40.43 bcd 18.00 CIP 10 98.33 a 4.58 ab 1.17 bc 10 ab 80.00 cde 49.95 a 19.00 CIP 13 92.22 ab 4.75 a 1.33 bc 9 bcd 72.25 ef 41.12 bcd 18.00 CIP 14 97.79 a 4.17 bc 1.50 bc 10 abc 72.65 ef 47.18 abc 17.00 Diamant 96.11 a 3.75 cd 3.00 a 7 ef 87.46 ef 39.92 cd 20.00 Management Improved Practice
96.67 ab 4.10 bcde
1.33 bc 9 abcdeg 80.14 fghi 46.35 abcdef -
Ware Practice
93.06 abc 3.86 cdef
1.69 abc 7 fghi 90.09 defgh
41.86 defgh -
CV (%) 7.28 13.03 46.45 22.1 18.15 13.09 - LSD (0.05) 5.57 0.42 0.57 1.50 12.46 4.66 -

16
Table 3.2 Interaction effects between clones and managements performance of CIP Potato
germplasm degeneration study of virus resistance at Jamalpur in Bangladesh
during 2009-10
Clones % of plant
Emergence
Plant
Vigor
Senescence Number of
tuber/plant
Average
Tuber
weight (g)
Yield t/ha
CIP 1 x T1 100.00 a 3.33 de 2.00 bc 13 a 58.63 i 49.71 abc
CIP 1 x T2 91.11 abc 3.33 de 1.67 bcd 8 defghij 90.67 defgh 46.54 abcde
CIP 2 x T1 98.89 ab 3.50 de 1.33 cd 10 bcdef 77.87 fghi 50.89 abc
CIP 2 x T2 97.78 ab 3.17 e 2.33 ab 8 fghij 98.09 cdef 49.22 abc
CIP 3 x T1 95.56 ab 3.00 ef 1.00 d 9 bcdefgh 61.01 i 38.38 gfh
CIP 3 x T2 96.67 ab 2.50 f 1.33 cd 7 efghij 58.80 i 30.75 i
CIP 4 x T1 97.78 ab 3.33 df 1.33 cd 12 ab 59.28 i 46.11 abcdef
CIP 4 x T2 95.56 ab 3.67 cde 1.67 bcd 10 bcde 61.36 i 40.86 defgh
CIP 5 x T1 90.00 bcd 4.00 bcd 1.33 cd 8 efghij 84.47 defgh 43.33 cdefg
CIP 5 x T2 85.56 cd 4.00 bcd 1.33 cd 6 jkl 94.78 cdefg 38.94 efgh
CIP 6 x T1 96.67 ab 4.33 abc 1.00 d 7 ijk 103.83 cd 46.04 abcdef
CIP 6 x T2 93.33 abc 3.67 cde 1.33 cd 5 kl 125.34 ab 40.99 defgh
CIP 8 x T1 94.44 abc 5.00 a 1.00 d 8 efghij 96.88 cdef 48.29 abcd
CIP 8 x T2 96.67 ab 5.00 a 1.00 d 8 fghij 102. 69 cde 51.62 ab
CIP 9 x T1 94.44 abc 4.83 a 1.00 d 6 jkl 112.52 bc 43.94 bcdefg
CIP 9 x T2 83.33 d 4.33 abc 1.67 bcd 4 l 131.76 a 36.91 ghi
CIP 10 x T1 98.89 ab 4.50 ab 1.00 d 11 abcd 77.23 fghi 47.93 abcd
CIP 10 x T2 97.78 ab 4.67 ab 1.33 cd 10 bcdefg 82. 79 efgh 51.97 a
CIP 13 x T1 94.44 abc 5.00 a 1.00 d 10 bcde 71.41 hi 48.48 abcd
CIP 13 x T2 90.00 bcd 4.50 ab 1.67 bcd 7 hijk 73.09 hi 33.75 hi
CIP 14 x T1 100.00 a 4.33 abc 1.00 d 11abc 70.48 hi 50.15 abc
CIP 14 x T2 95.56 ab 4.00 bcd 2.00 bc 9 cdefi 74.83 ghi 44.21 abcdefg
Diamant x T1 98.89 ab 4.00 bcd 3-00 a 7 ghij 88.03 defgh 42.98 cdefg
Diamant x T2 93.33 abc 3.50 de 3-00 a 6 jkl 86.89 defgh 36.87 ghi
CV (%) 7.28 13.03 46.45 22.17 18.15 13.03
LSD (0.05) 7.88 0.60 0.80 2.13 17.63 6.59
Value in the column having common letter(s) do not differ significantly at 5% level by DMRT
Plant vigor on 1 to 5 Scale; 1: Very poor vigor and 5: Highly vigorous
T1= Improved Practice, T2= Ware Practice
17
Table 3.3 Tuber characters of CIP virus resistant clones of 80 DAP at RARS, Jamalpur
during 2009-10
CIP Clones Characters
CIP-1 (CIP 390637.1) Oval tuber, yellow skin, white to creamy flesh, fleet eyes, 1% cracking
and overall uniformity 4
CIP-2 (CIP 391846.5) Oval tuber, yellow skin & flesh, fleet eyes and overall uniformity 4.
CIP-3 (CIP 394034.7) Oblong to oval tuber, red skin, yellow flesh, fleet eyes and overall uniformity 4
CIP-4 (CIP 394611.112) Round tuber, pink skin, yellow flesh, deep eyes and overall uniformity
3
CIP-5 (CIP 394613.139) Flat round tuber, red skin, yellow flesh, deep eyes and overall
uniformity 5
CIP-6 (CIP 395192.1) Round tuber, yellow skin & flesh, fleet eyes and overall uniformity 4.
Cracking 3%
CIP-8 (CIP 395195.7) Oval to flat round tuber, white skin & flesh, fleet eyes and overall
uniformity 5
CIP-9 (CIP 397006.18) Round tuber, yellow skin & flesh, fleet eyes and overall uniformity 3.
Cracking 10-15%.
CIP-10 (CIP 397029.21) Round tuber, white skin & flesh, fleet eyes and overall uniformity 3
CIP-13 (CIP 397073.7) Oblong tuber, yellow skin, white flesh, fleet eyes and overall uniformity
5. Cracking 1%.
CIP-14 (CIP 397079.6) Round tuber, white skin & flesh, deep eyes and overall uniformity 4.
Diamant Oblong tuber, yellow skin & flesh, fleet eyes and overall uniformity 5
Table 3.4 Clonals and managements performance of CIP Potato germplasm degeneration
study of virus resistance at Jessore in Bangladesh during 2009-10
Clones % of plant
Emergence
Plant
Vigor*
Senescence Number of
tuber/plant
Average
Tuber
weight
(g)
Yield
t/ha
CIP-1 (CIP 390637.1) 99.44 ab 4.92 a 4.00 ab 10.46 c 48.96 c 33.73 bc
CIP-2 (CIP 391846.5) 98.89 ab 4.92 a 4.08 ab 10.16 c 53.03 c 35.82 bc
CIP-3 (CIP 394034.7) 100.00 a 5.00 a 3.42 b 14.07 b 30.33 e 26.74 d
CIP-4 (CIP 394611.112) 98.33 ab 4.42 c 3.50 b 15.75 a 31.90 e 33.02 d
CIP-5 (CIP 394613.139) 95.00 b 4.75 ab 2.50 d 10.89 c 47.34 c 33.65 bc
CIP-6 (CIP 395192.1) 98.33 ab 4.92 a 3.17 bc 7.04 d 69.96 ab 32.68 c
CIP-8 (CIP 395195.7) 96.67 ab 5.00 a 2.00 e 8.33 d 67.76 b 37.06 b
CIP-9 (CIP 397006.18) 99.44 ab 5.00 a 2.83 cd 8.56 d 74.87 a 42.14 a
CIP-10 (CIP 397029.21) 100.00 a 5.00 a 2.42 de 10.56 c 49.89 c 32.24 c
CIP-13 (CIP 397073.7) 98.33 ab 5.00 a 3.42 b 10.32 c 38.67 d 25.91 d
CIP-14 (CIP 397079.6) 99.44 ab 4.50 bc 3.42 b 14.84 ab 36.73 de 35.58 bc
Diamant 98.33 ab 3.92 d 4.33 a 8.57 d 47.53 c 26.42 d
Management
Improved Practice 99.26 a 4.75 ab 2.90 ef 13.06 bc 47.85 def 38.32 bc
Ware Practice 97.78 ab 4.81 ab 3.61 cd 8.54 efg 51.64 de 27.51 fg
CV (%) 3.48 6.79 16.69 16.66 15.71 13.14
LSD (0.05) 2.76 0.26 0.16 1.45 6.30 1.25
* Plant vigor on 1 to 5 Scale; 1: Very poor vigor and 5: Highly vigorous

18
Table 3.5 Interaction effects between clones and managements performance of CIP Potato
germplasm degeneration study of virus resistance at Jessore in Bangladesh during
2009-10
Clones % of plant
Emergence
Plant
Vigor
Senescence Number of
tuber/plant
Average
Tuber
weight (g)
Yield t/ha
CIP 1 x T1 100.00 a 4.83 a 3.67 cd 12.15 bcd 48.38 fgh 38.92 bc
CIP 1 x T2 98.89 ab 5.00 a 4.33 abc 8.78 fghi 49.54 g 28.53 gh
CIP 2 x T1 100.00 a 4.83 ab 3.67 cd 11.69 cde 54.13 cde 42.08 b
CIP 2 x T2 97.78 ab 5.00 a 4.50 ab 8.63 fghi 51.92 def 29.57 fgh
CIP 3 x T1 100.00 a 5.00 a 3.17 de 18.77 a 26.35 k 32.59 defg
CIP 3 x T2 100.00 a 5.00 a 3.67 cd 9.38 fgh 34.31 ijk 20.89 jk
CIP 4 x T1 98.89 ab 4.17 ab 3.17 de 18.47 a 30.53 jk 37.26 bcd
CIP 4 x T2 97.78 ab 4.67 ab 3.83 bcd 13.03 bc 33.27 ijk 28.78 fgh
CIP 5 x T1 97.78 ab 4.83 ab 2.17 fg 13.53 bc 43.48 fghi 38.87 bc
CIP 5 x T2 92.23 c 4.67 ab 2.83 ef 8.25 fghi 51.20 def 28.42 gh
CIP 6 x T1 97.78 ab 4.83 ab 2.67 ef 8.33 fghi 68.80 ab 38.24 bc
CIP 6 x T2 98.89 ab 5.00 a 3.68 cd 5.74 j 71.12 ab 27.13 ghi
CIP 8 x T1 98.89 ab 5.00 a 1.67 g 9.56 efg 62.77 bc 39.83 bc
CIP 8 x T2 94.45 bc 5.00 a 2.33 fg 7.11 hij 72.76 a 34.29 cdef
CIP 9 x T1 98.89 ab 5.00 a 2.50 ef 10.08 defg 72.87 a 48.40 a
CIP 9 x T2 100.00 a 5.00 a 3.17 de 7.10 hij 76.87 a 35.89 cde
CIP 10 x T1 100.00 a 5.00 a 2.17 fg 14.27 b 43.18 fghi 38.96 bc
CIP 10 x T2 100.00 a 5.00 a 2.67 ef 6.87 ij 56.60 cd 25.52 hij
CIP 13 x T1 100.00 a 5.00 a 2.83 ef 12.91 bc 38.84 hij 32.30 defg
CIP 13 x T2 96.67 ab 5.00 a 4.00 abc 7.73 ghij 38.50 hij 19.53 k
CIP 14 x T1 100.00 a 4.50 bc 3.17 de 16.68 a 39.58 ghij 41.78 b
CIP 14 x T2 98.89 ab 4.50 bc 3.67 cd 13.01 bc 33.89 ijk 29.39 fgh
Diamant x T1 98.89 ab 4.00 d 4.00 abc 10.32 def 45.36 efgh 30.63 efgh
Diamant x T2 97.78 3.83 d 4.67 a 6.81 ij 49.71 defg 38.92 bc
CV (%) 3.48 6.79 16.69 16.66 15.71 13.14
LSD (0.05) 3.91 0.37 0.62 2.06 8.92 4.94
Plant vigor on 1 to 5 Scale; 1: Very poor vigor and 5: Highly vigorous
T1= Improved Practice, T2= Ware Practice

19
Table 3.6 Tuber characters of CIP virus resistant clones 80 DAP at RARS, Jessore during
2009-10
CIP Clones Characters
CIP-1 (CIP 390637.1) Oblong tuber, yellow skin, creamy flesh, fleet eyes and overall
uniformity 4
CIP-2 (CIP 391846.5) Oblong to oval tuber, yellow skin & flesh, fleet eyes and overall
uniformity 3. Rottage 3%
CIP-3 (CIP 394034.7) Oblong tuber, red skin, creamy flesh, fleet eyes and overall
uniformity 4
CIP-4 (CIP 394611.112) Round tuber, pink skin, yellow flesh, medium deep eyes and overall
uniformity 4
CIP-5 (CIP 394613.139) Round tuber, red skin, creamy flesh, deep eyes and overall
uniformity 4
CIP-6 (CIP 395192.1) Oval tuber, yellow skin & flesh, fleet eyes and overall uniformity 5.
Heat necrosis found
CIP-8 (CIP 395195.7) Oblong tuber, yellow skin, white flesh, fleet eyes and overall
uniformity 4
CIP-9 (CIP 397006.18) Round tuber, white skin, yellow flesh, fleet eyes and overall
uniformity 5
CIP-10 (CIP 397029.21) Round tuber, white skin & flesh, fleet eyes and overall uniformity 3
CIP-13 (CIP 397073.7) Oblong tuber, white skin & flesh, fleet eyes and overall uniformity 5
CIP-14 (CIP 397079.6) Round tuber, white skin & flesh, deep eyes and overall uniformity 3,
1% cracking
Diamant Oblong tuber, yellow skin & flesh, fleet eyes and overall uniformity
4
Conclusion
From the above study it was revealed that improved practice yielded higher than the ware practice.
But as it is an experiment of degeneration study of virus, so virus data will be recorded in next
season.

20
Experiment 4: Screening of Potato Varieties and CIP Germplasms Against
Salt Tolerance
M. Dhar, M. Hossain, B.C. Kundu, M.H. Rahman, E.H.M.S. Rahaman, M. M. Hasan and
M.S. Kadian
Abstract
Seven CIP germplasms, one TCRC improved potato variety Diamant and one local variety
Dohazari Sada were evaluated at Ukhia, Cox’s Bazar, during 2009-10 for their suitability against
salt tolerance. Among the improved variety Diamant, local variety Dohazari Sada and all the
CIP germplasms found to be growing well up to 40 DAP at saline areas. But after this period all of
them died due to very high level of salinity in the soil (8.9 ds/m).
Introduction
A comparison of leaf ion contents, osmotic potential and gas exchange rates indicates that the rate
of Na+ accumulation is very low at high air humidity, because the water-use efficiency had
increased more. The effects of NaCl in high air humidity were compared with those of KCl, which
is taken up more rapidly, and of polyethylene glycol which is not taken up. The results indicate
that the rate of ion accumulation and the time-course of osmotic changes within the plant are
decisive for the onset of damages. A high level in salinity leads to damage plants, thus the yield
must be decrease for the region of south part of Bangladesh like Chittagong, Barisal and Khulna
divisions. In many of these areas the climatic conditions for potato growing are improving due to
the rising salinity. So, we have studied to identify the potato varieties/germplasm suitable for
cultivation in saline areas of Bangladesh.
Materials and Methods
One improved (Diamant) and local variety (Dohazari Sada) with seven CIP germplasms such as
LB-3 (391058.175), LB-4 (393077.159), LB-6 (393280.64), LB-7 (393371.58), LB-8(395011.2),
LB- 12 (396031.119) and LB-14 (396244.12) were evaluated against salt tolerance at Ukhia, Cox’s
Bazar during 2009-10. Brief of the experiments are shown in Table 4.1. Fertilizers were applied @
325-220-250-120 kg/ha of Urea, TSP, MP and Gypsum, respectively. Full amount of TSP, MP and
Gypsum and 50% of urea were applied as basal and the remaining amount of urea was side dressed
at 35 DAP. Weeding, irrigation, earthing-up and other intercultural operations were done as per
TCRC recommendation. All the yield and yield contributing characters data were recorded and
were analyzed statistically. Plant vigor was recorded on 1-5 scale, where 1 is very poor vigor and 5
is highly vigorous. Salinity level of experimental plots soil was analyzed (Table 4.2).

21
Table 4.1 Experiments in brief of salt tolerance trial at at Ukhia, Cox’s Bazar in Bangladesh
during 2009-10
Plant spacing : 60 cm X 25 cm
Plot size : 0.60 m X 2.5 m
Design : RCB
Replication : 3.00
Plot to plot : 0.60 m
Rep-rep distance : 1.0 m
No of rows per plot : 3
No of tubers per row : 10
Total no of tubers required for 3 replications : 30
Date of planting : 10.12.2009
Date of harvesting : 20.01.2010
Table 4.2 Soil salinity level of experiment plots of salt tolerance trial at Ukhia, Cox’s Bazar in
Bangladesh during 2009-10
Conditions Date Salinity level
Before planting 9.12.09 0.287 dS/m
Two weeks after planting 24.12.09 7.38 dS/m
Forty days after planting (damage all plants) 19.0110 8.98 dS/m
At harvest Dated on 26.2.10 1.84 dS/m
Water sample at 40 DAP 19.0110 3.54 dS/m
Results and Discussion
All the growth and yield contributing characters of the studied varieties and germplasms varied
significantly (Table 4.3). The percent of emergence LB-7 (86.67) showed the highest and the
lowest LB-14 (3.33) while the check variety Diamant (70). Considering plant vigour LB-3 and
LB-7 show the highest (3.67) and the lowest LB-14 (0.33) while the Diamant and local variety
Dohazari (3.00) and (3.33) respectively at 30 DAP. Plant heights and other growth parameters
were not recorded due to all plants was damaged at 40 DAP. The soil salinity level was (8.98
dS/m) at 40 DAP that causes the plants were not survived.

22
Table 4.3 Performance of CIP Salt tolerance resistant clones at Ukhia, Cox’s Bazar in
Bangladesh during 2009-10
* Plant vigor on 1 to 5 Scale; 1: Very poor vigor and 5: Highly vigorous
All damaged plants tuber were harvest at 40 DAP, Number and weight of marketable and non-
marketable tubers per plot showed significant effect among the studied varieties/germplasm (Table
4.4). The highest number of tubers/plot was recorded in local variety Dohazari (105) as the tubers
were very small in size. The lowest total number of tuber was obtained from LB-4 (3.67). The total
tuber weight (g) per plot was found from LB-7 (410 g) and the lowest LB-4 (30 g) while Diamant
and Dohazari were (325 g) and (383.33 g) respectively. (Table 4.4).
Table 4.4 Yield attributes of salt tolerance trial at Ukhia, Cox’s Bazar
Clones
Tuber number per plot Tuber weight per plot
Marketable Non
Marketable
Total Marketable Non
Marketable
Total
LB-3 5.67 a 36.67 bc 42.33 bc 143.33 a 236.67 abc 380.00ab
LB-4 0.00 3.67 e 3.67 e 0.00 c 30.00 d 30.00 d
LB-6 3.67 a 31.00 cd 34.67 c 73.33 b 176.67 bcd 250.00 abc
LB-7 3.00 ab 56.67 b 59.67 b 93.33 ab 316.67 ab 410.00 a
LB-8 0.00 b 27.33 cde 27.33 cd 0.00 c 190.00 bcd 190.00 bcd
LB-12 4.00 a 27.33 cde 31.33 cd 126.67 ab 163.33 bcd 290.00 abc
LB-14 0.00 8.33 de 8.33 de 0.00 c 100.00 cd 100.00 cd
Diamant 5.67 a 26.00 cde 31.67 cd 160.00 a 165.00 bcd 325.00 ab
Dohazari 0.00 b 105.00 a 105.00 a 0.00 c 383.33 a 383.33 ab
CV (%) 66.10 35.71 34.87 56.79 49.55 41.88
LSD (0.05) 2.71 22.37 22.37 63.19 162.8 184.2
Clones Emergence (%) % Foliage
Coverage at 30 DAP
* Vigor at 30 DAP
LB-3 (391058.175) 66.67 a 50.00 abc 3.67 a
LB-4 (393077.159) 10.00 c 10.00 d 1.33 bc
LB-6 (393280.64) 76.67 a 36.67 bc 3.00 ab
LB-7 (393371.58) 86.67 a 60.00 a 3.67 a
LB-8 (395011.2) 40.00 a 31.67 c 2.33 ab
LB- 12 (396031.119) 70.00 a 43.33 abc 3.00 ab
LB-14 (396244.12) 3.33 c 0.00 d 0.33 c
Diamant 70.00 a 36.67 bc 3.00 ab
Dohazari 80.00 a 53.33 ab 3.33 a
CV (%) 26.46 31.83 36.04
LSD (0.05) 24.78 19.09 1.59

23
The number of tubers per plant had a significant effect among the CIP germplasms/varieties. The
highest tuber number per plant (13.35) was obtained from the local variety Dohazari followed by
LB-14 and the lowest (1.22) was recorded from LB-4. Tuber weight per plant the highest value
(10.59 g) showed from Daimant followed by LB-12 and the lowest (2.73 g) was recorded from
LB-4. Considering average tuber weight the highest (2.47 g) was recorded from LB-12 followed
by Diamant and the lowest average weight of tuber (0.16 g) from LB-14. Tuber yield were very
negligible which were not countable but LB-14 gave the highest yielded (6.67 t/ha) followed by
LB-3 (3.96 t/ha), LB-8 (3.41 t/ha) which was significantly similar while LB-7 gave the lowest
yield (0.67 t/ha). (Table 4.5).
Table 4.5 Yield attributes of salt tolerance trial at Ukhia, Cox’s Bazar
Clones
Tubers
no./Plant
Tuber wt
(g)/Plant
Avg. Tuber
wt. (g)
Yield (t/ha) at 40 DAP
Marketable Non
Marketable
Total
LB-3 6.65 ab 8.99 ab 1.46 abc 1.51 a 2.45 a 3.96 a
LB-4 1.22 b 2.73 c 0.74 bc 0.00 d 0.67 a 0.67 a
LB-6 4.35 ab 7.37 abc 1.82 ab 0.58 cd 1.53 a 2.11 a
LB-7 6.92 ab 6.65 abc 1.04 bc 0.69 bc 2.44 a 3.14 a
LB-8 7.25 ab 6.91 abc 1.01 bc 0.00 d 3.41 a 3.41 a
LB-12 4.67 ab 9.64 a 2.47 a 1.23 ab 1.60 a 2.84 a
LB-14 8.33 ab 4.00 bc 0.16 c 0.00 d 6.67 a 6.67 a
Diamant 4.47 ab 10.59 a 2.38 a 1.59 a 1.56 a 3.15 a
Dohazari 13.35 a 3.40 c 0.25 c 0.00 d 3.29 a 3.29 a
CV (%) 74.06 40.54 54.81 56.75 141.17 114.00
LSD (0.05) 7.90 4.56 1.16 0.59 6.21 6.21
Conclusion:
In summary, plant growth at 30 DAP very well but at 40 DAP when soil salinity became 8.98
dS/m than plants were not survived so, it will be repeated in next year at low level salinity area of
Bangladesh.

24
Experiment 5: Screening of CIP Clones against Drought Tolerance
M. Hossain, A.A. Mahmud, S. Akhter, B.C. Kundu, M.M. Miah, E.H.M.S. Rahaman, A.T.M.T. Islam,
S. Abdullah, M.M. Hasan and M.S. Kadian
Abstract
Seven and eleven CIP clones with as checked variety Lalpakri, Lalashil and Diamant were
evaluated at Bogra and Dinajpur respectively during 2009-10 for their suitability against drought
tolerance. Most of the CIP clones performed better against drought tolerance than the checks
variety. Significant differences have been reported among the clones/variety and between
irrigation treatments in most traits. In general, as water stress increased, vegetative growth and
tuber yield decreased. Considering yield and yield attributes, the CIP clones LB-7 (34.3 t/ha) with
normal irrigation on the other hand (33.8 t/ha) produced under one irrigation practiced at Bogra
and CIP-101 (47.62 t/ha) and (42.00 t/ha) was higher produced with normal irrigation and one
irrigation which are found promising against drought tolerance.
Introduction
Climate change is expected to intensify the drought events throughout the world, resulting in large-
scale ecosystem alteration and failure of drought-sensitive crops. In addition, periods of drought
vary from year to year in severity and length, making it difficult for plants to adapt to more severe
conditions. Many modern varieties of potatoes are considered to be drought-sensitive. Many of the
ancient potato landraces were adaptations to different environmental conditions such as different
soils, temperature, altitude, and drought (R. Schlafleitner, 2008). The scientists of CIP have been
continuing their efforts to these cultivars to identify the genes and molecular mechanisms of
drought tolerance in order to develop drought-resistant crops of potato. The International potato
Center in Lima, Peru maintains the world's largest collection of tubers in the interest of conserving
the genetic diversity of potato as well as investigating traits such as resistance to various insects
and diseases, as well as to cold, heat and drought. The present experiment was undertaken with
CIP clones, two local cultivars and variety Diamant to evaluate the lines/variety to cope with the
climatic changes in temperature and water availability and struggle to maintain a food supply for
growing populations.

25
Materials and Methods
The experiments were conducted at two locations viz. Bogra and Dinajpur. At Bogra, the trial was
conducted at Tuber Crops Research Sub-Center. At Dinajpur, the same trial was conducted BARC
experimental field under supervision of BARC and the scientists of TCRC and CIP provided the
technical support for conducting these experiments. The protocol of drought tolerance trial has
already been established at CPRI, India and the same protocol was followed in Bangladesh trials.
At Bogra, 7 CIP clones (LB-1, LB-2, LB-3, LB-7, LB-9, LB-12, and LB-14) and at Dinajpur, 11
CIP clones (CIP-101, CIP-102, CIP-111, CIP-117, CIP-124, CIP-126, CIP-129, CIP-130, CIP-134,
CIP-137 and CIP-139) with three checks (Diamant, Lalshil & Lalpakri) were included for drought
tolerance trial. Brief of the experiments are shown in Table 5.1. There were three treatments; T1:
Normal Irrigation (3) as practiced by farmer, T2: One irrigation after 1st earthing up at 30 DAP and
T3: Two irrigations after earthing up at 30 & 60 DAP. Fertilizers were applied @ 325-220-250-120
kg/ha of Urea, TSP, MP and Gypsum, respectively. Full amount of TSP, MP and Gypsum and
50% of urea were applied as basal and the remaining amount of urea was side dressed at 35 DAP.
Weeding, spraying and other intercultural operations were done as and when necessary. The crop
was harvested at 90 DAP. All the yield and yield contributing characters data were recorded and
were statistically analyzed. Plant vigor was recorded on 1-5 scale, where 1 is very poor vigor and 5
is highly vigorous. Senescence of the crop was recorded on 1 to 5 scale where, 5=0-20%; 4=21-
40%; 3= 41-60%; 2= 61-80% and 1= 81-100%). Wilting of plants was also recorded on 1 to 5
scales where, 5 is fully expanded/no wilting and 1 is fully wilted.
Table 5.1 Experiments in brief of drought tolerant trials of CIP clones at two
locations in Bangladesh during 2009-10
Experiment Details Locations
Bogra Dinajpur
Plant spacing 60 cm X 20 cm 60 cm X 20 cm
Plot size 1.8 m X 2.0 m 0.60 m X 2.0 m
Design STRIP PLOT STRIP PLOT
Replication 3 3
Distance between replication 1 m 1 m
Distance between plot 0.60 m 0.60 m
Distance between treatments 3 m 3 m
Date of planting 25.11.09 20.11.09
Date of haulm pulling 16.02.10 20.02.10
Date of harvesting 26.02.10 27.02.10

26
Results and Discussion
Vegetative Parameters: The growth and vegetative characters of the studied CIP clones and
varieties were analyzed and presented in the Table (5.2 to 5.5). Both Bogra and Dinajpur, there
were varied significant effect of irrigation on plant emergence percent, number of stems/plant. At
Bogra the highest emergence percent (100) were showed in LB-7 and Diamant. At Dinajpur plant
emergence percent were maximum clones showed in all treatments. At Dinajpur the percent ground
covers at 60 DAP the highest value (94.7) was recorded from CIP-134 with normal irrigation and
lowest (67.7) was found in Lalshil with two irrigations treatment. (Table 5.3). There was varied
significant effect of irrigation and clones/variety towards plant vigor and plant height at 45, 60 and
75 DAP (Table 5.4 & 5.5). At Bogra LB-2, LB-3 and LB-14 were showed the highest value (5.00)
in all treatments. On the other hand Lalshil was the very poor vigor in all treatments. At Dinajpur,
interaction between irrigation and clones/variety on plant vigor the highest value (5.00) was
observed from CIP-102, CIP-111, CIP-117 and CIP-129 with all treatments. Whereas check variety
Diamant, Lalshil and Lalpakri were the lowest average value 2.87, 2.70 and 3.30 respectively.
Yield parameters: The yield and yield contributing characters of the studied CIP clones and
varieties were analyzed and presented in the Table (5.6 to 5.13). At Bogra and Dinajpur number of
marketable, non-marketable and total tubers per plot varied significantly when different irrigation
schedule and clones/variety were used (Table 5.6 & 5.7). Irrigation, variety and their interaction
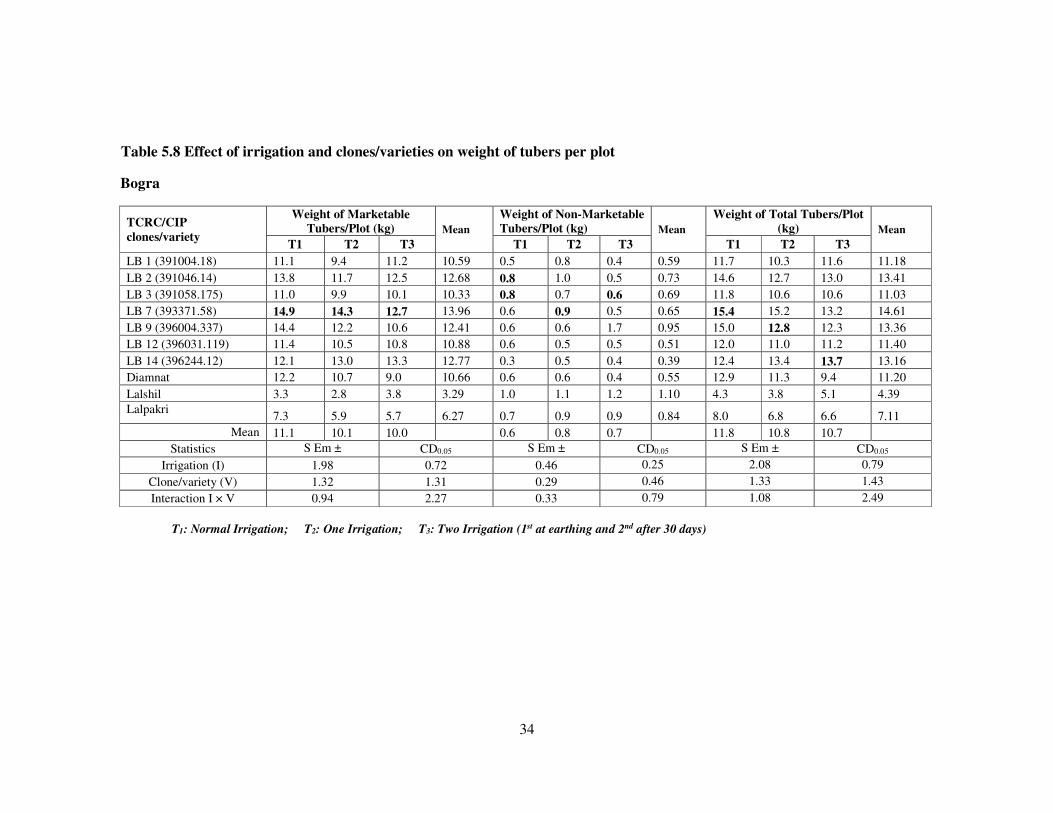
had a significant effect towards weight of marketable, non-marketable and total tubers per plot
both at Bogra and Dinajpur (Table 5.8 & 5.9). In case of tubers number per plant at Bogra, number
of tuber per plant Lalshil was the highest 23.9, 23.7 and 25.0 with all treatments respectively and
the lowest average 6.28 with all treatments found in Diamant (Table 5.10). At Dinajpur, higher
number of tubers per plant was obtained from Lalpakri in normal irrigation 32.8 tubers/plant
followed by two irrigation (20.2 tubers/plant) while one irrigation gave 26.7 tubers/plant (Table
5.11). Irrigation, clones/variety and their interaction showed significant effect on average tuber
weight both at Bogra and Dinajpur. At Bogra, normal irrigation gave highest average tuber weight
LB-14 (77.5g) followed by single irrigation (80.6g) while two irrigations gave (109.2g) where the
lowest was recorded in two irrigation (Table 5.10). At Dinajpur there were significant difference
observed (Table 5.11). At Bogra LB-14 gave the highest average tuber weight (109.2g) with two
irrigations treatment followed by LB-9 (56.5g) in one irrigation LB-14 gave average tuber weight
(80.6 g) followed by LB-9 (42.4g) and in normal irrigation treatment the LB-14 (77.5 g) but
Lalpakri and Lalshil produced very smaller tubers (Table 5.10) then the other clones. There were
significant effect in average tuber weight, tubers weight per plant both at Bogra and Dinajpur
(Table 10 & 11). At Bogra, the highest tuber weight per plant LB-7 (520.2g) was recorded when
normal irrigation practices were followed which was significantly different from two irrigations

27
(439.8g) while, one irrigation it was gave (507.0g). At Dinajpur in normal irrigation CIP-101 &
CIP-134 were gave the highest (710.0g) tubers per plant where they produced in one irrigation
(630.0g & 480.0 g) tubers/plant respectively. Form two irrigation they produced 660.0g & 670g
(Table 5.11). At Bogra among the clones, LB-7 yielded the highest (34.3 t/ha) in normal irrigation
and in two irrigations (29.3 t/ha) where single irrigation (33.8 t/ha) followed by LB-9 (33.3 t/ha)
and LB-2 (32.3 t/ha) (Table 5.12). At Dinajpur CIP-101 was produced higher yield (47.62 t/ha) in
normal irrigation, in two irrigation (43.73 t/ha) while single irrigation (42.0 t/ha) whereas check
variety Diamant was recoded in single irrigation treatment was produced (23.67 t/ha) similarly
Lalshil and Lalpakri produced very little yield (8.78 t/ha) & (16.80 t/ha) respectively (Table 5.13).
Regarding all growth and yield measurements of the two locations, the CIP clones LB-7
(393371.58) at Bogra and at Dinajpur CIP-101, CIP-117 and CIP-126 found potential against
drought tolerance. Environmental data were presented at annexure –A.
Reference
R. Schlafleitner. 2008. Drought tolerance in potatoes. Published: Saturday, June 28, 2008 -11:21 in
Biology & Nature.
Source: American Society of Plant Biologists.
Contact: Roland Schlafleitner; [email protected]; 511-349-6017

28
Table 5.2 Effect of irrigation and clones/varieties on growth characters of potato
Bogra
TCRC/CIP
clones/variety
Emergence (%) Mean
Stem Number/Plant
at 45 DAP Mean
Percent Ground
Cover (PGC) at
60 DAP Mean
T1 T2 T3 T1 T2 T3 T1 T2 T3
LB 1 (391004.18) 97.8 96.7 98.9 97.78 4.4 3.7 3.4 3.83 97.3 93.4 98.4 96.40
LB 2 (391046.14) 100.0 91.1 96.7 95.93 5.3 4.5 3.1 4.32 100.0 99.3 99.9 99.74
LB 3 (391058.175) 98.9 98.9 100.0 99.26 4.3 4.1 3.3 3.91 97.6 99.0 98.3 98.30
LB 7 (393371.58) 98.9 100.0 100.0 99.63 3.7 3.8 3.1 3.53 99.0 99.1 99.2 99.11
LB 9 (396004.337) 100.0 98.9 98.9 99.26 4.8 4.2 3.6 4.18 95.0 97.5 97.1 96.52
LB 12 (396031.119) 98.9 93.3 98.9 97.04 3.9 3.6 3.7 3.76 98.7 95.3 96.8 96.93
LB 14 (396244.12) 67.8 88.9 92.2 82.96 4.2 3.9 3.3 3.78 97.0 98.4 99.2 98.22
Diamnat 100.0 100.0 97.8 99.26 4.8 3.9 3.2 4.00 98.9 97.2 98.3 98.15
Lalshil 97.8 97.8 100.0 98.52 5.0 4.1 3.7 4.28 90.1 89.0 93.6 90.89
Lalpakri 100.0 98.9 100.0 99.63 4.9 3.8 3.6 4.08 97.9 95.8 99.0 97.56
Mean 96.0 96.4 98.3 4.5 4.0 3.4 97.1 96.4 98.0
Statistics SEm ± CD0.05 SEm ± CD0.05 SEm ± CD0.05
Irrigation (I) 1.59 2.36 0.51 0.29 1.49 0.44
Clone/variety(V) 5.86 4.31 0.37 0.52 2.05 2.27
Interaction I×V 3.07 7.47 0.23 0.27 1.62 1.27
T1: Normal Irrigation; T2: One Irrigation; T3: Two Irrigation (1st at earthing and 2nd after 30 days)

29
Table 5.3 Effect of irrigation and clones/varieties on growth characters of potato
Dinajpur
TCRC/CIP
clones/variety
Emergence (%) Mean
Stem
Number/Plant at
45 DAP Mean
Percent Ground
Cover
(PGC) at 60 DAP Mean
T1 T2 T3 T1 T2 T3 T1 T2 T3
CIP-101(301024.14) 100.0 96.7 100.0 98.9 2.3 2.3 2.3 2.29 87.3 82.3 68.7 79.44
CIP-102 (301029.18) 96.7 100.0 100.0 98.9 1.5 1.9 1.9 1.76 86.0 83.3 70.7 80.00
CIP-111 (380583.8) 100.0 96.7 100.0 98.9 2.1 1.7 1.7 1.82 84.0 79.3 70.7 78.00
CIP-117 (386292.3) 100.0 96.7 100.0 98.9 2.9 2.3 2.7 2.64 86.7 87.7 71.3 81.89
CIP-124 (392781.1) 100.0 100.0 100.0 100.0 3.9 3.3 3.3 3.51 83.0 83.3 71.3 79.22
CIP-126 (392797.22) 100.0 100.0 100.0 100.0 4.0 3.6 4.1 3.91 87.7 81.3 75.0 81.33
CIP-129 (393536.13) 100.0 100.0 100.0 100.0 3.2 3.7 4.1 3.67 89.0 82.7 70.7 80.78
CIP-130 (393617.1) 93.3 96.7 96.7 95.6 2.7 3.9 3.6 3.40 90.7 87.0 76.7 84.78
CIP-134 (395183.7) 100.0 100.0 100.0 100.0 3.6 4.1 4.1 3.93 94.7 88.7 77.3 86.89
CIP-137 (395193.6) 96.7 96.7 96.7 96.7 3.1 3.8 5.4 4.09 92.3 87.3 81.3 87.00
CIP-139 (396311.1) 100.0 100.0 100.0 100.0 2.5 2.3 2.7 2.49 83.0 75.7 78.3 79.00
Diamant 96.7 100.0 100.0 98.9 5.8 3.2 2.9 3.98 81.3 84.0 78.0 81.11
Lalshil 100.0 100.0 90.0 96.7 4.6 5.3 4.1 4.67 83.7 82.7 67.7 78.00
Lalpakri 100.0 100.0 100.0 100.0 4.7 3.7 3.1 3.80 77.0 75.7 69.7 74.11
Mean 98.8 98.8 98.8 3.3 3.2 3.3 86.2 82.9 73.4
Statistics SEm ± CD0.05 SEm ± CD0.05 SEm ± CD0.05
Irrigation (I) 1.41 2.01 0.55 0.53 3.38 1.02
Clone/variety (V) 5.73 3.93 2.08 1.14 1.95 2.21
Interaction I × V 3.37 8.34 0.81 1.97 1.58 3.83
T1: Normal Irrigation; T2: One Irrigation; T3: Two Irrigation (1st at earthing and 2nd after 30 days)

30
Table 5.4 Effect of irrigation and clones/varieties on plant vigor and plant height of potato
Bogra
TCRC/CIP
clones/variety
Plant Vigor *
(50 DAP) Mean
Plant height (cm)
45 DAP Mean
60 DAP Mean
75 DAP Mean
T1 T2 T3 T1 T2 T3 T1 T2 T3 T1 T2 T3
LB 1 (391004.18) 4.0 4.7 4.3 4.33 45.5 39.0 50.3 44.91 50.2 61.9 49.9 53.98 51.3 52.5 52.7 52.20
LB 2 (391046.14) 5.0 5.0 5.0 5.00 52.2 44.5 53.5 50.09 62.3 59.3 64.7 62.09 59.5 64.1 59.7 61.11
LB 3 (391058.175) 5.0 5.0 5.0 5.00 53.3 44.2 52.0 49.82 57.4 64.2 54.5 58.69 57.7 61.7 60.6 60.00
LB 7 (393371.58) 5.0 5.0 5.0 5.00 53.5 47.9 51.9 51.09 56.0 67.5 57.5 60.31 58.1 62.0 55.9 58.67
LB 9 (396004.337) 5.0 4.7 4.3 4.67 49.8 42.9 49.5 47.40 44.9 52.4 50.9 49.40 53.1 54.1 53.9 53.71
LB 12 (396031.119) 5.0 4.7 4.7 4.78 50.6 40.3 52.2 47.70 55.4 69.1 63.0 62.51 57.9 61.6 59.1 59.53
LB 14 (396244.12) 5.0 5.0 5.0 5.00 55.2 46.9 54.8 52.29 62.8 70.8 67.5 67.02 57.7 67.5 64.0 63.05
Diamnat 5.0 5.0 4.0 4.67 48.3 43.1 46.7 46.04 49.4 53.2 50.9 51.18 51.0 54.1 52.8 52.62
Lalshil 2.7 3.0 2.3 2.67 37.3 33.5 36.9 35.89 60.0 68.8 61.7 63.49 56.9 65.5 65.4 62.60
Lalpakri 4.3 4.3 3.0 3.89 40.3 36.2 34.6 37.02 47.0 48.7 48.6 48.12 54.0 54.7 51.8 53.49
Mean 4.6 4.6 4.3 48.6 41.9 48.2 54.5 61.6 56.9 55.7 59.8 57.6
Statistics S Em ± CD0.05 SEm ± CD0.05 SEm ± CD0.05 S Em ± CD0.05
Irrigation (I) 0.27 0.18 13.12 1.89 4.39 3.13 1.63 1.84
Clone/variety (V) 0.19 0.32 2.91 3.45 5.96 5.73 2.37 3.35
Interaction I × V 0.23 0.18 2.46 1.89 4.08 9.93 2.38 5.80
T1: Normal Irrigation; T2: One Irrigation; T3: Two Irrigation (1st at earthing and 2nd after 30 days)
*Plant vigour (1-5 scale), where 1 is weakest and 5 is robust

31
Table 5.5 Effect of irrigation and clones/varieties on plant vigor and plant height of potato
Dinajpur
TCRC/CIP
clones/variety
Plant vigour *
(45 DAP) Mean
Plant height (cm) at
45 DAP Mean
60 DAP Mean
75 DAP Mean
T1 T2 T3 T1 T2 T3 T1 T2 T3 T1 T2 T3
CIP-101(301024.14) 4.0 4.7 4.3 4.33 56.6 43.9 38.6 46.38 77.4 62.7 51.1 63.73 85.0 70.3 70.3 75.18
CIP-102 (301029.18) 5.0 5.0 5.0 5.00 25.8 31.7 26.3 27.93 55.1 61.9 45.5 54.18 62.7 69.5 69.5 67.22
CIP-111 (380583.8) 5.0 5.0 5.0 5.00 38.9 41.3 36.2 38.78 75.2 71.4 59.7 68.76 82.8 79.0 79.0 80.27
CIP-117 (386292.3) 5.0 5.0 5.0 5.00 42.6 39.7 29.4 37.22 64.2 61.6 43.1 56.29 71.8 69.2 69.2 70.07
CIP-124 (392781.1) 5.0 4.7 4.3 4.67 41.1 44.9 34.4 40.15 61.5 64.5 47.4 57.80 69.1 72.1 72.1 71.11
CIP-126 (392797.22) 5.0 4.7 4.7 4.80 45.5 47.0 34.3 42.25 75.6 68.7 60.8 68.38 83.2 76.3 76.3 78.62
CIP-129 (393536.13) 5.0 5.0 5.0 5.00 43.1 39.3 32.5 38.29 71.4 64.0 55.1 63.51 79.0 71.6 71.6 74.07
CIP-130 (393617.1) 5.0 5.0 4.0 4.67 48.0 43.9 34.2 42.04 75.5 67.3 49.4 64.07 83.1 74.9 74.9 77.64
CIP-134 (395183.7) 3.7 3.0 4.3 3.67 54.7 44.9 41.7 47.11 72.7 70.7 60.3 67.93 80.3 78.3 78.3 79.00
CIP-137 (395193.6) 4.3 4.3 3.6 4.07 51.0 42.9 60.9 51.58 72.4 66.5 56.7 65.20 80.0 74.1 74.1 76.09
CIP-139 (396311.1) 4.3 4.1 3.9 4.10 36.0 43.9 36.9 38.91 59.9 71.3 62.3 64.49 67.5 78.9 78.9 75.11
Diamant 3.1 2.6 2.9 2.87 49.1 42.4 33.4 41.62 65.7 64.7 50.1 60.16 73.3 72.3 72.3 72.62
Lalshil 2.7 2.3 3.1 2.70 42.7 40.3 36.7 39.93 75.4 69.8 61.6 68.93 83.0 77.4 77.4 79.27
Lalpakri 3.1 3.5 3.3 3.30 40.3 37.0 31.5 36.27 67.5 59.7 47.9 58.36 75.1 67.3 67.3 69.89
Mean 4.3 4.2 4.2 44.0 41.6 36.2 69.3 66.1 53.6 76.9 73.7 73.7
Statistics SEm ± CD0.05 SEm ± CD0.05 SEm ± CD0.05 SEm ± CD0.05
Irrigation (I) 0.23 0.33 6.47 4.00 2.23 3.30 5.29 0.32
Clone/variety (V) 0.17 0.47 8.28 8.66 6.19 7.19 40.66 0.69
Interaction I × V 0.21 0.27 6.19 14.99 5.14 12.46 28.03 0.97
T1: Normal Irrigation; T2: One Irrigation; T3: Two Irrigation (1st at earthing and 2nd after 30 days)
*Plant vigour (1-5 scale), where 1 is weakest and 5 is robust

32
Table 5.6 Effect of irrigation and clones/varieties on tubers number per plot
Bogra
TCRC/CIP
clones/variety
No. of Marketable
Tubers/Plot Mean
No. of Non-Marketable
Tubers/Plot Mean No. of Total Tubers/Plot
Mean
T1 T2 T3 T1 T2 T3 T1 T2 T3
LB 1 (391004.18) 180.3 200.0 219.0 199.77 48.7 65.7 43.7 52.67 229.0 265.7 262.7 252.47
LB 2 (391046.14) 220.3 179.3 199.0 199.53 72.0 73.7 57.3 67.67 292.3 253.0 256.3 267.20
LB 3 (391058.175) 160.0 137.0 144.0 147.00 63.3 66.3 54.7 61.44 223.3 203.3 198.7 208.43
LB 7 (393371.58) 206.0 207.3 198.3 203.87 50.7 75.7 51.7 59.34 256.7 283.0 250.0 263.23
LB 9 (396004.337) 196.0 160.0 173.3 176.43 53.0 45.0 43.0 47.00 249.0 205.0 216.3 223.43
LB 12 (396031.119) 198.0 194.3 211.7 201.33 64.3 74.7 73.0 70.67 262.3 269.0 284.7 272.00
LB 14 (396244.12) 138.7 138.0 104.7 127.13 23.7 37.3 36.0 32.33 162.3 175.3 140.7 159.43
Diamnat 150.3 144.7 137.7 144.23 45.7 49.7 33.0 42.78 196.0 194.3 170.7 187.00
Lalshil 306.0 258.3 329.7 298.00 393.3 435.7 420.7 416.57 699.3 694.0 750.3 714.53
Lalpakri 405.3 346.7 308.0 353.33 224.7 200.7 236.3 220.57 630.0 547.3 544.3 573.87
Mean 216.1 196.6 202.5 103.9 112.4 104.9 320.0 309.0 307.5
Statistics S Em ± CD0.05 S Em ± CD0.05 S Em ± CD0.05
Irrigation (I) 47.07 25.37 58.56 24.15 42.00 29.20
Clone/variety (V) 29.73 46.31 32.66 44.09 50.22 53.31
Interaction I × V 32.96 80.21 31.38 76.37 37.94 92.33
T1: Normal Irrigation; T2: One Irrigation; T3: Two Irrigation (1st at earthing and 2nd after 30 days)

33
Table 5.7 Effect of irrigation and clones/varieties on tubers number per plot
Dinajpur
TCRC/CIP
clones/variety
No. of Marketable Tubers/Plot Mean
No. of Non-Marketable
Tubers/Plot Mean No. of Total Tubers/Plot
Mean
T1 T2 T3 T1 T2 T3 T1 T2 T3
CIP-101(301024.14) 83.7 82.0 92.7 86.11 16.7 11.0 25.7 17.78 100.3 93 118.3 103.87
CIP-102 (301029.18) 49.7 47.7 39.3 45.56 15.7 10.7 21.0 15.78 65.33 58.33 60.33 61.33
CIP-111 (380583.8) 57.0 59.7 62.0 59.56 21.7 23.7 35.7 27.00 78.67 83.33 97.67 86.56
CIP-117 (386292.3) 79.0 63.7 66.3 69.67 17.0 18.0 28.7 21.22 96 81.67 95 90.89
CIP-124 (392781.1) 57.0 51.0 65.0 57.67 11.0 9.7 18.7 13.11 68 60.67 83.67 70.78
CIP-126 (392797.22) 56.0 49.7 49.3 51.67 10.7 4.3 10.3 8.44 66.67 54 59.67 60.11
CIP-129 (393536.13) 43.0 38.7 52.7 44.78 5.7 8.3 16.7 10.22 48.67 47 69.33 55.00
CIP-130 (393617.1) 66.0 63.3 92.7 74.00 21.7 22.7 36.0 26.78 87.67 86 128.7 100.79
CIP-134 (395183.7) 89.3 63.0 76.0 76.11 17.0 18.0 14.3 16.44 106.3 81 90.33 92.54
CIP-137 (395193.6) 73.3 36.7 59.0 56.33 11.7 15.3 28.0 18.33 85 52 87 74.67
CIP-139 (396311.1) 58.0 45.0 53.3 52.11 18.0 22.0 19.0 19.67 76 67 72.33 71.78
Diamant 95.3 49.7 70.3 71.78 20.0 23.0 26.0 23.00 115.3 72.67 96.33 94.77
Lalshil 159.7 148.3 118.3 142.10 95.0 95.3 69.0 86.44 254.7 243.7 187.3 228.57
Lalpakri 240.0 119.3 198.0 185.77 87.7 83.0 69.3 80.00 327.7 202.3 267.3 265.77
Mean 86.2 65.5 78.2 26.4 26.1 29.9 112.594 91.6193 108.09
Statistics SEm ± CD0.05 SEm ± CD0.05 SEm ± CD0.05
Irrigation (I) 10.81 7.70 9.46 4.93 13.29 8.95
Clone/variety (V) 21.25 16.64 5.37 3.81 22.98 19.33
Interaction I × V 11.89 28.82 7.61 18.45 13.81 33.47
T1: Normal Irrigation; T2: One Irrigation; T3: Two Irrigation (1st at earthing and 2nd after 30 days)
34
Table 5.8 Effect of irrigation and clones/varieties on weight of tubers per plot
Bogra
TCRC/CIP
clones/variety
Weight of Marketable
Tubers/Plot (kg) Mean
Weight of Non-Marketable
Tubers/Plot (kg) Mean
Weight of Total Tubers/Plot
(kg) Mean
T1 T2 T3 T1 T2 T3 T1 T2 T3
LB 1 (391004.18) 11.1 9.4 11.2 10.59 0.5 0.8 0.4 0.59 11.7 10.3 11.6 11.18
LB 2 (391046.14) 13.8 11.7 12.5 12.68 0.8 1.0 0.5 0.73 14.6 12.7 13.0 13.41
LB 3 (391058.175) 11.0 9.9 10.1 10.33 0.8 0.7 0.6 0.69 11.8 10.6 10.6 11.03
LB 7 (393371.58) 14.9 14.3 12.7 13.96 0.6 0.9 0.5 0.65 15.4 15.2 13.2 14.61
LB 9 (396004.337) 14.4 12.2 10.6 12.41 0.6 0.6 1.7 0.95 15.0 12.8 12.3 13.36
LB 12 (396031.119) 11.4 10.5 10.8 10.88 0.6 0.5 0.5 0.51 12.0 11.0 11.2 11.40
LB 14 (396244.12) 12.1 13.0 13.3 12.77 0.3 0.5 0.4 0.39 12.4 13.4 13.7 13.16
Diamnat 12.2 10.7 9.0 10.66 0.6 0.6 0.4 0.55 12.9 11.3 9.4 11.20
Lalshil 3.3 2.8 3.8 3.29 1.0 1.1 1.2 1.10 4.3 3.8 5.1 4.39
Lalpakri 7.3 5.9 5.7 6.27 0.7 0.9 0.9 0.84 8.0 6.8 6.6 7.11
Mean 11.1 10.1 10.0 0.6 0.8 0.7 11.8 10.8 10.7
Statistics S Em ± CD0.05 S Em ± CD0.05 S Em ± CD0.05
Irrigation (I) 1.98 0.72 0.46 0.25 2.08 0.79
Clone/variety (V) 1.32 1.31 0.29 0.46 1.33 1.43
Interaction I × V 0.94 2.27 0.33 0.79 1.08 2.49
T1: Normal Irrigation; T2: One Irrigation; T3: Two Irrigation (1st at earthing and 2nd after 30 days)

35
Table 5.9 Effect of irrigation and clones/varieties on weight of tubers per plot
Dinajpur
TCRC/CIP
clones/variety
Weight of Marketable Tubers/
Plot (kg) Mean
Weight of Non-Marketable
Tubers/Plot (kg) Mean
Weight of Total Tubers/Plot
(kg) Mean
T1 T2 T3 T1 T2 T3 T1 T2 T3
CIP-101(301024.14) 7.0 5.9 6.4 6.43 0.2 0.2 0.1 0.16 7.1 6.1 6.6 6.59
CIP-102 (301029.18) 4.3 4.6 3.2 4.03 0.1 0.2 0.5 0.26 4.4 4.7 3.7 4.30
CIP-111 (380583.8) 5.3 4.0 4.0 4.44 0.3 0.5 1.1 0.65 5.6 4.5 5.1 5.08
CIP-117 (386292.3) 5.9 5.5 4.9 5.41 0.2 0.3 0.5 0.32 6.1 5.8 5.4 5.74
CIP-124 (392781.1) 5.7 4.8 5.0 5.16 0.1 0.1 0.3 0.20 5.8 5.0 5.3 5.36
CIP-126 (392797.22) 6.5 6.3 6.5 6.44 0.1 0.1 0.3 0.17 6.6 6.4 6.9 6.60
CIP-129 (393536.13) 3.9 3.3 3.8 3.67 0.1 0.3 0.6 0.30 4.0 3.6 4.3 3.98
CIP-130 (393617.1) 5.1 4.5 4.6 4.74 0.1 0.2 0.7 0.33 5.2 4.7 5.3 5.07
CIP-134 (395183.7) 6.9 4.7 6.0 5.83 0.2 0.1 0.7 0.33 7.0 4.8 6.7 6.16
CIP-137 (395193.6) 4.7 2.6 3.5 3.59 0.2 0.1 1.0 0.46 4.9 2.7 4.5 4.05
CIP-139 (396311.1) 4.8 4.0 4.2 4.34 0.2 0.2 0.5 0.29 5.1 4.2 4.6 4.62
Diamant 5.4 2.8 3.9 4.06 0.3 0.7 1.3 0.75 5.7 3.6 5.2 4.81
Lalshil 1.7 1.1 1.3 1.36 0.2 0.2 0.3 0.25 2.0 1.3 1.6 1.61
Lalpakri 3.3 2.2 3.1 2.88 0.3 0.4 0.4 0.36 3.6 2.5 3.6 3.23
Mean 5.0 4.0 4.3 0.2 0.3 0.6 5.2 4.3 4.9
Statistics SEm ± CD0.05 SEm ± CD0.05 SEm ± CD0.05
Irrigation (I) 0.45 0.12 0.24 0.10 0.48 0.31
Clone/variety (V) 0.53 0.87 0.21 0.22 0.55 0.67
Interaction I × V 0.51 0.71 0.16 0.14 0.57 1.17
T1: Normal Irrigation; T2: One Irrigation; T3: Two Irrigation (1st at earthing and 2nd after 30 days)

36
Table 5.10 Effect of irrigation and clones/varieties on number & weight of tubers
Bogra
TCRC/CIP clones/variety Tubers no. /Plant
Mean
Average Tuber Weight
(g) Mean
Tubers wt./Plant (g)
Mean
T1 T2 T3 T1 T2 T3 T1 T2 T3
LB 1 (391004.18) 7.8 9.1 8.9 8.60 50.7 39.6 44.7 44.97 397.5 352.4 390.1 379.98
LB 2 (391046.14) 9.7 9.2 8.8 9.27 49.8 50.1 51.1 50.35 485.0 462.4 448.1 465.18
LB 3 (391058.175) 7.5 6.9 6.6 7.00 52.9 52.0 53.6 52.82 397.7 359.2 354.4 370.44
LB 7 (393371.58) 8.6 9.4 8.3 8.80 60.3 53.5 53.4 55.73 520.2 507.0 439.8 489.01
LB 9 (396004.337) 8.3 6.9 7.3 7.50 60.3 62.4 56.5 59.75 499.8 432.0 414.4 448.74
LB 12 (396031.119) 8.9 9.5 9.6 9.32 45.9 41.4 40.4 42.58 403.7 389.3 377.8 390.25
LB 14 (396244.12) 7.9 6.5 5.2 6.50 77.5 80.6 109.2 89.11 607.2 509.9 496.3 537.79
Diamnat 6.5 6.5 5.8 6.28 65.4 58.2 55.3 59.66 428.6 377.6 322.2 376.11
Lalshil 23.9 23.7 25.0 24.20 6.5 5.6 6.7 6.26 144.9 130.9 168.9 148.24
Lalpakri 21.0 18.4 18.1 19.20
12.7 12.5 12.5 12.54 266.4 228.9 218.6 237.97
Mean 11.0 10.6 10.4 48.2 45.6 48.3 415.1 375.0 363.1
Statistics S Em ± CD0.05 S Em ± CD0.05 S Em ± CD0.05
Irrigation (I) 1.48 0.34 6.45 6.51 66.56 3.56
Clone/variety (V) 1.66 1.77 5.27 11.89 4.71 1.77
Interaction I × V 1.26 3.06 8.46 20.59 15.54 3.56
T1: Normal Irrigation; T2: One Irrigation; T3: Two Irrigation (1st at earthing and 2nd after 30 days)
37
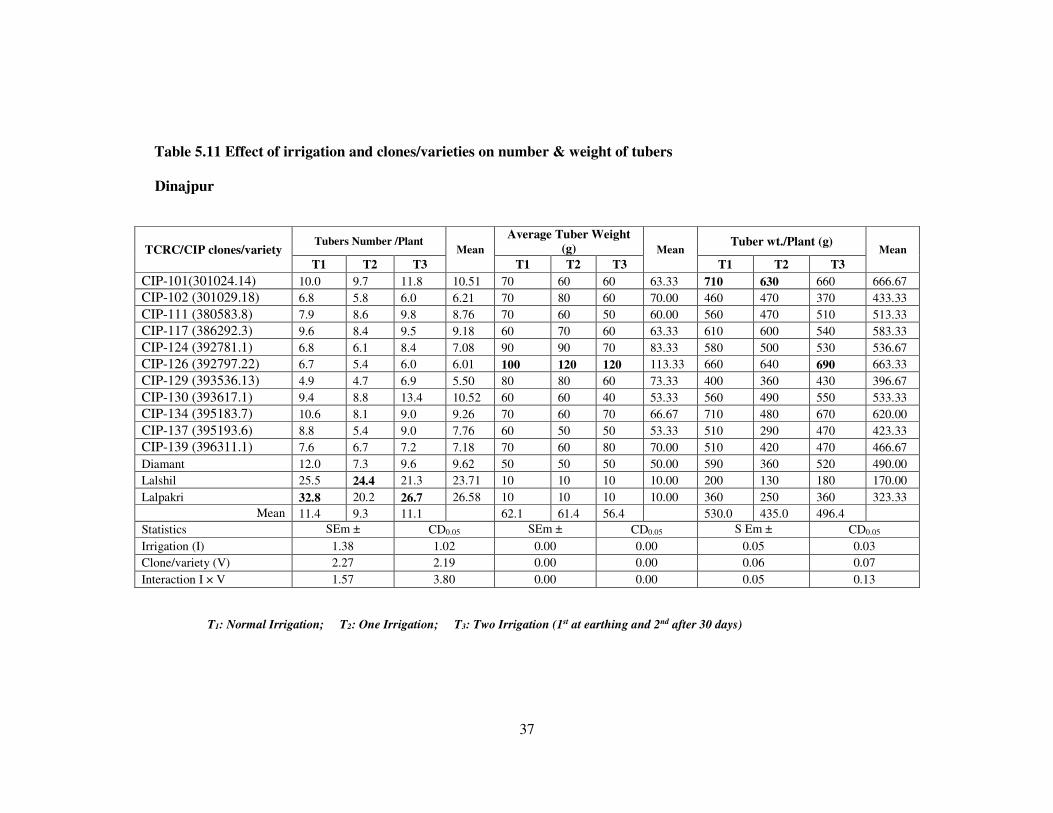
Table 5.11 Effect of irrigation and clones/varieties on number & weight of tubers
Dinajpur
TCRC/CIP clones/variety Tubers Number /Plant
Mean
Average Tuber Weight
(g) Mean Tuber wt./Plant (g)
Mean
T1 T2 T3 T1 T2 T3 T1 T2 T3
CIP-101(301024.14) 10.0 9.7 11.8 10.51 70 60 60 63.33 710 630 660 666.67
CIP-102 (301029.18) 6.8 5.8 6.0 6.21 70 80 60 70.00 460 470 370 433.33
CIP-111 (380583.8) 7.9 8.6 9.8 8.76 70 60 50 60.00 560 470 510 513.33
CIP-117 (386292.3) 9.6 8.4 9.5 9.18 60 70 60 63.33 610 600 540 583.33
CIP-124 (392781.1) 6.8 6.1 8.4 7.08 90 90 70 83.33 580 500 530 536.67
CIP-126 (392797.22) 6.7 5.4 6.0 6.01 100 120 120 113.33 660 640 690 663.33
CIP-129 (393536.13) 4.9 4.7 6.9 5.50 80 80 60 73.33 400 360 430 396.67
CIP-130 (393617.1) 9.4 8.8 13.4 10.52 60 60 40 53.33 560 490 550 533.33
CIP-134 (395183.7) 10.6 8.1 9.0 9.26 70 60 70 66.67 710 480 670 620.00
CIP-137 (395193.6) 8.8 5.4 9.0 7.76 60 50 50 53.33 510 290 470 423.33
CIP-139 (396311.1) 7.6 6.7 7.2 7.18 70 60 80 70.00 510 420 470 466.67
Diamant 12.0 7.3 9.6 9.62 50 50 50 50.00 590 360 520 490.00
Lalshil 25.5 24.4 21.3 23.71 10 10 10 10.00 200 130 180 170.00
Lalpakri 32.8 20.2 26.7 26.58 10 10 10 10.00 360 250 360 323.33
Mean 11.4 9.3 11.1 62.1 61.4 56.4 530.0 435.0 496.4
Statistics SEm ± CD0.05 SEm ± CD0.05 S Em ± CD0.05
Irrigation (I) 1.38 1.02 0.00 0.00 0.05 0.03
Clone/variety (V) 2.27 2.19 0.00 0.00 0.06 0.07
Interaction I × V 1.57 3.80 0.00 0.00 0.05 0.13
T1: Normal Irrigation; T2: One Irrigation; T3: Two Irrigation (1st at earthing and 2nd after 30 days)

38
Table 5.12 Effect of irrigation and clones/varieties on tubers yield (t/ha)
Bogra
TCRC/CIP
clones/variety
Marketable Yield (t/ha) Mean
Non-Marketable Yield
(t/ha) Mean
Yield (t/ha)
Mean
T1 T2 T3 T1 T2 T3 T1 T2 T3
LB 1 (391004.18) 24.8 21.0 24.8 23.53 1.2 1.9 0.9 1.312 26.0 22.9 25.7 24.84
LB 2 (391046.14) 30.7 26.1 27.8 28.17 1.7 2.1 1.1 1.615 32.3 28.2 28.8 29.79
LB 3 (391058.175) 24.5 22.0 22.4 22.96 1.7 1.7 1.3 1.543 26.2 23.7 23.6 24.51
LB 7 (393371.58) 33.0 31.9 28.2 31.02 1.3 1.9 1.1 1.453 34.3 33.8 29.3 32.47
LB 9 (396004.337) 32.0 27.2 23.5 27.57 1.3 1.2 3.8 2.118 33.3 28.4 27.3 29.69
LB 12 (396031.119) 25.3 23.4 23.9 24.19 1.3 1.1 1.0 1.142 26.6 24.5 25.0 25.33
LB 14 (396244.12) 26.9 28.8 29.4 28.39 0.6 1.0 0.9 0.866 27.5 29.9 30.4 29.25
Diamnat 27.1 23.9 20.1 23.68 1.4 1.3 0.9 1.216 28.6 25.2 21.0 24.90
Lalshil 7.3 6.1 8.5 7.31 2.2 2.4 2.7 2.439 9.5 8.5 11.3 9.75
Lalpakri 16.1 13.0 12.7 13.93 1.6 2.1 1.9 1.873 17.8 15.1 14.6 15.80
Mean 24.8 22.3 22.1 1.4 1.7 1.6 26.2 24.0 23.7
Statistics S Em ± CD0.05 S Em ± CD0.05 S Em ± CD0.05
Irrigation (I) 4.40 1.61 1.03 0.56 4.63 1.75
Clone/variety (V) 2.94 2.93 0.64 1.02 2.95 3.20
Interaction I × V 2.09 5.07 0.91 1.77 2.27 5.53
T1: Normal Irrigation; T2: One Irrigation; T3: Two Irrigation (1st at earthing and 2nd after 30 days)

39
Table 5.13 Effect of irrigation and clones/varieties on tubers yield (t/ha)
Dinajpur
TCRC/CIP clones/variety Marketable Yield (t/ha)
Mean
Non-Marketable Yield
(t/ha) Mean
Total Yield (t/ha)
Mean
T1 T2 T3 T1 T2 T3 T1 T2 T3
CIP-101(301024.14) 46.44 40.87 42.89 43.40 1.18 1.13 0.85 1.05 47.62 42.00 43.73 44.45
CIP-102 (301029.18) 30.12 30.44 21.33 27.30 0.74 1.00 3.58 1.77 30.86 31.45 24.91 29.07
CIP-111 (380583.8) 35.33 27.65 26.73 29.91 2.11 3.51 7.51 4.38 37.44 31.16 34.24 34.28
CIP-117 (386292.3) 39.11 37.92 32.67 36.57 1.27 2.07 3.22 2.19 40.38 40.00 35.89 38.76
CIP-124 (392781.1) 37.89 32.22 33.11 34.41 0.78 0.96 2.22 1.32 38.67 33.18 35.33 35.73
CIP-126 (392797.22) 43.11 42.22 43.44 42.92 0.71 0.38 2.22 1.10 43.82 42.60 45.67 44.03
CIP-129 (393536.13) 26.11 22.22 25.11 24.48 0.38 2.02 3.67 2.02 26.49 24.25 28.78 26.50
CIP-130 (393617.1) 36.30 30.94 32.12 33.12 0.63 1.58 4.60 2.27 36.93 32.52 36.72 35.39
CIP-134 (395183.7) 45.78 31.11 39.78 38.89 1.11 0.85 4.58 2.18 46.89 31.96 44.36 41.07
CIP-137 (395193.6) 32.22 18.32 23.88 24.81 1.48 0.96 7.41 3.28 33.70 19.28 31.28 28.09
CIP-139 (396311.1) 32.22 26.67 27.89 28.93 1.56 1.16 3.00 1.91 33.78 27.82 30.89 30.83
Diamant 37.36 18.89 26.22 27.49 1.95 4.78 8.34 5.02 39.31 23.67 34.55 32.51
Lalshil 11.56 7.33 9.67 9.52 1.55 1.44 2.26 1.75 13.11 8.78 11.93 11.27
Lalpakri 22.22 14.44 20.89 19.18 2.00 2.36 2.78 2.38 24.22 16.80 23.67 21.56
Mean 33.98 27.23 28.98 1.25 1.73 4.02 35.23 28.96 33.00
Statistics SEm ± CD0.05 SEm ± CD0.05 SEm ± CD0.05
Irrigation (I) 1.02 0.73 0.53 0.23 3.13 2.21
Clone/variety (V) 1.18 1.58 0.47 0.50 3.89 4.77
Interaction I × V 1.13 2.73 0.19 0.86 3.40 8.95
T1: Normal Irrigation; T2: One Irrigation; T3: Two Irrigation (1st at earthing and 2nd after 30 days)

40
Annexure-A
Table A: Monthly Environmental information from November, 09 to March, 2010 at
different locations of Bangladesh
Items Chittagong
Nov’09 Dec’09 Jan’10 Feb’10 March’10
Temperature (0c) Max. 31.33 24.30 27.02 30.40 33.03
Min. 20.60 15.60 13.70 16.90 22.80
Humidity 76.9 75.23 71.20 63.01 69.70
Rainfall (mm) 43.20 0.00 0.00 8.80 59.90
Bogra
Temperature (0c) Max. 30.30 25.60 22.30 28.40 33.60
Min. 18.80 13.20 13.50 14.40 20.10
Humidity 74.10 78.90 73.40 52.50 54.00
Rainfall (mm) 0.00 0.00 0.00 0.00 0.00
Dinajpur
Temperature (0c) Max.
Min.
Rainfall (mm)
Top Related