![3Q FY2006 실적보고서 070117 - Mirae Asset Daewoo · 2012-01-28 · - 2 - fy2006 3분기 실적보고서 fy2006 3q (2006년10월 ~ 2006년12월) 재무 및 영업 현황 [표2]](https://static.fdocuments.net/doc/165x107/5e417350edfce95bc3092578/3q-fy2006-eeoe-070117-mirae-asset-daewoo-2012-01-28-2-fy2006.jpg)


Languages
Pages
Legal


Business Report for FY2006Business Report for FY2006
October,2006
http://www.smk.co.jp/
-- From Apr.2006 to Sep.2006 From Apr.2006 to Sep.2006 --
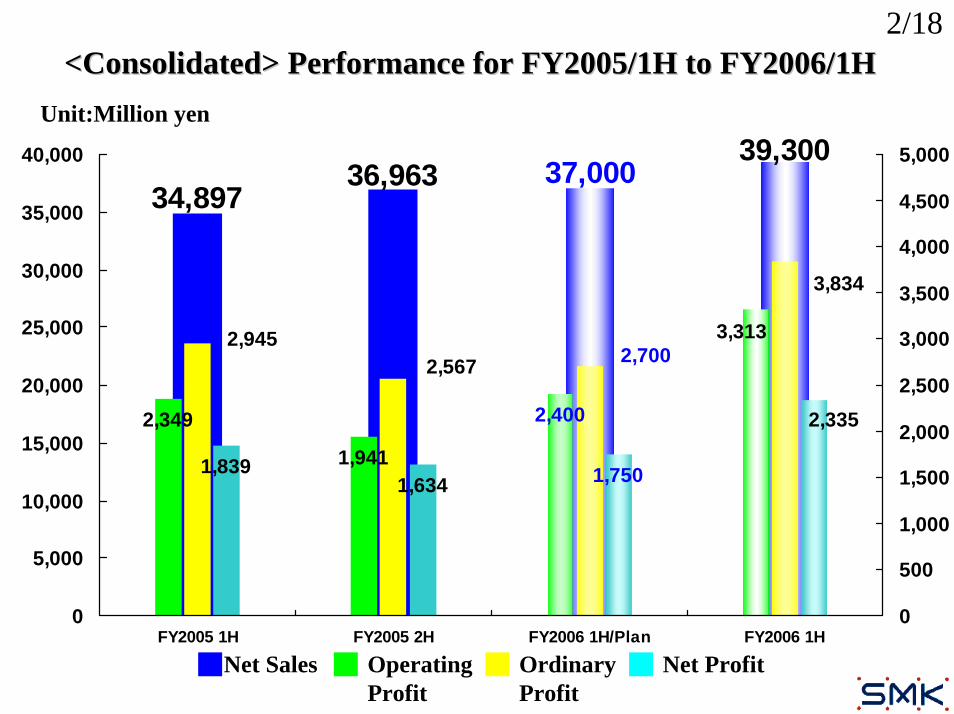
34,89736,963
39,30037,000
2,349
1,941
2,400
3,3132,9452,567 2,700
3,834
1,6341,839 1,750
2,335
0
5,000
10,000
15,000
20,000
25,000
30,000
35,000
40,000
FY2005 1H FY2005 2H FY2006 1H/Plan FY2006 1H0
500
1,000
1,500
2,000
2,500
3,000
3,500
4,000
4,500
5,000
<<Consolidated> Performance for FY2005/1H to FY2006/1H Consolidated> Performance for FY2005/1H to FY2006/1H Unit:Million yen
Net Sales Operating Profit
Ordinary Profit
Net Profit
2/18
0
10,000
20,000
30,000
40,000
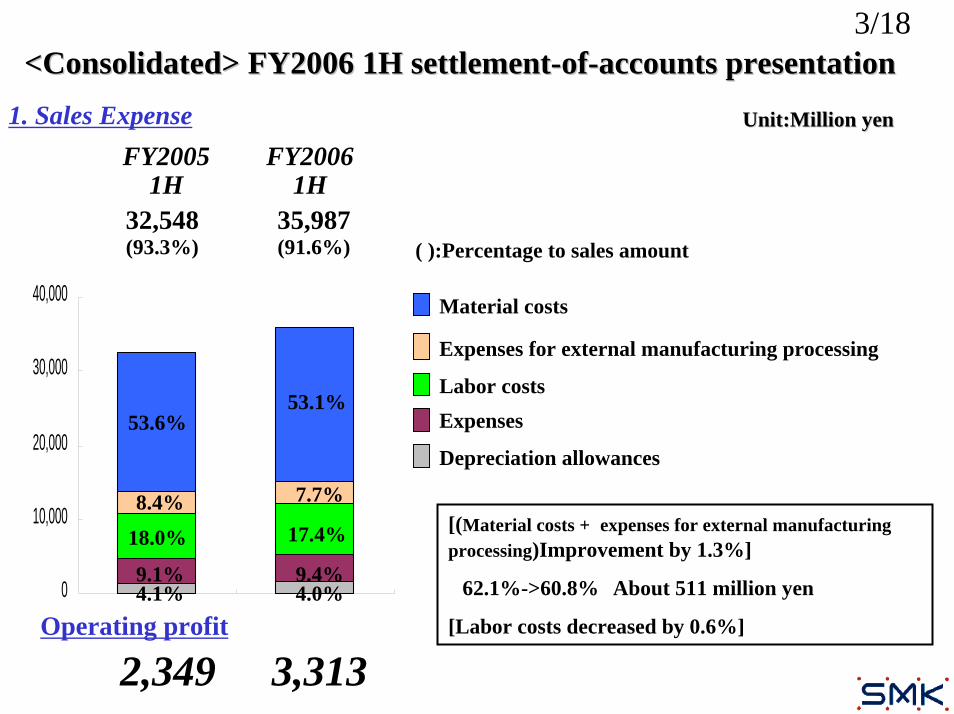
2,349
53.6%
8.4%
18.0%
9.1%4.1%
53.1%
7.7%
17.4%
9.4%4.0%
32,548 35,987(93.3%) (91.6%)
3,313
Material costs
Labor costsExpenses
Depreciation allowances
( ):Percentage to sales amount
Expenses for external manufacturing processing
1. Sales ExpenseFY2005
1HFY2006
1H
Unit:Million yenUnit:Million yen
Operating profit
[(Material costs + expenses for external manufacturing processing)Improvement by 1.3%]
62.1%->60.8% About 511 million yen
[Labor costs decreased by 0.6%]
<<Consolidated> FY2006 1H settlementConsolidated> FY2006 1H settlement--ofof--accounts presentationaccounts presentation3/18

△51 2
△1 4 0
5 1 1
△56 3
1 , 6 6 8
-1,000
-500
0
500
1,000
1,500
2,000
((Unit:Million yen)Unit:Million yen)
Analysis of profit increase/decrease factors for FY2006 1H
Comparison of consolidated operating profits in 2 fiscal terms [FY2005 1H vs. FY2006 1H]
Increase in sales am
ounts (to include price reduction)
B.Factors for profit decreaseA.Factors for profit increases
2,179 total Total -1,215
Material cost
reduction
Labor cost
increase
Depreciation
allowance
increase Expense
increase
2. Analysis of sales expenses
Net Total964
4/18
-100
0
100
200
300
400
500
600
700
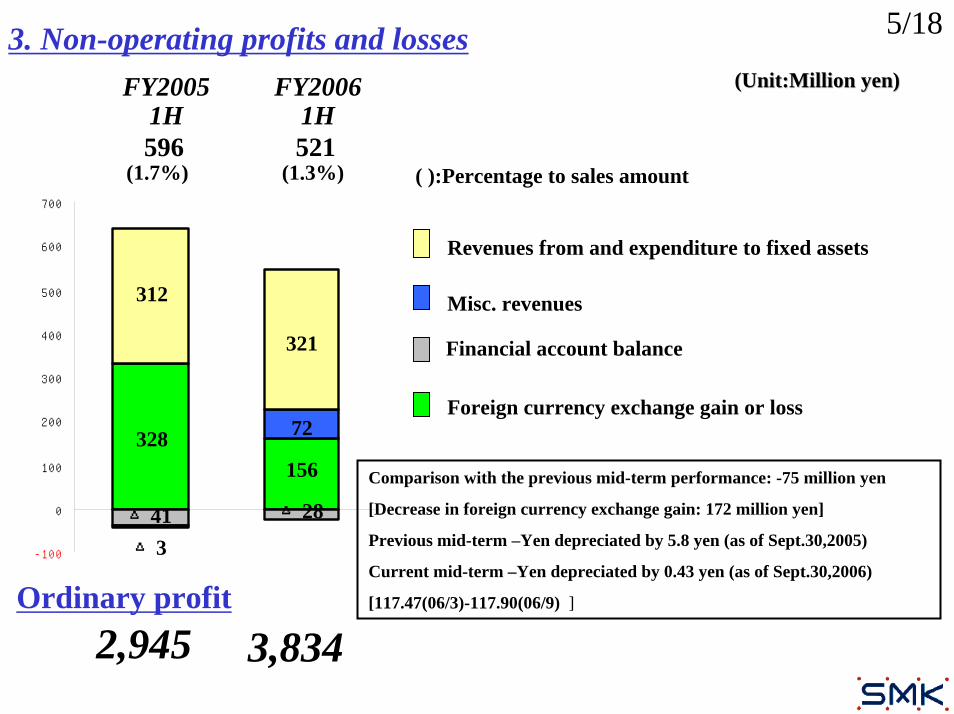
596 521
2,945 3,834
(1.7%) (1.3%)
3. Non-operating profits and losses ((Unit:Million yen)Unit:Million yen)
Ordinary profit
( ):Percentage to sales amount
Revenues from and expenditure to fixed assets
Misc. revenues
Financial account balance
Foreign currency exchange gain or loss
FY20051H
FY20061H
Comparison with the previous mid-term performance: -75 million yen
[Decrease in foreign currency exchange gain: 172 million yen]
Previous mid-term –Yen depreciated by 5.8 yen (as of Sept.30,2005)
Current mid-term –Yen depreciated by 0.43 yen (as of Sept.30,2006)
[117.47(06/3)-117.90(06/9) ]
312
321
328 72
156
△41 △28
△3
5/18

3,3132,349
Net sales / Operating Profit by Product Division (FY2005 1H, FY2006 1H)
Net SalesNet Sales
Operating ProfitOperating Profit
16,122 20,166
16,13216,753
2,6432,381
0
5,000
10,000
15,000
20,000
25,000
30,000
35,000
40,000
45,000
FY2005 1H FY2006 1H
34,89739,300
Unit:Million yen
Million yen
CS FC TP
1,9082,751
661
672
-220 -110-5000
5001,0001,5002,0002,5003,0003,5004,000
FY2005 1H FY2006 1H
6/18
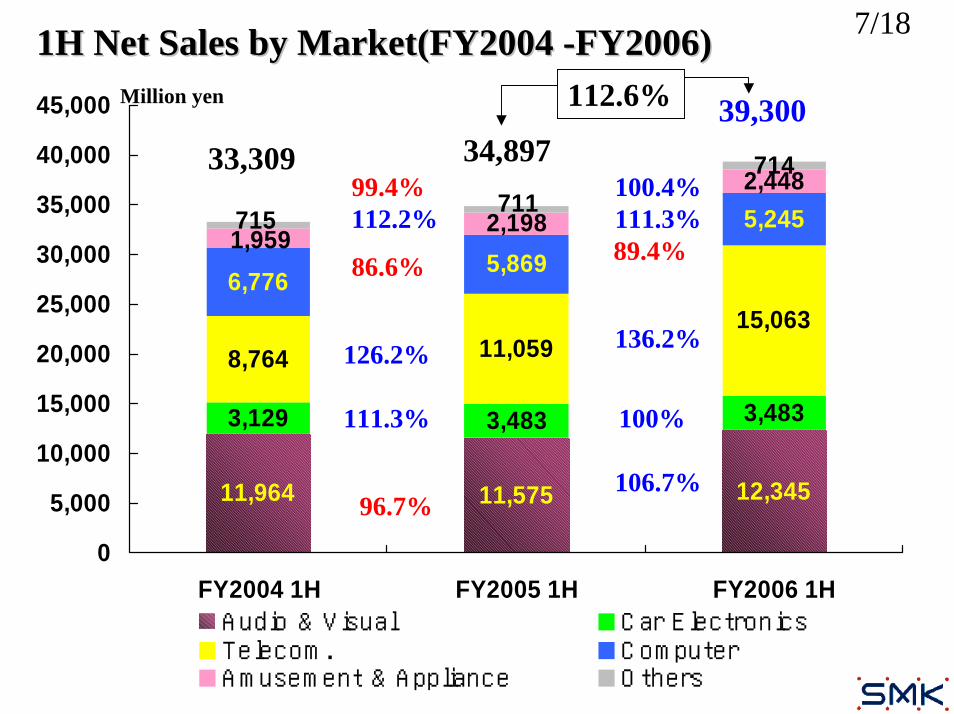
11,964 11,575 12,345
3,129 3,483 3,483
8,764 11,05915,063
6,7765,869
5,2452,1982,448714
1,959711715
0
5,000
10,000
15,000
20,000
25,000
30,000
35,000
40,000
45,000
FY2004 1H FY2005 1H FY2006 1HAudio & Visual Car ElectronicsTelecom. ComputerAmusement & Appliance Others
11H Net Sales by Market(FY2004 H Net Sales by Market(FY2004 --FY2006)FY2006)
34,897
126.2%
96.7%
86.6%
112.2%
Million yen
33,309
111.3%
99.4%
39,300112.6%
106.7%
100%
136.2%
89.4%111.3%100.4%
7/18
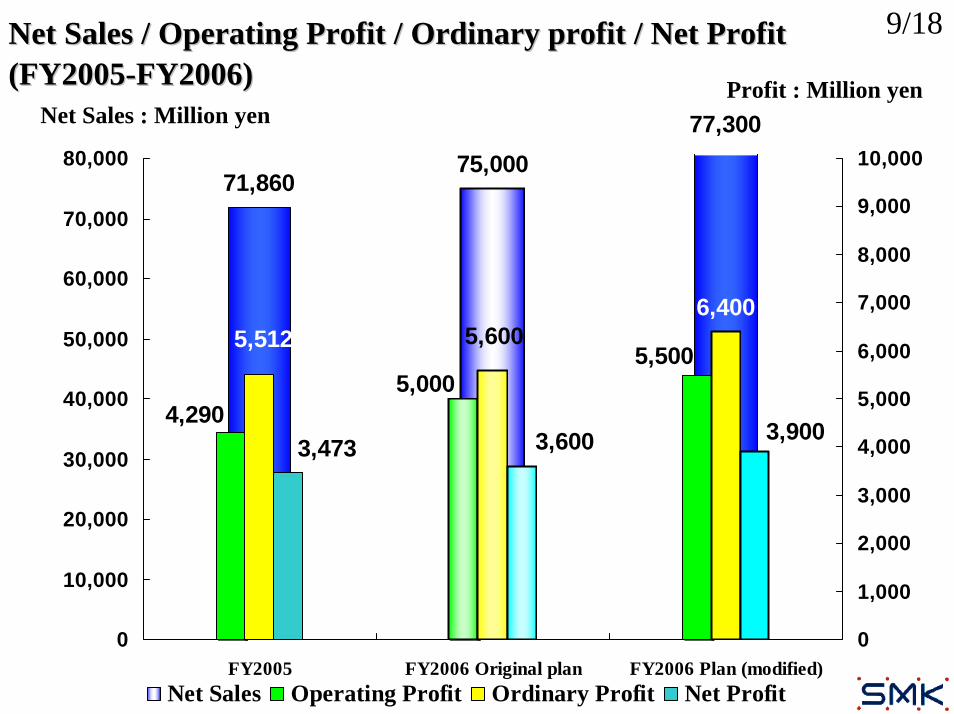
77,300
71,86075,000
4,290
5,5005,000
6,4005,6005,512
3,9003,473 3,600
0
10,000
20,000
30,000
40,000
50,000
60,000
70,000
80,000
FY2005 FY2006 Original plan FY2006 Plan (modified)0
1,000
2,000
3,000
4,000
5,000
6,000
7,000
8,000
9,000
10,000
Net Sales Operating Profit Ordinary Profit Net Profit
Net Sales / Operating Profit / Ordinary profit / Net ProfitNet Sales / Operating Profit / Ordinary profit / Net Profit(FY2005(FY2005--FY2006)FY2006)
Net Sales : Million yenProfit : Million yen
9/18

3,461
8,1108,652
3,684
49
0
5,000
10,000
FY2005 1H FY2006 1H
FCFC
Comparison to last year performance 106.7%
Audio & VisualAudio & Visual[[Net Sales]Net Sales]
Unit:Million yen ■■Remote control unitRemote control unit
■■New New coneccttersconecctters’’ contribution to sales contribution to sales increaseincrease
TN sales increase
• For thin TVs:European and ASEAN markets
•For STBs:North American market
Flip structureFPC connector
CSCS
11,57512,345
TPTP
HDMI connector
For audio system applications
Plug cords/sockets
For thin TVs
Business trend of Business trend of individual marketsindividual markets--11
10/18
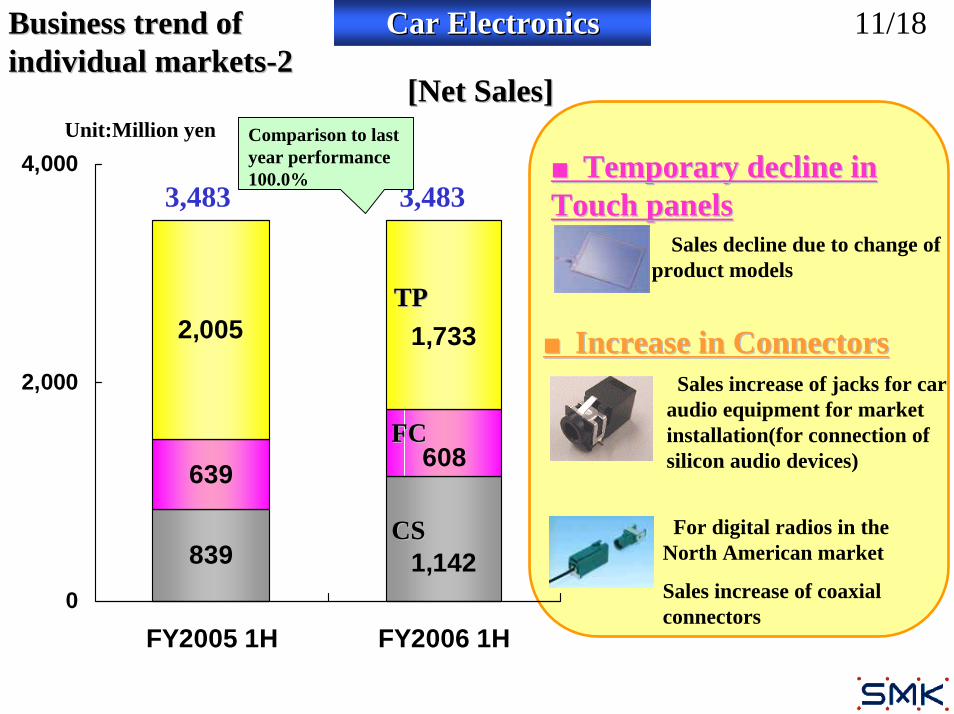
839
639
2,005
1,142
608
1,733
0
2,000
4,000
FY2005 1H FY2006 1H
3,483
CSCS
FCFC
TPTP
Sales increase of jacks for car audio equipment for market installation(for connection of silicon audio devices)
■■Temporary decline in Temporary decline in Touch panelsTouch panels
Comparison to last year performance 100.0%
Car ElectronicsCar Electronics
[[Net Sales]Net Sales]
3,483
Unit:Million yen
Sales decline due to change of product models
■■Increase in ConnectorsIncrease in Connectors
For digital radios in the North American market
Sales increase of coaxial connectors
11/18Business trend of Business trend of individual marketsindividual markets--22
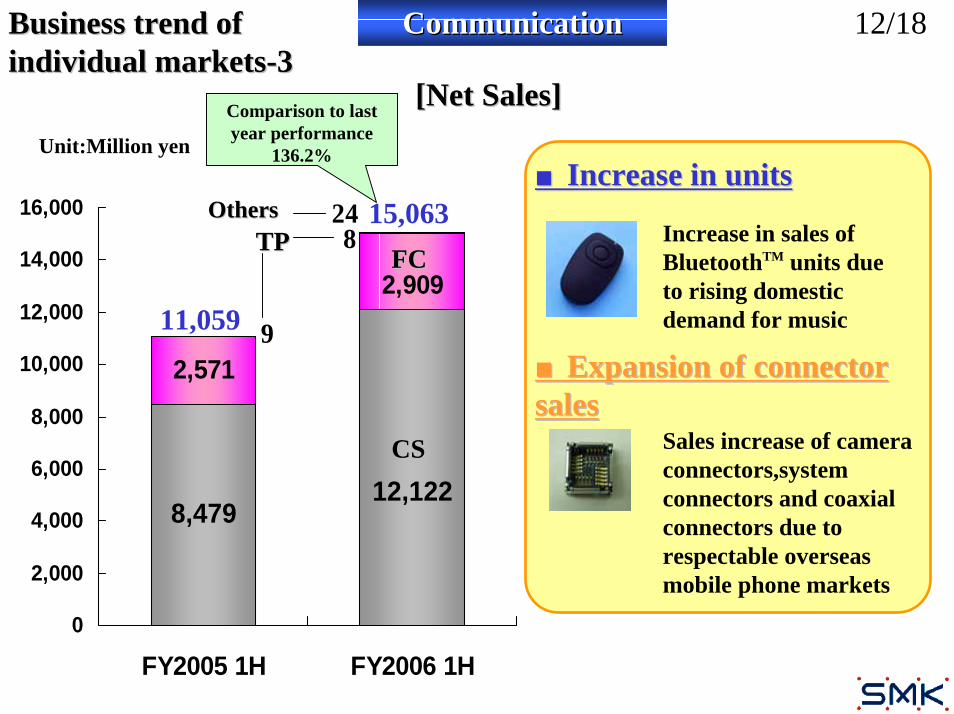
8,479
2,571
12,122
2,909
9
824
0
2,000
4,000
6,000
8,000
10,000
12,000
14,000
16,000
FY2005 1H FY2006 1H
15,063
CSCS
FCFC
■■Expansion of connector Expansion of connector salessales
Sales increase of camera connectors,system connectors and coaxial connectors due to respectable overseas mobile phone markets
Comparison to last year performance
136.2%
CommunicationCommunication
[[Net Sales]Net Sales]
■■Increase in unitsIncrease in units
11,059
Unit:Million yen
Increase in sales of BluetoothTM units due to rising domestic demand for music
TPTPOthersOthers
12/18Business trend of Business trend of individual marketsindividual markets--33
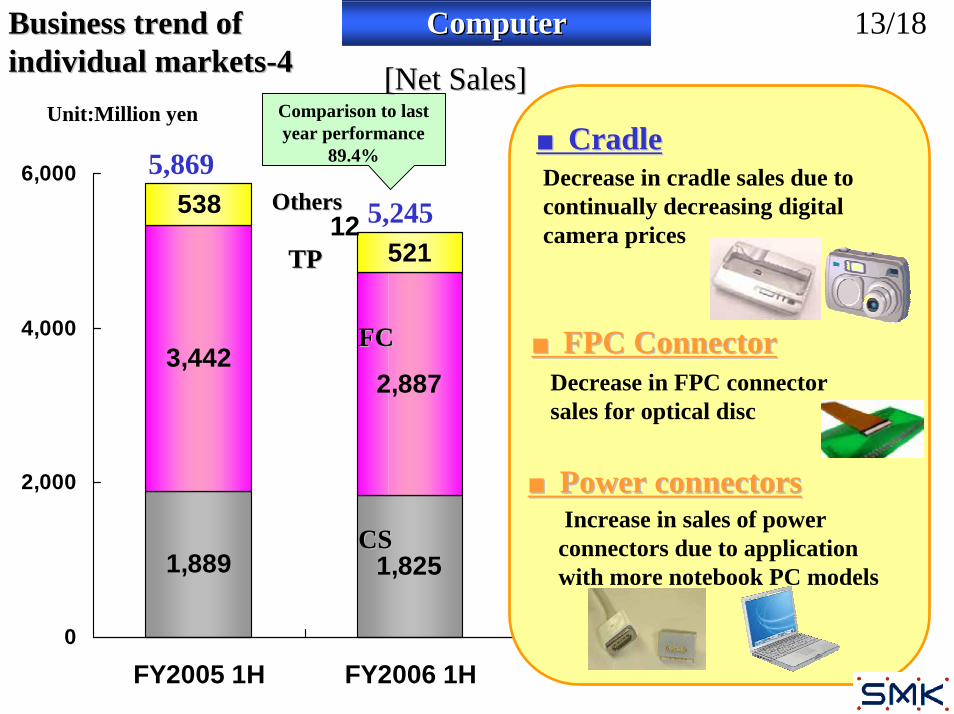
1,889 1,825
3,4422,887
538
52112
0
2,000
4,000
6,000
FY2005 1H FY2006 1H
5,869
5,245
CSCS
TPTP
Comparison to last year performance
89.4%
[[Net Sales]Net Sales]
ComputerComputer
Unit:Million yen■■CradleCradleDecrease in cradle sales due to continually decreasing digital camera prices
■■FPC ConnectorFPC ConnectorDecrease in FPC connector sales for optical disc
Increase in sales of power connectors due to application with more notebook PC models
■■Power connectorsPower connectors
FCFC
13/18
OthersOthers
Business trend of Business trend of individual marketsindividual markets--44
SMKSMK’’s 3 major management challengess 3 major management challenges1.Three Challenges
*Enhancement of SMK’s brand power.*Promotion of TN wide activity for ZD (Zero Defect) to improve quality.*Another try for product creation⇒Start for “SMILE” activity (For 3 years)
SMK Manufacturing Innovation Leads to ZD2.Turning red-ink businesses into black at an earliest opportunity3.Undertaking to Medium term business plan*Higher than 10% ROE*Continued payment of an annual dividend of 12 yen or more
4. Environmental business*Compliance with the RoHS Directive (effected in July 2006)*Publication of an environmental report (July 2006)
5.CSR management*Establishment of the “SMK Group’s Code of Conduct”(proclaimed in April 2006)*Compliance with the Japanese version of the SOX law
14/18
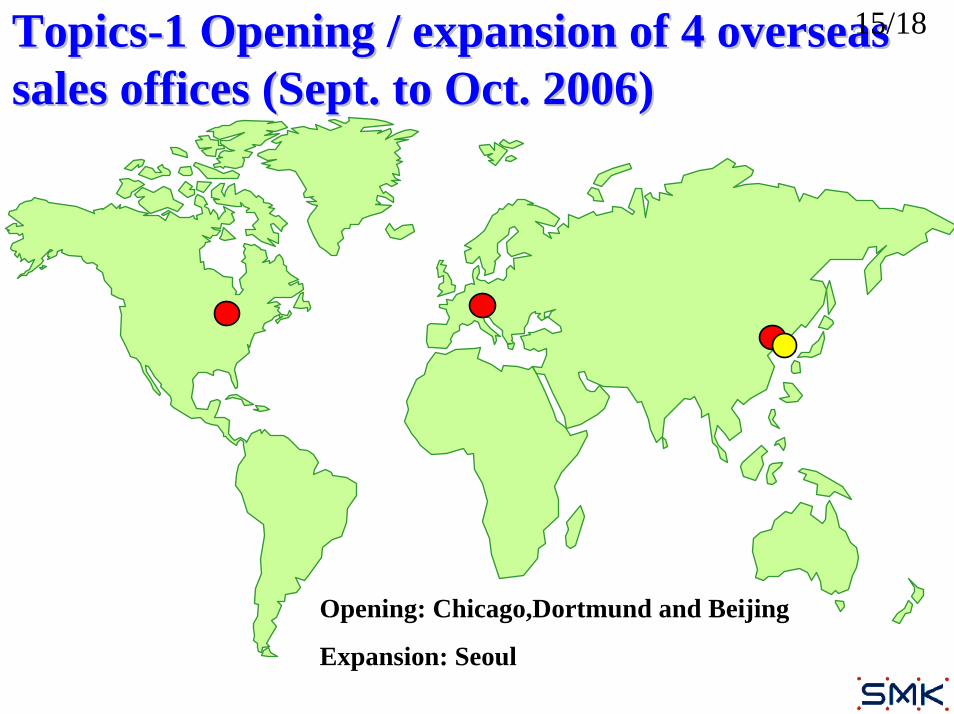
TopicsTopics--1 Opening / expansion of 4 overseas 1 Opening / expansion of 4 overseas sales offices (Sept. to Oct. 2006)sales offices (Sept. to Oct. 2006)
Opening: Chicago,Dortmund and Beijing
Expansion: Seoul
15/18
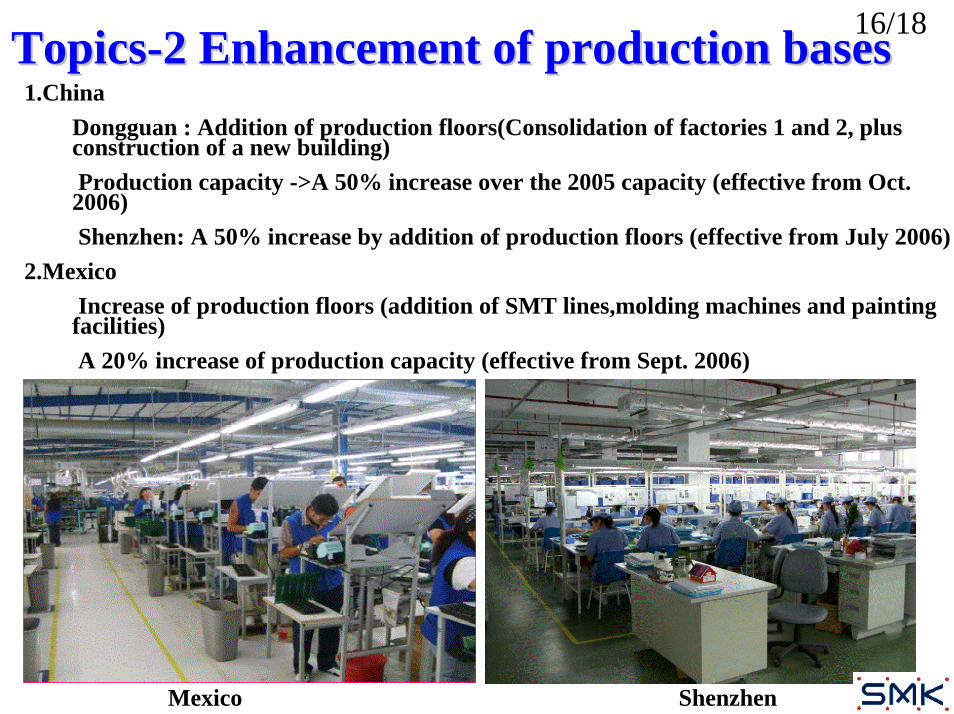
TopicsTopics--2 Enhancement of production bases 2 Enhancement of production bases 1.China
Dongguan : Addition of production floors(Consolidation of factories 1 and 2, plus construction of a new building)Production capacity ->A 50% increase over the 2005 capacity (effective from Oct. 2006) Shenzhen: A 50% increase by addition of production floors (effective from July 2006)
2.MexicoIncrease of production floors (addition of SMT lines,molding machines and painting facilities) A 20% increase of production capacity (effective from Sept. 2006)
ShenzhenMexico
16/18

The 7th medium term business planThe 7th medium term business plan(for 2007 through 2009) being laid down(for 2007 through 2009) being laid down
CREATING AN EXCITING FUTURECREATING AN EXCITING FUTURE
2010 Sales - 100 billion yen, Operating Profit - 10%2010 Sales - 100 billion yen, Operating Profit - 10%
Slogan
Target
Earliest achievement of becoming Earliest achievement of becoming a 100 billion yen selling companya 100 billion yen selling companymaintaining reasonable profitsmaintaining reasonable profits
17/18
Innovation and creation Innovation and creation
-Practicing speedy company management-Practicing speedy company management
18/18
CS Div.IR’06.10
CS Division
1. Transition of sales and profits2. Market-specific sales3. Product strategy and Division policy
CS-1/10
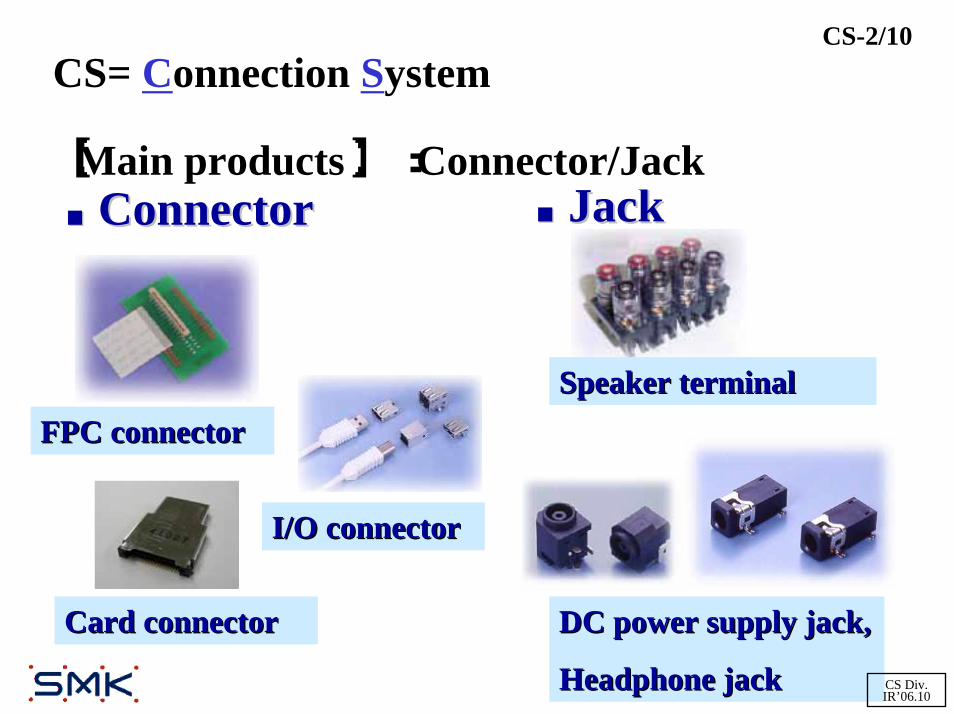
CS= Connection System
■■ConnectorConnector ■■JackJack
FPC connectorFPC connector
I/O connectorI/O connector
Card connectorCard connector
【Main products】 :Connector/Jack
Speaker terminalSpeaker terminal
DC power supply jack,DC power supply jack,
Headphone jackHeadphone jack
CS-2/10
CS Div.IR’06.10
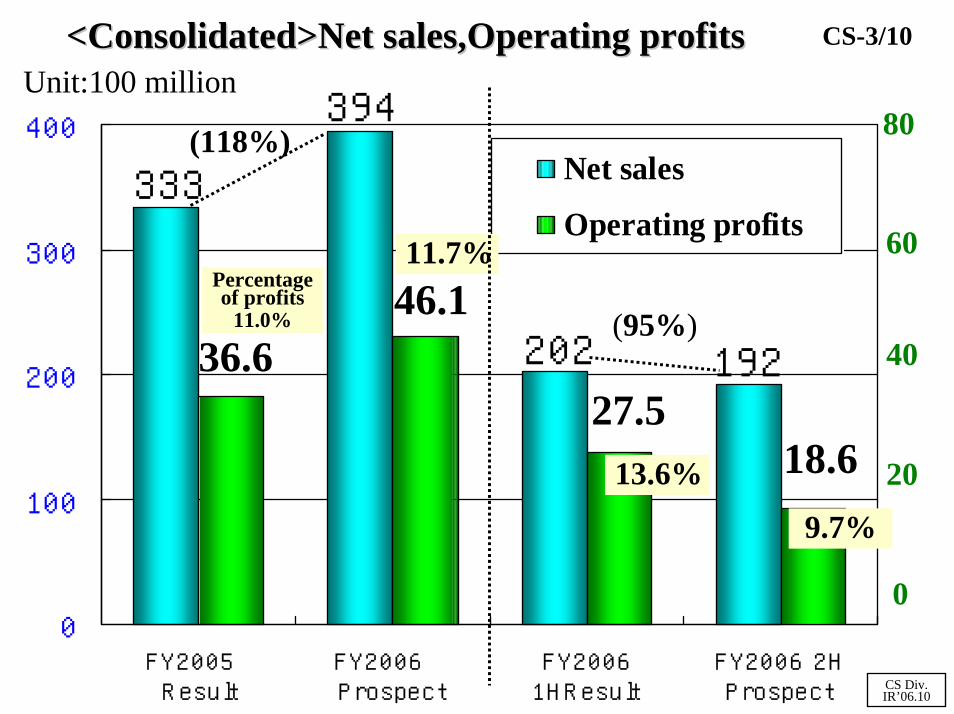
192202
394
333
0
100
200
300
400
FY2005 Result
FY2006 Prospect
FY20061HResult
FY2006 2HProspect
Net sales
Operating profits
<<Consolidated>Net sales,Operating profitsConsolidated>Net sales,Operating profitsUnit:100 million
(118%)
20
40
80
27.5 18.6
36.646.1Percentage
of profits11.0%
11.7%
13.6%
9.7%
(95%)
CS-3/10
CS Div.IR’06.10
60
0
0%
50%
100%
FY2005 FY2005 FY2006 FY2006
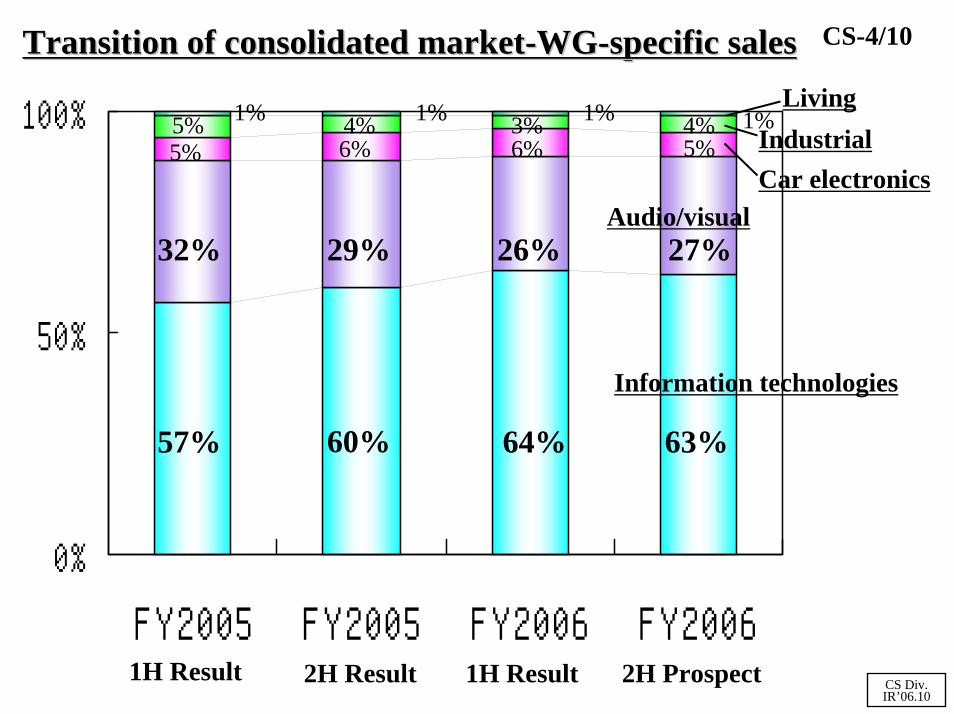
Audio/visualCar electronics
Information technologies
Transition of consolidated marketTransition of consolidated market--WGWG--specific salesspecific sales
1H Result 2H Result
57% 60% 63%
32% 29% 27%
5% 6% 5%5% 4% 4%1%
1H Result 2H Prospect
64%
26%
6%3%
CS-4/10
CS Div.IR’06.10
IndustrialLiving1% 1% 1%

157131
100
2004FY 2005FY 2006FY
Interface connectorsInterface connectors
For mobile phones and portable audio devices
*With FY2004 as 100Sale transition
Micro USB connector
Connectors for mobile phones
Optimization of items compatible with fast transmission and standard specification
HDMI Connector
For AV and PC equipment
Connectors for notebook PCs
CS-5/10
CS Div.IR’06.10
Multi-functionality and addition of high value,Good business records with small and compound items
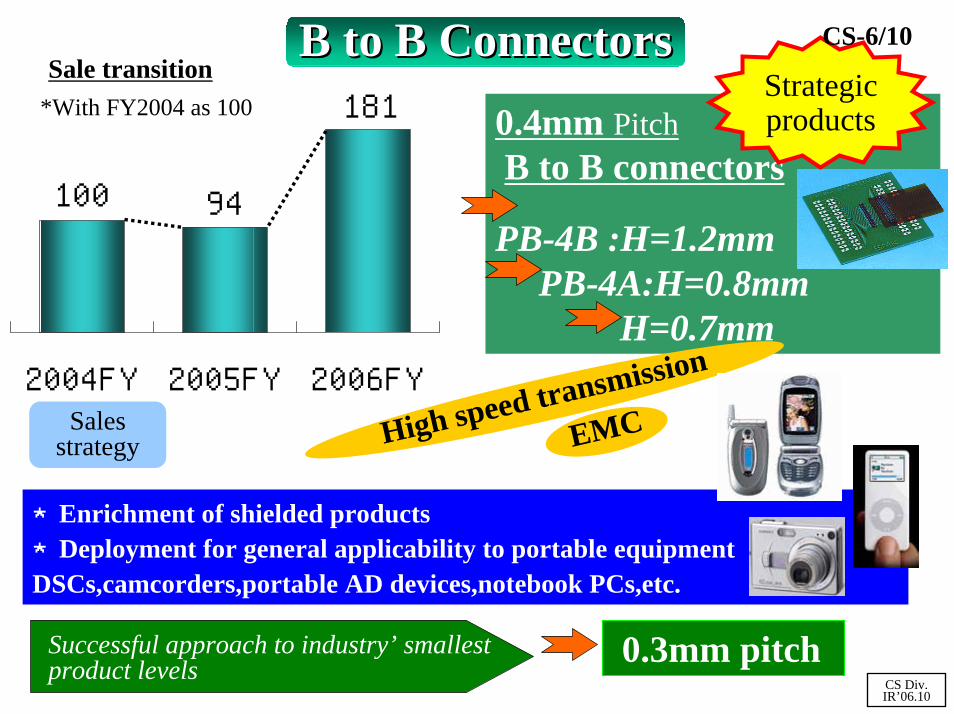
0.4mm PitchB to B connectors
PB-4B :H=1.2mm PB-4A:H=0.8mm H=0.7mm
★Enrichment of shielded products★Deployment for general applicability to portable equipmentDSCs,camcorders,portable AD devices,notebook PCs,etc.
181
94100
2004FY 2005FY 2006FY
B to B ConnectorsB to B Connectors
0.3mm pitchSuccessful approach to industry’ smallest product levels
Strategic products
Sales strategy
Sale transition
CS Div.IR’06.10
EMCHigh speed transmission
CS-6/10
*With FY2004 as 100
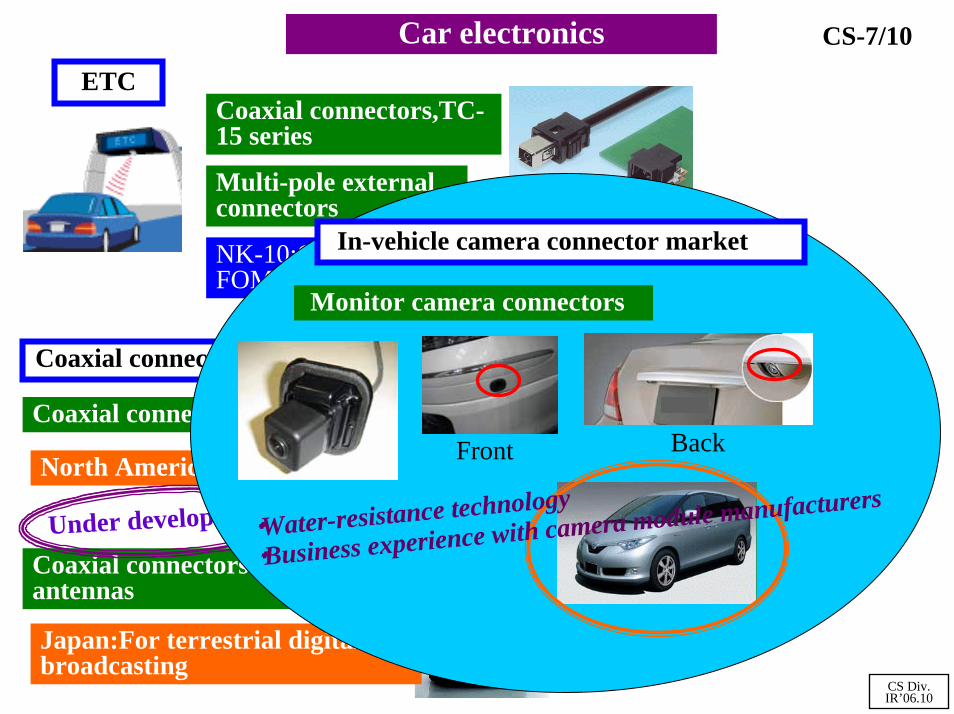
ETC
Coaxial connectors for digital broadcast
Coaxial connectors,TC-15 series
Coaxial connector,SMB series
Business experience with antenna manufacturers
Coaxial connectors for glass antennas
North America:Xm broadcast
Japan:For terrestrial digital broadcasting
NK-10:Connector for FOMA-USB signal
Multi-pole external connectors
Car electronics
Under development
CS Div.IR’06.10
CS-7/10
In-vehicle camera connector market
Monitor camera connectors
・Water-resistance technology
・Business experience with camera module manufacturers
Front Back

CS-8/10
CS Div.IR’06.10
Enhancement of SMK-SZ’s production capacity

Enhancement of domestic production capacity using automatic machines
CS-9/10
CS Div.IR’06.10
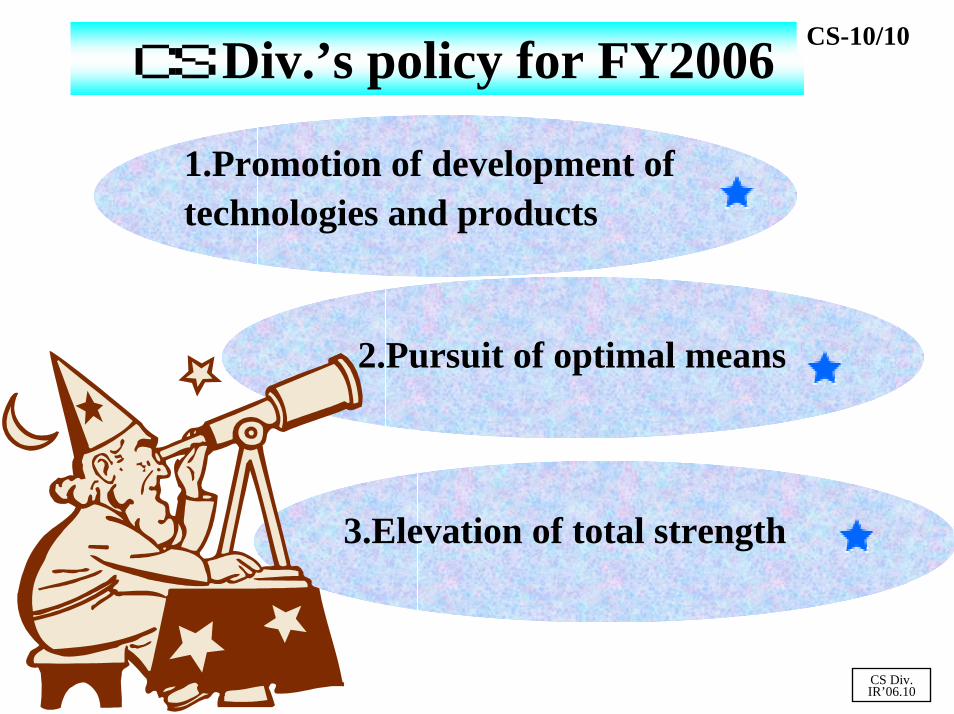
CS Div.’s policy for FY2006
CS Div.IR’06.10
CS-10/10
1.Promotion of development of technologies and products
2.Pursuit of optimal means
3.Elevation of total strength
FCFC DivisionDivision
1.<Consolidated> Sales and operating profits
2.<Consolidated> Market-specific sales
3.Introduction of key strategic products
FC-1/7
Achievement for the 1st half of FY2006 and projection for the 2nd half

FC=Functional Components
[Main products]:Switch/Keyboard/Control panel/Earphone microphone/Cradle/Microphone/Remote Control Unit/Camera module■■SW (SW (SwSwitch)itch) ■■UN (UN (UnUnit)it)
■■MD (MD (MMooddule)ule)
Earphone Earphone microphonemicrophone
Electret Electret Condenser Condenser Microphone (ECM)Microphone (ECM)
CradleCradle
Remote Control UnitRemote Control Unit Color Intelligent Color Intelligent Remote Control UnitRemote Control Unit
■■RC (RC (RRemote emote CControl)ontrol)Various type of switchesVarious type of switches
FC-2/7
Camera ModuleCamera Module
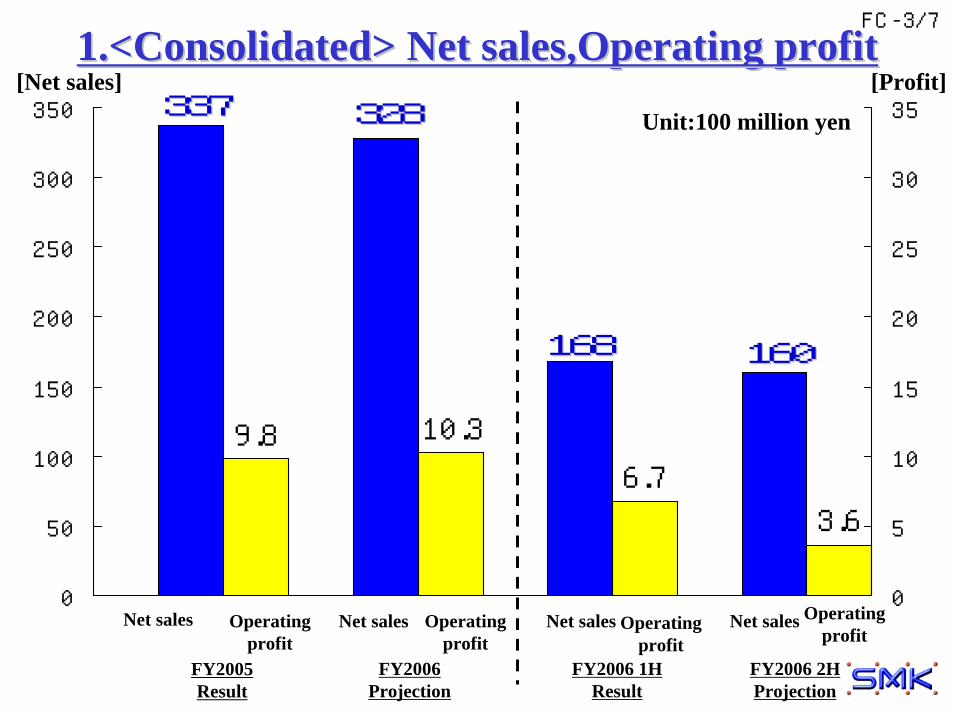
6.7
3.6
9.8 10.3
0
50
100
150
200
250
300
350
0
5
10
15
20
25
30
35
1.<1.<Consolidated> Net sales,Operating profitConsolidated> Net sales,Operating profit[Net sales]
FY2005Result
Net sales Operating profit
FY2006 Projection
Net sales Operating profit
337337 328328
FC-3/7
[Profit]
FY2006 2HProjection
168168
FY2006 1HResult
160160
Unit:100 million yen
Net sales Operating profit
Net sales Operating profit
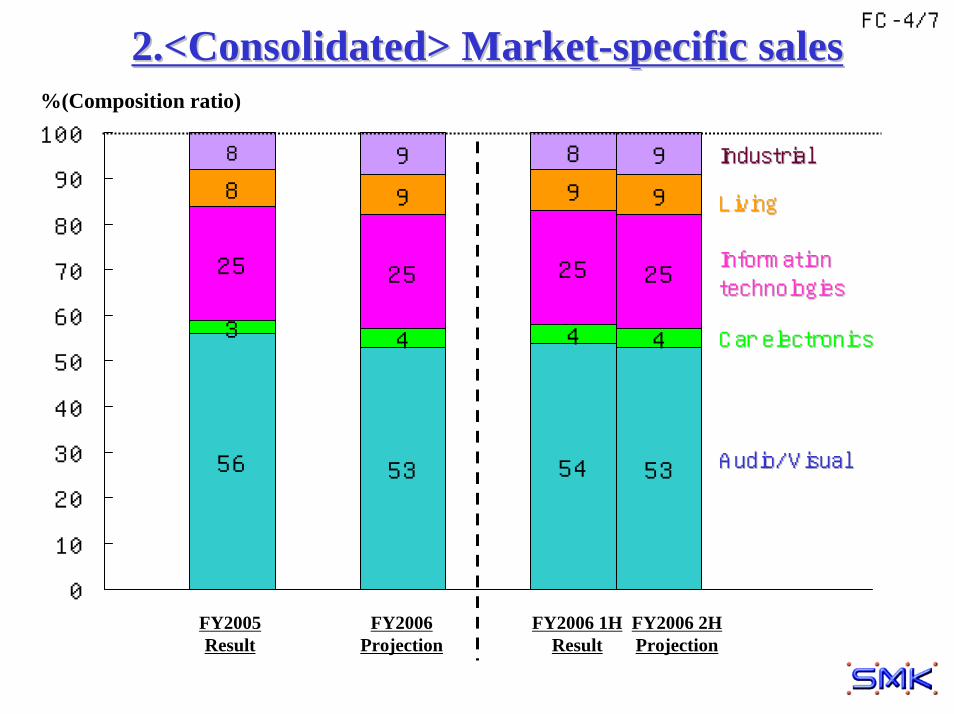
56 53 54 53
3 4 4 4
25 25 25 25
8 9 9 9
9 8 98
0
10
20
30
40
50
60
70
80
90
100
2.<2.<Consolidated> MarketConsolidated> Market--specific salesspecific sales%(Composition ratio)
FC-4/7
Audio/VisualAudio/Visual
Car electronicsCar electronics
Information Information technologiestechnologies
LivingLiving
IndustrialIndustrial
FY2005Result
FY2006 Projection
FY2006 2HProjection
FY2006 1HResult
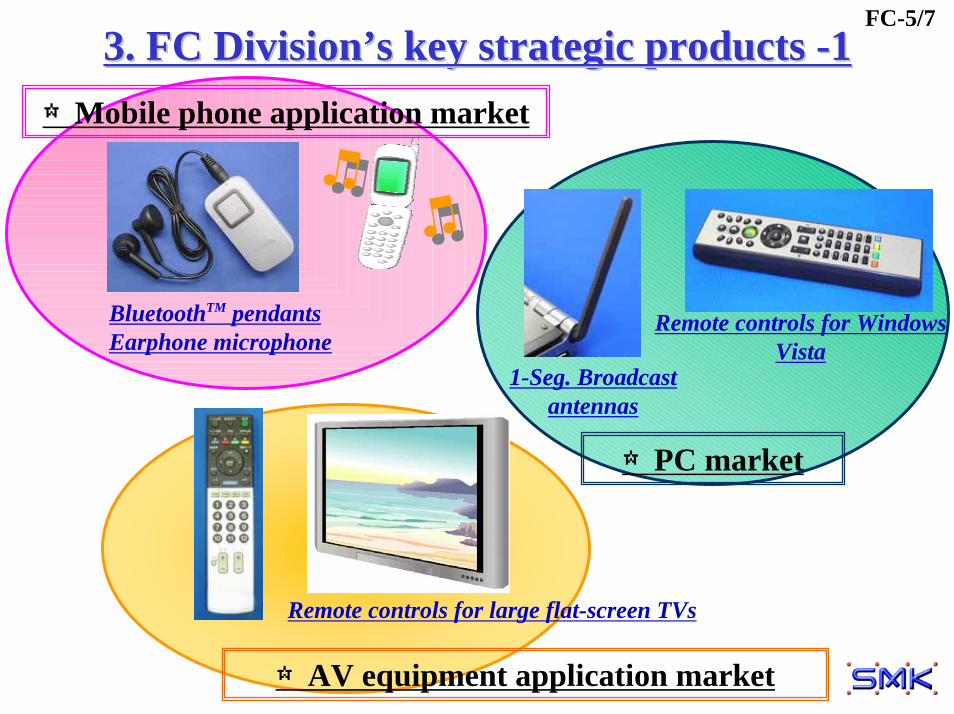
3. 3. FC DivisionFC Division’’s key strategic products s key strategic products --11FC-5/7
☆AV equipment application market
Remote controls for large flat-screen TVs
BluetoothTM pendantsEarphone microphone
☆Mobile phone application market
Remote controls for Windows Vista
☆PC market
1-Seg. Broadcast antennas
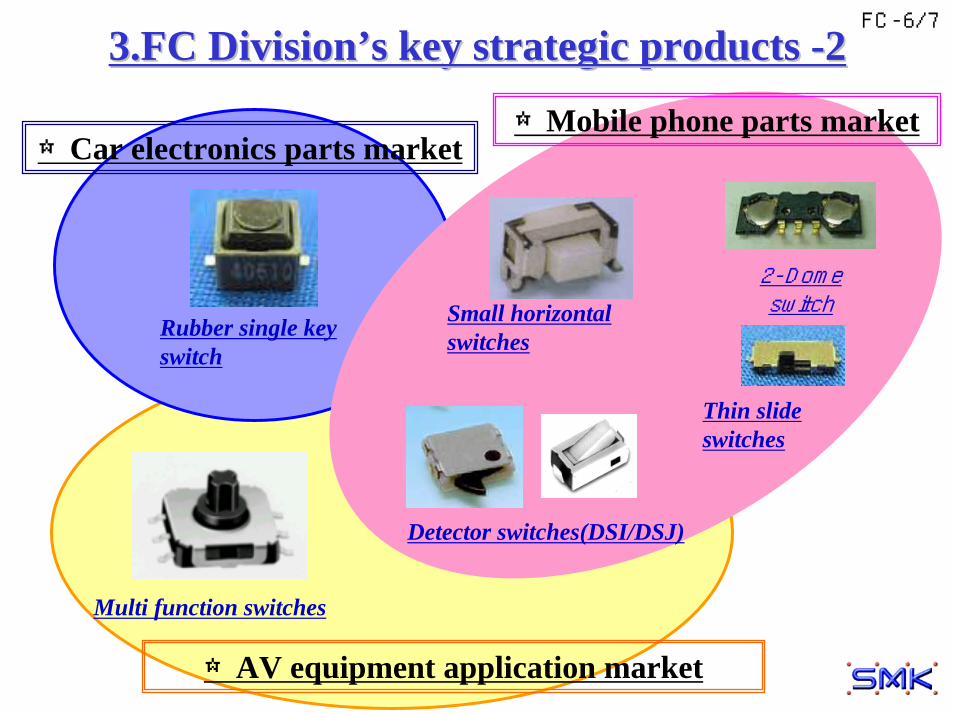
3.3.FC DivisionFC Division’’s key strategic products s key strategic products --22FC-6/7
2-Dome switchSmall horizontal
switches
Thin slide switches
Rubber single key switch
Detector switches(DSI/DSJ)
Multi function switches
☆AV equipment application market
☆Mobile phone parts market☆Car electronics parts market

FY2006 : Seeding for the medium term FY2006 : Seeding for the medium term business planbusiness plan
FC-7/7
((for FY2007 throughfor FY2007 through through FY2009)through FY2009)
Product developmentProduct development
Human resourcesHuman resources
Cost reductionCost reduction
TP DivisionTP Division
1.Introduction of TP Division and its products 2.Achievement and projection of consolidated sales amounts and profits3.Market specific-ratio of sales4.TP Div’s major activity points
Contents
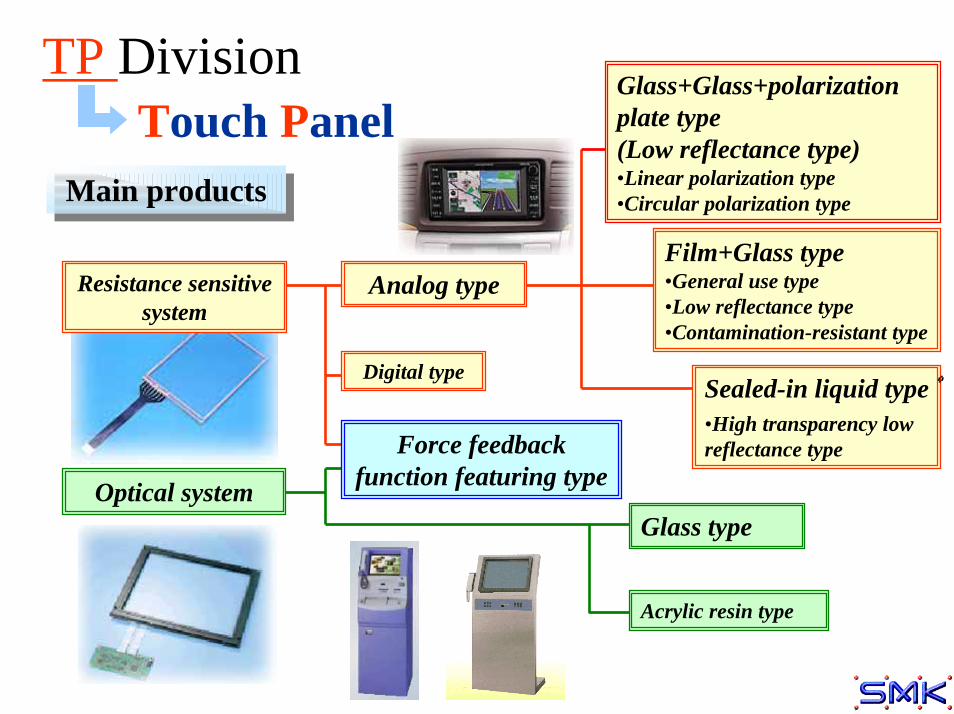
Optical system
Digital type
Main productsMain products
TP DivisionTouch Panel
Resistance sensitive system
Analog type
Sealed-in liquid type゚•High transparency low reflectance type
Glass+Glass+polarization plate type (Low reflectance type)•Linear polarization type•Circular polarization type
Glass type
Force feedback function featuring type
Film+Glass type•General use type•Low reflectance type•Contamination-resistant type
Acrylic resin type
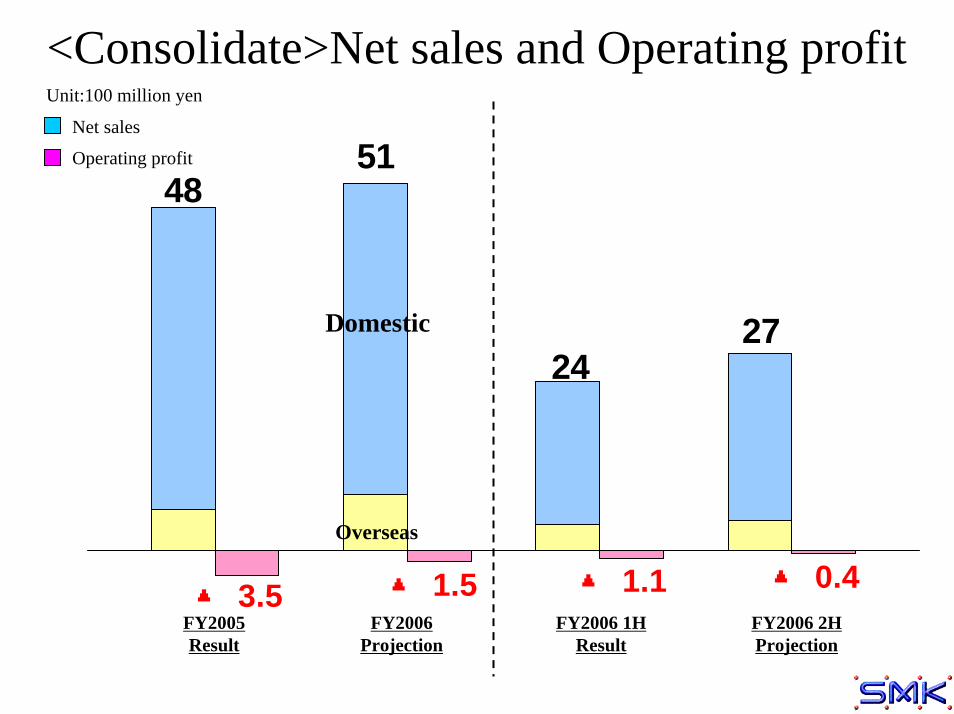
▲ 0.4▲ 1.1▲ 1.5▲ 3.5
2724
5148
<Consolidate>Net sales and Operating profit
Domestic
Overseas
Net sales
Operating profit
Unit:100 million yen
FY2005Result
FY2006 Projection
FY2006 2HProjection
FY2006 1HResult
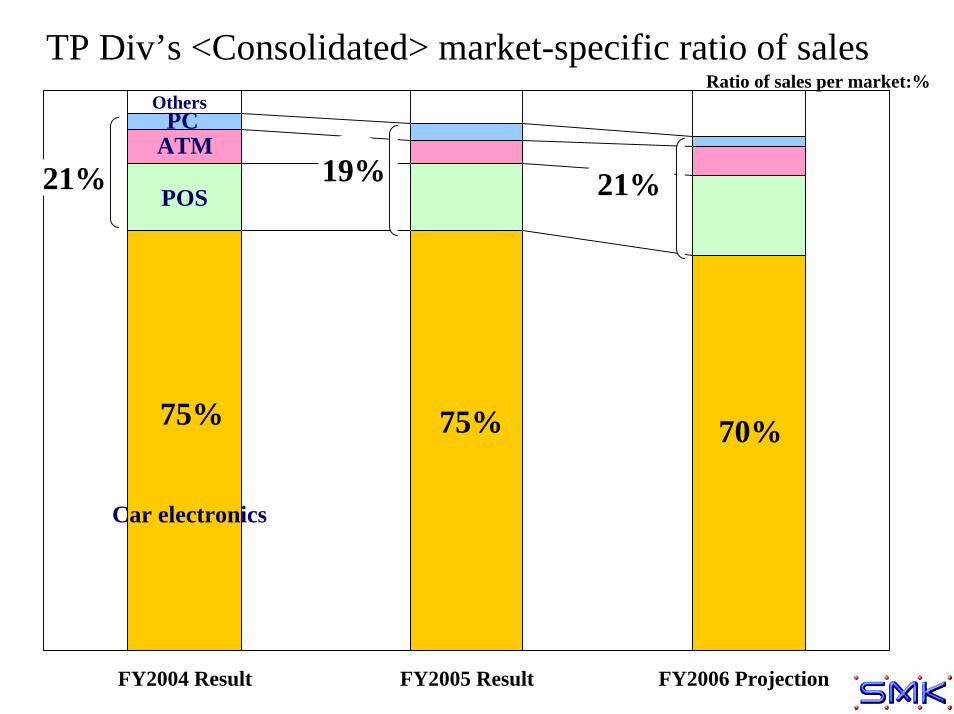
Car electronics
Ratio of sales per market:%
PCOthers
TP Div’s <Consolidated> market-specific ratio of sales
70%
ATM
POS
FY2004 Result FY2006 ProjectionFY2005 Result
75%
21% 21%19%
75%
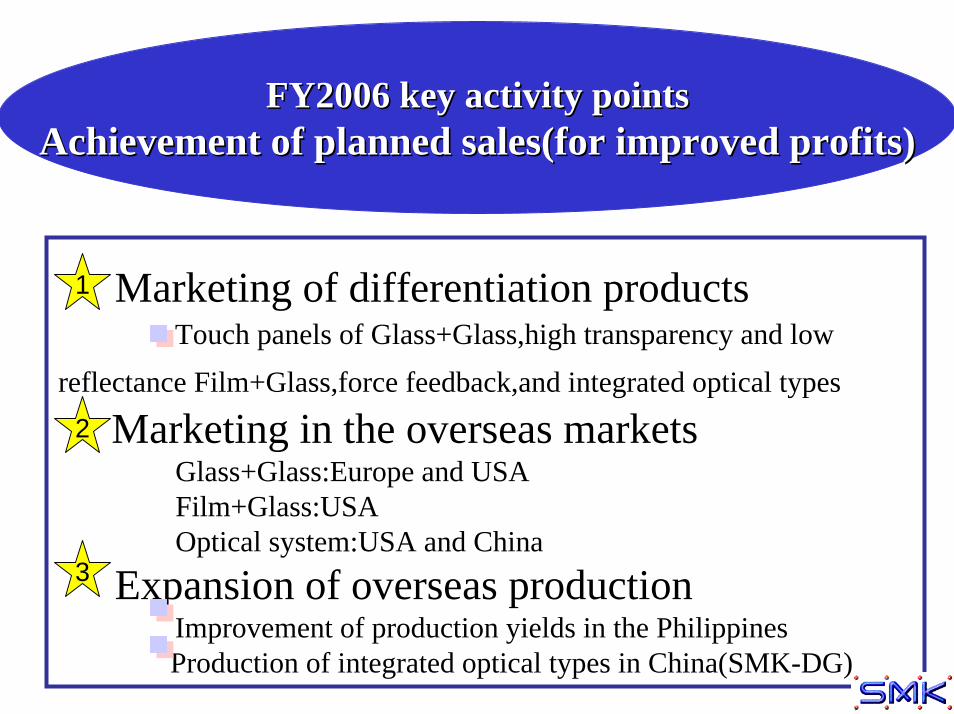
Marketing of differentiation products Touch panels of Glass+Glass,high transparency and low reflectance Film+Glass,force feedback,and integrated optical types
Marketing in the overseas markets Glass+Glass:Europe and USA Film+Glass:USA Optical system:USA and China Expansion of overseas production Improvement of production yields in the Philippines Production of integrated optical types in China(SMK-DG)
FY2006 key activity pointsFY2006 key activity pointsAchievement of planned sales(for improved profits)Achievement of planned sales(for improved profits)
1
2
3
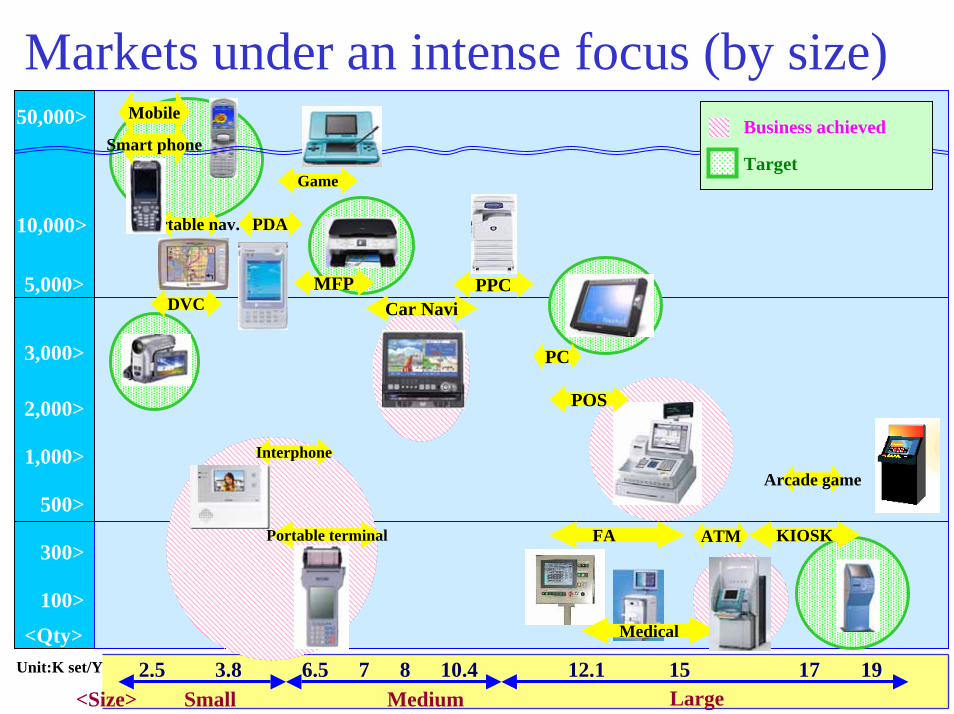
PPC
FA
Game
ATM
Medical<Qty>
100>
300>
500>
1,000>
5,000>
10,000>
2,000>
3,000>
50,000>
KIOSK
Arcade game
POS
Car NaviDVC
Business achieved
Target
Mobile
Portable nav. PDA
PC
2.5 3.8 17 19 12.1 15 6.5 7 8 10.4 Small Medium Large<Size>
Unit:K set/Y
MFP
Smart phone
Markets under an intense focus (by size)
Portable terminal
Interphone
Car nav.
Portable terminals
PDA/PC
PPC/MFP
Household elec.appliances
POS
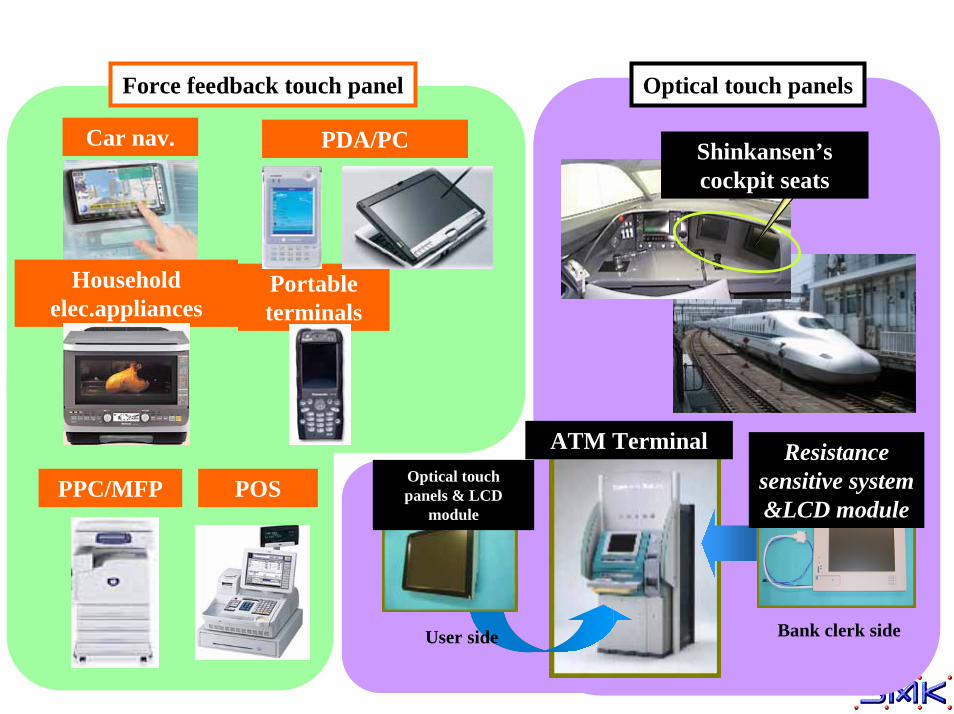
Force feedback touch panel Optical touch panels
Shinkansen’s cockpit seats
Bank clerk side
ATM Terminal Resistance sensitive system &LCD module
Optical touch panels & LCD
module
User side
Top Related