FY2005 Annual Progress Report and FY2006 Program Plan
76
The OptIPuter FY2005 Annual Progress Report and FY2006 Program Plan 1 FY2005 Annual Progress Report and FY2006 Program Plan D I S T R I B U T I O N C O P Y NSF ITR Cooperative Agreement SCI-0225642 October 1, 2004 – September 30, 2005 SUBMITTED August 3, 2005 Larry Smarr, Principal Investigator California Institute for Telecommunications and Information Technology (Calit2) University of California, San Diego [email protected] www.optiputer.net
Transcript of FY2005 Annual Progress Report and FY2006 Program Plan

The OptIPuter FY2005 Annual Progress Report and FY2006 Program Plan 1
FY2005 Annual Progress Report and FY2006 Program Plan
DISTRIBUTION COPY
NSF ITR Cooperative Agreement SCI-0225642
October 1, 2004 – September 30, 2005
SUBMITTED August 3, 2005
Larry Smarr, Principal Investigator California Institute for Telecommunications and Information Technology (Calit2)
University of California, San Diego [email protected] www.optiputer.net

The OptIPuter FY2005 Annual Progress Report and FY2006 Program Plan 2
Table of Contents
1. OptIPuter Participants 5 1.A. Primary Personnel 5 1.B. Other Senior Personnel 5 1.C. Other Partner Organizations 6 1.D. Other Collaborators and Contacts 8
2. OptIPuter Activities and Findings 9 2.A. Research Activities 9
2.A.1. OptIPuter’s Mission 9 2.A.2. OptIPuter Research Metrics 9 2.A.3. OptIPuter Milestone for Year 3 9 2.A.4. Network and Hardware Infrastructure Activities 9
2.A.4.a. General Network and Hardware Infrastructure Activities 9 2.A.4.b. UCSD Campus Testbed (includes SoCal OptIPuter sites) 11 2.A.4.c. Metro Chicago Testbed 13 2.A.4.d. National Testbed (via CAVEwave) 14 2.A.4.e. International Testbed (via SURFnet and TransLight) 15 2.A.4.f. Optical Signaling, Control and Management 15
2.A.5. Software Architecture Research Activities 16 2.A.5.a. System Software Architecture 16 2.A.5.b. Real-Time Capabilities 17 2.A.5.c. Data Storage 18 2.A.5.d. Security 18 2.A.5.e. End-to-End Performance Modeling 19 2.A.5.f. High-Performance Transport Protocols 19
2.A.6. Data, Visualization and Collaboration Research Activities 19 2.A.6.a. Data and Data Mining Research 19 2.A.6.b. Visualization/Collaboration Tools 20 2.A.6.c. Volume Visualization Tools 21 2.A.6.d. Visualization and Data Analysis Development 22 2.A.6.e. Photonic Multicasting 22 2.A.6.f. LambdaRAM 22
2.A.7. Applications and Education Activities 23 2.A.7.a. SIO Application Codes 23 2.A.7.b. SDSU Application Codes 24 2.A.7.c. NCMIR/BIRN Application Codes 25 2.A.7.d. Education and Outreach Activities 25
2.A.8. Meetings, Presentations, Conference Participation 27 2.B. Research Findings 38
2.B.1. Network and Hardware Infrastructure Findings 38 2.B.1.a. General Network and Hardware Infrastructure Findings 38 2.B.1.b. UCSD Campus Testbed (includes SoCal OptIPuter sites) 38 2.B.1.c. Metro Chicago Testbed 39 2.B.1.d. National Testbed (via CAVEwave) 39 2.B.1.e. International Testbed (via SURFnet and TransLight) 39 2.B.1.f. Optical Signaling, Control and Management 40
2.B.2. Software Architecture Research Findings 40 2.B.2.a. System Software Architecture 40 2.B.2.b. Real-Time Capabilities 40 2.B.2.c. Data Storage 40 2.B.2.d. Security 41 2.B.2.e. End-to-End Performance Modeling 41 2.B.2.f. High-Performance Transport Protocols 42
2.B.3. Data, Visualization and Collaboration Research Findings 42 2.B.3.a. Data and Data Mining Research 42
The OptIPuter FY2005 Annual Progress Report and FY2006 Program Plan 3
2.B.3.b. Visualization/Collaboration Tools 43 2.B.3.c. Volume Visualization Tools 44 2.B.3.d. Visualization and Data Analysis Development 44 2.B.3.e. Photonic Multicasting 45 2.B.3.f. LambdaRAM 46
2.B.4. Applications and Education Findings 46 2.B.4.a. SIO Application Codes 46 2.B.4.b. SDSU Application Codes 47 2.B.4.c. NCMIR/BIRN Application Codes 47 2.B.4.d. Education and Outreach Activities 47
2.C. Research Training 49 2.D. Education/Outreach 49
3. OptIPuter Publications and Products 50 3.A. Journals/Papers 50 3.B. Books/Publications 53 3.C. Internet Dissemination 54 3.D. Other Specific Products 54
4. OptIPuter Contributions 55 4.A. Contributions within Discipline 55 4.B. Contributions to Other Disciplines 55 4.C. Contributions to Education and Human Resources 55 4.D. Contributions to Resources for Science and Technology 55 4.E. Contributions Beyond Science and Engineering 55
5. OptIPuter Special Requirements 56 5.A. Objectives and Scope 56 5.B. Special Reporting Requirements 56 5.C. Unobligated Funds 56 5.D. Animals, Biohazards, Human Subjects 56
6. OptIPuter FY2006 Program Plan (October 1, 2005 – September 30, 2006) 57 6.A. Year 4 Milestone 57 6.B. Network and Hardware Infrastructure Activities 57
6.B.1. UCSD Campus Testbed (includes SoCal OptIPuter sites) 58 6.B.2. Metro Chicago Testbed 58 6.B.3. National Testbed (via CAVEwave) 59 6.B.4. International Testbed (via SURFnet and TransLight) 59 6.B.5. Optical Signaling, Control, and Management 59
6.C. Software Architecture Research Activities 61 6.C.1. System Software Architecture 62 6.C.2. Real-Time Capabilities 62 6.C.3. Data Storage 62 6.C.4. Security 62 6.C.5. End-to-End Performance Modeling 63 6.C.6. High-Performance Transport Protocols 63
6.D. Data, Visualization and Collaboration Research Activities 63 6.D.1. Data and Data Mining Research 64 6.D.2. Visualization/Collaboration Tools 64 6.D.3. Volume Visualization Tools 65 6.D.4. Visualization and Data Analysis Development 65 6.D.5. Photonic Multicasting 65 6.D.6. LambdaRAM 65
6.E. Applications and Education Activities 65 6.E.1. SIO Application Codes 66 6.E.2. SDSU Application Codes 67 6.E.3. NCMIR/BIRN Application Codes 67 6.E.4. Education and Outreach Activities 67

The OptIPuter FY2005 Annual Progress Report and FY2006 Program Plan 4
7. OptIPuter FY2005 Expenses (Year 3) 68 7.A. FY2005 Expense Justification 68
7.A.1. Introduction 68 7.A.2. UCSD FY2005 Expense Justification 68 7.A.3. NU FY2005 Expense Justification 68 7.A.4. SDSU FY2005 Expense Justification 69 7.A.5. TAMU FY2005 Expense Justification 69 7.A.6. UCI FY2005 Expense Justification 69 7.A.7. UIC FY2005 Expense Justification 69 7.A.8. USC FY2005 Expense Justification 70
7.B. FY2005 Expenses 71 7.B.1. UCSD FY2005 Expenses 71 7.B.2. NU FY2005 Expenses 71 7.B.3. SDSU FY2005 Expenses 71 7.B.4. TAMU FY2005 Expenses 71 7.B.5. UCI FY2005 Expenses 71 7.B.6. UIC FY2005 Expenses 71 7.B.7. USC FY2005 Expenses 71
8. OptIPuter FY2006 Budgets (Year 4) 72 8.A. FY2006 Budget Justification 72
8.A.1. Introduction 72 8.A.2. UCSD FY2006 Budget Justification 72 8.A.3. NU FY2006 Budget Justification 72 8.A.4. SDSU FY2006 Budget Justification 72 8.A.5. TAMU FY2006 Budget Justification 72 8.A.6. UCI FY2006 Budget Justification 72 8.A.7. UIC FY2006 Budget Justification 73 8.A.8. USC FY2006 Budget Justification 73
8.B. FY2006 Budgets 74 8.B.1. UCSD FY2006 Budget 74 8.B.2. NU FY2006 Budget 74 8.B.3. SDSU FY2006 Budget 74 8.B.4. TAMU FY2006 Budget 74 8.B.5. UCI FY2006 Budget 74 8.B.6. UIC FY2006 Budget 74 8.B.7. USC FY2006 Budget 74
9. OptIPuter Cumulative Budgets 75 9.A. TOTAL Expenditures Cumulative Summary 75 9.B. Cumulative Budgets 75
9.B.1. UCSD Expenditures Cumulative 75 9.B.2. NU Expenditures Cumulative 75 9.B.3. SDSU Expenditures Cumulative 75 9.B.4. TAMU Expenditures Cumulative 75 9.B.5. UCI Expenditures Cumulative 75 9.B.6. UIC Expenditures Cumulative 75 9.B.7. USC Expenditures Cumulative 75
10. UCSD Cost Share Letter 76

The OptIPuter FY2005 Annual Progress Report and FY2006 Program Plan 5
1. OptIPuter Participants
1.A. Primary Personnel Name Project Role(s) >160 Hours/Yr Larry Smarr Principal Investigator Yes Thomas A. DeFanti Co-Principal Investigator Yes Mark Ellisman Co-Principal Investigator Yes Jason Leigh Co-Principal Investigator Yes Philip Papadopoulos Co-Principal Investigator Yes 1.B. Other Senior Personnel Additional people who contributed to project, and received a salary, wage, stipend or other support from this grant:
Northwestern University (NU) Name Project Role(s) >160 Hours/Yr Joe Mambretti Senior Personnel Yes San Diego State University (SDSU) Name Project Role(s) >160 Hours/Yr Eric Frost Senior Personnel Yes John Ryan Graduate Student Yes Oraztach Atayeva Graduate Student Yes John Graham Professional staff Yes* * John Graham is an unfunded OptIPuter partner. Texas A&M University (TAMU) Name Project Role(s) >160 Hours/Yr Valerie Taylor Senior Personnel Yes Xingfu Wu Research Scientist Yes University of California Irvine (UCI) Name Project Role(s) >160 Hours/Yr Michael Goodrich Senior Personnel Yes Stephen Jenks Senior Personnel Yes Kane Kim Senior Personnel Yes Padhraic Smyth Senior Personnel Yes David Newman Professional staff Yes Lucas Scharenbroich Graduate student Yes Sung-Jin Kim Graduate student Yes University of California San Diego (UCSD) Name Project Role(s) >160 Hours/Yr Michael Bailey Senior Personnel No* Sheldon Brown Senior Personnel Yes Andrew Chien Senior Personnel Yes Aaron Chin Other Professional Yes Greg Hidley Senior Personnel Yes Sid Karin Senior Personnel Yes Mason Katz Other Professional Yes Debi Kilb Senior Personnel Yes David Lee Senior Personnel Yes Atul Nayak Senior Personnel Yes

The OptIPuter FY2005 Annual Progress Report and FY2006 Program Plan 6
John Orcutt Senior Personnel Yes Rozeanne Steckler Senior Personnel No* Huaxia Xia Graduate Student Yes Xinran (Ryan) Wu Graduate Student Yes Nut Taesombut Graduate Student Yes Frank Uyeda Graduate Student Yes * Steckler and Bailey left UCSD in May 2004 and are no longer on the OptIPuter project. University of Illinois at Chicago (UIC) Name Project Role(s) >160 Hours/Yr Maxine Brown Senior Personnel Yes Donna Cox (NCSA/UIUC) Senior Personnel Yes Robert Grossman Senior Personnel Yes Tom Moher Senior Personnel Yes Bob Patterson (NCSA/UIUC) Other Professional Yes Luc Renambot Senior Personnel/Postdoc Yes Oliver Yu Senior Personnel Yes Alan Verlo Senior Personnel Yes Michael Welge (NCSA/UIUC) Senior Personnel Yes Julieta Aguilera Graduate Student Yes Yunhong Gu Graduate Student Yes Eric He Graduate Student Yes Yijue Hou Graduate Student Yes Eleni Kostis Graduate Student Yes Anfei Li Graduate Student Yes Ming Liao Graduate Student Yes Hyeyun Park Graduate Student Yes Manuel Sanchez Graduate Student Yes Huan Xu Graduate Student Yes University of Southern California (USC) Name Project Role(s) >160 Hours/Yr Joe Bannister Senior Personnel Yes Robert Braden Senior Personnel No* Ted Faber Senior Personnel No* Aaron Falk Senior Personnel Yes Carl Kesselman Senior Personnel Yes Marcus Thiébaux Senior Personnel Yes Joe Touch Other Professional Yes Eric Coe Graduate Student Yes * Worked on OptIPuter from October 2002-October 2004. 1.C. Other Partner Organizations BigBangwidth <www.bigbangwidth.com> is the developer of the Lightpath Accelerator(TM), which automatically brings up to 10Gbps connections directly to high-performance devices by providing light paths between network hosts, such as workstations and servers, that are otherwise connected through a packet network. OptIPuter partner Chien is working with them to evaluate it, and is exploring different ways to integrate it into the OptIPuter infrastructure. Calient Networks <www.calient.net> is the developer of the DiamondWave(TM) Photonic 3D MEMS (Micro-Electro-Mechanical Systems) Switch used by OptIPuter teams. OptIPuter partner UIC/EVL purchased a 128-port Calient, located in Chicago (at StarLight), and a 64-port Calient, located in Amsterdam (at NetherLight), to switch lambdas.

The OptIPuter FY2005 Annual Progress Report and FY2006 Program Plan 7
CANARIE, the Canadian Network of the Advancement of Research, Industry and Education <www.canarie.ca/about/index.html> is working with the OptIPuter’s optical backplane group to explore application of its User Controlled Light Path (UCLP) software. Bill St. Arnaud, network director, has participated in OptIPuter backplane meetings. Chiaro Networks <www.chiaro.com> is an OptIPuter industrial partner. Steve Wallach, Vice President of Technology, is a member of the OptIPuter Frontier Advisory Board. The OptIPuter project at UCSD is centered on a Chiaro Enstara router. Glimmerglass Networks <www.glimmerglassnet.com> is the developer of the Reflexion(TM) 3D MEMS switch with a photonic multicasting option. OptIPuter partner UIC/EVL worked with Glimmerglass to develop the photonic multicast option. UCSD is now working with Glimmerglass on its NSF-funded Quartzite project. IBM <www.ibm.com> is an OptIPuter industrial partner. Alan Benner, a senior member of the IBM Systems Architecture and Performance Team within the IBM eServer group, participates in the OptIPuter project and is a member of the OptIPuter Frontier Advisory Board. IBM works with the UCSD National Center for Microscopy and Imaging Research (NCMIR) to utilize its T221 9-megapixel display for interactively visualizing large montage brain microscopy images. In 2003, the OptIPuter project acquired a 10-node graphics-intensive cluster, plus an experimental IBM Scalable Graphics Engine, and two more T221s for the Earth Sciences application work at UCSD Scripps Institution of Oceanography. In 2004, the OptIPuter project (Smarr, PI) submitted a proposal to the IBM Shared University Research (SUR) program and received a 48-node, 20-TB storage-intensive cluster. KISTI, the Korea Institute of Science and Technology Information <www.kisti.re.kr/kisti/english/index_english.jsp> is an OptIPuter international affiliate partner working on advanced visualization tools and techniques. Lucent Technologies <www.lucent.com> is a partner in an MRI proposal, called “Quartzite” that NSF recently recommended for funding (Papadopoulos, PI), and will provide the project with a novel Wavelength-Selective switch (WS-Switch), not yet commercially available. The OptIPuter assumes a bandwidth-rich world; Quartzite research assumes that campus backbone fiber carries multiple “stand-by” allocatable wavelengths (lambdas) in addition to the common shared and routed Internet traffic, which can be made available to data-intensive applications for on-demand capacity provisioning. NASA <http://www1.nasa.gov/home> sites NASA Ames Research Center, NASA Goddard Space Flight Center and Jet Propulsion Laboratory are OptIPuter affiliate partners, connecting to National LambdaRail and CAVEwave in order to do data-intensive Earth Science experiments with OptIPuter partner UCSD Scripps Institution of Oceanography (SIO). National Insitute of Advanced Industrial Science and Technology (AIST) of Japan’s Grid Technology Research Center (GTRC) <http://www.gtrc.aist.go.jp/en/> is an OptIPuter international affiliate partner working on advanced visualization tools and techniques. SARA Computing & Networking Services <http://www.sara.nl> is an OptIPuter international affiliate partner, bringing optical networking and visualization expertise to the OptIPuter. SARA hosts the SURFnet NetherLight facility, the sister facility to StarLight in Chicago. Together with UvA, they manage the Lighthouse network and computer research testbed. Sun Microsystems <www.sun.com> is working closely with UCSD to develop an OptIPuter compute cluster. In 2003, Sun donated a 128-node compute-intensive cluster for the UCSD OptIPuter testbed. Recently, NCMIR/UCSD installed the first Sun Opteron visualization cluster to run its BioWall tiled display. Telcordia Technologies, Inc. <www.telcordia.com> is an OptIPuter industrial partner. George Clapp, a senior member of the Telcordia Applied Research Team and an expert in optical control plane and networking for lambda networks, is a member of the OptIPuter Frontier Advisory Board.

The OptIPuter FY2005 Annual Progress Report and FY2006 Program Plan 8
University of Amsterdam (UvA) <www.science.uva.nl/~delaat/> is the OptIPuter’s first international affiliate partner, working with UIC colleagues to develop an optically switched OptIPuter node, connecting through StarLight. US Geological Survey (USGS) National Center for Earth Resources Observation and Science (EROS) <http://eros.usgs.gov/> archives data from land remote sensing satellite missions and conducts research in applications of this data as well. As an affiliate OptIPuter partner, USGS EROS works with team members on application, technology transfer and outreach activities. Brian Davis is the USGS liaison to the OptIPuter team.
1.D. Other Collaborators and Contacts CENIC <www.cenic.org>, the Corporation for Education Network Initiatives in California, hopes to provide the OptIPuter project team with either CalREN-HPR or National LambdaRail (NLR) networking, to enable participating universities in southern California to connect to one another, as well as team sites in Chicago. Centro de Investigación Cientifica y de Educación Superior de Ensenada (CICESE) <www.cicese.mx> in Baja California, Mexico, is a “sister” research facility to Scripps Institution of Oceanography. CUDI, the Mexican Research & Education network, is working with CENIC to put a 10Gbps link between UCSD/SIO and CICESE so they can have become an OptIPuter partner. National LambdaRail (NLR) <www.nlr.net> is a major initiative of US research universities and private sector technology companies to provide a national-scale infrastructure for research and experimentation in networking technologies and applications. Prior to CAVEwave, a EVL/UIC-purchased 10Gb wave on NLR, CEO Tom West was supportive of donating bandwidth to the OptIPuter project. In 2004, NLR had its first research booth at the Supercomputing (SC) conference, and OptIPuter was the only project invited to demonstrate its research efforts in the NLR booth. San Diego Telecom Council <www.sdtelecom.org>, a 300-member southern California telecom council, strongly endorses the OptIPuter efforts. Co-founder Franz Birkner is a member of the OptIPuter Frontier Advisory Board.

The OptIPuter FY2005 Annual Progress Report and FY2006 Program Plan 9
2. OptIPuter Activities and Findings 2.A. Research Activities Note: This annual report is for the period October 1, 2004 – September 30, 2005, but is being submitted to NSF in early August. Hence, the report covers activities that are planned through September.
2.A.1. OptIPuter’s Mission The OptIPuter Team’s mission is to enable scientists to explore very large remote data objects in a novel interactive and collaborative fashion, which would be impossible on today’s shared internet. We do this by developing a radical LambdaGrid architecture which shows great promise for enabling a number of this decade’s e-science shared information technology facilities. The research agenda involves the design, development and implementation of the OptIPuter – a tightly-integrated cluster of computational, storage and visualization resources, linked over parallel dedicated optical networks across campus, metro, national, and international scales. The OptIPuter will run over 1-10Gbps lambdas, with advanced middleware and network management tools and techniques to optimize transmissions so distance-dependent delays are the only major variable.
2.A.2. OptIPuter Research Metrics As an outcome of our Year 1 NSF Project Review, Reviewers suggested that we define 3-4 research topics to provide metrics for evaluating the success and impact of the project. The following four areas represent goals to help focus OptIPuter team research efforts in Year 2 and beyond.
• How do we control lambdas and how do protocols influence their utility? • How is a LambdaGrid different from a Grid in terms of middleware? • How can lambdas enhance collaboration? • How are applications quantitatively helped by LambdaGrids?
2.A.3. OptIPuter Milestone for Year 3 MILESTONE: By Year 3, the goal is to have operational OptIPuter testbeds on the campus, metro, regional, national and international levels, connecting OptIPuter partner sites in Southern California to Chicago by use of either TeraGrid or National LambdaRail and PacificWave. A full set of system software, visualization, data management and collaboration systems will be in place. Enhanced transport protocols to improve end-to-end performance will be demonstrated. Extensive monitoring and tuning of OptIPuter applications and middleware subcomponents will provide feedback for ongoing research efforts.
2.A.4. Network and Hardware Infrastructure Activities 2.A.4.a. General Network and Hardware Infrastructure Activities TESTBEDS…Four OptIPuter testbeds have been established. Each testbed differs in the types of clusters (compute, visualization and data) and networking connectivity that it supports. The goal is to integrate applications down to the lambdas on each of the testbeds. The testbeds and key contact people are:
• UCSD Campus (Phil Papadopoulos, Greg Hidley) • Metro Chicago (Joe Mambretti) • National via CAVEwave (Tom DeFanti) • International via SURFnet and Euro-Link/TransLight (Cees de Laat)
In the first two years of the OptIPuter project, testbeds primarily supported visualization clusters and high-resolution display technologies. In the third year, the testbeds were expanded to include distributed storage, with emphasis on storage clusters and high-speed transport protocols. The SoCal testbed, which has a large IBM storage cluster, measured data transfer rates between the IBM system and both SIO and NCMIR. Andrew Chien and Mark Ellisman worked together to establish data-transfer benchmarks among key BIRN sites (e.g., Johns Hopkins and UNC). (See Section 2.A.5.c.)
SOFTWARE DISTRIBUTION… The Rocks OptIPuter visualization “roll” was created and deployed this year to all Rocks users, as hundreds of downloads attest.1 Now, Phil Papadopoulos and his group are defining a common set of 1 Rocks had 42 downloads in November 2004; 28 in December 2004; 21 in January 2005; 20 in February; 17 downloads in each of March and

The OptIPuter FY2005 Annual Progress Report and FY2006 Program Plan 10
OptIPuter system software tools to be available on each testbed − the “OptIPuter Gold Standard Software Release,” to consist of the Distributed Virtual Computer (DVC), the Photonic Inter-domain Negotiator (PIN), the Group Transport Protocol (GTP) and the Composite Endpoint Protocol (CEP). The deadline date for porting software to testbed sites is by the end of August 2005. Papadopoulos’ team will track releases and version numbers.
TILED DISPLAY WALLS…To better display huge scientific datasets, OptIPuter partner EVL/UIC continues to design larger and larger display walls that are quickly being adopted by other partners. Last month, EVL/UIC “lit” LambdaVision, its 100-MegaPixel display, built with NSF MRI funds. Calit2 is building a second 100-MegaPixel display for its new building on the UCSD campus, which will go online in September. SIO/UCSD, as part of the USArray project of EarthScope, has a 17-Megapixel display in use that will soon be upgraded to a 50-Megapixel
LambdaVision 100-Megapixel display at EVL/UIC and Calit2@UCSD
HIPerWall 200-Megapixel display at Calit2@UCI
SIO/UCSD 17-Megapixel USArray Network Facility (ANF) SIO/UCSD 18-Megapixel IBM T221 displays
BioWall 30-Megapixel display at NCMIR/UCSD EVL/UIC 30-Megapixel display (shown at SC 2003)
April; 19 more in May; 105 downloads in June 2005; and, by mid-July, 27 downloads, all of which included the visualization roll.

The OptIPuter FY2005 Annual Progress Report and FY2006 Program Plan 11
display. The demand is coming from the application drivers, as scientists want to get a wholistic view of very high-resolution information. And, UCI (Kuester) built the HIPerWall (Highly Interactive Parallelized Display Wall), a 200-Megapixel display out of Apple computers and 30” monitors with NSF RI funds that is housed at the new Calit2 building on the UCI campus and available for OptIPuter use. This is all in addition to the ~30-Megapixel displays at EVL/UIC and NCMIR (the “BioWall”), and the 18-Megapixel IBM T221 display setup at SIO, among others! This year, we developed driver software, called Scalable Adaptive Graphics Environment (SAGE), that enables users to treat these large tiled display as a laptop screen, and display multiple windows with real-time flows (see Section 2.A.6.b).
2.A.4.b. UCSD Campus Testbed (includes SoCal OptIPuter sites) UCSD NETWORK INFRASTRUCTURE…Given planned equipment acquisitions, the following UCSD networking activities were accomplished this year. The larger goal is to integrate packet-based and circuit-based networking approaches to create a hybrid network.
• Purchased and installed campus fiber upgrades to new campus locations, notably the new Calit2 building and the JSOE (Engineering)/Calit2 Collaborative Visualization Center
• Transitioned to 10Gb infrastructure switched/routed infrastructure • Deployed a Cisco 6509 for 10GigE packet switching, connecting 500 nodes, grouped in clusters, on
campus. • Installed an O-O-O Glimmerglass all-optical switch and planned for installation of the Lucent (pre-
commercial) Wavelength Selective switch2 at the center of the campus (acquired with NSF Quartzite grant) • Began Dense Wave Division Multiplexing (DWDM) deployment, to extend optical paths around UCSD
and provide additional bandwidth in order to connect the latest virtual-reality and high-definition visualization resources (supported through the NSF Quartzite grant)
• 2:1 bisection will be in the campus fabric, but not until mid-Year 4 (early 2006).3
SOCAL NETWORK INFRASTRUCTURE…UCSD continues to work with its campus and CENIC to network all SoCal OptIPuter sites:
• CalREN-HPR connectivity among UCSD, UCI and USC/ISI OptIPuter sites was achieved in June 2004 at GigE speeds, and switch equipment has been installed
• The newly completed Calit2 buildings at UCSD and UCI are now linked to the OptIPuter LambdaGrid.
UCSD CLUSTER HARDWARE INFRASTRUCTURE…Based on our equipment acquisition plans, the following activities are in progress:
• Have “Mod 2” clusters (based on 64-bit IA64 and Opteron architectures) to OptIPuter sites (the NCMIR Sun Opteron visualization cluster has already been installed and is operational); 3x17-node clusters for computation plus a 30-node and a 10-node cluster for visualization and virtual reality support, respectively.
• Tested 10GigE NICs with NASA on the CAVEwave (single UDP-stream performance exceeded 5Gbps) • Deployed InfiniBand on 32 nodes. • All major campus sites are connected at 10GigE (3:1 campus bisection ratio3 has been achieved at NCMIR,
SIO, and SDSC, programmable through the Glimmerglass O-O-O switch). • Run the Rocks operating system on all OptIPuter “production” clusters.
With respect to Infiniband (IB), it was originally seen as a progressive 10Gb-class network that could be extended to the campus and metro areas. IB has remained a cluster-fabric interconnect only and has less relevance to the OptIPuter than originally believed. Two physical fabrics are deployed (4 nodes on our storage cluster, purchased with OptIPuter funds) and 32 nodes (donated) on an IA-32 cluster at SDSC. We continue to watch IB development (most issues are with vendor-supplied stacks) and will configure as needed for other research development.
2 This is UCSD’s first entrance into a lambda-switching core. 3 In the OptIPuter Cooperative Agreement, it states, “UIC and NU will work with UCSD to measure if a 2:1 local bisection bandwidth can be
achieved at the metro scale.” We’re almost there on the physical side. UCSD/NCMIR has ~40 nodes and we should be able to provision two 10Gb connections into the 6509 by year’s end (2:1). The same is true of the JSOE-based storage and compute clusters (3:1, or 2.5:1, if we just look at the storage cluster bisection). We have PVFS deployed; we are working on a Lustre deployment on the storage cluster. We want to see if existing storage systems can deliver 15-20Gb in parallel transfers. When we first installed the 10Gb ring on campus, it utilized 100% of the link bandwidth using 16-node-to-16-node parallel transfers on TTCP (completely synthetic load). The cheap switches have no problems aggregating multiple gigabit streams to 10Gb uplinks. The real question is whether we can utilize the bandwidth with non-synthetic loads.
The OptIPuter FY2005 Annual Progress Report and FY2006 Program Plan 12
OptIPuter nodes are now configured as a Condor Pool when not running in a dedicated mode. UCSD computer science professor Eleazar Eskin and his team have been using one of the 17-node Sun Opteron clusters to run thousands of iterations on genome datasets. Currently the models are not too complex, but the large number of iterations creates some development and storage challenges. The OptIPuter team is working with Eleazar to migrate his development to Condor to take advantage of more compute and storage resources. This should allow the team to eventually tackle more complex research challenges.4 UCI INFRSTRUCTURE…The UCI Scalable Parallel and Distributed Systems Lab (Jenks) has its cluster, running f Rocks 4.0.0, connected to OptIPuter/CalREN-HPR network testbed <http://spds.ece.uci.edu/%7esjenks>. The UCI Calit2 Center of GRAVITY (Graphics, Visualization and Imaging Technology) (Falko Kuester) has a 200-Megapixel HIPerWall also available for OptIPuter <http://gravity.calit2.uci.edu/~fkuester/>. It is created from 50 Apple 30" Cinema Displays (fully supported in networked configuration) with a total display resolution: 204,800,000 pixels. It is driven by 25-dual-processor Apple G5s, two tiles per node. It was used to visualize La Jolla one-foot resolution data from our OptIPuter partner at USGS. Originally, the data resolution was 25,740 x 8,580 pixels and is a composite of only three of the normal USGS tiles. Their next target is to view a much larger dataset in the range of 257,400 x 85,800, which will put us at 22-GigaPixels. The UCI Earth System Modeling Facility (ESMF) (Charlie Zender) has a high-performance computer cluster and storage system connected to the OptIPuter network at 1Gb <www.ess.uci.edu/esmf/index.html>. CALIT2 FACILITIES INFRASTRUCTURE…Two new Calit2 buildings came online during Year 3 of the OptIPuter project, a 215,000 sq. ft. facility at UCSD and a 120,000 sq. ft. facility at UCI. These facilities bring a combination of new visualization and collaborative environments as well as facilities for cluster systems. Of particular note are:
• Prototype of new technology for CAVEs of 4- and 6-wall variety • A 200-seat digital cinema theater with very-high-resolution research/projection capabilities • A 100-seat high-resolution stereo viewing facility • High Definition (HD) research and prosumer production capability • Interconnected HD collaborative conferencing facilities
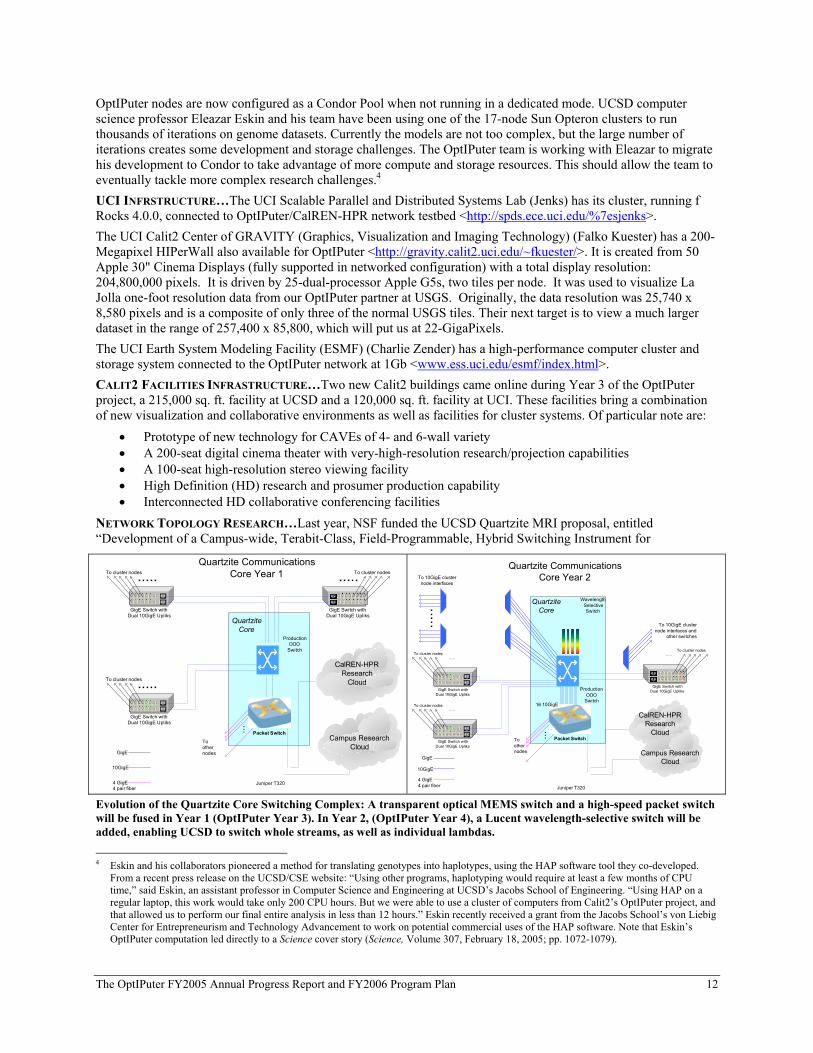
NETWORK TOPOLOGY RESEARCH…Last year, NSF funded the UCSD Quartzite MRI proposal, entitled “Development of a Campus-wide, Terabit-Class, Field-Programmable, Hybrid Switching Instrument for
Evolution of the Quartzite Core Switching Complex: A transparent optical MEMS switch and a high-speed packet switch will be fused in Year 1 (OptIPuter Year 3). In Year 2, (OptIPuter Year 4), a Lucent wavelength-selective switch will be added, enabling UCSD to switch whole streams, as well as individual lambdas.
4 Eskin and his collaborators pioneered a method for translating genotypes into haplotypes, using the HAP software tool they co-developed.
From a recent press release on the UCSD/CSE website: “Using other programs, haplotyping would require at least a few months of CPU time,” said Eskin, an assistant professor in Computer Science and Engineering at UCSD’s Jacobs School of Engineering. “Using HAP on a regular laptop, this work would take only 200 CPU hours. But we were able to use a cluster of computers from Calit2’s OptIPuter project, and that allowed us to perform our final entire analysis in less than 12 hours.” Eskin recently received a grant from the Jacobs School’s von Liebig Center for Entrepreneurism and Technology Advancement to work on potential commercial uses of the HAP software. Note that Eskin’s OptIPuter computation led directly to a Science cover story (Science, Volume 307, February 18, 2005; pp. 1072-1079).
QuartziteCore
CalREN-HPRResearch
Cloud
Campus ResearchCloud
GigE Switch withDual 10GigE Upliks
.....To cluster nodes
GigE Switch withDual 10GigE Upliks
.....To cluster nodes
GigE Switch withDual 10GigE Upliks
.....To cluster nodes
GigE
10GigE
...
Toothernodes
Quartzite CommunicationsCore Year 1
ProductionOOO
Switch
Juniper T3204 GigE4 pair fiber
Packet Switch
QuartziteCore
CalREN-HPRResearch
Cloud
Campus ResearchCloud
GigE Switch withDual 10GigE Upliks
.....To cluster nodes
GigE Switch withDual 10GigE Upliks
.....To cluster nodes
GigE Switch withDual 10GigE Upliks
.....To cluster nodes
GigE
10GigE
...Toothernodes
Quartzite CommunicationsCore Year 2
ProductionOOO
Switch
Juniper T320
4 GigE4 pair fiber
Wavelength Selective
Switch
To 10GigE clusternode interfaces
..... To 10GigE clusternode interfaces and
other switches
Packet Switch
16 10GigE

The OptIPuter FY2005 Annual Progress Report and FY2006 Program Plan 13
Comparative Studies of Optical Circuits, Packet Switching, and Network Topologies as Enablers for e-Science Applications.” NSF and campus funding of Quartzite’s optical core were used to purchase a Cisco Catalyst 6509 router/switch, and tightly couple it to the Glimmerglass all-optical MEMS switch, and then, next year, to an experimental wavelength-switchable device from Lucent. Because Quartzite will enable soft reconfiguration (from optical circuit to optical packet) of an endpoint, we will be able to better understand the where, how, and why of the packet vs. circuit architectural tradeoff, what protocols (both optical signaling and higher-level messaging) are effective, and how dynamic virtual collections of end-user cluster nodes at a campus scale can be knitted together with high-speed parallel networks to form an effective analysis platform for our biomedical and geoscience application drivers. This is the first time that the UCSD OptIPuter team has had a passive optical switch on its campus testbed. Two faculty members with extensive optical switch architecture experience, Joe Ford and Shaya Fainman, both members of the OptIPuter Frontier Advisory Board, have become more actively involved in the OptIPuter project because of Quartzite funding.
2.A.4.c. Metro Chicago Testbed
The most important physical updates to the Metro Chicago testbed infrastructure this year have been:
• ~17TB storage is now at StarLight, currently connected with 1GigE NICs, but can be upgraded to 10GigE • Using NSF MRI funding to UIC for AGAVE (“Access Grid Autostereo Virtual Environment”), as well as
State of Illinois match funds, UIC developed the 7x5 LCD tiled Varrier (virtual barrier-strip autostereography) cylindrical virtual-reality display system that enables 3D images to be viewed in a non-tethered, non-invasive tracking environment.
• Using NSF MRI funding to UIC for “LambdaVision,” as well as State match funds, UIC designed an 11x5 LCD tiled display powered by a 32-node Opteron cluster that will have 32 10GigE NICs (evaluation of
SL Force10
HDXc
UKLight Ciena
JGN II Procket
Abilene
2xOC-192to Amsterdam
IRNC and SURFnet
4xOC-192to Canada, Seattle,
Korea, Taiwan, NYC, Amsterdam, GLORIAD
OC-192 to London
OC-192 to Tokyo
24x10GE96x1GE
16-processor cluster
ESnet, NREN,NASA / GSFC NISN, DREN, USGS, etc.
GE ElectronicallySwitched
10GE ElectronicallySwitched/Routed
NortelLayer 1Switch
1
Clusters at EVL, LAC, StarLight , NU, NCSA
Nx10GE Nx1GE
StarLightGLIF
ExchangeJuly 2005
10GE
TeraGrid Juniper T 640
Nx10GENxOC-192
To NCSA/SDSCANL/ETF
10GE
MidWestMREN
DS-3 to Hong Kong/HARnet
10GE
OC-192 toCERN
Fermilab DWDM10GE
10GE
CalTech Juniper T 320
10GENx10GE, NxGEOC-3, DS-3
2xOC-192
OC-192
10GE, Nx1GE
4xOC-192
2xOC-192
Clusters at UCSDCalit2
10GE over CAVEWave/NLR
OC-192 Electronically
Switched
4
SINET OC-12 to Japan
NCSA
10GE over I-WIRE
ASNetOC-48 to Taiwan
2
DS-3 to China/CERnet
OMNInet
NxOC-192

The OptIPuter FY2005 Annual Progress Report and FY2006 Program Plan 14
10GigE NICs is underway, procurement to follow), whose processors are connected through a Glimmerglass switch. This 100-Megapixel display will display very-high-resolution 2D images.
• Using NSF Research Resources (RR) funds, UIC installed a 10GigE link between EVL and StarLight via I-WIRE Ciena DWDM gear
• UIC purchased a 10GigE link between StarLight and UCSD (the “CAVEwave”) via NLR5. • Cisco donated three large 6509s for CAVEwave usage (to be located in Chicago, Seattle and Los Angeles). • UIC upgraded the Force10 at StarLight and upgraded its 6509 switch/router at EVL. • A planning and design process was undertaken to enhance the metro-area optical testbed through the
provisioning of new fiber and four new optical switches (to be shipped to Chicago in July) that will allow for prototyping new capabilities and technologies – dark fiber has been purchased and new fiber builds have been undertaken to interlink UIC, StarLight, and a new site near the StarLight facility.
2.A.4.d. National Testbed (via CAVEwave) UIC procured a persistent 10GigE connection from StarLight in Chicago to the University of Washington in Seattle and UCSD in San Diego via its own private wavelength on the NLR infrastructure. Called “CAVEwave,” this link is dedicated to networking research and development. The CAVEwave is also available to transport experimental traffic between Federal agencies, international research centers, and corporate research projects that bring 1-10GigE wavelengths to Chicago, Seattle, and San Diego. CAVEwave can be used to prototype and measure applications that can be moved to production later on, mitigating the risk of early adoption by mission critical users. Its primary use, however, is OptIPuter development between partner sites in Chicago (UIC, NU) and San Diego.
Note: CAVE® is UIC/EVL’s virtual-reality room invention, which was successfully licensed for commercialization. The CAVEwave is so named because funds derived from this licensing were spent to procure this 10Gb wavelength.
OptIPuter international affiliate partners UvA and SARA in The Netherlands, Japan’s National Institute of Advanced Industrial Science and Technology (AIST)’s Grid Technology Research Center (GTRC) and the Korea Institute of Science and Technology Information (KISTI) can connect to CAVEwave to conduct experiments. Japan has a 10Gb JCN2 circuit from Tokyo to Chicago. Korea has a 10Gb circuit to Seattle.
CAVEWAVE AND NASA ACTIVITIES… NASA, a new OptIPuter partner, is currently using CAVEwave to
5 UCSD and UIC, with help from the PNGWP, NASA Goddard and Argonne National Laboratory, spent a long time in a huge engineering and
testing effort to get better performance over the 10GigE CAVEwave, but we are on schedule nevertheless.

The OptIPuter FY2005 Annual Progress Report and FY2006 Program Plan 15
prototype its OptIPuter work between NASA Goddard Space Flight Center (GSFC) and UCSD/SIO. Meanwhile, NASA GSFC purchased a 10Gb link from NLR (connectivity is imminent), to go from McLean, Virginia to Chicago, where they connect to CAVEwave. NASA GSFC was granted early connectivity to NLR, making it one of NLR’s first 10 users, largely due to GSFC’s partnering with the OptIPuter project. In early November 2004, for SC 2004 OptIPuter demos in NLR’s booth, GSFC set up a Force10 E300 10GigE switch/router and two 10GigE NIC-connected workstations at the NLR/Level3 facility in McLean, VA, to stream selected Earth science data in real time to a multi-tiled visualization station set up in the NLR booth. With additional OptIPuter support, GSFC had its data hosted at Chicago, San Diego and Amsterdam and similarly streamed in real time to SC04. See NASA Technical Brief at: <http://cisto.gsfc.nasa.gov/L-Netpdfs/L-Net_NLR_TechBrief.pdf>
GSFC was allowed to stay connected to the NLR at McLean until its 10Gb NLR lambda is provisioned between McLean and Chicago/StarLight, which is in process, with a big demo planned for August 8. In Chicago, it will be connected to CAVEwave. This will enable the first coast-to-coast user-driven data flows across the NLR.
GSFC deployed 10GigE NIC-connected workstations to UCSD and StarLight, and assisted OptIPuter engineers to do useful performance tests of the 10Gb connection between GSFC (at McLean), UIC and UCSD, and between UIC and UCSD. TCP produced rates from 1-5 Gbps, but was unstable; UDP consistently produced rates on the order of 5Gb. More testing will take place in the coming year.
2.A.4.e. International Testbed (via SURFnet and TransLight) Currently SURFnet has a 10Gb link from its NetherLight facility in Amsterdam to StarLight in Chicago. UIC, with NSF IRNC “TransLight” funding, has a 10Gb link between StarLight and NetherLight, operational since July 1, that is managed as a L1/L2 circuit. The IRNC link is primarily for production science, though it can be used for some OptIPuter/computer science development. The SURFnet link is dedicated to research and development. Note: SURFnet and the NSF IRNC TransLight initiative each have an additional 10Gb between Amsterdam and the MAN LAN facility in New York.
Dutch OptIPuter partners SARA and University of Amsterdam (UvA) recently created the experimental “Lighthouse” facility, which is networked to NetherLight at 16Gb. It contains a tiled display connected to an Opteron cluster with 20TB of storage, a Force10, and a 64x64 Glimmerglass optical switch.
2.A.4.f. Optical Signaling, Control and Management The OptIPuter’s uniqueness is that the network connecting distributed OptIPuter clusters and instruments is treated as a backplane, not a network. The OptIPuter’s optical-signaling control and management tools are creating an integrated distributed fabric that’s flexible, dynamic and deterministic. Flexible means different things to different people. Telcos have networks for audio, video and text. The OptIPuter readily adapts to new data objects and data communication services, so therefore it is much more scalable than traditional infrastructure.
The 3rd OptIPuter Backplane (a.k.a. Network) Architecture Workshop was held January 25, 2005. Outcomes were:
• Create a persistent reliable flexible infrastructure for applications • Create new types of control and management planes • Use the Rocks distribution system • Develop measurement/instrumentation capabilities
The Year 3 testbed consists of UIC, NU and UvA, and OMNInet/StarLight/NetherLight optical backplane domains accessed by GigE clusters. We distributed the prototype Photonic Inter-domain Negotiator (PIN) optical signaling and control software to selected sites. This software includes a common communications mechanism, an access control policy mechanism based on the IETF AAA standard, and mechanisms to allow control of optical switches within and across domains. UvA’s policy-based AAA mechanism is used to provide user authentication and service authorization. Local domains specify domain-specific light-path provisioning policies, while PIN specifies inter-domain light-path provisioning policies. Each domain is being configured with an AAA server and an associated local-domain control-plane module that acts as an AAA client. (UIC/EVL has developed the Photonic Domain Controller [PDC], NU has developed ODIN, and UvA has developed BOD.) The PIN/AAA mechanism interoperates the three OMNInet/StarLight/NetherLight optical network domains via secure policy-based interactions, and will enable applications to control secure on-demand light-path provisioning across these domains. Experiments and tests have been conducted using this prototype PIN/AAA software.

The OptIPuter FY2005 Annual Progress Report and FY2006 Program Plan 16
OC-192StarLight
OMNInetAll-optical MAN
UICAll-optical LAN
Cluster
Cluster
Cluster
(Chicago)
NetherLight(Amsterdam)
UvAAll-optical LAN
AAA
PIN
PDC
AAA
PIN
BOD
AAA
PIN
ODIN
OC-192
Data Link
Signaling Link
We are focused on the following research activities:
• Efficient and robust inter-domain light-path reservation signaling and routing protocols for PIN. • Advance scheduling, policy-based provisioning controls at the local-domain and inter-domain levels. • Integration of PIN signaling control with Quanta middleware to enable LambdaGrid monitoring and
adaptive control of optical network resources. • Further testing of the integration of reservation/routing protocols with access control methods, e.g., AAA • Further experiments with light-path control and management tools • Designing and developing methods for common resource identification • Resource monitoring • Process analysis and reporting
Year 3 Multi-Domain Testbed
2.A.5. Software Architecture Research Activities 2.A.5.a. System Software Architecture The OptIPuter proposal was written in 2002. Since then, the terminology for system software has evolved as our understanding of application requirements, our development of new computer science tools and techniques, and our awareness of new commercial product offerings has progressed. In the proposal, we used the term LambdaGrid Middleware Architecture (LGMA) to refer to the overall OptIPuter System Software Architecture, as depicted in thediagram below. Today, we call it the Distributed Virtual Computer (DVC).
The OptIPuter System Software Architecture Team continues to make progress developing new component technologies, as well as integrating them together to demonstrate their collective and synergistic utility in large-scale demonstrations. These demonstrations continue to increase in scope (physical network extent, range of functionality, number of system software technologies included and types of applications). Rapid progress culminated in a successful demonstration of a range of integrated system software technologies and applications at the January 2005 All-Hands Meeting; for a brief description <www.OptIPuter.net/news/release_temp.php?id=20>. In the remainder of Year 3, we expect larger-scale demonstrations that integrate a larger collection of OptIPuter system software while enabling geoscience and biomedical applications.
The OptIPuter system software architecture uses the concept of a DVC to integrate a wide range of unique OptIPuter component technologies (high-speed transport protocols, dynamic optical-network configurations, real-time, and visualization packages) with externally developed technologies (Globus grid resource management services and security infrastructure) that are increasingly being adopted in the grid community. A key benefit to applications includes control of a distributed resource abstraction, which includes network configuration, grid resource selection, and a simple uniform set of APIs for communication. For OptIPuter tools and technology development, it enables large-scale, flexible experimentation with a wide range of application configurations, enabling better evaluation and more rapid research progress. In short, the DVC is the unifying abstraction for applications on the LambdaGrid, and

The OptIPuter FY2005 Annual Progress Report and FY2006 Program Plan 17
embodies a model of use that treats the network as a first-class resource.
This year we have continued to develop our DVC concept and implementation, working to demonstrate how it can integrate disparate grid and OptIPuter technologies and present them simply to applications. We are still learning how to efficiently construct a DVC to meet a specification and how to efficiently integrate novel communications and storage capabilities, among other things. Integrating a wide range of transport protocols, optical signaling technologies, and revisions of grid technologies will continue, and will be demonstrated on large-scale applications and testbeds, and of course at higher levels of capability. This year, at iGrid 2005, we plan to show how our overall system architecture enables all five layers of OptIPuter research on the OptIPuter testbeds: the applications, visualization and data toolkits, DVC, transport protocols, and optical network configuration.
OptIPuter System Software Architecture
2.A.5.b. Real-Time Capabilities We continue to develop the concept of a real-time Distributed Virtual Computer (RT-DVC), leveraging the controllable communication capabilities possible with dedicated lambdas (low jitter, high bandwidth). This effort is based on the proven TMO (time-triggered messages and objects) system for node resource scheduling and extends communication scheduling from LAN to DVC frameworks. Top-level resource management and allocation schemes to make RT-DVCs work within the OptIPuter infrastructure have been designed. This approach exploits the dedicated lambdas provided by OptIPuter to support wide-area, low-jitter networking. When combined with real-time campus network switches (such as Time-Triggered Ethernet switches) and TMO management of LAN nodes/clusters, a wide-area end-to-end real-time DVC is realizable.
We adapted the TMOSM subsystem to the Linux-based OptIPuter node at UCI (currently, the cluster built in UCI EECS [Jenks]). Linux TMOSM behaves very similarly to the Windows version on uni-processor nodes. We are still experimenting with the behavior on dual-processor nodes. In addition, some security issues may need to be addressed before widespread deployment, but they will not affect interim demonstrations. We will implement and experiment with the intra-RT-DVC Resource Management (IRDRM) middleware subsystem responsible for allocating the resources within a DVC. We will develop a real-time application demo running on the OptIPuter node at UCI tied with remote resources, such as the NCMIR instruments at UCSD.

The OptIPuter FY2005 Annual Progress Report and FY2006 Program Plan 18
2.A.5.c. Data Storage We developed a simulation to explore the capabilities of Low-Density Parity Check (LDPC) codes to improve performance and support robust access performance of distributed storage. We developed and demonstrated optimized LDPC code implementations that support high-speed encoding and decoding at speeds over 200MB/ second, enabling their practical use in network-attached storage systems with GigE networks. We completed a high-level design and simulation of a novel file system called RobuSTore, which exploits the redundancy in erasure codes to support both low variation in access time and high bandwidth. This simulation shows performance improvements of up to 15-times the bandwidth and a 5-times reduction in access latency variability with modest use of replication. Based on the promise of these results, we will explore a file system implementation that embodies these ideas for further experiments and for demonstrations with applications. (Results are mentioned in Secftion 2.B.2.c).
2.A.5.d. Security ISI/USC’s (Bannister, Touch) networking efforts, new activities on robust, secure protocols, were initiated and XCP prototyping was phased out onto other development projects. However, XCP topics that are specific to the OptIPuter are still under consideration. We wrote an Internet Draft “Defending TCP Against Spoofing Attacks” (February 2005) that was adopted as a deliverable for the IETF TCP Minor Modifications (TCPM) Working Group (updated and reissued in May 2005). The document summarizes the heightened likelihood of a successful sequence number attack on a TCP connection when high-link speeds cause the sequence number space to turn over rapidly during the attack timeframe and admit the possibility of a reset catching the connection at a particularly inopportune point. This is a potentially disastrous vulnerability for high-performance networked computing systems. Details are found in draft-ietf-tcpm-tcp-antispoof-00.txt, February 2005, and draft-ietf-tcpm-tcp-antispoof-01.txt, April. 2005.
ISI/USC created a mailing list at <www.postel.org/triage> to address issues of DOS attacks based on the CPU cost of deploying IPsec. IPsec is the ubiquitous security protocol for the network layer of the Internet, but some are hesitant to deploy it because attackers can overwhelm CPU resources at receivers just by sending junk. Triage examines ways to avoid such overload using layered defenses; an Internet Draft describing the problem and potential solutions is being prepared for the Paris IETF meeting. Details are found in “Variable Effort, Variable Certainty Triage for IPsec” (draft-touch-ipsec-triage-00.txt) to be presented at the IETF meeting in France, July 31-August 5, 2005.
ISI/USC began developing the architecture for FastSec and conducting performance experiments to demonstrate the need for low-latency microblock ciphers to avoid full packet latencies during packet-based encryption. This step is critical to achieving high performance when applications require secure data transfer. We also began examining ways to adapt the X-Bone virtual network overlay deployment system to lambda management.
UCI (Goodrich) is developing innovative cryptographic protocols for fast, practical group communication. To support high-performance security, we are analyzing the throughput and latency of existing Internet Network layer security. In the future, we will explore extensions of both Internet Network layer security and Internet Transport Layer security for high-performance, low-latency in OptIPuter networks. We will extend Grid security to contexts involving computations performed by untrusted grid members as well as data storage solutions in such environments. Investigators are also developing methods for authenticating network infrastructure messages in both wired and wireless contexts.
NU/UvA/UIC are pursuing a hierarchical approach to security over lambda networks, leveraging UvA’s AAA work at the network configuration level (see Section 2.A.4.e), and the Globus Security Infrastructure (GSI) at the application and middleware level. From an architectural viewpoint, AAA is being used to establish trust at the network layer. GSI, which Chien is using, works at the applications layer to instantiate processes being used. There is also the web services layer (WSRF). AAA is well matched to manage the inter-organization trust establishment and authorization, achieving network level trust. Atop that, GSI supports establishment of trust amongst a group of processes and the authentication and authorization needed for a user-level application to use the computing and networking resources required to achieve its goals.
In addition, NU/UvA/UIC are involved in two iGrid demonstrations that may lead to further research. UvA (de Laat) is investigating token-based access to computational resources over multiple domains, where the token is part of the data stream and checked at wire speed by switches and routers along the path. NU and UIC (Mambretti, DeFanti and Leigh) are working with Nortel Networks researcher Kim Roberts, who has developed a commercial-grade encryption and switching system that performs at 10Gb speeds.

The OptIPuter FY2005 Annual Progress Report and FY2006 Program Plan 19
2.A.5.e. End-to-End Performance Modeling Building on efforts to instrument and study the behavior of a Vol-a-Tile visualization application on a cluster at TAMU using the Prophesy system, TAMU soon plans to begin characterizing the performance of Vol-a-Tile visualization applications over the CAVEwave testbed. Instrumented SIO and BIRN applications will be characterized with respect to their compute, memory, storage, and communication behavior. Based on this performance evaluation, TAMU will work with the UIC/EVL team to redesign Vol-a-Tile for higher performance and scalability.
To enable OptIPuter researchers to obtain a full view of end-to-end performance (e.g. graphics, network, memory, storage) in OptIPuter applications, UIC installed a GPS synchronized NTP server to ensure all captured data is accurately time-stamped based on a global clock.
UIC adopted the NetLogger format to report measurement data and developed a database schema to archive and query this data. The Scalable Adaptive Graphics Environment (SAGE) provides performance data (frame rate and bandwidth utilization) through this scheme as well as produces real-time visualizations of the data during application run-time.
2.A.5.f. High-Performance Transport Protocols We are continuing to bring together a diverse set of protocols under the Globus XIO framework, enabling applications to access the entire suite of OptIPuter high-speed transport protocols through a single communication interface. In Year 3, we incorporated the UCSD (Chien) Group Transport Protocol (GTP), the UIC (Grossman) UDP Data Transport (UDT), and interfaces to the UCSD (Chien) Composite Endpoint Protocol (CEP). UIC (Leigh, Renambot) Reliable Blast UDP (RBUDP) has been replaced by LambdaStream, and further testing is needed before integration with the XIO framework6.
Extensive testing of LambdaStream is being conducted among Chicago, San Diego and Amsterdam. Integration of LambdaStream into one or more OptIPuter applications, such as TeraVision, JuxtaView and Vol-a-Tile, is underway. UDT development is focusing on a flexible framework to prototype and experiment with new protocols.
LAC/UIC (Grossman) continues to develop SOAP*, a high-performance web services API for working with large and distributed datasets. It has an XML interface that provides users with a web interface to perform database joins at high speeds using UDT, a reliable UDP-based transport protocol.
UCSD (Chien) has continued work on the GTP high-speed transport protocol. GTP is designed to manage receiver contention efficiently by exploiting information across multiple flows at the receiver. Such receiver contention is expected to be a critical issue in networks with high-speed optical cores. As planned, we produced an initial release of the GTP implementation to the OptIPuter team as part of the OptIPuter “Gold Roll” for iGrid. We made rapid progress on formal stability proofs and simulations of GTP protocol dynamics, and have good results that show the protocol converges rapidly and consistently to max-min fair-rate allocations for networks with up to thousands of nodes and with a variety of round-trip times.
If terabit networks are to be useful, we must be able to create flows that are faster than individual machines. To this end, UCSD (Chien) has been developing a new Composite Endpoint Protocol (CEP) that coordinates a set of hosts into a composite endpoint and efficiently creates a high-speed flow. We designed a statically controlled version of CEP and demonstrated efficient aggregation across heterogeneous resources, efficient aggregation to a large number of resources (45 sender nodes), high absolute performance (32Gbps), and efficient exploitation of data access freedom. In the coming year, we will explore dynamic versions, with provably good dynamic coordination and scheduling techniques across M-to-N communication structures, heterogeneous clusters and networks.
2.A.6. Data, Visualization and Collaboration Research Activities 2.A.6.a. Data and Data Mining Research UIC (Grossman) has continued to develop specialized high-performance web services for exploring, analyzing, and mining data on LambdaGrids. In particular, focus was on (a) scaling high-performance web services to 5Gbps+; (b)
6 It should be noted that other grants help fund the research and development of protocols SABUL/UDT, RBUDP and LambdaStream;
OptIPuter funding is being used in part to tailor these protocols to bioscience and geoscience application drivers and to integrate them into the OptIPuter’s networking and cluster infrastructure.

The OptIPuter FY2005 Annual Progress Report and FY2006 Program Plan 20
optimizing the end-to-end performance of LambdaGrid applications – from disk to optical path to disk; (c) developing algorithms for integrating data that flows from multiple lambda streams (such as the lambda-merge application developed in Years 1 and 2); (d) developing LambdaGrid applications requiring continuous, real-time processing of distributed data originating from multiple streams; and, (e) performing experimental studies using application data in order to improve the performance of LambdaGrid services.
UCI (Smyth) extended the offline “batch” geoscience and brain imaging data clustering and analysis algorithms developed in Years 1 and 2 to an online framework where data is assumed to arrive in a continuous stream (e.g., over lambdas). Theoretical foundations and principles of such algorithms have been developed and initial results have been obtained for online clustering of real spatio-temporal data (MODIS remote-sensing data) where the actual streaming of the data is simulated.
UCI (Smyth) has also developed new data-mining algorithms for large-scale spatio-temporal data in two different application areas: (a) analysis of multi-site fMRI brain datasets, and (b) clustering and prediction of climate-related remote-sensing data. For the fMRI part of the project, UCI extended the work started in Year 2 (in collaboration with the fBIRN project at UCI and UCSD (Steven Potkin and Greg Brown) on algorithms that can optimally combine and compare fMRI brain datasets from different sites. New algorithms for feature-based analysis of fMRI data were developed and validated on a large archive of multi-site fMRI human brain images. UCI has also developed a preliminary demonstration of large fMRI human brain datasets visualized on a multi-tiled display in collaboration with Falko Kuester (UCI), work that is co-funded by a recent NIH grant and an NSF award for visualization research to Kuester.
For the second application area (geoscience/remote-sensing), UCI (Smyth) continues collaborations with geoscientists Andrew Robertson and Suzana Camargo at the International Research Institute (IRI) for Climate Prediction at Columbia University, and with geographer Mark Friedl (Boston University). With Robertson and Camargo, UCI has applied the trajectory clustering algorithms developed in Years 1 and 2 to analyze 30 years of historical data of tropical cyclone paths in the Pacific. With Friedl, UCI has obtained preliminary results on new algorithms for modeling global spatio-temporal vegetation changes using MODIS TERRA and GIMS remote-sensing satellite data. UCI has also developed a prototype interactive visualization of such remote-sensing data on a multi-tiled display in collaboration with Kuester’s group.
UCI (Smyth) has also begun testing these clustering algorithms and visualization components over the SoCal OptIPuter network by (a) connecting a 10-node Linux cluster and 3 x 3 multi-tiled display to the OptIPuter network in the new UCI Calit2 building and (b) remotely storing and accessing large remote-sensing archives using remote OptIPuter data storage at UCSD/SDSC and at UIC.
Brian Davis of USGS National Center for Earth Resources Observation and Science (EROS), an OptIPuter affiliate partner, is building a 64-bit OptIPuter cluster connected to a 2x2 tiled display that will use JuxtaView to view high-resolution LandSat, land fire and aerial photographs. EROS has transferred aerial photographs covering San Diego to San Francisco at 0.3m resolution to the OptIPuter data cluster at StarLight in Chicago. This creates a high-bandwidth access point for other OptIPuter collaborators. NCSA and UCI will retrieve copies of the data for their use. In particular, NCSA will attempt to place a copy of the entire dataset in the 3TB core memory of their 1024-processor Altix system to allow faster-than-disk access of the images by remote OptIPuter visualization nodes.
2.A.6.b. Visualization/Collaboration Tools Based on experiences in Years 1 and 2, UIC (Leigh, Renambot) have architected the next generation of OptIPuter-based visualization tools. The Scalable Adaptive Graphics Environment (SAGE) <www.evl.uic.edu/cavern/sage> combines hardware-based, real-time, multi-resolution, view-dependent rendering techniques with software-based high-resolution rendering in a seamless manner that scales with the abilities of the computer hardware, the resolution of the display screens, and the size of the data. Particular attention was given to supporting real-time visualization of time-varying datasets that are potentially distributed at remote sites.
UIC has also developed and deployed LambdaCam <www.evl.uic.edu/cavern/lambdacam>, a tool that provides a snapshot of all currently existing OptIPuter tiled displays − a useful tool for debugging OptIPuter visualization applications from a distance.

The OptIPuter FY2005 Annual Progress Report and FY2006 Program Plan 21
All the OptIPuter’s concurrent visualization, collaboration and data research efforts fit into the SAGE architecture, to bring the network endpoints into the labs of OptIPuter domain scientists.
USC (Thiébaux) demonstrated the Graphics Visualization Utility (GVU) distributed visualization infrastructure on the OptIPuter testbed at the SC 2004 conference. The USC Southern California Earthquake Center (SCEC) TeraShake dataset, initially 44TB of time-series volumes, was reduced to a representative 39GB in order to cope with available space, resource and time constraints for the event. The data was staged in small pieces across clusters in San Diego, Los Angeles, and Chicago, and displayed on a modest workstation in Pittsburgh. The data was rendered in stereo on a GeoWall (one screen) system. This effort shows how large-scale pipelines can be driven as interactive sessions, capable of filtering through large amounts of data that would otherwise require batch transfer and offline rendering. The GVU browser interface has been enhanced to include simple movie choreography scripting, and geometric overlays with hierarchical modeling, which have proven useful for sharing results within the earthquake research community. Also, the quality of browsing experience has been enhanced with tunable jitter-buffer controls and onscreen data-flow feedback.
2.A.6.c. Volume Visualization Tools UIC (Leigh, Renambot) is developing the next-generation Vol-a-Tile (called Ethereon) based on SAGE. From the past two years of experience with Vol-a-Tile and JuxtaView, we believe both these applications can be combined into one – providing a much richer visualization environment for geoscientists and bioscientists.
The Ethereon software currently displays, and enables the user to navigate through, multiple, manually collated 2D microscopy datasets and 2D slices from volumetric microscopy datasets side-by-side within the SAGE framework. OptiStore-2, the next generation of the OptiStore data storage server, provides Ethereon with access to local and remote data stores through a set of simple requests. OptiStore-2 interfaces with LambdaRAM to provide low-level data access and pre-fetching and caching of data across networks. Ethereon currently interfaces with OptiStore-2’s 2D API for accessing 2D datasets.
USC (Thiébaux) has been improving the specification of remote filters so that scientists can easily substitute domain-specific feature analysis techniques, such as divergence and curl filters, into a scaled pipeline. The GVU task-processing module, which interprets a real-time command stream and executes appropriate filters on demand,

The OptIPuter FY2005 Annual Progress Report and FY2006 Program Plan 22
has been redesigned for increased generality, as well as for running the browser in single-process mode for session testing and set-up. These developments will enhance the usefulness of the GVU model for high-bandwidth browsing of data in specialized simulation domains. Also, it will allow the substitution of built-in filters with established filter modules, such as the VTK iso-surface filter. Collaborative efforts with the USC Southern California Earthquake Center (SCEC) have indicated the importance of simultaneous visualizations of independent volume data fields, which will push the perceptual limits of multivariate visualization techniques developed for two dimensions. To encourage increased familiarity with the interface, so more end-user feedback can be gained and applied to the system design and documentation, the GVU browser has been adapted to run locally in a scientist’s light-weight laptop environment. Furthermore, the browser has been partially adapted to run in a cluster-based CAVE environment that drives UIC/EVL’s Varrier auto-stereo display. This effort will inform the design of full tiled-display pipelines, including the IBM T221, and a 4x2 tiled LCD display recently assembled at ISI.
2.A.6.d. Visualization and Data Analysis Development The NCSA/UIUC CyberServices Architecture team (co-leaders Donna Cox and Michael Welge) includes data analysis and visualization. NCSA is developing a data analysis and visualization workflow environment that will provide advanced data and visualization application-centric services within a web-services architecture. This cyberservices paradigm is a focus of the NSF-funded Laboratory for the Ocean Observatory Knowledge INtegration Grid (LOOKING) project, in which Smarr, Cox and other OptIPuter partners participate. LOOKING is interested in the OptIPuter as an enabling cyberinfrastructure for ocean science; alternatively, the OptIPuter is interested in incorporating web and grid services, and prototyping real-time interactive ocean observatories <www.lookingtosea.org>.
NCSA/UIUC procured OptIPuter equipment and recently finished installation. The data analysis and visualization efforts include creating a coordinated design plan with other members of the OptIPuter data and visualization team. This plan involves using OptIPuter for stream analysis and interactive visualization.
Several high-resolution visualizations of oceanographic and other scientific visualization data have been developed. One in particular consisted of a single simulation time step of a simulation of stratified fluid flow (developed by SIO computational oceanographer Kraig Winters.) The result was a stereoscopic high-definition (2x1920x1080) animated sequence of the simulation.
2.A.6.e. Photonic Multicasting Non-photonic multicasting of streams of at least 1Gbps was attempted among UIC, UCSD, NCSA, ANL, TRECC, StarLight and UvA to understand the issues in supporting multicasting at these data rates. Local-area photonic multicasting using 10Gb streams is being examined in collaboration with Los Alamos National Laboratory and Chelsio Communications.
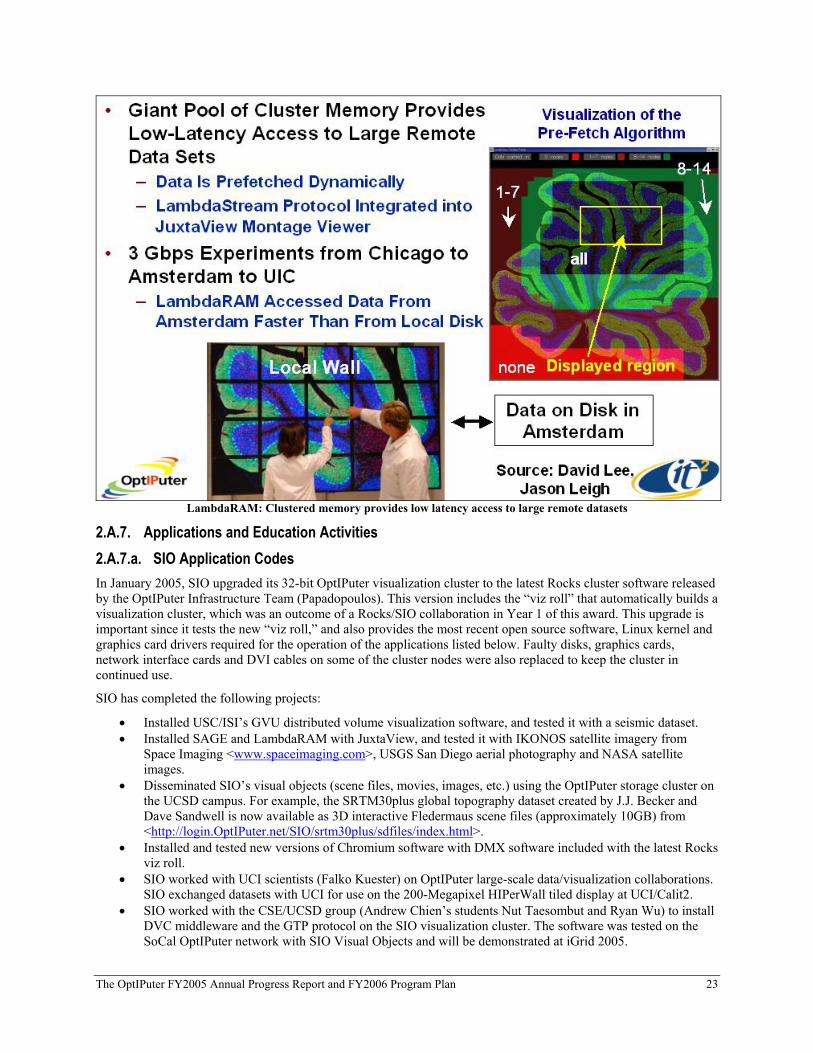
2.A.6.f. LambdaRAM A working prototype of LambdaRAM has been developed <www.evl.uic.edu/cavern/OptIPuter/lambdaram.html>. LambdaRAM allows multiple OptIPuter clusters at remote sites to participate in a single memory mapping. A variety of application-based prefetching schemes have been implemented and tested to continue to lower the latency associated with access to remote datasets.
The OptIPuter FY2005 Annual Progress Report and FY2006 Program Plan 23
LambdaRAM: Clustered memory provides low latency access to large remote datasets
2.A.7. Applications and Education Activities 2.A.7.a. SIO Application Codes In January 2005, SIO upgraded its 32-bit OptIPuter visualization cluster to the latest Rocks cluster software released by the OptIPuter Infrastructure Team (Papadopoulos). This version includes the “viz roll” that automatically builds a visualization cluster, which was an outcome of a Rocks/SIO collaboration in Year 1 of this award. This upgrade is important since it tests the new “viz roll,” and also provides the most recent open source software, Linux kernel and graphics card drivers required for the operation of the applications listed below. Faulty disks, graphics cards, network interface cards and DVI cables on some of the cluster nodes were also replaced to keep the cluster in continued use.
SIO has completed the following projects:
• Installed USC/ISI’s GVU distributed volume visualization software, and tested it with a seismic dataset. • Installed SAGE and LambdaRAM with JuxtaView, and tested it with IKONOS satellite imagery from
Space Imaging <www.spaceimaging.com>, USGS San Diego aerial photography and NASA satellite images.
• Disseminated SIO’s visual objects (scene files, movies, images, etc.) using the OptIPuter storage cluster on the UCSD campus. For example, the SRTM30plus global topography dataset created by J.J. Becker and Dave Sandwell is now available as 3D interactive Fledermaus scene files (approximately 10GB) from <http://login.OptIPuter.net/SIO/srtm30plus/sdfiles/index.html>.
• Installed and tested new versions of Chromium software with DMX software included with the latest Rocks viz roll.
• SIO worked with UCI scientists (Falko Kuester) on OptIPuter large-scale data/visualization collaborations. SIO exchanged datasets with UCI for use on the 200-Megapixel HIPerWall tiled display at UCI/Calit2.
• SIO worked with the CSE/UCSD group (Andrew Chien’s students Nut Taesombut and Ryan Wu) to install DVC middleware and the GTP protocol on the SIO visualization cluster. The software was tested on the SoCal OptIPuter network with SIO Visual Objects and will be demonstrated at iGrid 2005.

The OptIPuter FY2005 Annual Progress Report and FY2006 Program Plan 24
• Installed LambdaCam on the SIO cluster to allow the OptIPuter middleware and viz groups to remotely debug applications. See <http://igppviz.OptIPuter.net:5921/index.html> (password required).
• Continuing development of software tools to assist in data exploration, including: − The ‘DIP’ Project − DIP takes an earthquake’s location (latitude, longitude, depth) and fault
orientation (strike, dip, rake), and auto-generates a 3D interactive iView3D scene file with small rectangles oriented to reflect each individual earthquake fault’s position and orientation. Current tests use data from the Northern California Earthquake Data Center (NCEDC) focal mechanism catalogues (>50,000 data values), and the application will be extended to use EarthScope data as soon as the appropriate catalogues are available. Additional features will be added: subset faults of specified orientations, scale fault size by magnitude, etc. This project will be demonstrated at iGrid 2005.
− Seismic tomography juxtaposed with indicators of regional stress orientations based on moment tensor solutions, along with topography and seismicity.
− Projects related to the 3rd annual SIO Graduate students competition <www.siovizcenter.ucsd.edu/news_events/comp2004/results.html>
− Development of 3D interactive visualizations pertaining to real-time response to significant global or local earthquakes <www.siovizcenter.ucsd.edu/library/objects/index.php>.
A new Mac OS X G5-based visualization cluster was constructed at SIO’s Array Network Facility (ANF). The ANF is the data collection and quality control center for the USArray project, which is part of EarthScope. This cluster has five nodes and drives a 2 x 2 tiled array of four 30” Apple displays (17-Megapixels). OptIPuter middleware (DVC) and visualization (SAGE) software is currently being ported to this system and will be tailored to the specific needs of the USArray project. OptIPuter funds were used to purchase the monitors. During the summer this system will be expanded to a 50-Megapixel display.
USAarray Data: Working in collaboration with the Array Network Facility (ANF) , SIO/UCSD is automating the data
transfer and data processing needed to produce a 3D interactive scene file that allows users to explore seismicity distribution, and active seismic stations in the USAarray project.
SIO began working more closely with collaborators at NASA Goddard, NASA Ames and Jet Propulsion Laboratory on OptIPuter-related Earth science applications using CAVEwave. SIO can access NASA machines at SDSC and at McLean Virginia, and preliminary test datasets were transferred to SIO. These images were then hosted on the UCSD OptIPuter storage cluster and visualized using JuxtaView and LambdaRAM on the SIO visualization cluster. This collaboration is dependent on NASA Goddard’s NLR connection from Virginia to Chicago, which is imminent (see Section 2.A.4.c), and on NASA Ames and JPL both getting connectivity to NLR PoPs in California.
2.A.7.b. SDSU Application Codes SDSU (Frost) collected numerous very-high-resolution datasets of the San Diego county region, including aerial photography that is at one-foot spatial resolution and radar data that has three-foot vertical resolution. We combined these datasets into a single dataset that is several TB in size and are working on a variety of ways to both transfer entire files as well as serve up the data as web services to users for education and research, and make the data available to first responders in both natural disaster and potential terrorist responses. Within these datasets we are putting “virtual realities” of such areas as the US-Mexico border and we are trying to transport virtual situational awareness for homeland security and environmental studies.
Two specific applications in which we were involved were: (1) assisting with the Indonesia tsunami response and (b) helping to construct and serve NASA World Wind global imagery. Our imagery, as processed locally by John

The OptIPuter FY2005 Annual Progress Report and FY2006 Program Plan 25
Graham, was transported to SDSC and then served to disaster response officials, military aid groups, and many NGO’s to assist with world response.
2.A.7.c. NCMIR/BIRN Application Codes NCMIR/BIRN has completed the following projects:
• Built and deployed a 4x5 tiled display, the “BioWall,” based on EVL’s GeoWall2 technology. A 21-node Opteron cluster with QuadroFX 3000G graphics cards drives the BioWall.
• Tested simultaneous use of JuxtaView and Vol-a-Tile on the BioWall for multimodal view of tissue samples, allowing a biologist to view a high-resolution dataset in 2D on the BioWall and a 3D subsection of the same dataset on the Geowall passive stereo display.
• Developed a system that searches through a user-defined directory and automatically generates files required by JuxtaView and creates JPEG previews.
• Developed a point-and-click web interface enabling users to launch JuxtaView from the Telescience web portal by clicking on a preview icon.
• Installed and tested TeraVision servers on the light and electron microscopes, to transport high-quality microscope video to remote collaborators.
• Installed a TeraVision server at a collaborating BIRN site for streaming instrument video. • Streamed stereo HDTV at 1920x1080 across the lab using TeraVision technology. • Streamed multiple HDTV streams from TeraVision servers to the BioWall tiled display. • Extended the functionality of TeraVision by integrating synchronized audio streaming. • Extended the functionality of JuxtaView and SAGE to enable manual correlation of views across two
instances of JuxtaView, enabling scientists to roam around at low- and high-magnification views of the same dataset.
• Extended the functionality of JuxtaView to view tiled TIFFs that are generated by the light microscope, enabling the user to view TIFF files greater than 4GB.
• Configured SAGE for simultaneous sharing of high-resolution data using JuxtaView and streaming HDTV from remote sites.
• Worked with the Rocks group (Papadopoulos) to develop a 64-bit version of the Rocks “viz roll”. • Worked with CSE (Chien) to install, test, and integrate DVC with EVL’s LambdaRAM. • Worked with the Rocks group to prototype a Rocks roll with EVL/UIC visualization software • Built a 5-node, 6-monitor tiled display at the BIRN Coordinating Center. • Streamed HDTV video and high-resolution data from NCMIR to several sites, including EVL/UIC, KISTI
(Korean Institute of Science and Technology Information), NCHC (National Center for High Performance Computing in Taiwan), and BIRN using TeraVision, SAGE and JuxtaView.
• Streamed data between SIO and NCMIR using SAGE and JuxtaView for a NASA demonstration. • Installed and configured LambdaCam for remote monitoring of the tiled display from a web page. • Installed the SAGE GUI on a Smartboard as a touch interface for data on the BioWall.
2.A.7.d. Education and Outreach Activities UCSD/PREUSS SCHOOL…The SIO Visualization Center continues to provide new Earth science modules to the Preuss School for its GeoWall system <www.siovizcenter.ucsd.edu/library/objects/index.php>. The UCSD campus has a GigE pipe to the Preuss School for OptIPuter use. This connection is ~3 times faster than the pre-existing network connection, and we are getting a transfer rate is ~22 MB/second rather than ~7.3 MB/second. This high data-transfer rate between SIO and Preuss has allowed real-time data transfer and data discussions between SIO researchers and Preuss students and teachers.
On February 1, 2005, Preuss classes became part of the integrated Ship-2-Shore project, a unique ocean science education program that brings physical oceanography to students in the classroom from research vessels at sea using SIO’s HighSeasNet satellite communication system <http://footsteps.ucsd.edu>. Students at the Preuss School had a real-time discussion with Debra Brice, the “Teacher at Sea” on the SIO Revelle ship in the South Pacific Ocean. Both audio and visual images of Debra were broadcast to the students and projected on a large screen.
UCSD/SIXTH COLLEGE…We have postponed the development of OptIPuter projects with the Sixth College until additional funding is forthcoming

The OptIPuter FY2005 Annual Progress Report and FY2006 Program Plan 26
LINCOLN ELEMENTARY SCHOOL IN OAK PARK, IL AND GALILEO ELEMENTARY IN CHICAGO, IL…UIC (Moher) completed a design iteration of the RoomQuake (earthquake simulation) application, including porting the application to a browser-based interface that permits deployment on conventional classroom computers. Two new classroom “Embedded Phenomena” applications were also developed (to run on the same platform base). HelioRoom positions the classroom as the center of the Solar system, with distributed PCs providing simulated radial views into (circular) planetary orbits. The planets are represented as co-planar uniform-size spheres with random color-coding, with proportionally accurate orbital periods. Students are asked to use prior knowledge of planetary order (via occlusion) and orbital periods to deduce the identity of the color-coded spheres. RoomBugs is a simulation of insect migration in the face of changing local environmental parameters. Students are presented with snapshots of insect tracks presented in a browser window; using a fabricated “field guide,” they identify the bug types and relative populations. Working in groups, students create “environmental action reports” that request modifications to local environmental parameters (moisture, pesticides) in order to attract desirable insects and repel pests. Students iterate over several parameter changes in an attempt to arrive at optimal insect distributions.
All three applications were deployed in classrooms in Spring 2005. RoomQuake was used with fifth-grade children, and HelioRoom with third-grade children, at Lincoln Elementary in Oak Park, IL. RoomBugs was used at Galileo Elementary in Chicago, IL. In each deployment, summative pre/post and formative data was collected on student conceptual understanding, development of science inquiry process skills, and affective science-related measures.
In addition, two new systems were developed: the Community Affordances Toolkit (CAT), a hardware and software platform for the enactment of “Embedded Phenomena” (e.g., RoomWare) simulations, consisting of a wireless server and distributed clients for visualization and control, and the Field Protocol Capture & Analysis system, a 6-channel video system used to capture student performance data in whole-class distributed activities.
UCSD/SIO OUTREACH ACTIVITIES…In addition to ongoing Education and Outreach activities (typically more than 20/year), the SIO team: (a) Held its second annual teacher education workshop on Friday August 19, 2005 <www.siovizcenter.ucsd.edu/workshop/index.html>; (b) Held the third annual Graduate Student Visualization contest on October 22, 2004 <www.siovizcenter.ucsd.edu/news_events/comp2004/results.html>; (c) Participated in the planning and development of the SIO Birch Aquarium exhibit “Earthquakes: Life on a Restless Planet,” which included 3D interactive visualizations created by the winners of the SIO Graduate student visualization contest (Smith & Ely); and, (d) Continued the development of the Visual Object archive with an emphasis on promoting collaborations among institutions <www.siovizcenter.ucsd.edu/collaborators/index.php>.
NCMIR/BIRN AND UIC/EVL…NCMIR hired two EVL students as summer interns to refine OptIPuter applications for use in biomedical environments. They worked in the same lab as the biologists and were exposed to basic wet lab training, giving them perspective of how OptIPuter is applied in a real-world environment. NCMIR also sponsored a student in the PRIME program <http://prime.ucsd.edu/>, who extended JuxtaView to view tiled TIFF images generated at NCMIR. The student also installed and configured SAGE at Taiwan’s NCHC (National Center for High Performance Computing) and streamed JuxtaView from clusters in Taiwan to the tiled display in San Diego.
MINNESOTA SCIENCE CENTER AND UIC/EVL…The GeoWall2 system originally loaned to USGS EROS by EVL/UIC was shipped to the Minnesota Science Museum for the period of June-August 2005 to evaluate OptIPuter technology in a museum setting. This summer, the National Center for Earth Surface Dynamics (NCED) is supporting an EVL/UIC graduate student to transfer of technology from the OptIPuter project to the visualization requirements of the museum and NCED.
ANNUAL OPTIPUTER MEETING…Partners met and discussed goals, plans and collaborative projects at the OptIPuter All Hands Meeting January 26-28, 2005.
IGRID 2005 AND GLIF…Maxine Brown and Tom DeFanti, OptIPuter project manager and co-PI, are primary organizers of iGrid 2005 <www.igrid2005.org>, to be hosted by Larry Smarr at the new Calit2 building at UCSD, 26-30 September 2005. iGrid is a biennial workshop, organized by the high-performance computing research community, to showcase international grid computing using optical networks. iGrid is an opportunity (or an excuse) for the best and brightest worldwide in applications, middleware and networking to work together to advance the state of the art. In conjunction with iGrid, we will also be hosting the annual meeting of the Global Lambda Integrated Facility (GLIF) <www.glif.is>. Annual GLIF meetings attract the world’s premier Research & Education network managers and engineers who are architecting an international LambdaGrid infrastructure by identifying equipment, connection requirements, and necessary engineering functions and services. GLIF and iGrid have a

The OptIPuter FY2005 Annual Progress Report and FY2006 Program Plan 27
symbiotic relationship, as iGrid showcases advances in scientific collaboration and discovery enabled by GLIF, by providing a forum for the world’s premier discipline scientists, computer scientists and network engineers to work together in multidisciplinary teams to understand, develop and demonstrate innovative solutions in a LambdaGrid world. Many OptIPuter and OptIPuter-like demonstrations will be shown, given the overlap of iGrid and GLIF with OptIPuter goals.
2.A.8. Meetings, Presentations, Conference Participation October 6-7, 2005. Joe Mambretti and Cees de Laat are co-Technical Program Chairs of the 2nd Workshop for Grid Applications (GridNets), co-located with BroadNets, Boston, MA.
October 3-6, 2005. Joe Mambretti and Cees de Laat are potential panel organizers of optical networks and Grids, GGF, Boston, MA.
September 26-30, 2005. Maxine Brown and Tom DeFanti are co-chairs of iGrid 2005, Calit2@UCSD, San Diego, California. Cees de Laat and Joe Mambretti are some of the principal organizers; de Laat will produce a special iGrid issue of the journal Future Generation Computer Systems, and Mambretti is a member of the Symposium Committee and organizer of the Optical Technology Panel. Many OptIPuter members are also major iGrid participants (Jason Leigh, Luc Renambot, Cees de Laat, Paul Weilinga, Andrew Chien, Donna Cox, Mark Ellisman, John Orcutt, Satoshi Sekiguchi, Jysoo Lee, etc.) See <www.igrid2005.org> for more information.
September 12-14, 2005. Joe Mambretti is co-chair of the 2nd NCO/NASA NREN Workshop VIII: Optical Network Testbeds-2 (ONT-II), organized by NASA with the Federal Large Scale Networking Coordination Group, at NASA Ames, Mountain View, CA.
August 22-24, 2005. Joe Mambretti gave an invited presentation on “Ultra Performance Dynamic Optical Networks and Control Planes for Next Generation Applications” at the Mini-Symposium on Optical Data Networking, Grasmere, England.
August 17-19, 2005. Joe Mambretti participated in the Technical Program, IEEE Hot Interconnects, Stanford, CA.
August 3, 2005. Robert Patterson and Stuart Levy gave the presentation “NCSA: Creating Stereo Visualizations” as part of the Emerging Technologies panel at SIGGRAPH 2005, Los Angeles Convention Center.
July 31 – August 5, 2005. Joe Touch attended the 63rd IETF meeting in Paris, France, and presented work on IPsec.
July 27, 2005. TAMU (Xingfu Wu) gave the presentation “Performance Analysis of a 3D Parallel Volume Rendering Application on Scalable Tiled Displays” at the International Conference on Computer Graphics, Imaging and Vision (CGIV05), July 2005, Beijing, China.
July 27, 2005. UIC/EVL (Jason Leigh and Luc Renambot) participated in the 2005 NSF CISE/CNS Pervasive Computing Infrastructure Experience Workshop, hosted by UIUC/NCSA, and gave a presentation on the construction of the 100 Megapixel LambdaVision display used for OptIPuter <www.cs.uiuc.edu/events/expwork-2005/pervasive/index.php>.
July 2, 2005. Donna Cox gave the keynote address, “Visualizing the Cosmos,” at the INSAP V, Adler Planetarium, Chicago, IL.
June 30, 2005. Joe Mambretti participated in the High Performance Networking Working Group, Global Grid Forum (GGF), Chicago, IL.
June 29, 2005. Andrew Chien gave a presentation at the 2005 Optoelectronics Industry Association Meeting on “Optical Networking The Future.” Chien’s talk was entitled “Grids and Advance Science Drivers: Demanding Applications for Optical Networks.”
June 27, 2005. Joe Mambretti gave an invited presentation on “Next Generation Services and Global Communications Based on Dynamic Optical Networking” to the Qwest High Performance Networking Summit, Little Colorado.
June 27, 2005. New OptIPuter partner Satoshi Sekiguchi from AIST/GTRC, along with several colleagues, was in Chicago for GGF meetings and visited Jason Leigh and Luc Renambot at UIC/EVL. Since GTRC is building a tiled display, they want to get OptIPuter visualization software. Meanwhile, GTRC’s work on the Gfarm file system and packet spacing are of interest to UIC/EVL, and Leigh plans to obtain their software to test and use.

The OptIPuter FY2005 Annual Progress Report and FY2006 Program Plan 28
June 24, 2004. Larry Smarr gave a keynote “The Jump to Light Speed − Data Intensive Earth Sciences are Leading the Way to the International LambdaGrid,” at the 15th Federation of Earth Science Information Partners Assembly Meeting: Linking Data and Information to Decision Makers in San Diego.
June 23-24, 2005. Tom Moher and his graduate students demonstrated OptIPuter applications RoomQuake, HelioRoom, and RoomBugs at the inaugural Games•Learning•Society Conference held in Madison, WI.
June 23, 2005. Donna Cox participated in the panel “Is motion important?” at the IM2 Conference on Simulations, Modeling and Animation, Getty Museum, Los Angeles, CA,
June 22, 2005. Marcus Thiébaux attended the SCEC All Hands Meeting at USC, with a presentation on how applications such as GVU running in an OptIPuter environment will enhance the development of simulation and post-processing codes for extremely large simulation volumes, through rapid exploratory feedback.
June 21, 2005. Peter Essick, veteran photographer for the National Geographic magazine, took pictures of the SIO Visualization Center HIVE and the OptIPuter-enabled iCluster (Mac tiled display). Bridget Smith and Debi Kilb displayed various 3D visualizations related to the 1906 San Francisco earthquake on the display systems. The pictures are likely to appear in the April 2006 issue of the National Geographic.
June 20, 2005. Debi Kilb and Jose Otero were interviewed by multiple local TV stations about the recent increase of seismic activity, which included two in-studio real-time interviews with Jose Otero. IGPP web sites <http://eqinfo.ucsd.edu> and <http://siovizcenter.ucsd.edu> were also featured on many of the “Learn More” news media websites.
June 20, 2005. KFMB Channel 8 News Reporter Marcella Lee received an analysis of recent and historic California earthquake trends from SIO seismologist Debi Kilb using SIO’s Visualization Center and the latest IGPP seismology research.
June 20, 2005. In response to recent seismic activity, San Diego’s local NBC and Fox news stations both highlighted SIO scientists and seismic research findings in their news segments and linked to the SIO Visualization Center and the ANZA Seismic Group web pages on their “Learn More” news media websites.
June 17, 2005. The HIVE Theater and the iCluster at the SIO Visualization Center were a hubbub of proactive media activity following the 5.6 Anza earthquake. TV news coverage included KUSI, NBC 7/39, KSWB, and Fox 6, who took turns interviewing seismologist Debi Kilb about the recent quake. On hand to assist were Atul Nayak and Tom Ihm.
June 17, 2005. Debi Kilb, with assistance from Atul Nayak, was interviewed by reporter Artie Ojeda from TV NBC 7/39 about the “big picture” surrounding the recent string of California earthquakes.
June 15, 2005. Visualization Specialist Atul Nayak displayed 3D visualizations of earthquakes in California and Sumatra at the Synthesis Center at SDSC. Nearly 60 visitors at the Earth Sciences Information Partnership (ESIP) Federation Meeting were hosted at the SynCenter by Managing Director Linda Ferri.
June 14, 2005. Tuesday’s northern California 7.2 earthquake, and subsequent tsunami warming, prompted media calls from Fox-6, KGTV-1, and KSWB-5. Responding to the media requests, Debi Kilb quickly created 3D visualizations to help explain to the public where the earthquakes occurred and their relation to past seismicity. Atul Nayak used the iCluster display system to help display the visualizations, real-time waveforms and maps. The images and system were so stunning one camera woman asked “And they pay you to do this?”
June 14, 2005. In a recent article in SIO magazine Explorations, titled “Secrets of the Drake Passage,” biological oceanographer Greg Mitchell (SIO) describes the Shackleton Fracture Zone (SFZ) in Drake Passage, which defines a boundary between low and high phytoplankton waters. Included in the article is a 3D image of the study region that was created, in part, at the Visualization Center and derived from a collaboration between Debi Kilb (SIO) and
Debi Kilb (SIO/UCSD) discusses real-time seismic data feed displayed on the OptIPuter icluster wall in the EarthScope ANF office with science news reporters from Fox news.

The OptIPuter FY2005 Annual Progress Report and FY2006 Program Plan 29
Mitchell.
June 7-10, 2005. Michael Goodrich presented a paper on methods for defeating cheating in grid computations involving searches for high-value rare events at the 3rd Applied Cryptography and Network Security Conference in New York, NY.
June 1, 2005-August 15, 2005. UIC/EVL Computer Science students Nicholas Schwarz and Raj Vikram Singh spent their summer as interns at UCSD/NCMIR to integrate OptIPuter technologies into NCMIR’s workflow.
May 31, 2005. Dr. Dave Sandwells’ Satellite Remote Sensing (ERTH 135) class met at the VizCenter to explore geoscience data in 3D. The 19 students, mostly Physics and Engineering seniors, were some of the best students at UCSD. They explored all 12 of the terrestrial planets and the moon, as well as some major faults on the Earth.
May 26, 2005. John Orcutt used various visualizations from the SIO Visualization Center library at the Union talk ‘The Great Sumatra-Andaman Islands Earthquake and Tsunami: Science and Policy’ at the 2005 Joint Assembly, New Orleans LA. Atul Nayak flew over various 3d scenes showing imagery for Banda Aceh before the tsunami and the devastation after it,growth of sensors and computer networks from 1980, images of the fault rupture calculated using data collected by acoustic sensors in the Indian ocean and the seismic stations in Japan and also high resolution satellite imagery for New Orleans. A 1600 x 1200 Sanyo projector was used to display the detail in the data and a dual G5 Mac (part of the iCluster) was used to visualize the multiple gigabyte scenes.
May 23, 2005. Joe Mambretti gave an invited presentation on “Next Generation Services and Global Communications Based on Dynamic Optical Networking,” to the Future Networking Forum for representatives of multiple federal agencies, McLean, VA.
May 19, 2005. Jason Leigh gave a presentation at the National Advisory Research Resources Council Meeting of the National Center for Research Resources, NIH. The presentation was titled “Cyber-Infrastructure Technology for Advancing BioScience Research and Collaboration.”
May 8-11, 2005. M.T. Goodrich presented a paper on leap-frog packet linking and diverse key distributions for improved integrity in network broadcasts at the IEEE Symposium on Security and Privacy in Oakland, California.
May 8-9, 2005. Eric Weigle (Andrew Chien’s PhD student) presented the paper “The Composite-Endpoint Protocol (CEP)” and Xinran (Ryan) Wu (Andrew Chien’s PhD student) presented the paper “A High Performance Configurable Transport Protocol For Grid Computing” at the IEEE Conference on Cluster Computing and the Grid in Cardiff, United Kingdom.
May 6, 2005. Joe Mambretti gave an invited graduate student seminar presentation on “New Architecture for 21st Century Networks: High Performance Communication Services Based on Dynamic Lightpaths and Advanced Photonics” at Northwestern University, Evanston, IL.
May 5, 2005. Visualization Specialists Rob Newman (SIO), Atul Nayak (SIO) and Evan Morikawa (HTH) attended the 3rd Annual GEON Meeting at the Bahia Resort San Diego. They presented posters on the 3D visualizations created at the VizCenter and the latest display system the iCluster. Jamie Farrell from the University of Utah also gave a talk on “The Yellowstone GIS Database”, which include an interactive visualization of the Yellowstone area created in tandem with co-author Debi Kilb.
May 3, 2005. Larry Smarr gave the presentation “Analyzing Large Earth Data Sets: New Tools from the OptIPuter and LOOKING Projects,” to the 3rd Annual GEON Meeting in San Diego.
May 3, 2005. Jason Leigh gave a presentation titled “A Cyberinfrastructure for Data-Intensive Science Enabled by Intelligent Light Paths,” at the Pantheon Workshop on Technologies & Testbeds for Actionable Intelligence. The meeting was held at Argonne National Laboratory.
May 3, 2005. UIC Computer Science student Yunghong Gu gave the talk “An Introduction to UDT” at the Internet 2 Spring 2005 Member Meeting, Arlington Virginia.
April 30, 2005. Graham Kent (SIO) and Gordon Seitz (SDSU) led the SSA fieldtrip “Active fault architecture of the Lake Tahoe Basin”. This trip highlighted geophysical and geological studies that document active extension (30.5 mm/yr) across the Lake Tahoe Basin. Field trip stops focused on three en-echelon normal faults that are responsible for the basin formation. A three-dimensional, virtual Lake Tahoe model was also presented during the trip; CDs including the model and software were distributed to field trip attendees. Points of interest included: Emerald Bay, Eagle Rock, Tahoe City Dam, Incline Village Elementary School, and Mt. Rose Highway lookout.

The OptIPuter FY2005 Annual Progress Report and FY2006 Program Plan 30
April 28, 2005. Working in tandem with researchers from across the county Debi Kilb (SIO) created a 3D visualization pertaining to a recent swarm of seismicity near Lake Tahoe for the 2005 SSA meeting. This included the placement of a rectangular fault plane at individual earthquake locations, oriented with respect to the specific fault strike and dip, to within 1 degree (i.e., OptIPuter project DIP). This work was presented in a talk by Ken Smith (UNR) titled Sierran Uplift and Lower Crustal Earthquake Swarm: Evidence for Magma Injection beneath North Lake Tahoe, Nevada-California in Late 2003. Graham Kent (SIO) skillfully led a 3D interactive virtual tour of the earthquake sub-faults and lake basin. “Wow – that is so cool,” remarked an audience member.
April 28, 2005. Debi Kilb presented ‘Near-Real Time Generation of 3d Interactive Visualization And Web-Based Information Pertaining To The September 28, 2004 Mw 6 Parkfield Earthquake.” At the SSA meeting.
April 27, 2005. Representing those associated with SIO’s rapid response to the 28 September 2004 Parkfield earthquake Debi Kilb presented a poster at the SSA meeting titled: ‘Near-Real Time Generation of 3d Interactive Visualization And Web-Based Information Pertaining To The September 28, 2004 Mw 6 Parkfield Earthquake.” Highlights included an interactive 3D visualization, special events web-pages with information available in both English and Spanish along with eye-catching still images that demonstrated the benefits of the juxtaposition of geo-referenced data.
April 25, 2005. The hard work associated with the OptIPuter project of Debi Kilb (SIO) and Charles Zhang (EVL), affectionately called “DIP”, has recently yielded astonishing new results. This project automates the generation of 3D visualizations of fault planes (position: lat/lon, orientation: strike/dip, size: magnitude) based on earthquake catalog information. The DIP programs were applied to the newly released earthquake focal mechanism catalog created by Jeanne Hardebeck at the USGS, revealing the complexity of the multiple sub-faults in southern California.
April 22, 2005. Debi Kilb, from the SIO Visualization Center, assisted Stanford graduate student Sang-Ho Yun with a visualization pertaining to the project “Uplift, subsidence, and Trapdoor Faulting at Sierra Nergra Volcano, Galapagos Islands, from InSAR Observations and Mechanical Modeling”. The initial work (a platform independent 3D interactive visualization) was highlighted today at a Research Review meeting at Stanford University.
April 19, 2005. Larry Smarr visited with Kevin Thompson at NSF to discuss OptIPuter directions.
April 19, 2005. Joe Mambretti gave a presentation on “High Performance Communications Based on Dynamic Lightpaths: OMNInet and OptIPuter,” to the JET Workshop on Optical Network Testbeds, National Science Foundation Arlington, VA.
April 18, 2005. Reading about the OptIPuter video-conference lesson conducted with seismologist Debi Kilb (SIO) and students in Oak Park, Illinois, Rebecca Ferraioli – a model schools, professional developer – set up a similar “chat” between San Diego and students in Susan Wells classes at the Plainedge Middle School in Massapequa, New York. The students were so excited about the project they spent hours creating questions that might “stump” Debi.
April 14, 2005. Visualization Specialist Rob Newman was invited by teachers at Oneonta Elementary School in Imperial Beach, San Diego to talk to first graders about plate tectonics, earthquakes and visualization.
April 13, 2005. UCSD/NCMIR (Steve Lamont, Ruth West) visited EVL to learn more about interfacing NCMIR datasets to UIC/EVL software for the 55-tiled display and the Varrier autostereo system.
April 12, 2005. News channel NBC 7/39 interviewed Frank Vernon and Debi Kilb at the SIO VizCenter to get details about the magnitude 3.9 earthquake near El Cajon that woke people up in the morning. They made live presentations from the Array Network Office and used the iCluster to display 2D and 3D visualizations of today’s earthquake.
April 11-12, 2005. Joe Mambretti gave an invited presentation on “New Architecture for 21st Century Networks: High Performance Communication Services Based on Dynamic Lightpaths and Advanced Photonics” to the TTI Vanguard Conference on Future Networks, Chicago, IL.
April 5-7, 2005. Tom Moher presented a paper (co-authored by Debi Kilb) entitled “RoomQuake: Embedding Dynamic Phenomena within the Physical Space of an Elementary School Classroom” at the ACM Conference on Human Factors in Computing Systems, Portland, OR.
March 29, 2005. A 3D visualization of the seismic activity in Sumatra created by SIO VizCenter staff Atul Nayak and Debi Kilb has been published on the AGU website and the April 5 issue of the EOS newletter.

The OptIPuter FY2005 Annual Progress Report and FY2006 Program Plan 31
March 29, 2005. Two members from the GEOWALL consortium, Debi Kilb (SIO) and Mike Kelly (NAU), demonstrated various 3D interactive visualization software programs at the EarthScope national meeting in New Mexico.
March 28, 2005. News crews from six local TV stations made live presentations from the SIO VizCenter and the Array Network Facility office today in response to the magnitude 8.7 earthquake in Indonesia. IGPP scientists Graham Kent and Jon Berger displayed real time data from the USArray stations and flew through a 3D scene of the earthquake location on the HIVE and the iCluster displays.
March 26, 2005. As part of the weekend talk series, Dr. David P. Sandwell (SIO) spoke to a group of visitors at the Reuben H. Fleet Science Center in Balboa Park, and displayed visualizations created by the OptIPuter project.
March 25, 2005. Juniors and seniors from Hoover high school were selected to participate in an intensive after school and study abroad marine science program called BAHIA. As part of their spring break program, these students visited the Visualization Center at the Scripps Institute of Oceanography to learn about the cutting edge technology in the SIO Visualization Center. Science director Debi Kilb hosted the group.
March 25, 2005. Larry Smarr gave a briefing to ONR on “Creating High Performance Lambda Collaboratories” in Arlington, VA.
March 20, 2005. Yehuda Bock, Michael Scharber and Atul Nayak demonstrated the visualization capabilities of the VizCenter to undergraduate students in the ES110 GIS class.
March 17, 2005. Joe Mambretti gave an invited presentation on “Next Generation Services and Global Communications Based on Dynamic Optical Networking,”to representative of USAF, Herdon, VA.
March 9, 2005. Larry Smarr gave an invited talk on “The OptIPuter, Quartzite, and StarLight Projects: A Campus to Global-Scale Testbed for Optical Technologies Enabling LambdaGrid Computing” at the Optical Fiber Communication Conference (OFC2005) in Anaheim, CA.
March 7-9, 2005. Greg Hidley organized and moderated the panel “Emerging Research Networks” at CENIC 2005 at Marina del Rey, California. Hidley presented on “OptIPuter: National Networking Update” and Aaron Chin presented on “CalREN-XD at UCSD/UCI/ISI: A SoCal XD Anchor for Networking Research.” For more information, see <http://www.cenic.org/events/cenic2005/agenda.htm>.
March 5, 2005. Larry Smarr gave an invited talk on “The Emerging Cyberinfrastructure for Earth and Ocean Sciences” to the SIO Council in La Jolla, CA.
March 3, 2005. Jason Leigh gave a seminar presentation at Calit2 at UC-Irvine titled “A Cyberinfrastructure for Data-Intensive Science Enabled by Intelligent Light Paths.”
March 3, 2005. The New York Times highlighted the GeoWall technology in an article titled “GeoWall Project Expands the Window Into Earth Science”.
March 2, 2005. Joe Mambretti gave an invited presentation on “Next Generation Services and Global Communications Based on Dynamic Optical Networking,” to Arden Bement, NSF Director, Arlington, VA.
March 2, 2005. Realizing the limitation of 2D still images in the discussion of complex 3D data, Debi Kilb incorporated a number of different 3D interactive visualizations in her talk at UCLA’s seismology seminar.
March 1, 2005. Visualization specialists Atul Nayak and Evan Morikawa attended the GEON Visualization Workshop at the SDSC and demonstrated various 3D scene files and movies from the SIO VizCenters library to the attendees.
February 28 – March 2, 2005. Calit2/UCSD hosted the 4th Annual ON*VECTOR International Photonics Workshop at UCSD, in which many OptIPuter partners participated. The agenda is available at <http://www.OptIPuter.net/events/onvector/workshop05.html>; PPTs are available upon request. ON*VECTOR (Optical Networked Virtual Environments for Collaborative Trans-Oceanic Research) is a joint project of NTT Network Innovation Laboratories, University of Tokyo and University of Illinois at Chicago’s Electronic Visualization Laboratory (UIC/EVL), and managed by Pacific Interface Inc. (PII).
February 20, 2005. Jason Leigh gave the presentation “Introduction to Advanced Visualization Technologies for Education,” at a session titled “From Wildfires to Paleoceanography: Visualizing the Three- and Four-Dimensional World,” at the annual AAAS conference.
The OptIPuter FY2005 Annual Progress Report and FY2006 Program Plan 32
February 9, 2005. The National Ocean Science Bowl (NOSB) is a national competition in which high school students compete in jeopardy style rounds with questions focusing on the ocean sciences. Two of the 2005 NOSB teams (one from Montgomery High School and the other from La Jolla High School) attended a demonstration at the SIO VizCenter, led by Debi Kilb, to learn how cutting edge visualization technology is used in current geoscience research.
February 4, 2005. Larry Smarr gave an invited talk to the NASA Jet Propulsion Laboratory on “LambdaGrids−Earth and Planetary Sciences Driving High Performance Networks and High Resolution Visualizations,” in Pasadena, CA. JPL is one of three NASA sites who subsequently became affiliate partners of the OptIPuter project.
February 4, 2005. Andrew Chien gave an invited keynote talk entitled “Towards Terabit Networks” at the Mardi Gras Conferences at CCT, Louisiana State University, Baton Rouge, Louisiana.
February 3, 2005. Andrew Chien gave a distinguished lecture entitled “Towards Terabit Networks” at the Center for Advanced Computer Studies, University of Louisiana (Lafayette), Lafayette, Louisiana.
February 3-4, 2005. UIC Yunhong Gu and Robert L. Grossman gave the presentation “Optimizing UDP-based Protocol Implementations,” and UIC/EVL PhD student Raj Singh gave the presentation “LambdaVision: A Data Transport Protocol for Network-Intensive Streaming Applications over Photonic Networks” at the Third International Workshop on Protocols for Fast Long-Distance Networks (PFLDNET 2005) in Lyon, France.
February 2, 2005. Robert Patterson gave the presentation “Visualization and Experimental Technologies at NCSA” at the III Workshop on Computational Grids and Applications (LNCC), Petropolis, Laboratorio Nacional de Computacao Cientifica, BRAZIL
January 29, 2005. Several OptIPuter partners (Larry Smarr, Phil Papadopoulos, Tom DeFanti, Jason Leigh, Luc Renambot, Joe Mambretti, Maxine Brown, Greg Hidley, and Cees de Laat, among others) participated in the ON*VECTOR Terabit LAN workshop hosted by UCSD/Calit2. ON*VECTOR (Optical Networked Virtual Environments for Collaborative Trans-Oceanic Research) is a joint project of NTT Network Innovation Laboratories, University of Tokyo and University of Illinois at Chicago’s Electronic Visualization Laboratory (UIC/EVL), and managed by Pacific Interface Inc. (PII).
January 26-28, 2005. The annual OptIPuter All Hands Meeting and Open House was held in San Diego. For information on participants and presentations, see <http://www.OptIPuter.net/events/presentation_temp.php?id=21>.
January 25, 2005. Prior to the annual OptIPuter All Hands Meeting, Joe Mambretti held the 3rd Annual Backplane (a.k.a. Network) Architecture Workshop. For a list of participants and presentations, see <http://www.OptIPuter.net/events/presentation_temp.php?id=20>.
January 22, 2005. Wondering how scientists use computers to help them with their research ~20 eighth grade girls, who are alumnae of the Better Education for Women in Science and Engineering (BE WiSE) program, attended a half-day Saturday program at the SIO Visualization center. Science director Debi Kibl and graduate student Christine Reif hosted the group.
January 20-21, 2005. Joe Mambretti gave an invited presentation on “Preparing Regions and Cities for the 21st Century Economy: Policies for Digital Communications Infrastructure,” to MacArthur Foundation Policy Project Forum, Development Globalization and Technology: Strategies to Enhance Regional Competitiveness, Chicago, Illinois.
January 18, 2005. Larry Smarr gave a remote keynote address to Japan’s JGN II Symposium entitled “Using OptIPuter Innovations to Enable LambdaGrid Applications,” using the University of Washington/ ResearchChannel’s HDTV over fiber from Seattle to Osaka.
January 12-14, 2005. Joe Mambretti gave an invited presentation on “Recent Progress on TransLight, OptIPuter, OMNInet And Future Trends Toward Lambda Grids” at the 8th International Symposium On Contemporary Photonics Technology (CPT2005), Tokyo, Japan.
January 12, 2005. Larry Smarr gave a keynote presentation at the 21st International Conference on Interactive Information Processing Systems (IIPS) for Meteorology, Oceanography, and Hydrology Held at the 85th AMS Annual Meeting in San Diego, entitled “Toward a Global Interactive Earth Observing Cyberinfrastructure.”
January 10, 2005 – July 9, 2005. EVL has been holding weekly meetings with NCMIR to help students understand

The OptIPuter FY2005 Annual Progress Report and FY2006 Program Plan 33
the process of bioscience facilitated by high-resolution tele-microscopy.
December 17, 2004. Geoscientists from Scripps and visualization specialists from met in San Francisco’s Moscone center for the 2004 AGU conference. At the SIO booth 3-D visualizations were showcased this year on new 30” Apple HD Cinema displays. There were also a large number of posters with topics ranging from the geosciences to advanced visualization systems. http://www.siovizcenter.ucsd.edu/news_events/2004/12/AGU2004.htm
December 14, 2004. Jason Leigh gave the keynote presentation “The OptIPuter: A Cyberinfrastructure for Data-Intensive Science Enabled by Intelligent Light Paths” at SuperDAG 2004, in Amsterdam, Netherlands.
December 13-17, 2004. UCSD/SIO (John Orcutt, Atul Nayak, Graham Kent, Debi Kilb), UIC/EVL (Jason Leigh, Luc Renambot) and USGS EROS (Brian Davis) participated in the American GeoPhysical Union (AGU) Fall Meeting 2004 in San Francisco. UIC/EVL collaborated with UCSD/SIO, the Joint Oceanography Institutions, the Laccustrine Core Repository Center (at the University of Minnesota) and Tierney Brothers (the vendor that integrates EVL’s OptIPuter technology for distribution to scientists who need them). UIC/EVL conducted demos as well as heading up special sessions on visualization in the geosciences. Nayak presented the paper, “High Resolution Display of USArray Data on a 50 Megapixel Display using OptIPuter Technologies.”
December 9, 2004. Dr. Mellor’s SDSU undergraduate/graduate Interpretation of Seismic Data and Visualization (Geo647) attended a session at the SIO Visualization Center to experience data visualization on the wall-sized Panoram screen. The visit, hosted by Debi Kilb, included an interactive tour of local, regional, and global seismicity distribution along with an examination of real-time seismic data recorded in the San Diego region.
December 8, 2004. Joe Mambretti gavne an invited presentation on “Next Generation Services and Global Communications Based on Dynamic Optical Networking” at the Nortel Advanced Networking Research Forum, Ottawa, Canada.
December 2-4, 2004. Joe Mambretti gave an invited presentation on “Empowering Global Science With Dynamic Photonic Intelligent Lightpaths” at the Consortial International Workshop on Computational Physics 2004, National Center for High Performance Computing, Hsinchu, Taiwan.
November 20, 2004. Many of the visualizations in the new exhibit “EARTHQUAKE! Life on a Restless Planet” at the Birch Aquarium at Scripps (BAS) were created or provided by scientists at IGPP/SIO. For example, many of the entries created by SIO graduate students for the third annual SIO Graduate Student Visualization contest were, after their debut at the contest, sought out for display at the BAS exhibit due to their scientific information, clarity, and in some cases pure entertainment value.
November 19, 2004. Joe Mambretti presented “Next Generation Services and Global Communications Based on Dynamic Optical Networking” at the SBC Technology Research Institute, San Ramon, CA.
November 12, 2004. Joe Mambretti gave the presentation “Creating Next Generation Digital Communications, Dynamic Optical Transport with Digital Control,” and Oliver Yu gave the presentation “Photonic Interdomain Negotiator (PIN)” to the 2nd International Optical Control Plane for the Grid Community workshop, held at SC 2004. Gigi Karmous-Edwards of MCNC organized this workshop <http://www.mcnc.org/events/mcncopticalworkshop/nov04>.
November 11-12, 2004. Tom Moher and Mark Ellisman presented invited talks at National Academy of Science’s Forum on IT and Research Universities: Cyberinfrastructure, hosted by Dan Atkins and James Duderstadt, at the University of Michigan, Ann Arbor, MI.
November 9, 2004. Through a connection made at the SIO Teacher Workshop (11 Aug 2004) sixth grade teacher Ms. Theresa Williams was able to bring her ALL-GIRLS science class to the SIO VizCenter. This visit was sponsored and hosted by Drs. Helen Fricker and Debi Kilb. Dr. Fricker discussed with the girls the many aspects of her research in Antarctica. Everyone was enamored with Dr. Fricker’s slides, images and movies that ranged from a photo of green ice, to ice calving, to a movie of a helicopter trip across the icy surface that made everyone feel as if they were truly there.
November 8, 2004. Frank Vernon presented a talk on ‘Earthquakes in California’ at the Birch Aquarium’s public program ‘Perspectives on Science’. He used visualizations of Southern California seismicity and Bridget Smith’s iPod-winning entry for the SIO Visualization Contest 2004 in this talk. An interactive booth was also set up by the SIO VizCenter staff so that the attendees could interact with 3D visualizations and real time streaming seismic data.

The OptIPuter FY2005 Annual Progress Report and FY2006 Program Plan 34
November 7-10, 2004. UIC/EVL (Arun Rao, MS student, and Jason Leigh) gave a demonstration of the OptIPuter-enhanced GeoWall technology at Geological Society of America 2004 Annual Meeting & Exposition in Denver, Colorado.
November 6-12, 2004, SC 2004. A large number of OptIPuter partners were actively involved in SC 2004. OptIPuter research was demonstrated in the National LambdaRail (NLR) booth; the OptIPuter was the only research project invited to participate in the NLR booth. For a complete list of OptIPuter activities, download the brochure at <http://www.OptIPuter.net/events/presentation_temp.php?id=18>. A UIC Computer Science student presented “Experiences in the Design and Implementation of a High Performance Transport Protocol,” which was nominated for best student paper. Xin Liu (Andrew Chien’s PhD student) presented the paper “Realistic Large Scale Online Network Simulation.”
November 4, 2004. Professor Neal Driscoll (SIO) presented Making California: a 3-D Look at How the Geology of Los Angeles and Golden State Evolved to 23 members of the Los Angeles chapter of ARCS (Achievement Rewards for College Scientists). ARCS scholars, Jenna Hill, Christopher Janousek, Nicole Turkson, Koty Sharp and Jill Weinberger, also made presentations, some that included 3D visualizations created for the SIO Graduate Visualization contest.
November 2, 2004. Hollywood director James Cameron visited UCSD/NCMIR (Larry Smarr, Mark Ellisman, David Lee) and teleconferenced with UIC/EVL (Tom DeFanti, Jason Leigh, Maxine Brown) to discuss “CineGrid,” another OptIPuter driver to study the requirements for super-high-definition digital streaming over optical networks. While CineGrid is being discussed with other academic institutions, Cameron’s commercial requirements provide additional, broader insights into the problems associated with this area of research.
October 29, 2004. Joe Mambretti was Technical Program co-chair of the First Workshop for Grid Applications (GridNets), co-located with BroadNets, San Jose, California. Mambretti gave a joint presentation with F. Travostino on “A Platform for Large-Scale Grid Data Service on Dynamic High-Performance Networks.” Cees de Laat also participated in the technical program.
October 25-29, 2004. Jason Leigh served as a panelist on two panels at the Broadnets 2004 conference: “Optical Burst Switching and Grid Computing” and “Optical Networking and Grid Computing.”
October 19, 2004. Jason Leigh gave a presentation titled “The OptIPuter,” at the Visualization User Needs Workshop organized by the UK Joint Information Systems Committee (JISC) for the Support of Research. The meeting was held in Manchester.
October 12, 2004. The OptIPuter project was represented at the IEEE Visualization 2004 conference in Austin, TX by SIO VizCenter staff Atul Nayak and Nicholas Schwarz from the Electronic Visualization Laboratory, UIC . A poster on ‘Vol-a-Tile - a Tool for Interactive Exploration of Large Volumetric Data on Scalable Tiled Displays’ was presented. Atul Nayak spoke on a panel titled ‘Next-generative Collaborative Visualization Environments’.
October 10-14, 2004. UIC/EVL (Nicholas Schwarz) presented the poster “Vol-a-Tile: a Tool for Interactive Exploration of Large Volumetric Data on Scalable Tiled Displays,” at the IEEE Visualization 2004 Poster Compendium.
October 10, 2004. Birch Aquarium volunteers and staff members got to witness firsthand the seismic research being done by Scripps Scientists. Dr. Debi Kilb showed the group a number of intriguing images that will be helpful to the volunteers when interacting with the public at the Birch Aquarium. The trip to the SIO VizCenter was timely due to the approaching installation of the new exhibit titled Earthquake: Life on a Restless Planet. Aquarium volunteers play an integral role in interpreting exhibit elements and making personal connections between Scripps science and the visiting public.
October 7, 2004. Larry Smarr gave a presentation to the Annenberg Research Network on International Communication entitled “Leap into the Future: The OptIPuter and Ultimate Broadband,” in La Jolla, CA.
October 5, 2004. Falko Kuester of UCI visited Jason Leigh at UIC/EVL to discuss OptIPuter visualization collaborations.
October 4, 2004. Larry Smarr gave a Frontiers of Computer Science lecture entitled “The OptIPuter: From the Grid to the LambdaGrid” to the UCSD CSE department.
September 2004. Joe Mambretti gave an invitational presentation on “A New Foundation for Digital

The OptIPuter FY2005 Annual Progress Report and FY2006 Program Plan 35
Communications: Dynamic Optical Transport with Distributed Control,” at the Qwest High Performance Networking Summit, Little Colorado.
September 28, 2004. Responding to a media request by local news station KGTV-10, SIO scientists Bock and Kilb discussed the magnitude 6.0 Parkfield earthquake with commentator Nina Jimenez. In the elapsed 8 hours between when the earthquake struck and the time of the interview, SIO Visualization Center staff complied more than 500 aftershocks from the earthquake into a 3D interactive package that the public could download and explore. Used as a backdrop for the local news’ interviews, it provided a compelling view of these earthquake hypocenters displayed on the wall-sized screen in the Visualization Center.
September 22, 2004. Graham Kent, Jeff Babcock and Atul Nayak demonstrated a 3D visualization of the off-shore La Jolla seismicity and bathymetry at the opening of the Calit2 Collaborative Visualization Center in the UCSD Jacobs School of Engineering.
September 20, 2004. Undergraduate SCEC/UCSD summer interns Alex James and Ben Constant presented their work “Seismic Sites: A Web-based Filed Guide to the Faults of Southern California” at the annual SCEC meeting in Palm Springs. The novelty of interactively exploring geo-referenced geologic photos from the San Diego region, which were juxtaposed with topography, bathymetry, and local roads, was a hit and resulted in one of the most attended posters in the session. The addition of a large-scale anaglyph photo of the Rose Canyon fault zone, which became stereo when viewed with red/blue glasses, also added depth to the presentation. The success of this project spurred discussions to complete a similar interactive 3D visualization for public display at the visitor center in Yellow Stone National Park.
September 20-21, 2004. Joe Mambretti gave the presentation “Experimental Optical Grid Networks: Integrating High Performance Infrastructure and Advanced Photonic Technology with Distributed Control Planes” at the ECOC Workshop on Optical Networks for Grids, Stockholm, Sweden.
September 19, 2004. Recognizing the iView3D interactive software, assistant professor David Bowman, (Cal State Fullerton) stopped at the Kilb et. al. 2004 poster at the SCEC meeting titled “Generation of 3D interactive visualization tools pertaining to significant earthquakes in southern California and noteworthy global earthquakes” to say that he uses SIO’s 3D interactive visualizations, and associated web pages in his classes, impressing his students with the immediacy of the data, data analyses and data transfer.
September 16-17, 2004. PRAGMA held its 7th meeting at UCSD in San Diego, and Larry Smarr and Maxine Brown (a member of the Steering Committee) attended. Smarr gave a presentation on the OptIPuter and LambdaGrid; Brown talked about international networking and GLIF.
September 15 2004. Robert Grossman gave the presentation “Highly Scalable, UDT-Based Network Transport Protocols for Lambda and 10 GE Routed Networks” at the DOE Office of Science High-Performance Network Research Workshop (Ultranet 2004), at Fermi National Laboratory, Batavia, Illinois.
September 13-15, 2004. Jason Leigh gave the presentation “From CAVES to Collaborative Visualization and Desktop Analysis, Challenges in Ultra-High-Resolution Visualization & Collaboration,” at the Third Annual High Information Content Display System Conference, Arlington VA.
September 2-3, 2004. Tom DeFanti and Maxine Brown (key organizers) and Joe Mambretti participated in the Global Lambda Integrated Facility meeting in Nottingham, England.
August 24, 2004. The Classroom of the Future Foundation (CFF) Board of Directors met for a half-day retreat to discuss its strategic plan and key initiatives for the coming year. CFF is a non-profit based at the San Diego County Office of Education and works with local school districts to foster innovations and technology to improve teaching and learning throughout San Diego County. Included in the meeting was a brief demo, led by Debi Kilb, of the capabilities of the SIO Visualization Center and a summary of the education/outreach activities central to SIO.
August 22, 2004. Robert Grossman presented “Experimental Studies Scaling Web Services For Data Mining” at the KDD-2004 Workshop on Data Mining Standards, Services and Platforms (DM-SSP 04) <http://www.ncdm.uic.edu/workshops/dm-ssp04.htm>, at the Tenth ACM SIGKDD International Conference on Knowledge Discovery and Data Mining, Seattle, WA <http://www.acm.org/sigs/sigkdd/kdd2004/>.
August 18, 2004. Using GeoWall technology, Cheryl Peach (Birch Aquarium at Scripps), working in tandem with educational specialists from Aquatic Adventures, guided students from Monroe Clark middle school on a virtual exploration of the Earth’s global seismicity distribution (Cheryl retrieved this dataset from the SIO visual objects
The OptIPuter FY2005 Annual Progress Report and FY2006 Program Plan 36
library). This underground tour was followed by a discussion of basic concepts pertaining to tectonics and seismology.
August 15-18, 2004. International Conference on Parallel Processing, Montreal, Canada. Andrew A. Chien. “Taming Lambda’s for Applications: the OptIPuter System Software.” Keynote Talk.
August 14, 2004. A team from IGPP/SIO, including post docs, graduate students and a high school summer intern, staffed a demonstration booth at “Disaster Preparedness Day” at the Rubin H. Fleet Science Museum in Balboa Park in San Diego. Included in the demos were: ANZA network real-time streaming seismic data, jump/see seismic sensor, temporal evolution of global seismicity patterns, earthquake fact cube, a movie of the HPWREN sensor networks recording of the Cedar Fire in October 2003, and various visualizations from the OptIPuter visual objects library.
August 13, 2004. Milt Halem on NASA Goddard visited UCSD/Calit2 and SIO to discuss OptIPuter collaborations.
August 13, 2004. David Sandwell (IGPP) and Debi Kilb (IGPP) hosted a reception for 70 geophysicists attending the Meeting of Young Researchers in the Earth Sciences (MYRES). The two 45-minute tours of the SIO Visualization Center included 3D exploration of Earth’s topography, global and local seismicity patterns and a virtual trip to Mars.
August 11, 2004. Debi Kilb (SIO) coordinated the second annual Teacher Education Workshop at the SIO Visualization Center, held in conjunction with researchers and an educational specialist from SIO, SCEC, USGS, BAS, SDSU and SDSC. Generous support from IRIS, USGS, SCEC and SIO provided each teacher with take-home teaching tools, lesson plans, maps and books. Workshop participants were introduced to both hands-on low-tech teaching activities in addition to cutting edge high-tech modules. Computer-related teaching products emphasized platform independent freeware tools such as the iView3D interactive software tool.
August 9-11, 2004. NREN Workshop VII: Optical Network Testbeds (ONT), NASA Ames Research Center in Mountain View, California. Organized by the NASA Research and Education Network (NREN) Project, in cooperation with the Federal Large Scale Networking Coordination Group (LSN) and its teams. Hosted by NREN and co-sponsored by NLR and Internet2. Larry Smarr presenting on “The OptIPuter: Using Optical Networks to Create a Planetary-Scale Supercomputer” and Tom DeFanti presenting on “StarLight, Euro-Link and TransLight.” Joe Mambretti organized a panel on “Advanced Control Planes for Dynamic Optical Networks.” For more information, see: <www.nren.nasa.gov/workshop7/agenda.html>
August 6, 2004. Hugh Cowen (New Zealand, GEONET project manager) was amazed at the audience reaction when he included a scene file from the SIO Visual Object archive in a recent talk he gave to scientists and lay people. Dr. Cowen noted “For many it allowed them to understand the complexity of the seismicity patterns under the North Island of New Zealand for the first time!”
July 16, 2004. A component of the ERESE 2004 Teacher Workshop was held at the SIO Visualization Center. The focus of the workshop was to learn how to create Enduring Resources for Earth Science Education (ERESE). Included in the afternoon session was an overview of the scientific 3D visualization work by SIO graduate student Kurt Schwehr.
July 10, 2004. Jason Leigh served as a panelist at an NSF CISE RI Meeting. The panel topic revolved around strategies for handling large data.
June 28, 2004. The SCEC summer intern group toured the Visualization Center to learn about the Center’s capabilities and its current visualization projects. The group, composed of ~20 undergraduates from around the country, are working on a large earthquake visualization project this summer. All were impressed by the Visualization Center hardware, as well as demonstrations by Debi Kilb and Geoff Ely. They were especially excited to see earthquake data from around the world, which they hope to incorporate into their current project.
June 24, 2004. Larry Smarr gave a keynote “The Jump to Light Speed − Data Intensive Earth Sciences are Leading the Way to the International LambdaGrid,” at the 15th Federation of Earth Science Information Partners Assembly Meeting: Linking Data and Information to Decision Makers in San Diego.
June 21-24, 2004. Joe Mambretti did demonstrations showcasing “Concepts for Dynamically Provisioned Optical Networks,” at Supercomm 2004 in Chicago, IL.
June 17, 2004. The Board of Directors of the National Corn Growers Association (NCGA) held its annual meeting

The OptIPuter FY2005 Annual Progress Report and FY2006 Program Plan 37
in San Diego, which included a visit to SIO to learn about current research in climate change and climate predication. Many of the 22 out-of-state visitors felt the local magnitude 5.2 earthquake on June 16th and they were delighted that seismologist Debi Kilb (SIO) was available to explain how to interpret the seismic signature of this earthquake. This minimal training was sufficient for them to identify a small earthquake in the streaming real-time ANZA seismic data.
June 10, 2004. Visualization Center staff showed demonstrations of 3D seismic visual applications developed by the SIO Visualization Center at the 2004 IRIS Workshop held in Tucson, AZ. Seismologists were interested in the applicability of the visualizations to earthquake monitoring, waveform analysis and education and outreach. Scientists gave valuable feedback about the applications, which will help developers improve various visual objects.
June 10, 2004. Neal Driscoll’s Inaugural Lecture “Tectonic Signatures on Continental Margins” included 3D visualizations created by SIO graduate students Kurt Schwehr and Jeff Dingler
June 4, 2004. NSF visitor Orin Shane (EHR/Informal Science Education) attended a roundtable discussion at the SIO Visualization Center to learn about collaborations among SIO, the Birch Aquarium at Scripps and the Ocean Institute in Dana Point. The agenda included a presentation of ongoing Visualization Center education & outreach activities by Debi Kilb (SIO). A goal of the meeting was to identify essential elements of successful researcher/educator E&O partnerships.
May 26, 2004. Invited guests at the opening of the recent “Forces of Nature” IMAX film at the Reuben H. Fleet Science Center were treated by Jose Otero (graduate student, IGPP) and Debi Kilb (seismologist, IGPP) to a full range of hands-on activities at the pre-screening gala, which included real-time seismic data (waveforms and maps), 3D interactive visualizations of global/local seismicity, and a seismometer that recorded the crowds every step, jump, hop, and skip. All eyes were on the real-time waveforms when a clear indication of an earthquake scrolled on the data display − the budding future seismologists at the event identified this quake as a magnitude 1.2 earthquake along the San Jacinto fault zone.
May 17, 2004. A focus group to prioritize how to introduce 3D visualization tools into the 6th grade Earth science curriculum was held at the Birch Aquarium at Scripps (BAS), which included discussions between 6th grade teachers from the San Diego region, educational specialists from BAS and Aquatic Adventures and seismologist Debi Kilb (SIO). Specific Earth science learning units were evaluated. Future meetings will address how to handle the wide range of technical capabilities currently used in San Diego classrooms.
May 3, 2004. Graham Kent, director of the Visualization Center at Scripps, gave the presentation “The OptIPuter: A New Approach to Volume Visualization of Large Seismic Datasets” at the Offshore Technology Conference in Houston, Texas. Kent highlighted the advantages of scalable visualization, showing recent results from the GeoWall2 installed at IGPP. The notion of a 100 Megapixel display was a real winner with the crowd at Reliant Park. And as they say in Texas, the OptIPuter is definitely NOT “All hat and no cattle.”

The OptIPuter FY2005 Annual Progress Report and FY2006 Program Plan 38
2.B. Research Findings In Section 2.A, it is sometimes difficult to only cover research activities without referring to some research findings; however, given the NSF report outline, we attempt to separate out activities from findings.
2.B.1. Network and Hardware Infrastructure Findings 2.B.1.a. General Network and Hardware Infrastructure Findings CLUSTER INSTRASTRUCTURE…UIC (Leigh, Renambot, Verlo) spent a great deal of effort researching Digital Video Interface (DVI) optical cabling. Conventional copper DVI cables between computers and their displays are limited to relatively short distances. We designed the 100-Megapixel LambdaVision display with long-distance DVI optical cabling so that the computers can be more than 30 feet from the screens. This took a year of tests of various products and lengthy procurement (because of the cost), instead of the few weeks to months one might expect. However, this is a critical capability for deployment, so the time, effort and money were well spent. The LambdaVision display was “lit up” the week of July 18, 2005; see <www.OptIPuter.net/news/release_temp.php?id=25>
OPTIPUTER SOFTWARE RELEASES…OptIPuter network software is starting to be adopted by partner sites. Papadopoulos is distributing the “OptIPuter Gold Standard Software Release,” which consists of the Distributed Virtual Computer (DVC), the Photonic Inter-domain Negotiator (PIN), the Group Transport Protocol (GTP) and the Composite Endpoint Protocol (CEP).
2.B.1.b. UCSD Campus Testbed (includes SoCal OptIPuter sites) RAIN CAUSED ACQUISITION/INTALLATION DELAYS…In addition, an unseasonable rain event in San Diego caused immense damage to the new Calit2 building, pushing its completion date from January 2005 to August 2005. Lack of centralized deployment space during this period motivated distributed cluster installations at UCSD, but pushed the fiber and cluster installations in the Calit2 building to the last months of Year 3, just in time for iGrid 2005.
CHANNEL BONDING AS DEFINED BY SWITCH MANUFACTURERS IS INEFFECTIVE…The physical inter-lab infrastructure for OptIPuter was originally designed as multiple gigabit strands that used switch-defined (e.g., Link Aggregation Control Protocol [LACP]) aggregation protocols to achieve higher throughput. The balancing algorithms, which are proprietary, which determine what physical fiber of a channel-bonded link a particular packet should traverse, exhibited extremely poor throughput enhancements. For example, a 4Gb link rarely showed aggregate throughput of greater of than 1.5Gb, even with O(10) senders/receivers on each side of a link. This behavior comes about because the balancing algorithms were defined to operate with a large number of source/destination addresses (either IP or hardware MAC addresses) on either side of the channel-bonded link (usually 100:1 addresses:link) and became significantly less balanced with the small ratios used in the OptIPuter fabric (4:1). Channel-bonded Ethernet is now eliminated from our deployment strategy because of such poor performance. The UCSD OptIPuter fabric has moved to single 10GigE, instead of 4/8 channel-bonded GigE streams, for nearly all switch-to-switch links.
TCP/IP IS MORE FRAGILE THAN EXPECTED ON LARGE BANDWIDTH-DELAY NETWORKS…CAVEwave experiments illustrated the significant fragility of TCP/IP on long-distance networks, even when selective acknowledgement (so-called SACK) is enabled. Engineers from NASA, UCSD and UIC did trials on CAVEwave when it first became operational; TCP produced rates from 1-5 Gbps, but was unstable and UDP consistently produced rates on the order of 5Gb. However, even minor packet loss of 4-8 packets, or packet reordering by intermediate routers, causes TCP endpoints to react badly, dropping throughput by factors of 10 to 50. We continue to examine both the source of packet drops and packet reorderings, but TCP performance on such extreme networks needs further refinement (or replacement by other TCP-like protocols).
LUSTRE PARALLEL STORAGE PERFORMS WELL ON CAMPUS-EXTENT NETWORKS, BUT THE PERFORMANCE SPACE IS COMPLEX…OptIPuter initially deployed Parallel Virtual File System (PVFS) as a way to present clustered storage to applications. Read/write throughput was disappointing, especially in the multi-reader case. This year, we have been experimenting with Lustre to continue our effort to base-line storage capabilities. Single Lustre server/client pairs are able to deliver 75MB/sec (out of a possible 120MB/sec) on a single GigE in write mode. With multiple server/clients (servers cooperatively provide access to a single shared namespace), this figure grows approximately linearly. That is, 8 server/client pairs reading the same large (>20GB) file to eliminate cache effects, aggregate to nearly 500 MB/sec (~ 5Gbps). However, the characterization of the performance space is as

The OptIPuter FY2005 Annual Progress Report and FY2006 Program Plan 39
complicated as we expected. For example, the same 8 server/client pairs reading different 20GB files causes aggregate performance to drop by nearly a factor of 6. We believe that this is due to over-aggressive caching of servers where caches are prematurely filled and then data discarded. We are currently working with NCMIR researchers to use Lustre-based storage (as compared to PVFS-based) for read/write of their large visualization datasets. Data is housed across campus at the UCSD/JSOE engineering building and visualization is done at NCMIR, located in the School of Medicine, on their BioWall tiled display.
STATE-OF-THE-ART NETWORK MANAGEMENT TOOLS LACK CAPABILITY NEEDED FOR THE OPTIPUTER TESTBED…The OptIPuter testbed needs to view the network as a managed and reconfigurable entity. However, most networking tools available to us expect a static physical topology and significant manual data entry to classify and define a network topology for monitoring and managing. We have been building software that discovers the network topology (automatically discovering switch-to-switch connections and switch-to-host connections). Surprisingly, efficient discovery algorithms are the content of recent research papers with few implemented protototypes. We are currently able to discover and classify automatically almost all OptIPuter connections (6 different switch vendors and 5 different endpoint vendors) in just a few minutes from a single probe point. It is essential to have this capability, as physical hardware is located in several labs and can be moved without any notification. The Glimmerglass all-optical switch allows us to physically reconfigure the network, and new network technologies are introduced rapidly. We have introduced a central point from which all switches can download configurations (for setting VLANs, for example) − our probing capability coupled with centralized control will allow us to accurately configure different physical and logical topologies.
2.B.1.c. Metro Chicago Testbed METRO CHICAGO NETWORKING…The current OMNInet testbed has been used to conduct trials of data services on individually addressable and adjustable wavelengths (e.g., 10Gb services). OMNInet supports 24*8 10GigE wavelength-based channels. The testbed is based on dedicated fiber fully qualified for wavelength-based services. The control and management channels are provisioned out-of-band on separate fiber. Computational clusters are directly connected to OMNInet to show that this type of agile optical networking enables a wide range of powerful, advanced applications.
An extended OMNInet optical metro research testbed is currently being designed, developed and implemented in Chicago that will allow research and experimentation with not only multiple new technologies and techniques related to next-generation optical networking, but also with traditional technologies such as SONET and TDM. It is further described in Section 6, the OptIPuter FY2006 Program Plan.
2.B.1.d. National Testbed (via CAVEwave) Getting reasonable performance on the first national-scale 10GigE network was more of a challenge than we expected. Our previous experience was between Chicago and Amsterdam with matched equipment (OC-192 via ONS 15454s and Force10s, and HP Itaniums with Intel 10GigE NICs, which yielded ~7Gb performance), whereas CAVEwave between Chicago and San Diego had heterogeneous equipment (Extreme, Cisco, Force10, Foundry).
OptIPuter partner NASA, working with UIC and UCSD, was getting sub-gigabit performance over CAVEwave, especially with multiple streams. After stripping off the extraneous gear and verifying the circuit was actually working to specification, we rebuilt the connectivity using just Cisco and Force10 equipment. Then, NASA discovered a host of undocumented problems with the 10GigE Chelsio NICs, which are now better documented (by us). On the positive side, the cost of 10GigE infrastructure is decreasing, per our predictions years ago. We just didn’t anticipate it would be so much more difficult than 1GigE infrastructure, which rolled easily four years ago.
We are now planning a host of experiments with the CAVEwave and our national and international OptIPuter partners via Chicago and Seattle, many of which will be demonstrated at iGrid 2005.
We also learned that some lower-level hardware experiments require OC-192, not 10GigE, connectivity. For this purpose, we are arranging to go between Chicago and San Diego over CA*net4 and Pacific Wave, and the TeraGrid as well, to conduct multiple 10Gb experiments. The installation of Nortel HDXc equipment in Chicago and Seattle (mostly paid for by OptIPuter affiliate partner CANARIE) will enable a broader class of OptIPuter experiments in Years 4 and 5.
2.B.1.e. International Testbed (via SURFnet and TransLight) This past year, we learned much about procuring international circuits, and new ways to connect at Layer 1 and
The OptIPuter FY2005 Annual Progress Report and FY2006 Program Plan 40
Layer 2. One of EVL/UIC’s two NSF IRNC-funded OC-192 links, and a SURFnet-funded OC-192, go between Chicago and Amsterdam, and are currently connected to Force10s and ONS 15454s at both ends. In August, both these links will instead be connected to a CANARIE-owned HDXc at StarLight and a SURFnet-owned HDXc at NetherLight, and will operate as 10Gb lambdas. We aim to manage both these circuits as lambdas, tracking models defined by the Global Lambda Integrated Facility (GLIF <www.glif.is>) as they develop. Our express goal is to provide science, engineering, and education production application access to Layer-2 1GigE vLANs, 10GigE vLANs and Layer 1 OC-192 circuits. We are allowed by NSF to encourage the development and testing of new protocols and policies that encourage usage. The challenge, of course, is managing them in a science-friendly, somewhat scalable way. We are, of course, working with OptIPuter affiliate partner CANARIE on using their User Controlled LightPath (UCLP) software in addition to EVL/UIC-developed PIN, and will encourage adoption/evaluation of these technologies to achieve OptIPuter, GLIF and NSF goals.
The Nortel HDXc equipment at NetherLight and StarLight will enable the creation of a richer fabric as more GLIF circuits are enabled. Several OptIPuter and OptIPuter-like iGrid 2005 projects will exploit this new functionality.
2.B.1.f. Optical Signaling, Control and Management The 3rd annual OptIPuter Backplane (a.k.a. Network) Architecture Workshop was held January 25, 2005. Presentations can be found at <www.OptIPuter.net/events/presentation_temp.php?id=20>.
2.B.2. Software Architecture Research Findings 2.B.2.a. System Software Architecture We have made solid progress in realizing the OptIPuter system software architecture. Because the architecture successfully integrates Globus primitives, optical network configurations, new protocols, and supports higher level layers such as visualization and applications without change, we have continued to make steady progress without disruption. We find the architecture is sufficient to enable rapid innovation and development in a wide range of research areas. We further find that integration of the resulting innovative technologies is possible at modest effort to support demonstrations (such as at iGrid 2005 in September) and in the OptIPuter “Gold roll” shared project software infrastructure.
2.B.2.b. Real-Time Capabilities UCI (Kim, Jenks) formulated an extension of the TMO model to suit real-time wide-area network (WAN) applications, called Distance-Aware TMO (DA-TMO).
We successfully designed top-level resource management and allocation schemes to make real-time DVCs (RT-DVCs) work within the OptIPuter infrastructure, which have been documented in the paper “A Framework for Middleware Supporting Real-Time Wide-Area Distributed Computing” in the Proceedings of the Tenth IEEE International Workshop on Object-Oriented Real-Time Dependable Systems (WORDS 2005), Sedona, AZ, 2005.
We found that the Linux version of TMOSM behaves very similarly to the Windows version on uni-processor nodes, documented in the paper “A Linux-Based Implementation of a Middleware Model Supporting Time-Triggered Message-Triggered Objects” in the Proceedings of 8th IEEE International Symposium on Object-oriented Real-time distributed Computing (ISORC 2005), Seattle, WA, 2005. Subsequently, we extended a middleware prototype that supports real-time distributed computing object-structured applications, TMOSM, to work effectively on clusters.
We have also started construction of a remote-control application demonstration.
2.B.2.c. Data Storage UCSD’s (Chien) idea to exploit the flexible redundancy possible with LDPC (Erasure) codes to support large-scale storage aggregation for performance is a major success. Dramatic performance increases of 15-times have been demonstrated for OptIPuter workloads – large read-dominated access to scientific datasets. Flexible redundancy can also be exploited to reduce the variability in access latency, 5-times. Both these benefits can be achieved with moderate static size (2-3 times) and dynamic bandwidth (1.5 times) overheads. We plan to write up our results in the coming months.

The OptIPuter FY2005 Annual Progress Report and FY2006 Program Plan 41
2.B.2.d. Security ISI/USC (Bannister, Touch) determined that TCP attack susceptibility is related to the square of the increase in link bandwidth, highlighting the criticality of the problem in the OptIPuter high-bandwidth environment. It was also determined that impediments to IPsec deployment for high-speed networks are based on several distinct issues (Anonsec, Triage, Fastsec), and partitioned efforts to address them separately with minimal extension to and impact on existing protocols.
ISI will design and implement variant IPsec configurations to demonstrate Triage. We will test its functionality on the OptIPuter, evaluate its performance, and disseminate the results in an archival publication. We will also design and implement variant IPsec configurations to demonstrate FastSec. We will test the software and deploy it on the OptIPuter. And, we will develop scripts to demonstrate the use of the X-Bone to deploy lambda links as overlay tunnels in the OptIPuter system.
UCI (Goodrich) presented two new approaches to improve the integrity of network broadcasts and multicasts with low storage and computation overhead. The first approach is a leap-frog linking protocol for securing the integrity of packets as they traverse a network during a broadcast, such as in the setup phase for link-state routing. This technique allows each router to gain confidence about the integrity of a packet before passing it on to the next router; hence, ot allows many integrity violations to be stopped immediately in their tracks. The second approach is a novel key pre-distribution scheme that can be used in conjunction with a small number of hashed message authentication codes (HMACs), which allows end-to-end integrity checking as well as improved hop-by-hop integrity checking. These schemes are suited to environments, such as in ad hoc and overlay networks, where routers can share only a small number of symmetric keys. The results are published in the Goodrich paper “Leap-Frog Packet Linking and Diverse Key Distributions for Improved Integrity in Network Broadcasts” in the 2005 IEEE Symposium on Security and Privacy.
UCI (Goodrich) introduced novel techniques for organizing the indexing structures of how large datasets are stored so that alterations from an original version can be detected and the changed values specifically identified, without any additional storage needed. Results are published in the Atallah paper “Indexing Information for Data Forensics” at the 3rd Applied Cryptography and Network Security Conference.
High-value rare-event searching is arguably the most natural application of grid computing, where computational tasks are distributed to a large collection of clients (which comprise the computation grid) in such a way that clients are rewarded for performing tasks assigned to them. Although natural, rare-event searching presents significant challenges for a computation supervisor, who partitions and distributes the search space out to clients while contending with “lazy” clients who don’t do all their tasks, and “hoarding” clients who don't report rare events back to the supervisor. UCI (Goodrich) provides schemes, based on a technique we call chaff injection, for efficiently performing uncheatable grid computing in the context of searching for high-value rare events in the presence of coalitions of lazy and hoarding clients. Results are published in the paper “Searching for High-Value Rare Events with Uncheatable Grid Computing” at the 3rd Applied Cryptography and Network Security Conference.
UCI (Goodrich) developed a framework for designing efficient distributed data structures for multi-dimensional data. Our structures, which we call skip-webs, extend and improve previous randomized distributed data structures, including skipnets and skip graphs. Our framework applies to a general class of data querying scenarios, which includes linear one-dimensional data, such as sorted sets, as well as multi-dimensional data, such as d-dimensional octrees. Findings are published in the Arge paper “Skip-Webs: Efficient Distributed Data Structures for Multi-Dimensional Data Sets” at the 24th ACM Symposium on Principles of Distributed Computing.
2.B.2.e. End-to-End Performance Modeling SAGE performance data is generated in the NetLogger file format for easy collection and post-mortem analysis. Data collection addresses both system metrics provided by the Ganglia clustering monitoring system (such as CPU load, memory usage, and network utilization), and application metrics provided directly from the SAGE environment. Monitoring allows relating user actions (start and stop of application, window position, window scaling, etc.) to change in performance values. Early evaluations show that the SAGE display processes have little CPU usage and can process actual pixel streams of up to 700Mb out of a Gb interface. This finding will influence the design of the next-generation visualization system where small computers (similar to a laptop) equipped with a Gigabit interface can be strapped directly to the back LCD panels, getting closer to one of the OptIPuter’s design goals; i.e., a network-attached frame buffer for high-resolution visualization over optical networks.

The OptIPuter FY2005 Annual Progress Report and FY2006 Program Plan 42
Prophesy performance data generated from analyzing Vol-a-Tile on the TAMU OptIPuter node indicated some memory leaks in the application, which are being addressed in the new Vol-a-Tile version. Further, Vol-a-Tile performance has been investigated under different scenarios, indicating that the application has negligible performance degradation when data was accessed from remote OptiStores over a GigE LAN versus the local OptiStores. Further work is underway to conduct similar performance experiments over CAVEwave.
2.B.2.f. High-Performance Transport Protocols LAC/UIC (Grossman) will continue development of Composible UDT, a toolkit for the rapid development of high-performance network transport protocols, and SOAP*, high-performance web services built over UDT. He will also begin to develop high-performance algorithms for outlier detection using UDT and SOAP*.
UCSD (Chien) Group Transport Protocol (GTP) has been demonstrated to be a robust, flexible protocol for networks with high-bandwidth cores and dedicated lambdas. GTP managed network capacity fairly (max-min fair solutions) and has been proven to converge analytically, simulated to converge, and empirically demonstrated as stable in a range of environments.
UCSD (Chien) Composite-Endpoint Protocol (CEP) has been demonstrated to achieve efficient aggregation across heterogeneous resources, efficient aggregation to a large number of resources (45 sender nodes), high absolute performance (32Gbps), and efficient exploitation of data access freedom.
UIC (Leigh, Renambot) LambdaStream is a reliable rate-based protocol that provides two main innovations over prior work in the area. First, it attempts to identify the cause of any packet loss so that it does not unnecessarily throttle back its transmission rate. Second, it attempts to provide early acknowledgment so that latency is minimized on long-distance networks. These two characteristics are needed to support real-time high-bandwidth visualization streaming applications. Results have validated LambdaStream’s algorithm, however accurate real-time bandwidth estimation (a crucial component of this approach) remains a challenge due to the poor resolution of Linux’s system clock. Furthermore it is anticipated that as multiple simultaneous streams operate over a single host system, a high-level host-bandwidth manager will be needed to enable completing LambdaStreams to behave efficiently. This is currently under investigation.
2.B.3. Data, Visualization and Collaboration Research Findings 2.B.3.a. Data and Data Mining Research UIC (Grossman) demonstrated that significant end-to-end performance improvement for distributed data mining could be obtained by deploying clustering and classification algorithms as web services using a XML/TCP-based control channel and a delimited format/UDT data channel. In experimental studies, a performance speed-up of over 10-100 times or more was obtained. A paper describing this work has been submitted for publication.
UIC (Grossman) completed preliminary investigations improving the performance of high-performance “joins” of multiple data streams based on common keys by using group transport protocols. A paper describing this work is under preparation.
UCI (Smyth) demonstrated that simultaneous clustering and alignment of sets of curves (using new algorithms described in Gaffney and Smyth [2005, in press]) provides significantly more accurate results than previous state-of-the-art techniques for curve clustering. Using these algorithms to cluster 50 years of cyclone trajectory data (in both the Atlantic and Pacific) has resulted in a number of significant scientific findings (Gaffney et. al., 2005, submitted). These findings include a quantitative validation that general circulation models (GCM) and observational data both yield cyclone trajectories that are statistically similar, and the discovery of systematic cluster-dependent variability from year to year in cyclones in the north Western Pacific region.
UCI’s hidden Markov model approach to modeling rainfall data is being adopted and applied by atmospheric science collaborators at IRI/Climate Prediction and at CSIRO in Australia (Robertson et al, 2004; Kirshner et al, 2005, submitted). The methodology has been applied to forecasting and simulating rainfall data from Australia, Africa, and India and has resulted in characterization of “climate states” that assist atmospheric scientists in interpreting and understanding large volumes of observed rainfall data (e.g., 1950-2002). A software toolbox is publicly available at <www.datalab.uci.edu/software/mvnhmm>.

The OptIPuter FY2005 Annual Progress Report and FY2006 Program Plan 43
2.B.3.b. Visualization/Collaboration Tools UIC’s SAGE framework reached a stable implementation and is being deployed to all OptIPuter collaborators and partners. SAGE supports visualization at multi-ten-Megapixel resolution with interactive frame rates using gigabit local-area networks. SAGE is scalable in terms of the amount of visualization data and the visualization resolution. SAGE addresses the heterogeneity problem by decoupling graphics rendering from graphics display so that visualization applications developed on various environments can easily migrate into SAGE by streaming their pixels into the virtual frame buffer. The output of arbitrary MxN pixel rendering cluster nodes can be dynamically routed to XxY pixel display screens, permitting user-definable layouts on the display. The dynamic pixel-routing capability of SAGE allows users to freely move and resize each application’s imagery over the tiled displays in run-time, tightly synchronizing the multiple visualization streams to form a single stream. Users can simultaneously run multiple visualization applications in the SAGE framework without losing dynamic pixel-routing capability, while using selectable network protocols adapted for each application; e.g., UDP for video streaming, TCP for mapping application, and LambdaStream for rendered animations.
SAGE running on EVL/UIC LambdaVision SAGE running on NCMIR/UCSD BioWall
On July 28, 2005, two EVL/UIC students interning at NCMIR/UCSD for the summer used SAGE to stream information from NCMIR to SIO/UCSD. Using a NCMIR’s high-definition camera and an EVL/UIC-developed Teravision box to stream computer output, multiple streams of information were sent across campus. SAGE was used to arbitrarily open “windows” on SIO’s IBM T221 display system in which to view the various streams. (Each T221 screen is 9-Megapixels, equivalent to a 2x2 tiled display, providing the equivalent of a 4x2 tiled display.) On the left screen is a video from the camera in the student’s NCMIR office; on the right is a NASA surface temperature image stored on a NCMIR cluster. If you look closely, you can see that the student’s monitor has an interface with which he can remotely control the image.

The OptIPuter FY2005 Annual Progress Report and FY2006 Program Plan 44
The SAGE user-interface matured, and now reliably supports the scaling and movement of any window on the SAGE display, while providing the user with performance monitoring (frame rates, bandwidth for rendering and display nodes). Performance monitoring uses the NetLogger file format for post-mortem analysis. Implementation is underway to support basic collaboration features: visualization of remote displays with the LambdaCam software, instant messaging between users, and playback of recorded sessions.
SAGE now drives UIC/EVL’s LambdaVision display as well as the NCMIR BioWall and SIO IBM T221 displays, displaying volume data, large 2D maps, pre-rendered high-resolution animation, and video streams for HDV cameras. Experiments are underway over the OptIPuter wide-area network infrastructure.
Evaluations show that the SAGE display processes have little CPU usage and can process actual pixel streams of up to 700Mbps out of a gigabit interface. This finding will influence the design of the next-generation visualization system where small computers equipped with a gigabit interface can be attached directly to the back LCD panels, getting closer to one of the OptIPuter’s design goals − i.e., creating a network-attached frame buffer for high-resolution visualization over optical networks.
USC (Thiébaux) demonstrated that although GVU Grid-based browsing works effectively across multiple cities on the OptIPuter testbed, several system-level obstacles still need to be addressed to show significant scalability with an interactive data-filtering pipeline. Cluster administration policy conventions artificially constrain the implementation of cluster-to-cluster transport by funneling data through each head node, presumably due to security concerns. Host-interface naming conventions are obscure and lack interoperability between sites. Cluster scheduler software, required for co-allocation of selected nodes for “active storage,” artificially constrains the size of environment variables used to describe pipeline connectivity.
All together, these obstacles prohibit the scaling of the GVU pipeline beyond 30 nodes, and require significant thought and redesign of the pipeline deployment layer, both to work around the given limitations and to communicate the network requirements to the humans in the loop. For volumes on the order of SCEC simulation data (20GB per step), interactivity cannot be achieved until the pipeline back-end is scaled up to hundreds of nodes. This is because interactive filtering entails potentially extensive computations on the data for output, as opposed to simply feeding blocks of data from the disk to the network. Furthermore, when such small node counts are applied to large volumes, load balancing problems have minimal impact on pipeline performance, due to the fact that a large number of data fragments distributed over a small number of nodes results in a fairly balanced task distribution.
2.B.3.c. Volume Visualization Tools UIC Computer Science students Nicholas Schwarz and Raj Singh spent the 2005 summer as interns at NCMIR to integrate OptIPuter technologies into NCMIR’s workflow. The goal is to design the next-generation volume rendering technologies (called Ethereon) for large correlated microscopy 3D volumes, involving high-resolution imagery from remote electron microscope instruments and other cyberinfrastructure resources.
Correlated microscopy, bridging techniques such as multi-photon microscopy and electron tomography, is a key methodology for acquiring the necessary multi-scale data in order to fill in the resolution gaps between gross structural imaging and protein structure: data which is central to the elucidation of systems biology.
Using high-resolution tiled displays built at EVL, NCMIR, and UCI, and stereoscopic graphics displays, scientists will be able to explore large datasets using volume visualization in order to facilitate the highly collaborative and complex task of multi-scale correlated microscopy
2.B.3.d. Visualization and Data Analysis Development NCSA (Cox and Welge) are working with SIO scientists and providing access to NCSA’s Altix for supercomputer
EVL students Schwarz and Singh on a VTC using SAGE to put multiple screens on the BioWall tiled display.

The OptIPuter FY2005 Annual Progress Report and FY2006 Program Plan 45
simulations and visualizations. Porting codes has taken more time than originally thought. Kraig Winters has still not completed a large CFD simulation as planned in January. We have chosen to prototype and work with other data in the interim, and are using large datasets from UCSD astrophysicist Michael Norman whose codes run on the NCSA systems. We have been solving multiple data analysis and visualization problems by applying our techniques to first star and supernova adaptive mesh refinement (AMR) simulations. We had difficulties in preprocessing AMR data but have managed to generate very high-resolution visualizations that we will use in the OptIPuter testbed. This research provides smooth visualization animations for streaming over a remote OptIPuter node to another site, and will be demonstrated at iGrid 2005. Many of these visualizations will also be shown at SIGGRAPH, to be played back locally on our high-definition stereo systems. NCSA/UIUC needs to procure some new 10GigE network hardware for the HD stereo systems to be completely compatible with the OptIPuter network environment.
We discovered that the NCSA stereo image playback software can be embedded in SAGE and will be used to push pixels through an OptIPuter cluster when all hardware/software is finally in place. Setting up the hardware in the Altix environment has taken more time than expected, but is currently operational. NCSA is moving into a new building in August and the final hardware will be installed to enable OptIPuter-enabled high-definition stereo systems and tiled displays.
NCSA/UIUC is also in the process of “OptIPuterizing” the NCSA ACCESS facility in Washington DC and the TRECC facility in DuPage, IL. Testing for iGrid will begin this month.
Michael Welge’s Automated Learning Group (ALG) is now installing and testing data analysis software on the NCSA Altix. This has taken more time than anticipated given the fact that the NCSA Altix is a production machine, and testing new procedures within this large production environment requires a special configuration of the Altix. AMR algorithms require extraordinary memory requirements for pre-processing and analysis of the data.
A frame from high-definition stereo oceanographic simulation animation shown at SC 2004
by SIO oceanographer Kraig Winters with Donna Cox, et. al.
2.B.3.e. Photonic Multicasting UIC (Leigh and Renambot) conducted experiments to analyze the performance of 1Gb electronic multicast versus optical multicast (using a Glimmerglass switch). Initial tests suggest that electronic switches do not scale up to the high data rates that can be supported by optical multicast. More investigation is needed to determine the cause of the bottleneck. We also gained a deeper understanding of the characteristics of the underlying transmission protocols that are needed to support optical multicast, where full-duplex communication between the sender and the multicast receivers is not available. We are currently designing an application-level transport protocol using Forward Error
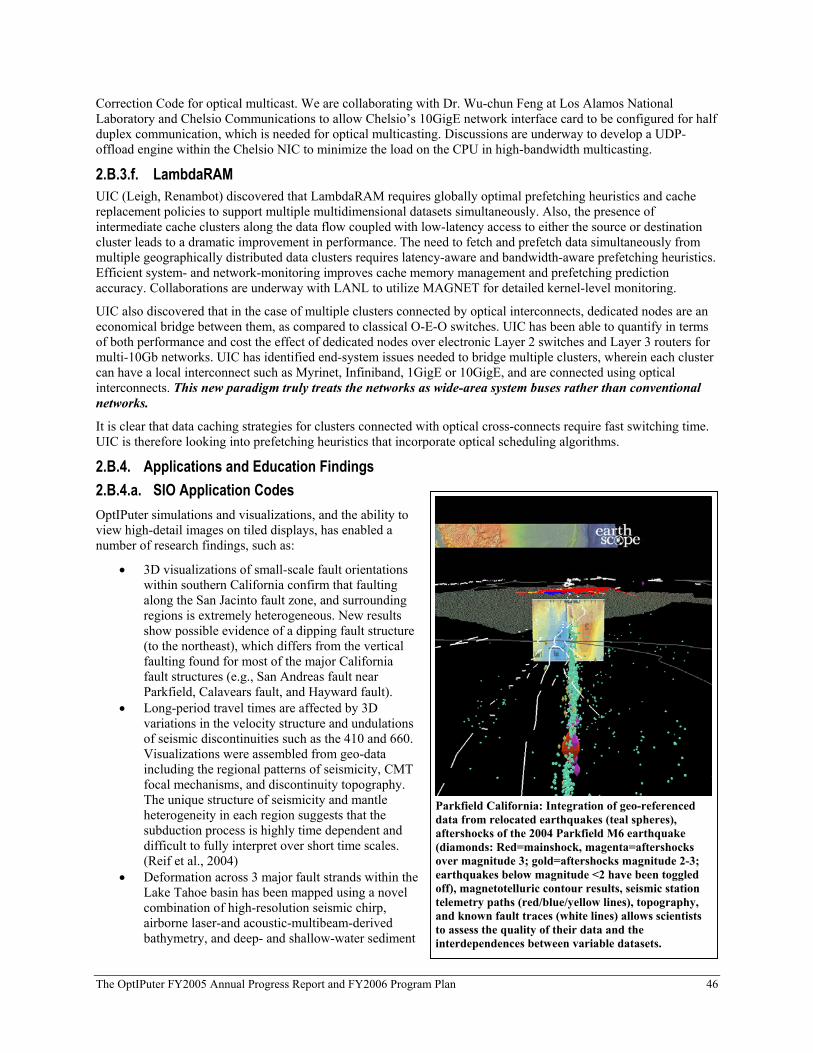
The OptIPuter FY2005 Annual Progress Report and FY2006 Program Plan 46
Correction Code for optical multicast. We are collaborating with Dr. Wu-chun Feng at Los Alamos National Laboratory and Chelsio Communications to allow Chelsio’s 10GigE network interface card to be configured for half duplex communication, which is needed for optical multicasting. Discussions are underway to develop a UDP-offload engine within the Chelsio NIC to minimize the load on the CPU in high-bandwidth multicasting.
2.B.3.f. LambdaRAM UIC (Leigh, Renambot) discovered that LambdaRAM requires globally optimal prefetching heuristics and cache replacement policies to support multiple multidimensional datasets simultaneously. Also, the presence of intermediate cache clusters along the data flow coupled with low-latency access to either the source or destination cluster leads to a dramatic improvement in performance. The need to fetch and prefetch data simultaneously from multiple geographically distributed data clusters requires latency-aware and bandwidth-aware prefetching heuristics. Efficient system- and network-monitoring improves cache memory management and prefetching prediction accuracy. Collaborations are underway with LANL to utilize MAGNET for detailed kernel-level monitoring.
UIC also discovered that in the case of multiple clusters connected by optical interconnects, dedicated nodes are an economical bridge between them, as compared to classical O-E-O switches. UIC has been able to quantify in terms of both performance and cost the effect of dedicated nodes over electronic Layer 2 switches and Layer 3 routers for multi-10Gb networks. UIC has identified end-system issues needed to bridge multiple clusters, wherein each cluster can have a local interconnect such as Myrinet, Infiniband, 1GigE or 10GigE, and are connected using optical interconnects. This new paradigm truly treats the networks as wide-area system buses rather than conventional networks.
It is clear that data caching strategies for clusters connected with optical cross-connects require fast switching time. UIC is therefore looking into prefetching heuristics that incorporate optical scheduling algorithms.
2.B.4. Applications and Education Findings 2.B.4.a. SIO Application Codes OptIPuter simulations and visualizations, and the ability to view high-detail images on tiled displays, has enabled a number of research findings, such as:
• 3D visualizations of small-scale fault orientations within southern California confirm that faulting along the San Jacinto fault zone, and surrounding regions is extremely heterogeneous. New results show possible evidence of a dipping fault structure (to the northeast), which differs from the vertical faulting found for most of the major California fault structures (e.g., San Andreas fault near Parkfield, Calavears fault, and Hayward fault).
• Long-period travel times are affected by 3D variations in the velocity structure and undulations of seismic discontinuities such as the 410 and 660. Visualizations were assembled from geo-data including the regional patterns of seismicity, CMT focal mechanisms, and discontinuity topography. The unique structure of seismicity and mantle heterogeneity in each region suggests that the subduction process is highly time dependent and difficult to fully interpret over short time scales. (Reif et al., 2004)
• Deformation across 3 major fault strands within the Lake Tahoe basin has been mapped using a novel combination of high-resolution seismic chirp, airborne laser-and acoustic-multibeam-derived bathymetry, and deep- and shallow-water sediment
Parkfield California: Integration of geo-referenced data from relocated earthquakes (teal spheres), aftershocks of the 2004 Parkfield M6 earthquake (diamonds: Red=mainshock, magenta=aftershocks over magnitude 3; gold=aftershocks magnitude 2-3; earthquakes below magnitude <2 have been toggled off), magnetotelluric contour results, seismic station telemetry paths (red/blue/yellow lines), topography, and known fault traces (white lines) allows scientists to assess the quality of their data and the interdependences between variable datasets.

The OptIPuter FY2005 Annual Progress Report and FY2006 Program Plan 47
cores. On the basis of these measurements, there exists the potential for a large, seiche wave-generating M7 earthquake similar to 3 k.y. Late Pleistocene and Holocene vertical deformation rates within the Tahoe basin are characteristic of Basin and Range faulting and place the Tahoe basin within the western limits of the extensional Basin and Range province (Kent et al., 2005).
• Collaborations using visualizations techniques to explore geophysical data continues to move many projects forward. George Jiracek (SDSU): “[Visualizations] enabled me to share the combined datasets with fellow researchers at a workshop in New Zealand last month; it has also enabled me to visualize 3D relationships like never before. This has created a new research direction for me aimed at understanding the implications of fluid occurrence and connectivity below the brittle-ductile transition and it’s affects on earthquake nucleation. The 3D visualization has not contributed directly to this understanding; what it did was open my mind to 3D relations and new insights.”
2.B.4.b. SDSU Application Codes Numerous news reports, trade journal write-ups, and traveling displays have been generated from our disaster aid efforts with the Indonesian tsunami response and NASA World Wind global imagery. Constructing the images for the servers and serving the data were all done on OptIPuter equipment and assisted by high-bandwidth networks provided through the OptIPuter project. Without OptIPuter, these enormous files and hybrid imagery products could not be transferred from machine to machine, nor could the servers be constructed to serve regional and global imagery to the world.
2.B.4.c. NCMIR/BIRN Application Codes NCMIR (Ellisman, Lee) has found that visualization tool kits, operating systems, and hardware drivers still have limited or buggy support for 64-bit operating systems.
Focus is on the transmission of high-definition television (HDTV) microscope images. Latency is one of the greatest challenges for HDTV video teleconferencing. The computational and network demands are significantly greater and cause latency of video transmissions between 2 sites. The delays introduced with the process of video encoding and decoding are compounded by network latency, totaling approximately 1/3 of a second in early tests.
NCMIR did find that the increased I/O capabilities of the AMD Hypertransport chip architecture permits us to simultaneously send and receive HDTV (1920x1080@24fps) from the same machine. This was not possible using Intel chip sets, resulting in unacceptable performance.
2.B.4.d. Education and Outreach Activities UCSD/PREUSS SCHOOL…UCSD/SIO (Kilb) found that using the GeoWall stereo system in the Preuss classroom helps engage a larger population of the students. Also, pre-lessons that introduce kids to the basic concepts and data used in 3D interactive visualization lessons are essential to the success of the learning modules. And, the OptIPuter technology available to classroom teachers, and the teacher’s ability and willingness to easily use the technology, needs to be continually assessed. Over the duration of the OptIPuter project we have witnessed much progress in seamlessly merging the technology to fit the needs of the teachers and vice versa.
LINCOLN ELEMENTARY SCHOOL IN OAK PARK, IL…UIC (Moher) is in the process of analyizing student learning and affective measures for RoomQuake, HelioRoom, and RoomBugs intervention. Preliminary analysis supports significant claims of effectiveness in student acquisition of science inquiry skills and conceptual understanding, as well as significant changes in student attitudes regarding participation in scientific investigations. In RoomQuake intervention, fifth-grade students demonstrated high levels of mastery of the seismological practice of using multiple seismograms to determine the epicenter and magnitude of simulated earthquakes, albeit with lesser ability to translate physical enactment to paper-and-pencil representations of the process of trilateration. Students showed very strong improvements in understanding the temporal, intensity and positional distributions of seismic events. We are currently analyzing video protocols of student participation in multiple procedural roles (e.g., seismogram reader, observation recorder, trilateration enactor) over the course of the 23 events that comprised the unit, with the goal of characterizing the development of the classroom “community of practice” surrounding seismological practice.
In the HelioRoom intervention, third-grade students were able to resolve, over a 2-week period, the identities of 6 of the 9 planets using a combination of occlusion and orbital period data and transitive inferences. We are analyzing student written observations and inferences (captured on 100+ time-stamped “idea cards” posted on the classroom wall) to characterize the growth of the aggregate knowledge base over time. An important “lesson learned” from the

The OptIPuter FY2005 Annual Progress Report and FY2006 Program Plan 48
HelioRoom intervention was the need to design scaffolds for managing and indexing large collections of observations; in several cases, the data required to infer planetary identities were available from student observations, but students were not able to use them due to the sheer number of observations and lack of an a priori imposed representational structure.
In the RoomBugs intervention, urban students showed significant gains in affective measures related to their self-identity as empowered investigators. For example, “I would rather collect data myself than to have a teacher tell me the answer. Current analysis focuses on coding student rationales for manipulation of experimental parameters.
UCSD/SIO OUTREACH ACTIVITIES…UCSD/SIO (Kilb) notices an obvious need for additional teacher education programs in the southern California region; SIO’s annual Earthquake Education Workshop (now in its third year) has reached maximum enrollment capacity with 40 people on the wait list this year. It is also clear that researchers are more apt to participate in on-campus Education & Outreach activities (avoiding the commute to off-site schools), and our ability to accommodate these needs are improving, such as the OptIPuter link from SIO to Preuss School. UCSD/SIO’s Outreach efforts for the past three years has focused on including under-represented students (e.g., all girls’ science classes, Native American scholars, etc.), which has helped increase Kilb’s understanding of the needs of these students and SIO’s ability to help with their scientific education.
MINNESOTA SCIENCE CENTER AND UIC/EVL…The Minnesota Science Museum and the National Center for Earth Surface Dynamics (NCED) will be evaluating the use of OptIPuter technology to teach geoscience in a museum setting once the show closes this summer.
ANNUAL OPTIPUTER MEETING: An All Hands Meeting and Open House was held January 26-28, 2005. A web site with PPTs can be found at <http://www.OptIPuter.net/events/presentation_temp.php?id=19>.
IGRID 2005 AND GLIF…OptIPuter partners and affiliate partners are conducting a large percentage of the demonstrations, to showcase both research achievements and the integration of their component parts into a cohesive, layered cyberinfrastructure.

The OptIPuter FY2005 Annual Progress Report and FY2006 Program Plan 49
2.C. Research Training There is clearly a critical mass of professors and students at 15 institutions (UCSD, NU, SDSU, TAMU, UCI, UIC, UIUC/NCSA and USC as well as USGS EROS, NASA, CANARIE, UvA, SARA, KISTI and AIST), involved with the OptIPuter, as indicated by this annual report, facilitating greater advances than a single-investigator effort would afford. Moreover, the project is local, regional, national and international in scope. As noted in Section 2.B (Research Findings), all the people working on OptIPuter-related projects are involved in furthering the research, taking a “systems-wide” view of the project, which is clearly interdisciplinary in nature. It is our hope that our students benefit most, and be in high demand by the commercial sector for R&D jobs when they graduate. The OptIPuter has already gained international recognition as a major driving force for the development of LambdaGrids. Interest comes from not only computer scientists and network engineers, but also from discipline scientists who are facing unprecedented challenges dealing with large datasets in the 21st century. The OptIPuter involves academicians, graduate students, undergraduates, K-12 teachers and students, and industry. Research papers are being published and presentations are being given at professional conferences. 2.D. Education/Outreach The OptIPuter’s primary education and outreach activities include web documentation, journal articles, and conference presentations and demonstrations. In addition to participation at major computer conferences, such as IEEE ACM/IEEE Supercomputing, team members are active at networking conferences, including Internet2 meetings, CENIC meetings, and international conferences and workshops (e.g., annual GLIF LambdaGrid Workshops). In addition, SIO/UCSD (Kilb) and EVL/UIC (Moher) are pro-actively involved in formal and informal education and outreach activities for children and young adults. The OptIPuter is receiving a great deal of media attention, and there have been a number of news articles describing it, which can be found on our website <http://www.OptIPuter.net/news/index.html>. We also provide PowerPoint slides and other promotional material to collaborators to give presentations at education conferences, government briefings, etc.

The OptIPuter FY2005 Annual Progress Report and FY2006 Program Plan 50
3. OptIPuter Publications and Products
3.A. Journals/Papers Arge, L., D. Eppstein, M.T. Goodrich, “Skip-Webs: Efficient Distributed Data Structures for Multi-Dimensional Data Sets,” 24th ACM Symposium on Principles of Distributed Computing (PODC), 2005.
Atallah, M.J., M.T. Goodrich, R. Tamassia, “Indexing Information for Data Forensics,” 3rd Applied Cryptography and Network Security Conference (ACNS), Lecture Notes in Computer Science 3531, Springer, 2005, pp. 206-221.
Du, W., M.T. Goodrich, “Searching for High-Value Rare Events with Uncheatable Grid Computing,” 3rd Applied Cryptography and Network Security Conference (ACNS), Lecture Notes in Computer Science 3531, Springer, 2005, pp. 122-137.
Farrell, J., R.B. Smith, D. Kilb, E. Morikawa, “The Yellowstone GEO GIS Database: Facilitating Integrated Research and Data Distribution for Yellowstone Geoscience,” GEON Meeting, San Diego, May 2005, <www.geongrid.org/AM05/presentations.php>
Gaffney, S., A.W. Robertson, P. Smyth, S. Camargo, M. Ghil, “Probabilistic Clustering of Extra-Tropical Cyclones using Regression Mixture Models,” Monthly Weather Review, submitted, 2005.
Goodrich, M.T., “Leap-Frog Packet Linking and Diverse Key Distributions for Improved Integrity in Network Broadcasts,” Proceedings of IEEE Symposium on Security and Privacy (SSP), 2005, pp. 196-207.
Grossman, Robert L., Yunhong Gu, Dave Hanley, Xinwei Hong and Babu Krishnaswamy, “Experimental Studies of Data Transport and Data Access of Earth Science Data over Networks with High Bandwidth Delay Products,” 2005, (submitted for publication).
Grossman, Robert, Donald Hamelberg, Pavan Kasturi, and Bing Liu, “An Empirical Study of the Universal Chemical Key Algorithm for Assigning Unique Keys to Chemical Compounds,” Journal of Bioinformatics and Computational Biology, 2004, to appear.
Gu, Yunhong, Robert L. Grossman, “Optimizing UDP-Based Protocol Implementations,” Proceedings of the Third International Workshop on Protocols for Fast Long-Distance Networks (PFLDnet 2005), Lyons, France, February 3-4, 2005, <http://www.ens-lyon.fr/LIP/RESO/pfldnet2005>.
Gu, Yunhong, Robert L. Grossman, “Supporting Configurable Congestion Control in Data Transport Services,” SC 05, to appear.
Gu, Yunhong, Xinwei Hong, Robert Grossman, “Experiences in Design and Implementation of a High Performance Transport Protocol,” SC 04, Pittsburgh, PA, November 2004, CD ROM.
Hinds, David A., Laura L. Stuve, Geoffrey B. Nilsen, Eran Halperin, Eleazar Eskin, Dennis G. Ballinger, Kelly A. Frazer, and David R. Cox, “Whole-Genome Patterns of Common DNA Variation in Three Human Populations,” Science, Volume 307, AAAS, February 18, 2005, pp. 1072-1079
Ihler, A., S. Kirshner, P. Smyth, M. Ghil, A. Robertson, “Graphical Models for Statistical Inference and Data Assimilation,” Physica D, submitted 2005.
Jenks, S.F., K. Kim, E. Henrich, Y. Li, L. Zheng, M. H. Kim, H.-Y. Youn, K. H. Lee, and D.-M. Seol, “A Linux-Based Implementation of a Middleware Model Supporting Time-Triggered Message-Triggered Objects,” Proceedings of 8th IEEE International Symposium on Object-oriented Real-time Distributed Computing (ISORC 2005), Seattle, WA, May 18-20, 2005, pp. 350- 358.
Kent, G.M., J.M. Babcock, N.W. Driscoll, A.J. Harding, J.A. Dingler, G.G. Seitz, J.V. Gardner, L.A. Mayer, C.R. Goldman, A.C. Heyvaert, R.C. Richards, R. Karlin, C.W. Morgan, P.T. Gayes, L.A. Owen, “60 k.y. Record of Extension across the Western Boundary of the Basin and Range Province: Estimate of Slip Rates from Offset Shoreline Terraces and a Catastrophic Slide Beneath Lake Tahoe,” Geology, Vol. 33, 2005, pp. 365-368.
Kilb, D. (and other E/O Contributors), “Column Spotlight on Education and Public Outreach (EPO),” MARGINS Newsletter No. 13, Fall 2004, p. 11.
Kilb, D., G.M. Kent, A. Nayak, “Seeing Is Believing: 3D Interactive Visualization Tools that Include the Juxtaposition Of Multivariate Data” (poster), EarthScope meeting, Feb 2005,

The OptIPuter FY2005 Annual Progress Report and FY2006 Program Plan 51
<www.earthscope.org/meetings/assets/es.natl.meeting/abstracts.pdf>.
Kilb, D., I. Cooper, R. de Groot, W. Schindle, R. Mellors, M. Benthien, “Using 3D Interactive Visualizations in Teacher Workshops,” American Geophysical Union (AGU), 2004.
Kilb, D., J. Bowen, C. Cruz, J. Eakins, K. Lindquist, V.G. Martynov, A. Nayak, R.L. Newman, J. Otero, G. Prieto and F.L. Vernon, “Near-Real Time Generation Of 3D Interactive Visualization and Web-Based Information Pertaining to the September 28, 2004 Mw 6 Parkfield Earthquake,” Seismological Society of America (SSA), April 2005.
Kim, K.H., S. Jenks, L. Smarr, A. Chien, and L.-C. Zheng, “A Framework for Middleware Supporting Real-Time Wide-Area Distributed Computing,” Proceedings of Tenth IEEE International Workshop on Object-Oriented Real-Time Dependable Systems (WORDS 2005), Sedona, AZ, February 2-4, 2005, pp. 231-240.
Kim, S., P. Smyth, H. Stern, J. Turner, “Parametric Response Surface Models for Analysis of Multi-Site fMRI Data,” Proceedings of 8th International Conference on Medical Image Computing and Computer Assisted Intervention (MICCAI 2005), Lecture Notes in Computer Science, Springer, October 26-29, 2005 (to appear).
Krishnaprasad, Naveen K., Venkatram Vishwanath, Shalini Venkataraman, Arun G. Rao, Luc Renambot, Jason Leigh, Andrew E. Johnson “JuxtaView: A Tool for Interactive Visualization of Large Imagery on Scalable Tiled Displays,” IEEE Cluster Computing 2004, Sept. 20-23 2004, San Diego, CA, pp. 411-420.
Lavian, T., D. Hoang, J. Mambretti, S. Figueira, S. Naiksatam, N. Kaushil, I. Monga, R. Durairaj, D. Cutrell, S. Merrill, H. Cohen, P. Daspit, F. Travostino, “A Platform for Large-Scale Grid Data Service on Dynamic High-Performance Networks,” 2nd International Workshop on Grid Network Research (GridNets2005), Boston, MA, October 6-7, 2005, submitted.
Liu, Xin, Andrew A. Chien, “Realistic Large Scale Online Network Simulation,” Proceedings of the ACM Conference on High Performance Computing and Networking, SC 2004, Pittsburgh, PA, November 2004, CD ROM.
Liu, Xin, Huaxia Xia, and Andrew Chien, “Validating and Scaling the MicroGrid: A Scientific Instrument for Grid Dynamics,” Journal of Grid Computing (to appear).
Mambretti, J., “Experimental Optical Grid Networks: Integrating High Performance Infrastructure and Advanced Photonic Technology with Distributed Control Planes,” Proceedings, ECOC Workshop on Optical Networks for Grids, Stockholm, Sweden, September 5, 2004.
Mambretti, J., “Intelligent Lightpaths: Data Intensive Applications and Dynamic Waveswitching Networks” (chapter), Annual Review of Communications, International Engineering Consortium, Vol. 57, 2004, pp. 719-723.
Mambretti, J., “Preparing Regions and Cities for the 21st Century Economy: Policies for Digital Communications Infrastructure” (white paper), MacArthur Foundation Policy Project Forum, Development Globalization and Technology: Strategies to Enhance Regional Competitiveness, Chicago, Illinois, January 2005.
Mambretti, J., “Recent Progress on TransLight, OptIPuter, OMNInet And Future Trends Toward Lambda Grids,” Proceedings, 8th International Symposium On Contemporary Photonics Technology (CPT2005), Tokyo, Japan, January 12-14, 2005.
Mambretti, J., “Ultra Performance Dynamic Optical Networks and Control Planes for Next Generation Applications,” Proceedings, Mini-Symposium on Optical Data Networking, Grasmere, England, August 22-24, 2005, to appear.
Mambretti, J., “The Digital Communications Grid: Creating A New Architectural Foundation for 21st Century Digital Communications Based on Intelligent Lightpaths,” Annual Review of Communications, International Engineering Consortium, 2005, Vol. 58, accepted.
Mambretti, J., J. Chen, F. Yeh, “Distributed Optical Testbed (DOT): A Grid Applications and Optical Communications Testbed,” 2nd International Workshop on Grid Network Research (GridNets2005), Boston, MA, October 6-7, 2005, submitted.
Moher, T., S. Hussain, T. Halter, D. Kilb, “Embedding Dynamic Phenomena within the Physical Space of an Elementary School Classroom,” ACM Conference on Human Factors in Computing Systems (CHI 2005), Portland, OR, April 2005, pp. 1665-1668.

The OptIPuter FY2005 Annual Progress Report and FY2006 Program Plan 52
Nayak, A., D. Kilb, “3D Visualization of Recent Sumatra Earthquake,” EOS Transactions, American Geophysical Union, Vol. 86, No. 14, April 5, 2005, pp. 142.
Nayak, A., F.L. Vernon, G.M. Kent, J. Orcutt, D. Kilb, R.L. Newman, J. Eakins, L. Smarr, T. DeFanti, J. Leigh, L. Renambot, A. Johnson, “iCluster: Visualizing USArray Data on a Scalable High Resolution Tiled Display using the OptIPuter,” GEON Meeting, San Diego, May 2005, <www.geongrid.org/AM05/presentations.php>.
Nayak, Atul, Frank Vernon,Graham Kent, John Orcutt, Debi Kilb, Rob Newman, Larry Smarr, Tom DeFanti, Jason Leigh, Luc Renambot, Andrew Johnson, “High Resolution Display of USArray Data on a 50 Megapixel Display using OptIPuter Technologies” (poster), EOS Transactions, American GeoPhysical Union (AGU), Fall meeting 2004, San Francisco CA, December 13-17, 2004.
Nishimura, C., C.L. Johnson, K.D. Schwehr, D. Kilb, A. Nayak, “Visualization Tools Facilitate Geological Investigations of Mars Exploration Rover (MER) Landing Sites,” IEEE Visualization, 2004, October 10-15, 2004, p. 19.
Reif, C., T. Ireland, J. Hammond, V. Lekic, “Characterizing Deep (> 500 km) Earthquake Regions to Investigate the Fate of Subducting Slabs,” EOS Transactions, AGU Fall Meeting, Vol. 85, Supplement, Abstract, U41A-0712, 2004.
Renambot, Luc, Andrew Johnson and Jason Leigh, “Techniques for Building Cost-Effective Ultra-high-resolution Visualization Instruments,” presented at the 2005 NSF CISE/CNS Pervasive Computing Infrastructure Experience Workshop, hosted by NCSA/UIUC in Urbana-Champaign, IL, July 27, 2005.
Robertson, A.W., S. Kirshner, P. Smyth, S.P. Charles, B. Bates, “Subseasonal-to-Interdecadal Variability of the Australian Monsoon over North Queensland,” Q.J.R. Meteorological Society, submitted 2005.
Robertson, Andrew, Sergey Kirshner, Padhraic Smyth, “Hidden Markov Models for Modeling Daily Rainfall Occurrence over Brazil,” Journal of Climate, Vol. 17, No. 22, November 2004, pp. 4407-4424 <http://ams.allenpress.com/pdfserv/10.1175/JCLI-3216.1>.
Schwarz, Nicholas, Shalini Venkataraman, Luc Renambot, Naveen Krishnaprasad, Venkatram Vishwanath, Jason Leigh, Andrew Johnson, Graham Kent, Atul Nayak, “Vol-a-Tile: A Tool for Interactive Exploration of Large Volumetric Data on Scalable Tiled Displays” (poster), IEEE Visualization 2004 Poster Compendium, October 10-15, 2004, CD ROM
Schwehr, Kurt D., Carrie Nishimura, Catherine L. Johnson, Debi Kilb, Atul Nayak, “Visualization Tools Facilitate Geological Investigations of Mars Exploration Rover Landing Sites,” IS&T/SPIE Electronic Imaging Proceedings, San Jose, CA, January 16-20, 2005, Vol. 5304-37, CD ROM.
Singh, Rajvikram, Byungil Jeong, Luc Renambot, Andrew Johnson, Jason Leigh “TeraVision: a Distributed, Scalable, High Resolution Graphics Streaming System”, 6th IEEE International Conference on Cluster Computing, Sept. 20-23 2004, San Diego, California, pp. 391- 400.
Smarr, Larry, Joe Ford, Phil Papadopoulos, Shaya Fainman, Thomas DeFanti, Maxine Brown, Jason Leigh, “The OptIPuter, Quartzite, and Starlight Projects: A Campus to Global-Scale Testbed for Optical Technologies Enabling LambdaGrid Computing” (invited paper), Optical Fiber Communication Conference & Exposition and the National Fiber Optic Engineers Conference (OFC/NFOEC) 2005, Anaheim, California, March 6-11, 2005, CD ROM.
St. Arnaud, B., A.D. Chave, A. Maffei, E. Laszowka, L. Smarr, G. Gopalan, “An Integrated Approach to Ocean Observatory Data Acquisition/Management and Infrastructure Control using Web Services,” Marine Technology Society (MTS) Journal, Volume 38, Number 2, Summer 2004.
Touch, Joe, “Variable Effort, Variable Certainly Triage for IPsec” (draft-touch-ipsec-triage-00.txt), 63rd IETF Meeting, Paris, France, July 31-August 5, 2005 (to be presented).
Touch, Joe, “Defending TCP Against Spoofing Attacks” (draft-ietf-tcpm-tcp-antispoof-01.txt), IETF TCP Modifications (TCPM) Working Group, The Internet Society, April 2005, <www.isi.edu/touch/pubs/draft-ietf-tcpm-tcp-antispoof-01.txt>.
Weigle, Eric, Andrew A. Chien, “The Composite Endpoint Protocol (CEP): Scalable Endpoints for Terabit Flows,” Proceedings of the 5th IEEE/ACM International Symposium on Cluster Computing and the Grid (CCGrid 2005), May 2005.

The OptIPuter FY2005 Annual Progress Report and FY2006 Program Plan 53
Wu, Xingfu, Valerie Taylor, Jason Leigh, and Luc Renambot, “Performance Analysis of a 3D Parallel Volume Rendering Application on Scalable Tiled Displays,” International Conference on Computer Graphics, Imaging and Vision (CGIV05), sponsored by Chinese Academy of Sciences, Beijing, China, July 26-29, 2005 (to be published).
Wu, Xinran (Ryan), Andrew A. Chien, “A Distributed Algorithm for Max-min Fair Rate Allocation”, submitted for publication, July 2005.
Wu, Xinran (Ryan), Andrew A. Chien, Matti A. Hiltunen, Richard D. Schlichting and Subhabrata Sen, “A High Performance Configurable Transport Protocol for Grid Computing,” Proceedings of the 5th IEEE/ACM International Symposium on Cluster Computing and the Grid (CCGrid 2005), May 2005.
Xia, Huaxia, Andrew A. Chien, “RobuSTore: Robust Aggregation of Distributed Storage,” submitted for publication, July 2005.
Xia, Huaxia, Holly Dail, Henri Casanova, Andrew Chien, “The MicroGrid: Using Emulation to Predict Application Performance in Diverse Grid Network Environments,” IEEE Second International Workshop on Challenges of Large Applications in Distributed Environments (CLADE’04), held in conjunction with the 13th International Symposium on High Performance Distributed Computing (HPDC-13), at the Hilton Hawaiian Village Beach Resort, Honolulu, Hawaii, June 4, 2004, pp. 52-63.
Xiong, Chaoyue, Jason Leigh, Eric He, Venkatram Vishwanath, Tadao Murata, Luc Renambot, Thomas A. DeFanti, “LambdaStream: A Data Transport Protocol for Network-Intensive Streaming Applications over Photonic Networks,” Proceedings of the Third International Workshop on Protocols for Fast Long-Distance Networks (PFLDnet 2005), Lyons, France, February 3-4, 2005, <http://www.ens-lyon.fr/LIP/RESO/pfldnet2005>.
3.B. Books/Publications Cox, D.J., “Visualization and Visual Metaphors” (chapter), Aesthetic Computing, Paul Fishwick (editor), MIT Press, 2005.
Cox, D.J., “Visualization in the Life Sciences” (chapter), Databasing the Brain: Data to Knowledge (Neuroinformatics), Shankar Subramaniam and Stephen Koslow (editors), Wiley Press: New York, November, 2004, pp. 123-152.
Gaffney, S. and P. Smyth, “Joint Probabilistic Curve-Clustering and Alignment” (chapter), Advances in Neural Information Processing Systems (NIPS), 2005, in press. <http://books.nips.cc/papers/files/nips17/NIPS2004_0712.pdf>
Grossman, Robert L., “Alert Management Systems -- A Quick Introduction” (chapter), Managing Cyber Threats: Issues, Approaches and Challenges, Vipin Kumar, Jaideep Srivastava, Aleksandar Lazarevic (editors), Kluwer Academic Publisher, 2005, pp. 281-294.
Grossman, Robert L., Y. Gu, D. Hanley, X. Hong, D. Lillethun, J. Levera, J. Mambretti, M. Mazzucco, J. Weinberger, H. Kargupta, “Photonic Data Services: Integrating Path, Network and Data Services to Support Next Generation Data Mining Applications” (chapter 5), Data Mining: Next Generation Challenges and Future Directions, Advances in Knowledge Discovery, A. Joshi, K. Sivakumar and Y. Yesha (editors) AAAI Press, 2004.
Liu, Xin, Scalable Online Simulation for Modeling Grid Dynamics, UCSD Computer Science PhD Thesis, November 2004.
Travostino, F., J. Mambretti, G. Karmous-Edwards, I. Chlamtac, S. Ganguly editors, Grid Networks: Enabling Grids with Advanced Communication Technology, Wiley, 2005, in press.
Xiong, Chaoyue, LambdaStream Networking, MS thesis, Electronic Visualization Laboratory and the Computer Science Department, University of Illinois at Chicago, May 2005.

The OptIPuter FY2005 Annual Progress Report and FY2006 Program Plan 54
3.C. Internet Dissemination www.optIPuter.net 3.D. Other Specific Products None at this time.

The OptIPuter FY2005 Annual Progress Report and FY2006 Program Plan 55
4. OptIPuter Contributions
4.A. Contributions within Discipline The OptIPuter team’s mission is to enable scientists to explore very large remote data objects in a novel interactive and collaborative fashion, which is impossible on today’s shared Internet. This involves the design, development and implementation of the OptIPuter -- a tightly-integrated cluster of computational, storage and visualization resources -- linked over LambdaGrids, parallel dedicated optical networks across campus, metro, national, and international scales. The OptIPuter project aims to re-optimize the entire Grid stack of software abstractions, learning how to “waste” bandwidth and storage in order to conserve “scarce” computing in this new world of inverted values. A major outcome of this research will be the development of advanced middleware and network management tools and techniques to optimize transmissions so distance-dependent delays are the only major variable. The group of computer scientists and network engineers assembled represent many of this nation’s high-performance computing and communications leaders. New, and potential national and international collaborators are seeking out the group’s expertise in order to jointly develop a common framework for optimizing optically linked clusters over LambdaGrids. 4.B. Contributions to Other Disciplines The OptIPuter’s mission is to enable collaborating scientists to interactively explore massive amounts of previously uncorrelated data by developing a radical new architecture for a number of this decade’s e-science shared information technology facilities. The OptIPuter’s broad multidisciplinary team is conducting large-scale, application-driven system experiments with two data-intensive e-science efforts to ensure a useful and usable OptIPuter design: EarthScope, funded by the National Science Foundation (NSF), and the Biomedical Informatics Research Network (BIRN) funded by the National Institutes of Health (NIH). These application drivers have many multi-gigabyte-sized individual data objects -- gigazone seismic images of the East Pacific Rise Magma chamber and 100 megapixel montages of rat cerebellum microscopy images -- which are very large volumetric data objects with visualizations so big they exceed the capacity of the current shared Internet and laptop displays. Hence, there is interest from other Federal agencies (NASA and USGS EROS are OptIPuter partners) as well as interest from other user communities (such as High Energy and Nuclear Physics and the Oceanography) to take advantage of the architectures we are developing. To showcase our work, National LambdaRail has invited us to do demonstrations in their research booth as the SC 2004 and SC 2005 conferences. 4.C. Contributions to Education and Human Resources The OptIPuter supports approximately 25 senior faculty and staff, some part-time staff, and 14 graduate students spanning 8 institutions. Non-funded faculty, staff and students from other university departments, 7 affiliate institutions, and several industrial partners also work tirelessly on OptIPuter research. Our initial efforts in the K-12 public schools (Preuss School in San Diego and Lincoln School in Oak Park, IL), are also engaging teachers and school children. We are building a worldwide community eager for new methodologies for the real-time exploration of e-science. 4.D. Contributions to Resources for Science and Technology The OptIPuter exploits a new world in which the central architectural element is optical networking, not computers -- creating “supernetworks.” This paradigm shift requires large-scale applications-driven, system experiments and a broad multidisciplinary team to understand and develop innovative solutions for a “LambdaGrid” world. The goal of this new architecture is to enable scientists who are generating terabytes and petabytes of data to interactively visualize, analyze, and correlate their data from multiple storage sites connected to optical networks. 4.E. Contributions Beyond Science and Engineering Beyond serving the scientific and engineering research communities, the OptIPuter can be an enabling technology for broader societal needs, including emergency response, homeland security, health services, and science education.

The OptIPuter FY2005 Annual Progress Report and FY2006 Program Plan 56
5. OptIPuter Special Requirements
5.A. Objectives and Scope Our scope of work has not changed (see Section 6: OptIPuter FY2005 Program Plan). 5.B. Special Reporting Requirements UCSD is honoring its commitment of matching funds as originally proposed and budgeted; no deviation is reported. 5.C. Unobligated Funds N/A. 5.D. Animals, Biohazards, Human Subjects No.

The OptIPuter FY2005 Annual Progress Report and FY2006 Program Plan 57
6. OptIPuter FY2006 Program Plan (October 1, 2005 – September 30, 2006)
6.A. Year 4 Milestone MILESTONE: e-Science advancements facilitated by the OptIPuter testbed will be demonstrated. OptIPuter testbeds on the campus, metro, regional, national and international levels, connecting OptIPuter partner sites in Southern California to Chicago, will continue to be upgraded and expanded, and networking, middleware, visualization and collaboration software developed at partner sites will be deployed and benchmarked.
6.B. Network and Hardware Infrastructure Activities Additional cluster/storage/visualization endpoints will be added to the four OptIPuter testbeds, to push scaling, distance and bandwidth limits. 10GigE NICs will be further explored. iGrid 2005 will connect 10x10Gb waves to the Calit2 building with the intention of making some subset of them persistent. NU will work with UCSD and UIC to demonstrate a 1:1 metro bisection bandwidth ratio, and a 4:1 national bisection bandwidth ratio. Further upgrade and expansion of switches will be needed at both UIC and UCSD to accomplish these bisection goals. In addition, Nortel HDXc switches are being installed in Chicago (StarLight) and Seattle (PNWGP), which will allow knowledge to be gained on L1 switching and control.
Network and Hardware Infrastructure Timeline Year 3 (Oct ‘04-’05) Year 4 (Oct ‘05-’06) Year 5 (Oct ‘06-’07)
UCSD Campus Testbed (and SoCal OptIPuter sites) (UCSD) • 64-bit x86_64 Opteron introduced • Build 3x17-way cluster prototypes • Implement/evaluate storewidth
platform (Lustre) • Introduce OOO switch at campus core
(Quartzite) • Introduce 1 10Gigabit NICs • 10 Gb networking to all sites • Creating programmable VLAN
structure (ongoing effort)
• Add 64-bit nodes (x86_64) with PCI-express interfaces
• Deploy full bisection networks to NCMIR (20Gigabit), SDSC (10Gigabit), CalIT2 Viz walls(30 Gigabit)
• Demonstrate 10Gigabit sustained storage read and/or write across campus.
• Deploy first DWDM on campus (Quartzite)
• Striped 10 Gb to most campus sites • Automated Discovery and Mapping of
OptIPuter network configuration
• Retire IA-32 clusters • Refine packaging of OptIPuter
Software including Gold, Base, Visualization, and Storage personalities
• Complete deployment of DWDM infrastructure (Quartzite and OptIPuter)
•
Metro Chicago Testbed (NU) • 64-bit systems introduced • Build 3x32-way cluster prototypes • Implement storewidth platform
• Add additional 64-bit clusters. • Evaluate/refine storewidth physical
model
• Retire IA-32 clusters • Package know-how to build
storewidth endpoints National Testbed via CAVEwave (UIC) • Initial turn up of CAVEwave; testing
with NASA, StarLight, UIC,and UCSD; use at iGrid2005
• Using CAVEwave with OptIPuter National-scale applications
• Integration of CAVEwave with GLIF
International Testbed via SURFnet and TransLight (UvA) • Initial turn up of new IRNC circuits
and “matching” circuits from Japan, the NetherLands, Canada
• Test OptIPuter and UvA middleware for “production” early adopters in 4K digital streaming media.
• Examination of UCLP from Canada and other GLIF-aligned procedures for creating L1/L2 circuits
• Adoption and refinement of middleware
High-Speed NICs and Software Stack (UCSD, UIC) • Installed 10GE infrastructure • Evaluate/implement DWDM+
InfiniBand hardware • 10GE to cluster nodes
• Compare hybrid and pure DWDM
Optical Signaling, Control and Management (NU) • See Backplane timeline below • See Backplane timeline below • See Backplane timeline below

The OptIPuter FY2005 Annual Progress Report and FY2006 Program Plan 58
6.B.1. UCSD Campus Testbed (includes SoCal OptIPuter sites) In Year 4, our goal is to showcase researchers using a reconfigurable system testbed to further both computer science and e-science developments. Year 4 will show a select number of sites with 1:1 bisection based on 1Gb cluster nodes; for example, the NCMIR BioWall has 20 display panels and we will deploy 20Gb to this cluster. We will also update the bandwidth to the JSOE storage cluster to at least 20Gb as a match to our visualization walls. We have as a goal, demonstrating 10Gb (1GB/sec) of sustainable storage bandwidth between NCMIR and the storage cluster (1 fiber mile distant) on NCMIR/EVL applications.
The desired bandwidths will completely utilize the UCSD fiber plant dedicated to OptIPuter and will therefore act as natural drivers for DWDM deployment. In conjunction with our NSF-funded Quartzite project, a 4-fiber x 8-channel (32 total channels) Lucent DWDM wavelength-selective switch will be deployed. Coupled with passive optics, we will be able to multiplex 1Gb and 10Gb signals. Our plan is to use as many 10Gb DWDM channels as budgets allow. Currently, DWDM colored optics at 10Gb are about 10-times the pricing of white (standard) 10Gb optics. We expect this pricing fall, as predicted in the original proposal. By the end of Year 4, at least 3 sites will have passive optic combiners/splitters driven by 1Gb optics (likely 10Gb optics) for a total of 12 DWDM channels.
The OptIPuter campus network is growing quite large and we are developing software that will automatically map the network, pull MAC-to-IP address translations from cluster databases, and allow us to visually represent all network components. In Year 3, we deployed an O-O-O MEMs-based Glimmerglass switch so we can do physical rewiring of the network without moving any cables. This network mapping project will be completed in Year 4 and we will use it both to detect the network topology and to define new topologies as needed.
6.B.2. Metro Chicago Testbed
The OMNInet Optical Metro Network Initiative is being enhanced to support research and experimentation using new technologies, including optical transport and signaling protocols, new control plane architecture (e.g., IP control planes using GMPLS), management plane architecture, core photonic components such as MEMs switches, multi-protocol services, integrated DWDM, optical monitoring and analysis, techniques for pre-fault diagnostics, fault

The OptIPuter FY2005 Annual Progress Report and FY2006 Program Plan 59
detection and automatic restoration, and the creation of new protocols. In addition, this new testbed will enable emerging new techniques for lightpath switching to be tested with traditional SONET services.
6.B.3. National Testbed (via CAVEwave) The CAVEwave will be shared among several visualization-oriented projects this year as the OptIPuter sites at UCSD, UIC, UIUC/NCSA and other NLR/CENIC/I-WIRE-connected OptIPuter partner sites begin prototype production applications.
CAVEWAVE AND NASA ACTIVITIES…NASA Goddard Space Flight Center (GSFC) expects to enable several types of data flows among UCSD, UIC and NASA sites (GSFC, JPL and ARC) in support of various science projects, which were described in a joint proposal submission “MAP Core Integration LambdaGrid Infrastructure” to NASA’s MAP NRA.
• Coordinated Earth Observing Program • Hurricane predictions • Global aerosols • Remote viewing and manipulation of large Earth science datasets • Integration of laser and radar topographic data with land cover data • Large-scale geodynamics ensemble simulations
In addition, GSFC expects to enable several other types of data flows among UCSD, UAH, GSFC and JPL as described in the joint submission “Brokering and Chaining Distributed Services and Data Using OptIPuter and the National Lambda Rail” to NASA’s ROSES NRA.
With OptIPuter project assistance, GSFC is also considering some NASA MAP05/Project Hurricane data flows across GSFC-(NLR)-UCSD-(CENIC)-ARC until NREN completes its 10Gb upgrade using the NLR.
6.B.4. International Testbed (via SURFnet and TransLight) The IRNC Program is providing an OC-192 from Chicago to Amsterdam to be used for developing production use of switched L1 and L2 circuits. SURFnet is supplying a matching OC-192 as well, for more experimental usage. The OptIPuter project will continue to implement and test middleware that supports application use and measurement of these circuits, as well as the other L1/L2 circuits into StarLight (and Seattle) from Asia, Canada, and Europe.
6.B.5. Optical Signaling, Control, and Management Optical Signaling, Control and Management Timeline
Year 3 (Oct ‘04-’05) Year 4 (Oct ‘05-’06) Year 5 (Oct ‘06-’07) Specifications of Applications by Data Communication Requirements – e.g., those with Very-Large-Scale Flows
Create metrics; test for general and targeted application performance characteristics
Test, demonstrate applications on OptIPuter in large-scale scenarios, Create, implement VLS tests
Create monitoring and reporting tool for application performance end-2-end, Undertake scalability testing
(I)AAA, Resource discovery, State Information (“I” for Identification) Policy DEN
Optimize database and signaling functions for policy controls including interfaces
Test and demonstrate functions in large-scale scenarios, expand interface signaling methods
Create monitoring and reporting tool for access control systems, including across various interfaces
Define Required Data Communications (vs Computational) Middleware Requirements
Select components for removal, enhancement, replacement based on testing
Design, Revise middleware – 2nd phase implementation of middleware components, test, measure
Create monitoring and reporting tool for middleware components
L4/L3 (Transit and Transport) Protocols (e.g., SABUL, GridFTP, DiffServ, Striped TCP, XCP, FAST, Quanta, etc)
Design and implement TE mechanisms based on emerging IETF standards for optimized L4/L3 processes
Test and demonstrate in large-scale scenarios, extend TE mechanisms
Design and implement analysis and reporting mechanisms, including for TE
Message Signaling Protocols (API or application-layer protocol, or Clients)
Create extended set of message signaling modalities and feedback mechanisms
Create and implement secondary (tertiary) messaging paths, for each interface, app, admin, process etc
Create monitoring and reporting tool for messaging systems

The OptIPuter FY2005 Annual Progress Report and FY2006 Program Plan 60
Optical Service Layer for Lightpath Management, Path Resources and Attributes
Optimize for internode communications of state information
Extend object libraries to include additional devices, including edge devices
Design and implement analysis and reporting mechanisms
Interdomain Signaling Design & implement secondary path mechanisms
Optimize for interdomain signaling and messaging
Test and demonstrate in large-scale scenarios
L2 Provisioning and Transport Protocols
Integrate with additional L2 methods, e.g., MPLS, vLANs, Static circuits
Integrate with protection mechanisms
Design and implement analysis and reporting mechanisms
Control plane and Related Tools, e.g. GMPLS
Extend CP mechanisms to include add. additonaloptical devices, ie, automated sw panels
Extend integration of CP and service layer functions
Extend CP functions to include integrated device concepts
Control Switching (e.g., OBS)
Explore the potential to Enhance with linear optimization techniques
Design, implement protection mechanisms for CS
Design and implement analysis and reporting mechanisms
Recovery/ Restoration Survivability
Create mechanism for interlinking to restoration/ recovery lightpaths
Design and implement multi layer, multiple path protection
Create, implement mechanism for linking all key resources to these mechanisms
Management Plane: Integrating management at all layers (perhaps based on SNMP)
Examine potential for SNMP- type traps for specific events
Design and implement extended MP for additional types of paths and events
Design and implement analysis and reporting mechanisms
The initial distribution of the signaling, control and management modules for lightpaths on the distributed optical backplane domains will be enhanced based on requirements identified through Year 3 testing and experimentation. The Year 4 distribution will include initial modules for performance and fault monitoring, analysis, reporting, and restoration. The Year 4 distribution will be more fully integrated within the overall OptIPuter system environment. Additional domains will be added in Year 4.
Next year, research efforts will focus on the following research activities:
• Experiment with integrating WSRF-based service-oriented provisioning methods with optical path provisioning methods
• Enhance methods to allow for direct application signaling for resources • Develop more efficient and robust PIN reservation signaling and routing protocols • Perform additional experiments with advanced scheduling and policy-based provisioning controls at the
local domain and inter-domain levels • More closely integrate PIN signaling control with Quanta middleware to enable LambdaGrid monitoring
and adaptive control of optical network resources • Test the integration of reservation/routing protocols with access control methods, e.g., an implementation
of the IETF AAA protocol • Further experiment with lightpath control based on GMPLS and related device interfaces • Experiment with additional optical switches, especially for access points • Integrate signaling between selected control and management functions • Enhance methods for resource discovery, based on new methods for optical network resource identification • Enhance resource monitoring • Enhance process analysis and reporting

The OptIPuter FY2005 Annual Progress Report and FY2006 Program Plan 61
6.C. Software Architecture Research Activities OptIPuter system software architecture development will continue, particularly research on the distributed virtual computer (DVC) and the integration of communication protocols, mechanisms, optical network control, and security with network capabilities. Optical signaling software packages PIN/ODIN will be connected into the DVC, enabling integrated experiments. An integrated XIO framework will be used to present GTP, UDT, and other OptIPuter protocols. UCI will work with UCSD to demonstrate real-time control of e-Science remote instruments generating large data objects. TAMU will add services to the Prophesy models for performance-directed decisions.
Software Architecture Research Timeline Year 3 (Oct ‘04-’05) Year 4 (Oct ‘05-’06) Year 5 (Oct ‘06-’07)
OptIPuter Software Architecture and DVCs (UCSD, UIC) • Integrate LambdaRAM abstractions • Integrate OptIPuter communication
protocols • Integrate Optical Signaling (network
configuration control) • Experiment with application kernels
and demonstrate several example DVCs with OptIPuter applications
• Experiment with OptIPuter visualization, geoscience and biomedical applications
• Integrate novel communication mechanisms (e.g. photonic multicast) into Shared Communication Framework
• Based on application experiments, develop additional DVC templates
• Integrate OptIPuter remote storage access models, enabling high-speed direct access
• Second-generation DVC architecture • Enhanced DVC templates distributed
to the community • Demonstrations of remote storage
access and RobuSTore integration
Real-Time DVC (UCSD, UCI) • Develop prototype Real-Time DVC
based on TMO framework • Demonstrate real-time control of
remote instruments in campus-scale OptIPuter using real-time DVCs
• Real-time control of remote instruments across wide area using real-time DVCs
File Systems/ Data Storage (UCSD) • Prototype Erasure Code Distributed
Storage (RobuSTore) and evaluate using scalable benchmarks derived from OptIPuter applications
• Demonstrate Erasure Code Distributed Storage with single OptIPuter application at a time
• Characterize scalability and robust, high-performance; in particular, statistical quality guarantees
• Demonstrate Erasure Code Distributed Storage with multiple OptIPuter application at a time
• Demonstrate statistical quality guarantees in shared storage environment, enabling large scale shared use
Security for Lambda Grids/DVCs (UCI, USC/ISI) • Formulate DVC/LambdaGrid
hierarchical trust problems • Develop innovative cryptographic/
protocol techniques for fast, practical group communication
• Analyze throughput and latency of existing Internet Network Layer Security
• Design extensions to Internet Network Security to support high-performance, low-latency
• Develop extensions to Internet Network Security for high-performance, low-latency and evaluate performance
• Design extensions for high-throughput, low-latency Internet and new OptIPuter transport security
• Explore Uncheatable Grid Computing
• Develop extensions for high-throughput, low-latency Internet and new OptIPuter Transport Security and evaluate performance
Performance Modeling (TAMU) • Analyzed Vol-a-Tile on TAMU
OptIPuter node • Worked with UIC/EVL team on
redesigning Vol-a-Tile • Started analysis SAGE and JuxtaView
on TAMU OptIPuter node
• Analyze new Vol-a-Tile (Ethereon), SAGE, LambdaRAM, JuxtaView on large-scale OptIPuter testbed.
• Conduct experiments to quantify the performance impact of components of the DVC software stack
• Integrate performance monitoring with software stack to aid in making performance-directed deployment and access decisions
• Analyze the performance of other applications such as BIRN and SIO
DVC Shared Communication Framework and Protocols (UCSD, UIC) • Integrating GTP, LambdaStream,
SABUL/UDT transports into Shared Communication Framework
• Comparative performance evaluation of transport protocols, using OptIPuter applications and testbeds
• Based on application-driven evaluation, provide protocol selection for applications, and directions for improving the protocols

The OptIPuter FY2005 Annual Progress Report and FY2006 Program Plan 62
Protocols – GTP (UCSD) • Implement GTP 1.0 • Experiment with GTP 1.0 prototypes
using applications and OptIPuter testbed environments
• Design and simulate GTP 2.0 protocol which manages multiple receivers and multiple senders
• Refine and implement GTP 2.0, better performance sender-side congestion management
• Experiments with GTP 2.0 prototypes using applications and wide-area OptIPuter testbed environments
• Demonstrate GTP 2.0 with applications involving fetching data from distributed archives with multiple competing clients
Protocols – CEP (UCSD) • Define Composite EndPoint Protocol
(CEP) APIs • Implement and evaluate static
scheduled CEP which supports heterogeneous composite endpoints
• Demonstrate high bandwidth flows (30Gbps)
• Distribute CEP 1.0 implementation (static)
• Research and prototype dynamically scheduled CEP
• Evaluate in large-scale testbed experiments with variable network and endpoint performance
• Distribute CEP 2.0 implementation (dynamic)
• Integrate CEP with applications and demonstrate composite flows of 10’s of Gbps routinely in applications
Protocols – SABUL/UDT/CPT and RBUDP/LambdaStream (UIC) • Develop initial version of the
Composable Protocol Toolkit (CPT) and UDT version 2.0
• Integrate new UDT version with XIO framework
• LambdaStream prototype competed and tested in preparation for application and XIO integration.
• Develop CPT version 1; layer high-performance web services over CPF.
• Implement UDT version 3.0 using this framework
• Integrate LambdaStream and visualization tools into DVC
• Develop CPF v2 • Release final version of UDT v4 • Develop streaming applications using
CPF • Evaluate and demonstrate
LambdaStream with applications
6.C.1. System Software Architecture We will produce and experiment an OptIPuter Gold Roll which integrates a large collection of the OptIPuter system software research technology using the OptIPuter system software architecture. This packaged realization of the architecture will be used as the major software configuration for all OptIPuter system resources and used as the basis for demonstrations and research. Based on learning from this activity, we will generate new version of the Gold Roll using the OptIPuter system software architecture.
6.C.2. Real-Time Capabilities UCI (Kim, Jenks) plans to prototype a real-time DVC support middleware model, including TMOSM as a component; incorporate the DA-TMO support capability into the real-time DVC support middleware; further enhance the TMOSM/cluster prototype; and, contruct a remote-control application demo on the campus-scale OptIPuter testbed and do performance evaluation.
6.C.3. Data Storage We will continue to explore the capabilities of RobuSTore via simulation; in particular, we plan to explore a broader spectrum of access patterns. We will begin to design and implement a prototype of RobuSTore based on Lustre. If time permits, we will begin performing experiments with applications on the OptIPuter testbeds.
6.C.4. Security ISI/USC (Touch) will continue to investigate IPSec, FastSec and XBone, to develop extensions to Internet Network Security for high-performance, low-latency, and will evaluate performance.
UCI (Goodrich) plans to continue working on uncheatable grid computing, with the goal of producing schemes that can exploit the delays inherent in computational grids to allow for participants to check the correctness of computations in real time as they are being produced. We also plan to further study efficient distributed data indexing schemes that are fault tolerant and secure. Finally, we hope to design a security verification scheme that is based on having a device read aloud a grammatically correct pass-phrase that is being displayed elsewhere so as to verify physically that a connection is secure.
Based on iGrid 2005 outcomes and funding outside OptIPuter, NU/UIC (Mambretti, DeFanti, Leigh) may continue to work with Nortel on commercial-grade 10Gb encryption and UvA (de Laat) may continue work on token-based

The OptIPuter FY2005 Annual Progress Report and FY2006 Program Plan 63
access to computational resources.
6.C.5. End-to-End Performance Modeling UIC (Leigh) will work with TAMU (Taylor) to do performance analysis and modeling of SAGE and Ethereon (the next-generation JuxtaView and Vol-a-Tile). Monitoring will be conducted over CAVEwave (from Chicago to San Diego) as well as over SURFnet and TransLight (between Amsterdam and Chicago, where these links connect with CAVEwave to get to San Diego).
6.C.6. High-Performance Transport Protocols In Year 4, UIC (Leigh, Renambot) will work with UCSD (Chien) to integrate LambdaStream, LambdaRAM, and their associated OptIPuter applications into the DVC environment. UIC (Grossman) will continue to develop Composable Protocol Toolkit (CPT) and the next-generation UDT.
UCSD (Chien) will explore dynamic CEP protocols that adapt to run-time conditions and performance. UCSD will also demonstrate GTP (part of a DVC) working with large-scale applications over the OptIPuter testbeds.
6.D. Data, Visualization and Collaboration Research Activities Visualization and collaboration software will be prototyped using DVC, enabling a high-level use of OptIPuter resources. UIC will develop a new framework for visualization and collaboration interfaces that is tuned to multi-lambda connectivity. UIC will also explore reliable multicast transmission schemes at gigabit-and-higher optical rates to distribute high-definition volume visualizations. Data middleware will be integrated with multi-lambda middleware to support enhanced, distributed data mining over the OptIPuter. Streaming algorithms for distributed data will be developed. Second-generation optimization software for data mining will be released and integrated into one of the OptIPuter applications.
Data, Visualization and Collaboration Research Timeline Year 3 (Oct ‘04-’05) Year 4 (Oct ‘05-’06) Year 5 (Oct ‘06-’07)
Data and Data Mining Research (UIC, UCI) Data and Data Mining Research (UCI) • Develop High-Performance Web
Services (HPWS) for exploring remote data using composable UDT
• Explore obstacles to achieving high-performance “copy” from disk-to-lambda-to-disk
• Develop group algorithms for merging data records based upon keys
• Perform experimental studies
• Develop data mining primitives using HPWS over lambdas
• Initial release of Lambda Copy (LCP) for disk-to-lambda-to-disk “copy”
• Inital release of group algorithms for merging data records based upon keys
• Perform experimental studies
• 2nd release of data mining primitives using HPWS over lambdas
• 2nd release of LCP • 2nd release of group algorithms for
merging data records • Perform experimental studies
Data and Data Mining Research (UCI) • Develop clustering algorithms for
spatio-temporal data using simulated streamed data
• Develop data-mining algorithms for analysis of large volumes of fMRI brain data and demonstrate interactive visualization of such data using the UCI multi-tile display
• Develop data-mining algorithms for modeling temporal patterns in vegetation growth with demonstration of results on UCI multi-tile display
• Apply trajectory clustering algorithms to large-scale analysis of Pacific tropical cyclone data
• Extend data-mining algorithms to handle real-time streaming data
• Continue to develop new algorithms and software for data mining and multi-tile display of very large fMRI brain datasets
• Develop algorithms for massive “global-scale” seasonal prediction of climate-related data
• Explore opportunities in using OptIPuter framework for homeland security/crisis situation assessment
• Develop and demonstrate integrated algorithmic framework for scientific data mining and multi-tile visualization
• Experimental studies and demonstration of distributed data mining and visualization of large scientific datasets over OptIPuter network
Data Analysis and Visualization Development (UIUC/NCSA) • High-resolution “stress test”
visualizations over dedicated OptIPuter connection to NCSA Altix
• Design and enable data mining capabilities and visualization services using the NCSA Altix dedicated
• Complete data-mining of feature extraction and 3D visualizations of features to render interactive high-

The OptIPuter FY2005 Annual Progress Report and FY2006 Program Plan 64
• Develop oceanographic high-resolution 3D visualizations
connection for OptIPuter • Continue developing high-resolution,
high-fidelity visualizations • Integrate NCSA playback software
into SAGE
resolution visualizations streamed over OptIPuter via the NCSA Altix
Visualization/Collaboration Tools • Design of Scalable Adaptive Graphics
Environment (SAGE) • Examine issues in Windows-based
architecture for OptIPuter node
• SAGE trials over wide area and to multiple sites
• SAGE integration into DVC framework.
• SAGE integration into multiple OptIPuter visualization tools
Volume Visualization Tools • Design new architecture to combine
large geometry visualization and volume visualization
• Continue research into point-based volume rendering techniques, port GVU browser to Varrier auto-stereo.
• Develop load balancing techniques for partitioning volume data
• Extend GVU to run on parallel tiled display systems.
• Realize version 1 of Ethereon − a new visualization tool combining capabilities of JuxtaView and Vol-a-Tile.
• Integrate existing visualization tools (such as ParaView) with SAGE framework
• Evaluate static load balancing in GVU • Develop GVU plug-ins based on wave
analysis filters used in earthquake science
• Evaluate performance scalability of GVU on tiled displays.
• Integrate SAGE and GVU.
• Experiment with collaborative control • Install GVU at USC/SCEC and other
participating sites permanently and evaluate documentation needs
• Develop formal performance benchmarks for fully scaled GVU volume browsing.
Photonic Multicasting • If 10G NICS are available, will test
local photonic multicasting to determine the transparentness of the photonic switches
• Explore wide-area non-photonic high-bandwidth multicast to understand requirements, issues and limitations
• Explore, through modeling, the technical requirements and limitations of pure photonic multicasting
• Possibly experiment with photonic multicasting using GBICs in CWDM over spools of fiber to prove the concept can work
LambdaRAM • Examine prefetching schemes and
benchmark over variety of networks • Integrate into DVC framework • Integrate with applications
• Install LambdaRAM service at all OptIPuter sites to support distributed applications
6.D.1. Data and Data Mining Research UIC (Grossman) will develop data-mining primitives using High Performance Web Services (HPWS) over Lambdas. UIC will provide an initial release of Lambda Copy (LCP) for disk-to-lambda-to-disk “copy.” Also, UIC will release group algorithms for merging data records based upon keys. In all cases, experimental studies will be conducted on the CAVEwave, at StarLight with other national/international partners, and the Teraflow network testbed in order to evaluate performance.
UCI (Smyth) will continue to develop data-mining algorithms to handle real-time streaming data as well as algorithms in support of multi-tiled displays of very large fMRI brain datasets. UCI will continue to develop algorithms for massive “global-scale” seasonal prediction of climate-related data and will explore opportunities to use the OptIPuter framework for homeland security/crisis situation assessment.
6.D.2. Visualization/Collaboration Tools UIC (Leigh, Renambot) will continue to improve the SAGE framework and interface more applications into SAGE, such as ParaView. UIC will also examine the issue of supporting multicast to enable multi-site collaborative visualizations using SAGE. Furthermore, UIC will work with other OptIPuter partners to conduct visualization streaming experiments among sites.
ISI (Thiébaux) will continue to evaluate the scalability of GVU on tiled displays; and will integrate GVU as a SAGE application.

The OptIPuter FY2005 Annual Progress Report and FY2006 Program Plan 65
6.D.3. Volume Visualization Tools UIC (Leigh, Renambot) are developing Ethereon − a new-generation visualization tool that combines the capabilities of JuxtaView (for high-resolution 2D montages) with Vol-a-Tile (for high-resolution 3D volumetric datasets). This has been necessitated by application scientists’ needs to view both kinds of data simultaneously and within context. Ethereon will be integrated into the SAGE framework.
6.D.4. Visualization and Data Analysis Development NCSA will install SAGE and work with UIC to integrate its playback software into SAGE − to enable “image pushing” through the OptIPuter. We will test this software between NCSA to EVL/UIC over the regional OptIPuter testbed. (NCSA has a dedicated 10Gb link from Champaign-Urbana to StarLight in Chicago for OptIPuter use. From there, they can connect to CAVEwave or other national/international partners.) We will begin to develop large-scale LambdaRAM capabilities using NCSA’s 1024-processor 3TB-RAM Altix supercomputer to stream images and data.
We will design and enable the data-mining capabilities and visualization services using NCSA’s Altix and dedicated OptIPuter connections. And, we will continue to develop high-resolution, high-fidelity visualizations for OptIPuter testbed analysis. These include work with Scripps oceanographers as well as other scientific domains. We plan to leverage NCSA’s networking research to provide measurements of streaming data flows.
6.D.5. Photonic Multicasting UIC will continue exploring all-optical multicasting and its impact on distributed collaborative applications. In addition to working with Chelsio Communications on configuring its 10Gb NICs to support this mode of communication, UIC will also collaborate with Nortel Networks to examine methods for wide-area multicasting.
6.D.6. LambdaRAM UIC will acquire a MYRInet or Infiniband backplane to experiment with, and perhaps realize, the concept of an optical network backplane, where parallel cluster nodes serve as points of termination for 10Gb lambdas. LambdaRAM is expected to utilize this connectivity strategy. Furthermore, we will begin integrating LambdaRAM into the overall DVC framework to allow future OptIPuter applications to make use of this innovative computing concept.
6.E. Applications and Education Activities NCMIR/BIRN and SIO/EarthScope/USArray will continue to port application codes to advanced cluster architectures and integrate codes with DVC to test with partner sites over the various OptIPuter testbeds. Advancements in e-Science will be demonstrated at national and international meetings. UCSD (Kilb) and UIC (Moher) will continue their Education & Outreach programs with children, teachers and young adults, expand “RoomQuake” to more schools and develop the “Magnitude Estimator.”
Applications and Education Timeline Year 3 (Oct ‘04-’05) Year 4 (Oct ‘05-’06) Year 5 (Oct ‘06-’07)
Geoscience Application Codes Running on OptIPuter Clusters (UCSD/SIO) • Continue development of the DIP
Project to create visualizations of an earthquake’s fault orientation.
• Use visualization software SAGE and JuxtaView to browse high-resolution ortho-imagery and satellite images.
• Build a 2x2-tiled display driven by a G5 Mac cluster for EarthScope/ USArray applications.
• Use the OptIPuter Storage Cluster to disseminate SIO visual scene files.
• Use OptIPuter for projects like USArray, RIDGE and ROADnet.
• Use OptIPuter middleware like DVC, GTP and CEP to move multi-gigabyte scene files among clusters.
• Use OptIPuter visualization software (e.g., EVL’s Ethereon) to explore multiple seismic volumes and high-resolution satellite images over large tiled displays.
• Complete construction of the 50-Megapixel Mac-based tiled display.
• Continue collaborations with NASA.
• Continue to port application codes to advanced cluster architectures and integrate codes with DVC to test with partner sites
• Assist new geoscience users get access to OptIPuter testbeds and technologies
• Continue collaborations with NASA.
Bioscience Application Codes Running on OptIPuter Clusters (UCSD/NCMIR/BIRN) • Use JuxtaView, Vol-a-Tile, SAGE • Stream stereo HDTV to Varrier to • Continue to port application codes to

The OptIPuter FY2005 Annual Progress Report and FY2006 Program Plan 66
and TeraVision • Use OptIPuter storage cluster to
deposit and process biomedical data • Build a single-node OptIPuter
visualization endpoint at NCMIR • Build a 6-tile, 5-node cluster at BIRN-
CC • PIN, DVC, GTP, and LambdaRAM in
development stages
view remote stereo microscopy images in real time
• Create point-and-click interfaces for SAGE to JuxtaView and other EVL applications
• PIN, DVC, GTP and LambdaRAM running in production iterations.
• End-to-end OptIPuter instances launched from the Telescience Portal
• Use SAGE for multi-scale biomedical experiments.
advanced cluster architectures and integrate with DVC to test with partner sites, to achieve real-time computed visualization of data from instrumentation
• Continue to assist new bioscience users and BIRN partners to access OptIPuter testbeds and technologies
Education and Outreach Activities (UCSD/SIO/UIC) UCSD/Preuss School (UCSD) • SIO Ship/Preuss real-time connection
and communication to promote the OptIPuter model of remote collaboration between scientists.
• Real-time data transfer of 3D visualizations between SIO and Preuss during live iChat sessions between the two schools.
• Incorporate RoomQuake in a San Diego classroom
• Streamline the embedded phenomena component of RoomQuake, to be hosted by a centralized server to accommodate 100 classrooms running RoomQuake.
• Develop web-based learning tools, which include visualization technology.
• Explore and conduct remote learning options (e.g., classroom to museums, classroom to shipboard, classroom to SIO researchers).
• Expand successful programs to other schools such as Cardiff Elementary School.
UCSD/Sixth College (UCSD) • Project on hold until additional funds
forthcoming
Chicago and suburban elementary schools (UIC) • RoomQuake 2 (Lindoln) • HelioRoom (Lincoln) • RoomBugs (Galileo)
• RoomQuake 3, RoomBugs 2, HelioRoom 2 (NTA, Galileo, Lincoln)
• Phenomenon Servers • New applications: RoomBrain,
RoomLake
• Regional dissemination using phenomenon server
• Design refinements • New applications
UCSD/SIO Outreach • Collaboration with Birch Aquarium at
Scripps (installation of a GeoWall, assist with Earthquake! exhibit)
• Graduate student visualization contest • Design visualizations pertaining to
large global earthquakes in near-real-time.
• Distribute visual objects for use in formal/informal education through the OptIPuter storage cluster
• SIO Teacher Workshop • Graduate student visualization contest • Develop visualizations for the Yellow
Stone Visitor’s Center. • Distribute visual objects for use in
formal/informal education through the OptIPuter storage cluster
• SIO Teacher Workshop • Graduate student visualization contest • Distribute visual objects for use in
formal/informal education through the OptIPuter storage cluster
• Develop visualizations for the annual Summer of Applied Geophysical Experience (SAGE) program.
Annual OptIPuter All Hands Meering (AHM) • An AHM will be scheduled Jan 2005 • An AHM will be scheduled Jan 2006 • An AHM will be scheduled Jan 2007 6.E.1. SIO Application Codes SIO/UCSD plans to use the OptIPuter for data processing and visualization of NSF-funded projects USArray/EarthScope, RIDGE and ROADnet. We will also incorporate OptIPuter DVC middleware into its applications to efficiently move multiple gigabyte scene files among clusters. We will use OptIPuter visualization software (e.g. EVL’s Ethereon) to explore multiple seismic volumes and high-resolution satellite images over large tiled displays, and plan to upgrade our current Mac-based display from 17-Megapixels to 50-Megapixels. In addition, we plan to continue and enhance our collaborations with OptIPuter affiliate partner NASA.

The OptIPuter FY2005 Annual Progress Report and FY2006 Program Plan 67
6.E.2. SDSU Application Codes SDSU (Frost) hopes to link SDSU to SDSC and Calit2 at 10GigE speeds for shared and collaborative visualization efforts. We also hope to have persistent links to other research efforts such as GLORIAD <http://www.gloriad.org> in order to connect to China and Central Asia. We plan on further developing our serving of California, US, and global datasets for use by emergency responders, disaster management and relief, and education. By building large datasets on servers that are able to serve fly-throughs to millions of people, we hope to leverage the impact of OptIPuter to a much larger audience than the science community. This should have broader impact on society, decision-making, the environment and homeland security. We are also trying to link SDSC and Calit2 to the Reuben H. Fleet Science Theatre in San Diego and then to other major science and exploratoriums across the country.
6.E.3. NCMIR/BIRN Application Codes NCMIR/BIRN plans to deploy persistent portals between the BIRN Coordinating Center (BIRN-CC) and NCMIR with HDTV and data screens shared between the two sites. We will continue to provide specifications and datasets to EVL for the development of Ethereon. And, we will continue to build and refine a global network of resources with OptIPuter partners to run OptIPuter instances spawned from the Telescience Portal.
6.E.4. Education and Outreach Activities UCSD/PREUSS SCHOOL…UCSD/SIO (Kilb) plans to incorporate UIC’s RoomQuake in a San Diego classroom. Together UCSD and UIC plan to streamline the embedded phenomena component of RoomQuake, in order to to accommodate 100 classrooms running RoomQuake via a centralized server. In addition, UCSD/SIO plans to develop web-based learning tools, incorporating OptIPuter visualization technology, and explore new, remote Education & Outreach opportunities, such as classroom-to-museum, classroom-to-shipboard, classroom-to-SIO, etc.
CHICAGO, IL…During Year 4, UIC (Moher) will expand operations from Lincoln and Galileo elementary schools to a third school: the National Teacher’s Academy (NTA), a developmental school in Chicago, IL. NTA serves a population (100% African-American) that resides in the Harold Ickes Homes, a housing project adjacent to the school; NTA student performance on state-mandated standardized examinations is among the lowest in the Chicago Public Schools. All of our existing applications (RoomQuake, RoomBugs, HelioRoom) will be deployed at NTA during the school year in multiple classrooms, providing us with an opportunity to evaluate instructional designs and learning gains for “embedded phenomena” with urban learners.
For research on student learning in these environments, we will employ the CAT and Protocol Capture systems developed during Year 3. An important additional focus during Year 4 will be an attempt to significantly scale the impact of these applications by tailoring them for delivery on conventional classroom computers. This work will entail the development of a common architectural platform for configuring and scheduling “embedded phenomena” (as well as repositories for capturing and sharing classroom practices in using the systems) and the formation of a core RoomQuake “teacher cohort” that can serve as the basis for spreading adoption in the future.
UIC, in collaboration with UCSD/SIO, will test these new resources by deploying a web-based version of RoomQuake in at least a half-dozen schools during Year 4, with the goal of increasing that number by an order of magnitude during Year 5. Moher and Kilb are considering developing a Magnitude Estimator; from a given seismogram, a user can measure the P- and S-wave arrival times and the largest amplitude of the seismic wave and compute the earthquake’s magnitude. Tentative plans also include the development of a neurological simulation of motor control (RoomBrain) and a simulation focusing on Lake Michigan ecologies and water quality (RoomLake).
UCSD/SIO OUTREACH ACTIVITIES…UCSD/SIO (Kilb) is involved with the annual SIO Teacher Workshop, graduate student visualization contest, developing visualizations for the Yellowstone Visitor’s Center, and distributing visual objects for use in formal/informal education through the OptIPuter storage cluster.
ANNUAL OPTIPUTER MEETING…An All Hands Meeting and Open House will be held in January 2006, with some days dedicated to OptIPuter partners and some days open to the wider e-Science and high-performance computing and communications communities.
IGRID 2005 AND GLIF…Results from the iGrid event and GLIF meeting will be documented and posted on their respective websites. Also, Smarr, DeFanti, Brown and de Laat are guest editors of a special iGrid issue of the Elsevier journal FGCS: The International Journal of Grid Computing: Theory, Methods and Applications, to appear in mid 2006.

The OptIPuter FY2005 Annual Progress Report and FY2006 Program Plan 68
7. OptIPuter FY2005 Expenses (Year 3)
7.A. FY2005 Expense Justification
7.A.1. Introduction In October 2002, the OptIPuter project was awarded 90% of its original requested amount; however, annual funding was not consistently allocated throughout the five years of the grant, and was below the norm in Year 1 and above the norm in Year 2. While overall goals can be achieved over the lifetime of the award, some of the proposed deliverables were pushed out to later years. The Year 1 budget was $1,910,000; the Year 2 budget was $3,460,000, and Years 3-5 are each $2,710,000. To rationally deal with this increase in funds in Year 2, participating sites were encouraged to use some of the additional funds to purchase an OptIPuter cluster.
Year 3 OptIPuter funding is a total of $2,710,000. Allocations to participating sites are as follows:
UCSD $1,350,000 UIC $775,000 NU $67,500 UCI $180,000 USC $180,000 SDSU $90,000 TAMU $67,500
7.A.2. UCSD FY2005 Expense Justification UCSD repurposed some third-year services, graduate-student researcher positions (GSRs) and staff funds to address project goals. UCSD continued to focus on OptIPuter networking infrastructure deployment on campus and accelerated applications and middleware development efforts, by:
• Providing Andrew Chien with GSR support for continued middleware and protocol development. • Providing Mark Ellisman with staff support to add a new 17-node Sun Opteron compute cluster and to
demonstrate biomedical applications of the BioWall display. • Providing John Orcutt with SIO staff support to build a new Apple-based GeoWall2 to demonstrate GIS
and Earth science applications. • Providing Phil Papadopoulos with staff support to add a new 17-node Sun Opteron compute cluster at
SDSC, build a new 9-tiled display wall, and develop Rocks. • Building a 17-node Sun Opteron compute cluster at JSOE, deploying a Cisco router to upgrade the
backbone from a 10GigE chain to a 10GigE star topology, and bringing up the 10GigE CAVEwave over NLR between UCSD and StarLight in Chicago.
Smarr, Papadopoulos, Ellisman, Chien, DeFanti, Humphries, Karin and Hidley received salaries. UCSD hired one 75%-time and three 25%-time professional staff, and a total of 4 graduate students. Equipment expenses totalled ~$132,813 to date, for clusters, networking components, and a final payment for the Chiaro router.
The UCSD campus provided the following in support of OptIPuter:
• Campus cost-share funds • Calit2 Graduate Fellowships (2) • San Diego Diversity Fellowships (2)
7.A.3. NU FY2005 Expense Justification No salary funds were requested.
An OptIPuter node was purchased for research experiments. These nodes are interconnected using lightpaths based on DWDM, a fairly mature technology that has been used by providers for many years. However, lower costs, newer functions, and emerging architectures for the current generation of DWDM devices provide opportunities for creating new types of data-transport services; e.g., those allowing dynamic lightpath provisioning. In addition, these new architectures take advantage of new management and control plane techniques. Building on these and related technologies, the OptIPuter can be based on infrastructure that is no longer a common data communications fabric

The OptIPuter FY2005 Annual Progress Report and FY2006 Program Plan 69
but instead functions as a distributed backplane – a large scale, extended systems bus.
Travel supported trips by Joe Mambretti to OptIPuter project meetings and to national conferences where the achievements of the OptIPuter were highlighted and demonstrated.
7.A.4. SDSU FY2005 Expense Justification OptIPuter funds covered one month of Eric Frost’s salary and partial support for 2 graduate students (due of student availability).
Remaining funds are being repurposed and will be spent on a 10TB storage cluster as well as 10GigE switches to transport data between servers across the SDSU’s campus network to SDSC/UCSD. Quotes are being obtained so purchases can be made in August. Sensor equipment was also purchased in order to make imagery real-time and to add people location information to large imagery files.
Travel funds enabled us to attend several conferences to interact with other researchers. John Graham attended conferences on mapping, server configurations, and data management of very large datasets. John is helping with OptIPuter deliverables even though he is not being paid a salary.
Materials and supplies funding enabled us to build applications, collect large datasets and repair computer equipment.
Consultant services pay for image processing assistance.
7.A.5. TAMU FY2005 Expense Justification Salary funds supported a Research Scientist to work on this project.
Travel enabled the Research Scientist to attend the OptIPuter All Hands Meeting in January in San Diego, the CGIV05 Conference in Beijing, China in July 2005 to present a joint paper, and will cover travel to the iGrid meeting in San Diego in September 2005 to serve on a panel.
Additional computer equipment was also purchased for our OptIPuter visualization cluster. This year was very productive with the TAMU group being able to collect performance results for the Vol-a-Tile visualization application on TAMU’s OptIPuter node. This work was published in the CGIV05 Conference.
Note: It was an oversight to not first request NSF persmission for international travel to Beijing, and we hope this expense will be honored.
7.A.6. UCI FY2005 Expense Justification OptIPuter funds covered partial summer salary for Goodrich, Kim and Smyth and 2 graduate students. Kim and Smyth were each paid less summer salary than projected, and one graduate student received a Fellowship and did not require full-year funding, so salary expenses were less than originally budgeted.
We request that unspent overall surplus in Year 3 be carried over into Year 4 to provide partial support for David Newman, a project scientist who has recently joined Smyth’s group. Newman will help develop interactive visualization software for UCI’s OptIPuter multi-tiled display cluster.
Some clusters and display hardware have been purchased; additional purchases will be made this summer.
Travel funds were used to attend OptIPuter project meetings and to give presentations at conferences.
Due to the new $5,000 equipment threshold, many items previously classified as equipment are now categorized as Materials & Supplies, increasing the expenditure in this category to $9,402.
7.A.7. UIC FY2005 Expense Justification Note: Funds from various budget categories were, in some cases, not expended but instead carried over from previous award periods, so reviewing individual program year accounting alone can be misinterpreted. This is especially true in the current award year, since it appears that UIC has over expended categories by quite a lot, when in actuality we are expending previous period unexpended funds in addition to the current period. (See Cumulative Budget in Section 9.B.6.)
DeFanti’s salary was shifted to the UCSD budget. Instead, UIC supports NCSA/UIUC’s Donna Cox, Bob Patterson

The OptIPuter FY2005 Annual Progress Report and FY2006 Program Plan 70
and Michael Welge. Salary funds covered partial salaries for 5 faculty and 4 staff (including OptIPuter project manager Brown) and 7 graduate students.
Travel funds helped send faculty, staff and students to San Diego for OptIPuter meetings and to conferences, such as SC 2004 and AGU 2004, to give presentations and or demonstrations.
Materials & Supplies funding paid for small equipment and component purchases.
Computer Service expenses paid for OptIPuter-relevant software licenses and upgrades, conference booth expenses (e.g., networking drops at SC), shipping to send OptIPuter visualization cluster and display equipment to SC 2004 and AGU conferences, hardware repairs and maintenance contracts, and conference registration fees.
Tuition remission is included as a direct cost to this proposal, calculated at 34.5% of Research Assistant academic year salaries.
7.A.8. USC FY2005 Expense Justification Note: As part of ISI/USC’s networking efforts, this year new activities on robust, secure protocols were initiated and XCP prototyping was phased out onto other development projects. Funds were spent as originally requested and we did not have to reallocate among the major budget categories.
ISI/USC salary expenditures were steady for our ongoing visualization efforts; network personnel salaries were spent more slowly at first as we developed a new plan focused on the robustness and security of network protocols, but spending is now on the rise. The pace will pick up with the recruitment of new graduate students for the task.
Travel funds enabled people to attend SC 2004, OptIPuter project meetings, and the Paris IETF meeting.
Note: It was an oversight to not first request NSF persmission for international travel to Paris, and we hope this expense will be honored.

The OptIPuter FY2005 Annual Progress Report and FY2006 Program Plan 71
7.B. FY2005 Expenses 7.B.1. UCSD FY2005 Expenses Submitted to NSF.
7.B.2. NU FY2005 Expenses Submitted to NSF.
7.B.3. SDSU FY2005 Expenses Submitted to NSF.
7.B.4. TAMU FY2005 Expenses The Texas Engineering Experiment Station (TEES) is a nember of the Texas A&M University System and the Texas A&M Engineering Program.
Submitted to NSF.
7.B.5. UCI FY2005 Expenses Submitted to NSF.
7.B.6. UIC FY2005 Expenses Submitted to NSF.
7.B.7. USC FY2005 Expenses Submitted to NSF.

The OptIPuter FY2005 Annual Progress Report and FY2006 Program Plan 72
8. OptIPuter FY2006 Budgets (Year 4)
8.A. FY2006 Budget Justification
8.A.1. Introduction Year 4 OptIPuter funding is a total of $2,710,000. Allocations to participating sites are as follows:
UCSD $1,360,000 UIC $765,000 NU $67,500 UCI $180,000 USC $180,000 SDSU $90,000 TAMU $67,500
8.A.2. UCSD FY2006 Budget Justification Salary support for Smarr will cover one month at 50%. Ellisman will be funded for 1 month. Papadopoulos, Chien, Karin and Hidley will be paid for one month each. John Orcutt’s salary funds will be used to support SIO Viz Cluster efforts. Tom DeFanti will be paid for 3 months at 100%, Julie Humphries will be paid for 1 month at 100%, Aaron Chin will be funded for 12 months at 75%. UCSD requests funds for two part-time Academic Professionals (for Papadopoulos and Ellisman), 4 graduate students, and a project coordinator (“Other” category) for 12 months at 25%.
Equipment funds will be ued to buy networking, computing and/or visualization gear.
Travel expenses are requested in the amount of $25,000.
Participant costs will defray the costs of OptIPuter All Hands Meeting and NSF Site Visit meetings.
We request $20,000 for Materials and Supplies. We are also requesting $152,830 in “Other” direct costs, to pay for campus tech services, telecommunication costs, computer support/maintenance costs and network maintenance.
8.A.3. NU FY2006 Budget Justification NU requests funds to cover a portion of a graduate student researcher.
One new OptIPuter cluster will be purchased to enable us to test the potential of agile optical networking by connecting the cluster directly to an optical testbed.
Travel funds will enable us to go to OptIPuter project meetings and to national conferences to highlight and demonstrate achievements of the OptIPuter.
8.A.4. SDSU FY2006 Budget Justification We request one-month salary for the PI (Frost) and nine-month salary for PhD student. We also request partial support for technical staff member John Graham to build datasets, manage servers and help with network engineering.
Equipment purchases of a networked storage device and 10GigE cards for our SGI Prism are planned.
Travel funds will be used to attend conferences in the US and overseas.
Should any funds remain, we use them to pay for equipment repairs (Materials and Supplies).
8.A.5. TAMU FY2006 Budget Justification The majority of FY2006 funding will be used to support the TAMU research scientist working on this project.
Travel funds are requested to attend OptIPuter meetings and conferences to disseminate research results.
8.A.6. UCI FY2006 Budget Justification One-month summer salary is requested for Goodrich, Kim and Smyth, as well as two graduate student research

The OptIPuter FY2005 Annual Progress Report and FY2006 Program Plan 73
assistantships (GSRs).
Travel funds are requested to attend OptIPuter meetings and major conferences to give presentations and/or demonstrations of research efforts.
Some funding is requested for project-related Materials and Supplies.
8.A.7. UIC FY2006 Budget Justification DeFanti’s salary will be paid from the UCSD budget; UIC will use funds previously allocated to him to cover partial salaries for Donna Cox, Bob Patterson and Michael Welge. Fringe benefit rates have been modified to be consistent with current rates, as we discovered that this expense never remains the same as budgeted in the original proposal and can easily escalate over time. Given UIC’s RA stipend increase, we had to reduce the number of Research Assistants supported by this grant to 7 (3 post-qualifier and 4 pre-qualifier) for 11 months at 50%.
No equipment funds are requested.
Travel funds will be used to pay for faculty, staff and students to attend the OptIPuter project meetings and major conferences where we give OptIPuter-related presentations and/or demonstrations.
We will buy needed replacement parts using Materials & Supplies funds.
Computer Services funds will pay for relevant software licenses, software upgrades, etc.
Other direct costs are used to pay graduate research assistant tuition remissions.
8.A.8. USC FY2006 Budget Justification Partial-month salaries for PI Bannister and co-PI Kesselman are requested, as well as partial salaries for researchers Joe Touch, Marcus Thiébaux and Aaron Falk. One full-time graduate student is also requested.
Travel funds are requested to attend OptIPuter project meetings, and major conferences and workshops, such as IETF, iGrid, SC 2005, and SIGGRAPH, as well as visit NSF (Washington DC).
We request $2,598 for miscellaneous Materials and Supplies.
Computer services in the amount of $8,099 cover ISI’s Information Processing Center costs.
Other Direct Costs includes GRA Benefits, a portion of Tuition Assistance, and a portion of ISI Common costs. Note: A portion of Tuition Assistance and ISI facility costs are being committed as Cost Share in the amount of $20,966.

The OptIPuter FY2005 Annual Progress Report and FY2006 Program Plan 74
8.B. FY2006 Budgets 8.B.1. UCSD FY2006 Budget Submitted to NSF.
8.B.2. NU FY2006 Budget Submitted to NSF.
8.B.3. SDSU FY2006 Budget Submitted to NSF.
8.B.4. TAMU FY2006 Budget The Texas Engineering Experiment Station (TEES) is a nember of the Texas A&M University System and the Texas A&M Engineering Program.
Submitted to NSF.
8.B.5. UCI FY2006 Budget Submitted to NSF.
8.B.6. UIC FY2006 Budget Submitted to NSF.
8.B.7. USC FY2006 Budget Submitted to NSF.

The OptIPuter FY2005 Annual Progress Report and FY2006 Program Plan 75
9. OptIPuter Cumulative Budgets
9.A. TOTAL Expenditures Cumulative Summary Submitted to NSF.
9.B. Cumulative Budgets 9.B.1. UCSD Expenditures Cumulative Submitted to NSF.
9.B.2. NU Expenditures Cumulative Submitted to NSF.
9.B.3. SDSU Expenditures Cumulative Submitted to NSF.
9.B.4. TAMU Expenditures Cumulative The Texas Engineering Experiment Station (TEES) is a nember of the Texas A&M University System and the Texas A&M Engineering Program. Submitted to NSF.
9.B.5. UCI Expenditures Cumulative Submitted to NSF.
9.B.6. UIC Expenditures Cumulative Submitted to NSF.
9.B.7. USC Expenditures Cumulative Submitted to NSF.

The OptIPuter FY2005 Annual Progress Report and FY2006 Program Plan 76
10. UCSD Cost Share Letter Submitted to NSF.


![3Q FY2006 실적보고서 070117 - Mirae Asset Daewoo · 2012-01-28 · - 2 - fy2006 3분기 실적보고서 fy2006 3q (2006년10월 ~ 2006년12월) 재무 및 영업 현황 [표2]](https://static.fdocuments.net/doc/165x107/5e417350edfce95bc3092578/3q-fy2006-eeoe-070117-mirae-asset-daewoo-2012-01-28-2-fy2006.jpg)