


Languages
Pages
Legal


1
www.greenstream.net
Managing risk and utilizing opportunities Managing risk and utilizing opportunities in phase 2 of EU ETSin phase 2 of EU ETS
Harri Roto, phone +358 40 840 8007, email [email protected]
November 20th 2007

2
www.greenstream.net
GreenStream in brief GreenStream in brief
• GreenStream is a leading Northern European company in the carbon markets and renewable energy markets focusing on:
- Renewable energy projects
- Greenhouse gas offset projects
- Brokerage and portfolio management of carbon units and renewable energy certificates
• Offices in Helsinki, Hamburg, Oslo, Stockholm, Vilnius and Beijing

• Services including- Brokerage of carbon credits and green certificates
- Portfolio management servicesGreen
Certificates, Broker of the Year
2004, 2005, 2006
Intermediary
• Services including- Strategies, market analysis, project financing
- CDM/JI/GIS project services
Advisory
3
www.greenstream.net
Core competence
Services offered
Green Investment
• Fund management (carbon and renewable energy); current investment vehicles include
- Multilateral Carbon Credit Fund (EBRD and EIB)
- Fine Carbon Fund
- Blåfall
Core competencies of GreenStreamCore competencies of GreenStream

4
www.greenstream.net
European Union Emissions Trading SchemeEuropean Union Emissions Trading Scheme
Overview Market development
321
1,101
0
500
1,000
1,500
2005 2006
MtC
O2
0
10
20
30
40
24/06/2005 24/12/2005 24/06/2006 24/12/2006 24/06/2007
EUR
/ a
llow
ance
0
10002000
3000
4000
50006000
7000
8000
Vol
ume
(ktC
O2)
ECX Dec 08 volume Spot ECX Dec 08
EU ETS trading
Price development of EUAs
6.4
19.4
0
10
20
30
2005 2006
EUR
bill
ion
Source: State and Trends of the Carbon Market 2007, World BankFigures converted from USD to EUR using ECB´s average annual exchange rates
Source: Reuters
1) Source: State and Trends of the Carbon Market 2007, World Bank2) Based on estimates by UBS, JP Morgan, Société General, Deutsche Bank and Citigroup3) Source: Communication "Limiting Global Climate Change to 2° Celsius: The way ahead for 2020
and beyond, EU
• The largest emissions trading market- Market value EUR 19.4 billion in 2006(1)
- Covers some 12,000 installations in the EU
• Linking Directive allows CERs and ERUs
- Emission reduction credits from CDM/JI projects can be imported into the EU ETS
• Second phase 2008-2012- More stringent allocations and higher
prices expected
- Estimated average shortfall of 1.25 billion tonnes of carbon dioxide equivalent(1)
- Analysts forecast EUA prices between EUR 20-40 per allowance(2)
• Third phase 2013-2017 (expected)- GHG emission reduction target 20 % of
1990 baseline by 2020(3)

Portfolio ManagementPortfolio Management

Why Manage the EUA portfolio?
• Not just a bureaucratical burden but valuable assets• EUA allowances are a raw material for production,
similar to fuels & other costs of production• Not doing anything = taking a view on the price
development• 2005-2007 period has shown extreme volatility in
price• The lesson learned: manage the price risk

© GreenStream Network Oy
Portfolio ManagementPortfolio Management
•Estimates/ data regarding emissions and allocated allowances•Creating trading and risk management policy•Implementing the strategy

© GreenStream Network Oy
Portfolio Management - examplePortfolio Management - example
•Company A has an estimated under allocation•The hedging of the deficit of a specific year (or month) will start well in time•There is an agreed ”pipeline” in which the hedge level must be at any moment of time•Emission estimates important

© GreenStream Network Oy
Portfolio Management -examplePortfolio Management -example

© GreenStream Network Oy
Portfolio Management - examplePortfolio Management - example

Portfolio Management
• Strategy depends on the nature of business of each company
• Some have a real option to not produce and to sell the EUA’s instead – some do not Leads into different strategies
• CER/ ERU use an integral part

12
www.greenstream.net
CERs – a great opportunityCERs – a great opportunity
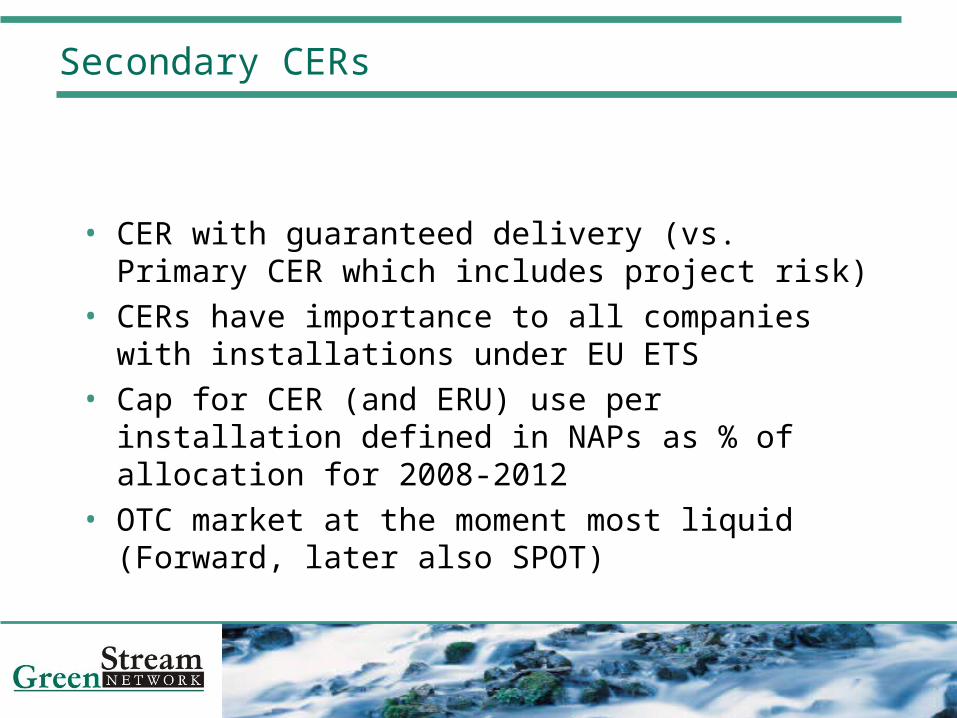
Secondary CERs
• CER with guaranteed delivery (vs. Primary CER which includes project risk)
• CERs have importance to all companies with installations under EU ETS
• Cap for CER (and ERU) use per installation defined in NAPs as % of allocation for 2008-2012
• OTC market at the moment most liquid (Forward, later also SPOT)

SCER08, EUA08 (Point Carbon)
10.00
12.00
14.00
16.00
18.00
20.00
22.00
24.00
4.6.
2007
6.6.
2007
8.6.
2007
12.6
.200
7
14.6
.200
7
18.6
.200
7
20.6
.200
7
22.6
.200
7
26.6
.200
7
28.6
.200
7
2.7.
2007
4.7.
2007
6.7.
2007
10.7
.200
7
12.7
.200
7
16.7
.200
7
18.7
.200
7
20.7
.200
7
24.7
.200
7
26.7
.200
7
30.7
.200
7
1.8.
2007
3.8.
2007
7.8.
2007
9.8.
2007
13.8
.200
7
€/tC
O2
EU Allowance December 2008
Secondary CER December 2008

EUA-CER SWAP
• Secondary CERs valued today at ~80% of EUAs• A company with EUAs can create positive cash flow and/ or
more credits for compliance by exchanging EUAs for CERs• EVERY COMPANY UNDER EU ETS SHOULD DO IT!• Project markets (primary CERs) not as easily accessible and
managing project risks is an issue • Example 1 (figures only exemplary, not an offer):
– Company A delivers 80kt EUAs and receives 100kt CERs (forward deliveries)
• Example 2 (figures only exemplary, not an offer):– Company A delivers 100kt EUAs and receives 100kt CERs +
400000€ cash (forward deliveries & payment)

16
www.greenstream.net