YOUTH AND MOBILITY
37
YOUTH AND MOBILITY Children and Youth on the move across West and Central Africa in 2018
Transcript of YOUTH AND MOBILITY

YOUTH AND MOBILITYChildren and Youth on the move across West and Central Africa in 2018

NOTES & DISCLAIMERS
Permission is required to reproduce any part of this publication.Permission to be freely granted to educational or non-profitorganizations.
The opinions expressed do not necessarily reflect the views of theInternational Organization for Migration (IOM). The designationsemployed, and the presentation of material within the report do notimply the expression of any opinion whatsoever on the part of IOMconcerning the legal status of any country, territory city or area, or ofits authorities, or concerning its frontiers or boundaries.
This document was produced with the financial assistance of theEuropean Union, the Ministry of Foreign Affairs of the Netherlands, theUS Government and the United Kingdom’s Department forInternational Development (DFID). The views expressed herein can inno way be taken to reflect the official opinion of the donors.
© International Organization for Migration (IOM) March 2019
IOM is committed to the principle that humane and orderly migrationbenefits migrants and society. As an intergovernmental organization,IOM acts with its partners in the international community to assist inmeeting the operational challenges of migration, advanceunderstanding of migration issues, encourage social and economicdevelopment through migration, and uphold the human dignity andwell-being of migrants.
For feedback or question, please contact: RO Dakar, Division of Emergency - [email protected] Jusselme – [email protected]
FUNDING SUPPORT
This report was produced by DTM Regional Support team for West and Central Africa with funding support from:
This project is funded bythe European Union
2

4.3. Region of origins by intended destinations - WCA 21 4.4. Region of origins by intended destinations - North Africa/Europe 224.5. Intended destinations 234.6. Intended destinations by nationality 244.7. Reason for choice of region of destination 25
V. Characteristics of travel 265.1. Mode of travel 275.2. Funding of travel 28
VI. Difficulties faced 296.1. Travel difficulties occurrence 306.2. Travel difficulties by countryof interview 316.3. Travel difficulty by sex 326.4. Travel difficulties by type 33
VII. Information needs 34Information needs by country 35
Methodology and sources 36
Note and disclaimer 2Acronyms and country code 4Introduction 5Executive Summary 6
I. Data Collected 7Metadata 8
II. Demographics 92.1. Age 102.2. Gender 112.3. Marital Status 122.4. Education 132.5. Occupation 14
III. Nationality 153.1. Nationals 163.2. Respondants by nationality and country of interview 17
IV. Origin and Destination 184.1. Origin and transit 194.2 Reasons for travel 20
TABLE OF CONTENTS
3

ACRONYMS AND COUNTRY CODES
Acronyms
DTM Displacement Tracking Matrix
FMP Flow Monitoring Points
FMR Flow Monitoring Registry
FMS Flow Monitoring Survey
IOM International Organization for Migration
WCA West and Central Africa
Country Code
BFA Burkina Faso
CIV Côte d’Ivoire
CMR Cameroon
DZA Algeria
GIN Guinea
GMB The Gambia
GNB Guinea-Bissau
LBR Liberia
LBY Libya
MLI Mali
NER Niger
NGA Nigeria
SEN Senegal
SLE Sierra Leone
TCD Chad
4

Context, objectives and limitations
To ensure evidence-based policy andprogramming, the internationalorganization for Migration (IOM) throughits Displacement Tracking Matrix (DTM)activities, set up Flow Monitoring Points(FMPs) to collect data on the movementsand profiles of migrants along the mainmigration routes in West and CentralAfrica (WCA).
The Flow Monitoring Survey (FMS) is acomponent of IOM's DisplacementTracking Matrix (DTM) activities in WCA.Surveys are conducted with individualmigrants with the objective of gaining adeeper understanding of mobility in theregion.
The surveys are regularly analysed,providing key information on the profiles,migration routes and vulnerabilities ofmigrants. Data collected include the age,sex, country and area of origin, intendeddestination, level of education,employment status, main transit pointsand reason for travel of respondents.
The purpose of this report is to provide anoverview of youth mobility in West andCentral Africa. It presents an analysis ofsurveys conducted in 2018 with over11,000 individuals aged 14-24 years oldthroughout the region.
Further information about themethodology and form used can be foundat the end of the report.
The methodology used during FlowMonitoring Survey (FMS) exercises entailsome limitations. Surveys are conductedwith a sample of respondents. As a result,the findings presented in this report onlyreflect the situation of respondents andcannot be generalized to the entiremigrant population travelling in WCA.Moreover, results are impacted by thelocation at which interviews areconducted.
Nevertheless, the surveys give usefulindications on the profiles, routes,intentions, needs and vulnerabilities ofmigrants in West and Central Africa.
INTRODUCTION
5

EXECUTIVE SUMMARY
KEY FIGURES
11,454 under 25 years old
6
14-171%
18-24, 24%
25 +, 75%
25% of all
interviewees were under 25
Female11%
Male89%
11% of all
14-24 year-old respondents were women
and girls
6% of all 14-24 year-old interviewees were students at
the time of the interview
54% of all 14-24 year-old interviewees from Nigeria were
girls and women
29% of all 14-24 year-old interviewees declared having
faced difficulties during the travel
85% of all 14-24 year-old interviewees declared having
information needs
15% of all 14-24 year-old interviewees with information
needs indicated a specific need for information on return(specifically in Chad and Niger)
45,000 Travellers interviewed in 2018 in West and Central Africa

1. DATA COLLECTED

1. DATA COLLECTED
Metadata
Nearly 45,000 individuals were interviewed in 2018 byIOM enumerators in seven countries of the West andCentral Africa region (Burkina Faso, Chad, Guinea, Mali,Niger, Nigeria, Senegal). Of those, 11,454 (over aquarter of the total number) were youth aged 14-24years old: 1,3% were between 14 and 17 years old and24% between 18 and 24 years old.
Individuals under 25 were interviewed in more than 32high transit locations in all seven countries in which FlowMonitoring exercises were conducted (chart 1). Largepresence of under 25 travellers was identified in Mali (inBamako and Gogui), Guinea (near Kouremale andBoundoufourdou), and Niger (near Arlit).
1805
33582734
3557
Q1_2018 Q2_2018 Q3_2018 Q4_2018
2. NUMBER OF RESPONDENTS AGED 14-24, BY QUARTER
925
3293
5070
1356
135
104
571
BFA
GIN
MLI
NER
NGA
SEN
TCD
1. NUMBER OF RESPONDENTS AGED 14-24, BY COUNTRY OF INTERVIEW
45,000 travellers interviewed in 2018 in West & Central Africa
11,454 completed among travellers under 25
3. NUMBER OF FLOW MONITORING POINTS BY COUNTRY
10
Mali
8
Niger
3
Chad
2Nigeria5
Burkina Faso
3Guinea
1Senegal
8

II. DEMOGRAPHICS

2. DEMOGRAPHICS
2.1. Age
Of the 11,500 individuals interviewed aged 14-24, 5%were between 14 and 17 years old and 95% between 18and 24 years old (chart 1).
A more detailed breakdown by age of respondents(chart 2) shows an apparent and steady increase in thenumber of respondents with age (22% of the wholesample interviewed were 24 years old at the time of theinterview)
The age distribution by country of interview (chart 3)shows a larger share of respondents interviewed in Chadwere female (14% of the total number of respondentsunder 25).
<1% 1% 2% 2%5%
8%
12%13%
16%
19%22%
14 15 16 17 18 19 20 21 22 23 24
2. DISTRIBUTION OF RESPONDENTS BY AGE (14 TO 24 YEARS OLD)
14-17; 5%
18-24; 95%
1. SURVEY RESPONDENTS BY AGE
3%
7%
4%
5%
1%
14%
97%
93%
96%
95%
100%
99%
86%
0%20%40%60%80%100%
BFA
GIN
MLI
NER
NGA
SEN
TCD
3. AGE DISTRIBUTION BY COUNTRY OF INTERVIEW
14-17 18-24
10

0%
50%
100%
Female Male Female Male Female Male Female Male Female Male Female Male Female Male
BFA GIN MLI NER NGA SEN TCD
4. GENDER AND AGE DISTRIBUTION BY COUNTRY OF INTERVIEW
14-17 18-24
2. DEMOGRAPHICS
2.2. Gender
The gender distribution shows a high share of malerespondents: 89 per cent of interviewees were men andboys (chart 1). In comparison with the total number ofinterviews conducted in 2018 (45.000), there werefewer female respondents aged 14-24 (11%) thanfemale respondents among the total respondentpopulation (15%).
The age distribution of travellers interviewed by gendergives an overview of youth migration in the region. Theproportion of female respondent aged 14-17 is higheramong female interviewees (9% of female) than amongmale interviewees (5%) (charts 2 and 3)
The male/female ratio varies also by country. Nigeriahas the highest proportion of female aged 14-24interviews (49%) while Mali has the lowest (3%)
The age and gender distribution varies by country ofinterview. Higher proportion of boys under 18 years oldwas for instance observed among respondents in Chad(12% of youth respondents interviewed in the country),Guinea (6%) and Niger (4%), while the highest hare ofgirls under 18 years old were interviewed in Mali (1%) ofyouth respondents) (chart 4).
1% 10% 4% 85%
1. AGE AND GENDER DISTRIBUTION
Female (14-17) Female (18-24) Male (14-17) Male (18-24)
14-17; 9%
18-24; 91%
2. AGE DISTRIBUTION - FEMALE
14-17; 5%
18-24; 95%
3. AGE DISTRIBUTION - MALE
11

0%
10%
20%
30%
40%
None Primary LowerSecondary
UpperSecondary
Tertiary Post-graduate ProfessionalTraining
Koranic Other
1. EDUCATION LEVEL COMPLETED, BY SEX OF RESPONDENT
Female Male
2. DEMOGRAPHICS
2.3. Level of education
Of the 45,000 individuals interviewed, 19% had notcompleted any form of education and 21% attendedprimary school. The analysis of the highest level ofeducation completed by respondents aged 14-24 showstwo interesting trends when the results of male andfemale respondents.
The first visible trend from is the higher proportion offemale with higher education level (7% of female youthrespondents had a tertiary degree, compared to 2% ofmale youth respondents; 22% of women and girlrespondents under the age of 25 had completedsecondary education, as compared to 14% of men andboys aged 14-24).) (chart 1).
A second visible trend is that of the proportion of femalewho had not completed any form of education. 24% offemale interviewed have no education degree against21% of male respondents) (chart 1).
The education level often differs depending on theintended destination of the travellers interviewed. Asimilar trend was identified among young respondents.Those travelling within the West and Central Africaregion displayed a lower level of education than thoseheaded to North Africa or Europe: 45% of those headedto Europe have a secondary degree and 36% of thoseheaded to WCA (Chart 2).
0%
20%
40%
60%
80%
100%
Europe North Africa West and Central Africa
2. EDUCATION LEVEL ACHIEVED BY INTENDED DESTINATION
Other
Koranic
Professional Training
Post-graduate
Tertiary
Secondary
Primary
None
12

2. DEMOGRAPHICS
2.4. Marital Status
There were significant differences between the maritalstatus of female and male respondents. 33% of femalerespondents are married while only 5% of male are(chart 1).
Marital status did not vary significantly depending onthe region of intended destination, althoughrespondents travelling to Europe were more likely to besingle than those headed to other regions (2% single forEurope, 6% for WCA) (chart 2). However, it varies whendisaggregating data by destination and genderparticularly for men and women heading to North Africa(25% female married, 4% male married) (chart 4).
Similar observations can be made when comparing themarital status and the two main age tranches (14-17years old and 18-24) (chart 3).
0%
20%
40%
60%
80%
100%
Divorced Married Single Widowed Don't wantto answer
1. MARITAL STATUS BY SEX
Female Male
0% 10% 20% 30% 40% 50% 60% 70% 80% 90% 100%
14-17
18-24
3. MARITAL STATUS BY AGE
Divorced Married Single Widowed Don't want to answer
0%
10%
20%
30%
40%
50%
60%
70%
80%
90%
100%
Europe North Africa West and CentralAfrica
2. MARITAL STATUS BY INTENDED DESTINATION
Don't want to answer Single Married
0%
50%
100%
Female Male Female Male Female Male
Europe North Africa West and Central Africa
4. MARITAL STATUS BY SEX AND INTENDED DESTINATION
Married Single Don't want to answer
13

2. DEMOGRAPHICS
2.5. Occupation
The share of respondents who indicated beingunemployed at the time of interview varied significantlydepending on the intended destination, with over halfof respondents (53%) headed to Europe beingunemployed, compared to 35% of respondentstravelling within WCA (chart 1). Migrants who arestaying within west Africa are more likely to be selfemployed (i.e. traders).
More than 6% of the 14-24 interviewees indicated stillbeing a student at the moment of the interview (chart2). The proportion was higher among women and girlsrespondents (13%) than among men and boys (6%).
SHARE OF UNEMPLOYED RESPONDENTS, BY REGION OF INTENDED DESTINATIONFor those who intended to go to:
EUROPE
53%NORTH AFRICA
50%WCA
35%
0%
10%
20%
30%
40%
50%
60%
70%
80%
90%
100%
Europe North Africa West and Central Africa
1. OCCUPATION BY INTENDED DESTIONATION
Unemployed - not looking for a job
Unemployed - looking for a job
Student
Self-employed
Employed
No answer
14
0%
10%
20%
30%
40%
50%
60%
70%
80%
90%
100%
Female Male
2. OCCUPATION AND GENDER
Unemployed - not looking for a job
Unemployed - looking for a job
Student
Self-employed
Employed
No answer
*Unemployed – not looking for a job: individuals not part of the labor force and not activelyseeking employment

III. NATIONALITY

3. NATIONALITY
3.1. Nationals
The largest share of respondents under 25 years oldwere Guinean nationals (46%). followed by Malian(16%), Burkinabe and Niger (6% respectively)respondents. (Chart 1).
Overall, the distribution of nationalities corresponds tothe location of the flow monitoring points in the 7countries targeted by the data collection.
Among the main nationalities interviewed in the flowmonitoring surveys, Nigeria stand out as in its genderdistribution of respondents, 54% of respondentsinterviewed in 2018 are female. Female respondentsfrom Sierra Leone (17% of all respondents) and Chad(13%) follow Nigeria but with much smaller proportions(chart 2).
Two nationalities present a fairly high proportion ofunder 18 among the youth interviewed: Chad (14% of allrespondents under 25) and Mali (9%) (chart 3).
16%7%
7%
3%
4%
4%
46%
1% 4%
5%
2%
1%
Mali NigerChad
Nigeria
Burkina Faso
Côte d’Ivoire
Guinea
Sierra Leone
Senegal
Gambia
G. Bissau
Other
1. % OF RESPONDENTS BY COUNTRY OF NATIONALITY
10% 13% 9% 1% 3% 10% 9%
54%
3% 15% 13%
90%
87%
91%
99%
97% 90%
91%
46%
97% 85
%
87%
BFA CIV GIN GMB GNB MLI NER NGA SEN SLE TCD
2. NATIONALITY AND GENDER
Female Male
97%
99%
95%
100% 97%
91%
95%
96%
99%
100% 86%
BFA CIV GIN GMB GNB MLI NER NGA SEN SLE TCD
3. NATIONALITY AND AGE
14-17 18-24
16
3. NATIONALITY
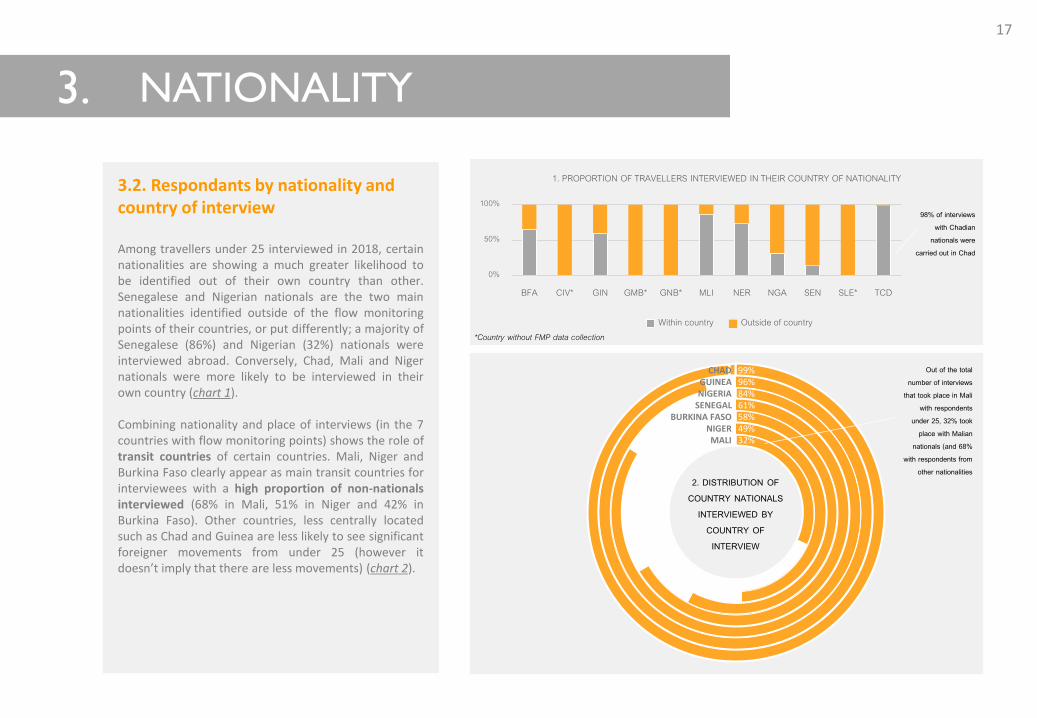
3.2. Respondants by nationality and country of interview
Among travellers under 25 interviewed in 2018, certainnationalities are showing a much greater likelihood tobe identified out of their own country than other.Senegalese and Nigerian nationals are the two mainnationalities identified outside of the flow monitoringpoints of their countries, or put differently; a majority ofSenegalese (86%) and Nigerian (32%) nationals wereinterviewed abroad. Conversely, Chad, Mali and Nigernationals were more likely to be interviewed in theirown country (chart 1).
Combining nationality and place of interviews (in the 7countries with flow monitoring points) shows the role oftransit countries of certain countries. Mali, Niger andBurkina Faso clearly appear as main transit countries forinterviewees with a high proportion of non-nationalsinterviewed (68% in Mali, 51% in Niger and 42% inBurkina Faso). Other countries, less centrally locatedsuch as Chad and Guinea are less likely to see significantforeigner movements from under 25 (however itdoesn’t imply that there are less movements) (chart 2).
0%
50%
100%
BFA CIV* GIN GMB* GNB* MLI NER NGA SEN SLE* TCD
1. PROPORTION OF TRAVELLERS INTERVIEWED IN THEIR COUNTRY OF NATIONALITY
Within country Outside of country
CHAD 99%GUINEA 96%NIGERIA 84%
SENEGAL 61% BURKINA FASO 58%
NIGER 49%MALI 32%
2. DISTRIBUTION OF COUNTRY NATIONALS
INTERVIEWED BY COUNTRY OF INTERVIEW
Out of the total number of interviews
that took place in Mali with respondents
under 25, 32% tookplace with Malian
nationals (and 68% with respondents from
other nationalities
*Country without FMP data collection
98% of interviews with Chadian
nationals were carried out in Chad
17

1V. ORIGIN AND
DESTINATION

0%10%20%30%40%50%
BFA CIV DZA GIN GMB MLI MRT NER NGA SEN TCD No transit
2. LAST COUNTRY OF TRANSIT BY INTENDED LOCATION
Europe North Africa West and Central Africa
4. ORIGIN AND DESTINATION
4.1. Origin and Transit
This section presents the regions (administrative level 1)of origin of travellers aged 14-24 years old interviewedin 2018.
Main regions of origins of travellers interviewed werelocated in areas at the intersection of Côte d’Ivoire,Mali, Burkina Faso and Senegal. These areas is wheremost travellers came from (map 1). Other significantregions of respondents are Zinger in Niger and otherregions of Guinea (Nzerkora)
Asked about their last country of transit, nearly half ofthe under 25 (48%) who intended to travel within Westand Central Africa did not mention a transit country,indicating that they were travelling directly from thecountry of departure to the country of intendeddestination. A similar proportion of respondentstravelling to North Africa indicated not having stayed ina country of transit (due to a high number of personsinterviewed in Mali directly or Niger)(41%).
1. REGIONS OF ORIGINS – UNDER 25
19

4. ORIGIN AND DESTINATION
75%
6%
13%
Burkina Faso
4.2. Reasons for travel
These charts display the main reason ofdeparture based on the main country ofdeparture of all under 25 respondents.
The main reason of travel of respondentsunder 25 years old was economic. Whethertrade-related, transhumant, or to look for ajob opportunity, labour movements wasalways the top reason of travel given byrespondent, regardless of the country ofdeparture. More than 90% of travellersdeparting from Liberia, Sierra Leone,Guinea-Bissau or Ghana and interviewed atFlow Monitoring Points indicated moving foreconomic reasons.
Notably, three countries showed differenttrends: respondents who had leftMauritania (75%), Algeria (39%) and Libya(17%) were primarily travelling for family-related reasons.
86%
3%11%
Côte d’Ivoire
84%
4%9%
Ghana59%
39%
Algeria
87%
3%9%
Guinea
95%
5%
Guinea-Bissau
89%
10%
The Gambia
93%
7%
Liberia
76%
17%
7%
Libya
22%
75%
Mauritania
94%
4%
Mali
79%
12%7%
Niger
89%
9%
Nigeria
97%
Sierra Leone
86%
3%10%
Senegal
75%
6%
10%6%
Chad
1. REASON FOR TRAVEL, BY COUNTRY OF DEPARTURE Economic opportunities Targeted violence, war, conflict
Attend family event (wedding, funeral, etc.) Other Re-join family
20

4.3. Region of origin by intended destinations - WCA
A large number of youth migrants who were travelling internally to WCA had departed from Kankan and Labé in Guinea, Kayes and Koulikoro in Mali, Tahoua in Niger.
4. ORIGIN AND DESTINATION
1. REGIONS OF ORIGINS – ALL FMS INTERVIEWSINTENDED TO HEAD WITHIN WEST AND CENTRAL AFRICA
2. REGIONS OF ORIGINS – UNDER 25 INTERVIEWINTENDED TO HEAD WITHIN WEST AND CENTRAL AFRICA
10%
9% 8% 5% 5% 5% 4% 3% 3% 2% 2% 2% 2% 2% 2% 2% 1% 1% 1% 1% 1%
29%
Cona
kry, G
IN
Kank
an, G
IN
Labe
, GIN
Mamo
u, GI
N
Kaye
s, ML
I
Boke
, GIN
Kind
ia, G
IN
Nzer
ekor
e, GI
N
Sego
u, ML
I
Zinde
r, NER
Bama
ko, M
LI
Hauts
-Bas
sins,
BFA
Kouli
koro
, MLI
Faran
ah, G
IN
Niam
ey, N
ER
Centr
e-Es
t, BFA
Taho
ua, N
ER
Batha
, TCD
Mara
di, N
ER
Taho
ua, N
ER
Mopti
, MLI
Othe
r
REGION OF ORIGIN FOR TRAVELLERS HEADED TO WCA - UNDER 25 INTERVIEWS
7% 6% 5% 4% 3% 3% 3% 3% 3% 2% 2% 2% 2% 2% 1% 1% 1% 1% 1% 1% 1%
42%
Cona
kry, G
IN
Kank
an, G
IN
Labe
, GIN
Zinde
r, NER
Kaye
s, ML
I
Taho
ua, N
ER
Mamo
u, GI
N
Mara
di, N
ER
Boke
, GIN
Kind
ia, G
IN
Ouad
dai, T
CD
Bama
ko, M
LI
Nzer
ekore
, GIN
Hauts
-Bas
sins,
BFA
Mara
di, N
ER
Taho
ua, N
ER
Centr
e-Es
t, BFA
Faran
ah, G
IN
Niam
ey, N
ER
Agad
ez, N
ER
Sego
u, ML
I
Othe
r
REGION OF ORIGIN FOR TRAVELLERS HEADED TO WCA – ALL INTERVIEWEES
21

1. REGIONS OF ORIGINS – ALL FMS INTERVIEWSINTENDED TO HEAD TO EUROPE OR NORTH AFRICA
4.4. Region of origins by intended destinations - Europe/North Africa
Interestingly, the areas of origins of travellers who intended to travel to Europe or North Africa were similar to that of respondents travelling within WCA. Kayes in Mali, Kankan,Labé and Mamou un Guinea are all still were all highly represented regions of departure.
4. ORIGIN AND DESTINATION
2. REGIONS OF ORIGINS – UNDER 25 INTERVIEWINTENDED TO HEAD TO EUROPE OR NORTH AFRICA
16%
10%
8%
5% 5% 4% 4% 3% 3% 3% 3% 3% 2% 2% 2% 2% 2% 1% 1% 1% 1%
19%
Labe
, GUI
Kaye
s, ML
I
Cona
kry, G
UI
Mamo
u, GU
I
Banju
l, GMB
Nzer
ekore
, GUI
Kank
an, G
UI
Bama
ko, M
LI
Kind
ia, G
UI
Kouli
koro
, MLI
Boke
, GUI
Zinde
r, NER
Daka
r, SEN
Centr
e, BF
A
Wes
tern,
GMB
Faran
ah, G
UI
Abidj
an, C
IV
Kaola
ck, S
EN
Sikas
so, M
LI
Sego
u, ML
I
Biss
au, G
NB
Othe
r
REGION OF ORIGIN FOR TRAVELLERS HEADED TO WCA - UNDER 25 INTERVIEWEES
10%
7% 6% 3% 3% 3% 3% 3% 3% 2% 2% 2% 2% 1% 1% 1% 1% 1% 1% 1% 1%
43%
Labe
, GUI
Kaye
s, ML
I
Cona
kry, G
UI
Mamo
u, GU
I
Banju
l, GMB
Bama
ko, M
LI
Nzer
ekore
, GUI
Kank
an, G
UI
Zinde
r, NER Ed
o
Daka
r, SEN
Kouli
koro
, MLI
Kind
ia, G
UI
Boke
, GUI
Abidj
an, C
IF
Delta Imo
Anam
bra
Enug
u
Centr
e, BF
A
Osun
Othe
r
REGION OF ORIGIN FOR TRAVELLERS HEADED TO WCA - ALL INTERVIEWEES
22

4. ORIGIN AND DESTINATION
4.5. Intended destinations
The sampling method used for the flow monitoring surveys doesn’t allow for the extraction of a representative figure of intended region of destination (compiled here into “West and Central Africa”, “Europe” and “North Africa”), however the sampling targeted certain populations in order to allow for a solid analysis by intended destination and comparison with different population groups (nationality, age category, etc.)
Main nationalities to all three intended region of destination is the same, indeed Guinean nationals under 25 (as indicated in previous slides) represent the most interviewed population group. Guinean nationals represent 51% of all those who indicated their intention to travel within the WCA region (45% of those who headed to Europe).
The variations by region of destinations shows an increase in the proportion of Malian nationals who intend to head to Europe (21% of all respondents) against those who intended to travel within the WCA region (16% of all respondents). An opposite trend is identified among Burkinabe nationals (higher proportion among those travelling within WCA: 11% than among those travelling to Europe: 3%).
11%2% 0%
51%
1% 0% 0%
16% 12%3% 2% 1%
BFA CIV CMR GIN GMB GNB LBR MLI NER NGA SEN SLE
INTENDED DESTIONATION: WCA
6% 5% 1%
50%
4% 1% 1%
16%9%
3% 3% 2%
BFA CIV CMR GIN GMB GNB LBR MLI NER NGA SEN SLE
INTENDED DESTIONATION: NORTH AFRICA
3% 5%0%
45%
10%1% 1%
21%
0% 3% 8%2%
BFA CIV CMR GIN GMB GNB LBR MLI NER NGA SEN SLE
INTENDED DESTIONATION: EUROPE
23

4. ORIGIN AND DESTINATION
4.6. Intended destinations by nationality
The region of intended destination varied significantlydepending on the nationality of the respondent. Thus,72% of Gambian nationals under 25 declared at the timeof the interview that their intended destination was inEurope, while 23% indicated travelling within NorthAfrica. This might be explained in part by the localisationof the points (being outside of The Gambia) but that’sstill a good indication of travel destinations. Similarly, asignificant share of youth from Senegal and Côte d'Ivoireintended to travel to Europe at the time of the interview(respectively 56 and 46%) (chart 1).
A comparison of intended destination shows a slightdifferent between age categories. Respondentsbetween the ages of 18 and 24 were more likely to betravelling to Europe (30%) or North Africa (26%) thanrespondents from other age groups (chart 2).
13%
45%28%
72%
38% 37%
1%
34%
55%37%
21%
32%
26%
23%
37%23%
31%
23%
20%
27%
66%
23%
47%
5%25%
40%
68%
44%25%
37%
0%
20%
40%
60%
80%
100%
BFA CIV GIN GMB GNB MLI NER NGA SEN SLE
1. REGION OF INTENDED DESTINATION, BY MAIN NATIONALITY OF RESPONDENT
Europe North Africa West and Central Africa
26%
17%
57%
30%
26%
44%
26%
17%
56%
2. INTENDED DESTINATION BY AGE CATEGORY
25 YEARS OLD AND ABOVE
14-17 YEARS OLD
18-24 YEARS OLD
24

4. ORIGIN AND DESTINATION
4.7. Reason for choice of region of destination
The reasons for which youth respondents chose a destination varied among the regions of destination. Economic reasons (appealing socio-economic conditions, looking for job opportunities) were more frequently mentioned by respondents who intended to head to Europe and North Africa than by those travelling within the WCA region. Travel for family-related reasons was highest among respondents headed for a destination in WCA, although a significant share of respondents going to Europe also indicated travelling for family-related motives.
23%
6%15%
4%
45%
6% 1% 2% 0%
Appealing socio-economicconditions
Ease of access toasylum procedures
Family/relatives inthe desireddestination
country
I followed myfriends, family
(travel in groups)
Job opportunities Well establishednetwork of co-
nationals
The onlyavailable/feasiblechoice (i.e. policy,
geographicalconstrains)
Returning to myown country
No answer
22%
2%9%
5%
57%
2% 1% 2% 1%
15%
2%
21%
4%
35%
4% 2%
15%
0%
We
st a
nd
C
en
tral
Afr
ica
No
rth
A
fric
aEu
rop
e
25

V. CHARACTERISTICS OF
TRAVEL

5. CHARACTERISTICS OF TRAVEL
5.1. Mode of travel
The majority (54%) of respondents indicated travellingin group. Nevertheless, whether respondents travelledin a group or on their own varied significantly dependingon the sex, age category, country of departure andcountry of destination of the respondent: travellers whohad departed from The Gambia (83%), Sierra Leone(74%) and Guinea Bissau (70%) were the most likely totravel with a group. The likelihood of travelling in agroup also increased the further away a travellers wasfrom his or her own country. Overall, 28 per cent ofrespondents who indicated travelling to Europe weretravelling alone (as opposed to 61% of respondentstravelling within the WCA region).
51% 44% 44%
17%30%
60%50% 45% 39%
26% 26%
43% 53% 55%
83%70%
39%43% 48% 59%
74%
41%
6% 3% 1% 1% 7% 6% 2% 1%
33%
BFA CIV GIN GMB GNB MLI NER NGA SEN SLE TCD
1. MODE OF TRAVEL, BY COUNTRY OF DEPARTURE
(blank)
group
alone
27% 36%
61%
73% 64%
39%
Europe North Africa West and CentralAfrica
group
alone60%51% 59%
40%49% 41%
Europe North Africa West and CentralAfrica
BFA
GIN
MLI
NER
NGA
SEN
TCD
2. MODE OF TRAVEL, BY SEX AND COUNTRY OF INTERVIEW
Female - alone Female - group Male - alone Male - group
3. MODE OF TRAVEL, BY AGE CATEGORY
14-17 YEARS OLD 18-24 YEARS OLD
27

5. CHARACTERISTICS OF TRAVEL
5.2. Funding of travel
Most (57%) respondents under 25 years old used theirsavings to pay for the travel (chart 1). The breakdown ofresults by intended destination shows that respondentstravelling to Europe relied more (39%) on family andfriends in the country of origin to fund the journey thanrespondents headed for other regions. This reflects therole played by migrants' families and communities in thedecision to migrate (chart 2).
The source of funding for the travel also varied by thecountry of origin, with a higher proportion of travellersusing family and friends in country in Niger, Nigeria andChad (chart 3).
Finally, the payment for travel is also varied also by agecategory, with family and friends contributing to up to61% of 14-18 years old respondents travel (comparedwith 31% among 18-24 years old respondents).
57%31%
9%
1% 2%
1. PAYMENT FOR THE TRAVEL
3
FAMILY AND FRIENDS (INORIGIN)FAMILY AND FRIENDS ABROAD
EARNINGS
OTHER
0%
20%
40%
60%
80%
100%
BFA CIV GIN GMB GNB MLI NER NGA SEN SLE TCD
3. PAYMENT FOR TRAVEL BY COUNTRY OF ORIGIN
3 FAMILY AND FRIENDS (IN ORIGIN) FAMILY AND FRIENDS ABROAD EARNINGS OTHER
43%64% 57%
39%21% 32%
17% 11% 7%
Europe North Africa West and CentralAfrica
2. PAYMENT FOR TRAVEL BY INTENDED DESTINATION
4. PAYMENT FOR TRAVEL BY AGE TRANCHE
AGE CATEGORY
SAVING
FAMILY AND FRIENDS
(PLACE OF ORIGIN)
FAMILY AND FRIENDS (ABROAD)
EARNING OTHER
TOTAL
14-17 31% 61% 11% 3% 7% 100%
18-24 71% 35% 11% 2% 3% 100%
28
SAVINGS
SAVINGS

VI. DIFFICULTIES FACED
36%
29%
35%
2. SHARE OF RESPONDENTS 25 YEARS OLD OR OLDER WHO EXPERIENCED
DIFFICULITIES EN-ROUTE
6. DIFFICULTIES FACED
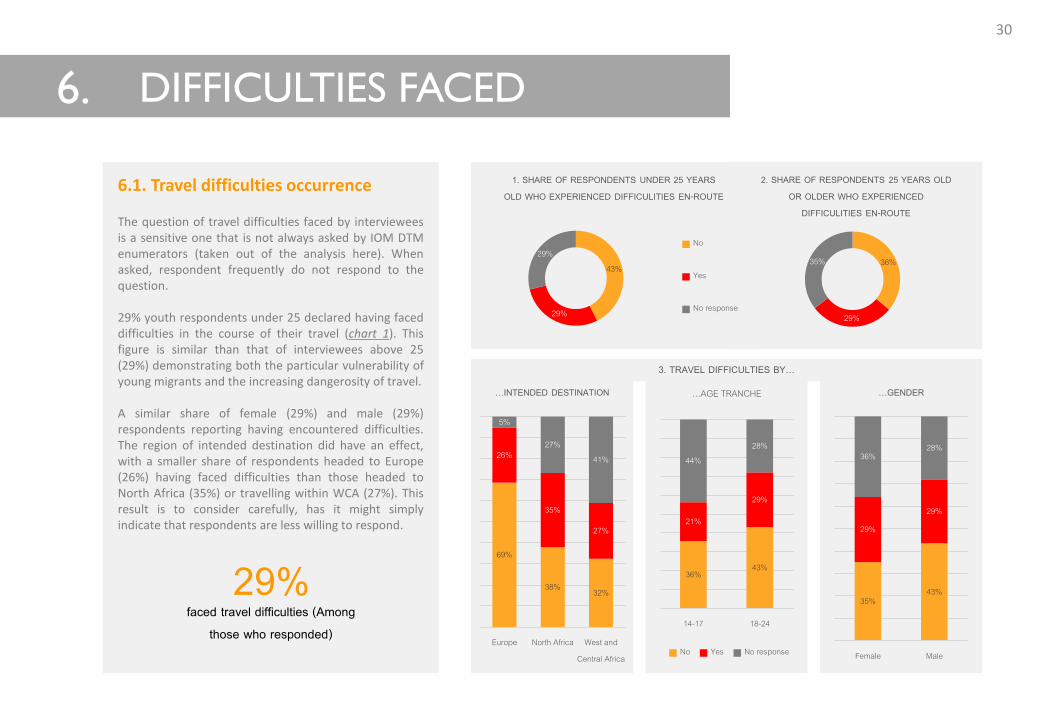
6.1. Travel difficulties occurrence
The question of travel difficulties faced by intervieweesis a sensitive one that is not always asked by IOM DTMenumerators (taken out of the analysis here). Whenasked, respondent frequently do not respond to thequestion.
29% youth respondents under 25 declared having faceddifficulties in the course of their travel (chart 1). Thisfigure is similar than that of interviewees above 25(29%) demonstrating both the particular vulnerability ofyoung migrants and the increasing dangerosity of travel.
A similar share of female (29%) and male (29%)respondents reporting having encountered difficulties.The region of intended destination did have an effect,with a smaller share of respondents headed to Europe(26%) having faced difficulties than those headed toNorth Africa (35%) or travelling within WCA (27%). Thisresult is to consider carefully, has it might simplyindicate that respondents are less willing to respond.
43%
29%
29%
1. SHARE OF RESPONDENTS UNDER 25 YEARS OLD WHO EXPERIENCED DIFFICULITIES EN-ROUTE
No
Yes
No response
69%
38% 32%
26%
35%
27%
5%
27%41%
Europe North Africa West andCentral Africa
…INTENDED DESTINATION
35%43%
29%
29%
36%28%
Female Male
…GENDER
3. TRAVEL DIFFICULTIES BY…
36%43%
21%
29%
44%28%
14-17 18-24
…AGE TRANCHE
No Yes No response
30
29%faced travel difficulties (Among
those who responded)

6. DIFFICULTIES FACED
6.2. Travel difficulties by country of interview and nationality
The largest share of respondents under 25 who indicated having come across difficulties were found in Burkina Faso (66% of interviewees who responded to this question), while the smallest proportions were found in Niger (7% in both countries) (map 1). However, it should be noted that this question wasn’t asked in certain places (below a table showing the proportion of respondents to whom the question was asked) (table 1) for lack of existing referral mechanisms in case of protection concerns
Main nationalities that faced travel challenges are displayed in table 2. Burkina Faso and Sierra Leone nationals have expressed the most challenges en-route (respectively 46% and 45%).
66%
MaliNiger
Chad
Nigeria
Burkina Faso
Guinea
Senegal
58%
30%
35%
7%
24%63%
1. DIFFICULTIES FACED, BY
COUNTRY OF INTERVIEW
31
Table 1. Proportion of interviewees to whom the question on travel difficulties was asked by country of interview
Burkina Faso 21%
Chad 41%
Guinea 42%
Mali 43%
Niger 70%
Nigeria 19%
Senegal 8%
46%
31%34%
25%
18%
8%
26%30%
45%
BFA CIV GIN GMB MLI NER NGA SEN SLE
2. TRAVEL DIFFICULTIES FACED BY NATIONALITY
6%
84%91%39%
78%
28% 19%
16%97%
6%
76%
1%
58%
23%99%
XX%
XX%Travel difficulty by location of interview
Travel difficulty by country of interview

43%
62%
3%
29%
71%
11%
91%
70%
27%
30%
31%
36%
61%
59%
47%
26%
29%
34%
25%
82%
8%
19%
27%
7%
13%
42%
29%
31%
10%
12%
69%
37%
5%
7%
1%
12%
45%
63%
55%
22%
11%
10%
Male
Male
Female
Male
Male
Male
Female
Male
Female
Male
Female
Male
Male
Male
BFA
CIV
GIN
GMB
GNB
MLI
NER
NGA
SEN
SLE
1. TRAVEL DIFFICULTY BY NATIONALITY AND GENDER
No Yes No response
6. DIFFICULTIES FACED
6.3. Travel difficulties by sex
Difficulties expressed by sex and nationality of respondents shows divers results. Indeed, among male respondents, Guinea-Bissau, Nigeria and Burkina Faso nationals have the highest proportion of respondentsindicating travel difficulty. Among female respondents, Guinea and Niger have the highest rate.
* Certains variables for countries or gender are not displayed in the chart 1 due to a low number of respondents that could not be analyzed as a stand alonevariable (e.g. Côte d’Ivoire female variable).
32

6. DIFFICULTIES FACED
6.4. Type of difficulties faced
The county of interview doesn’t necessarily reflects the actual location where the interview faced the difficulty en-route, it only reflects the location where this difficulty was report to IOM DTM enumerators.
No data on the type of difficulties was collected in Mali. Other countries of interviews are displaying a wide range of difficulties en-route for interviewees under 25. In Burkina Faso and in Niger, the main difficulties interviewees indicated is “financial issues” (respectively 34% and 32%), in Guinea the main issue is the lack or non conformity of ID (30%), in Chad and Nigeria, hunger is indicated as the main en-route difficulty (respectively 34 and 25%). In Senegal, the main difficulties en-route are “attacks”, arrests and hunger (all at 20%).
0%
10%
20%
30%
40%
50%
60%
70%
80%
90%
100%
BFA GIN NER NGA SEN TCD
2. TYPE OF DIFFICULTIES EN-ROUTE BY COUNTRY OF INTERVIEW
ARREST ATTACK DEPORTATION
FINANCIAL ISSUES HELD AGAINST HIS/HER WILL HUNGER
ID ISSUES INJURIES NO SHELTER
SICKNESS
33

VII. INFORMATION NEEDS

0% 20% 40% 60% 80% 100%
BFA
GIN
MLI
NER
TCD
1. INFORMATION NEEDS BY COUNTRY OF INTERVIEW
No
Dont know
Yes
7. INFORMATION NEEDS
Information needs
DTM enumerators asked also questions on informationneeds and type of information needed by respondents14-24 years old. As for the questions on difficulties en-route (section 6), these questions were not alwaysasked by the enumerators. Questions were asked only inlocation where possible information could be provided.(below a table showing the proportion of respondentsto whom the question was asked) (table 1). Due to thelow number of responses in Senegal and Nigeria, thesetwo countries are not analysed.
Overall, out of all those who where asked this question,85% indicated having a need for certain type ofinformation. This need is higher among respondents inNiger (89%) and Guinea (95%) (Chart 1).
Main type of information respondents are after are:« risks en-route » (46%), « Job opportunities » (25%) andReturn options (15% and particularly in Chad (79%) andNiger (25%) (chart 2).
35
0%
10%
20%
30%
40%
50%
60%
70%
80%
90%
100%
BFA GIN MLI NER TCD
2. TYPE OF INFORMATION NEEDED BY COUNTRY OF INTERVIEW
Other information
Practical
Legal
Risk en-route
Return
Medical
Job
Destination
Table 1. Proportion of interviewees to whom the question on information needs was asked by country of interview
Burkina Faso 14%
Chad 10%
Guinea 15%
Mali 13%
Niger 5%
Nigeria 11%
Senegal 5%
85%NEEDED INFORMATION (among those who responded,
see chart 2 for type of information)

METHODOLOGY AND SOURCESThis section provides additionaldetails on the methodologies andsources used to produce the datapresented in the report
FLOW MONITORINGThis report presents an analysisof flow monitoring surveysconducted with mobilepopulations in the West andCentral Africa region betweenJanuary and December 2018.
In West and Central Africa(WCA), Flow Monitoringexercises are set up in over 30strategic zones of transitthroughout the region in order toobtain a better understanding ofthe volume, trends andcomposition of migration flows(both intraregional and to andfrom North Africa) in the region.
These surveys are part of IOMDTM's Flow Monitoring activities,which gather information on thenumbers and characteristics oftravellers observed in highmobility areas of origin, transitand destination. Surveys areconducted at Flow MonitoringPoints on a sample of travellerson a daily basis (travellers may or
may not be nationals). Thepurpose of these surveys is tocollect more in-depthinformation on travellers, such astheir nationalities, educationaland vocational backgrounds,reasons for departure andintended destinations.
Flow Monitoring Points (FMPs)are located in Chad, Niger,Nigeria, Mali, Burkina Faso,Senegal and Guinea, at whichover 100 enumerators collectdata on mobility daily. The DTMteams in these seven countries’IOM Country Offices, with thesupport of the Regional Office inDakar, implement FlowMonitoring activities, clean,analyse and stock the datacollected, and produce regularreports presenting the findings ofthe FM exercises.
METHODOLOGYA Flow Monitoring Point (FMP)collects information on thenumber, frequency and definingfeatures of individuals transitinga particular location. Prior to theestablishment of an FMP, it isessential to identify keymigration-prone areas. These
locations are identified based onassessments of main migrationroutes at national and locallevels, conducted in partnershipwith national and localauthorities.
FMPs rely on two main tools: TheFlow Monitoring Registry (FMR)and the Flow Monitoring Survey(FMS). The FMR includes directobservations at places of entry,transit or exit, as well asinterviews with key informants(including transportationworkers, housing workers, andmigration officials) to assessmovement trends, routes, andcountries of origin anddestination. The FMS entailsmore detailed individual surveysto profile people on the move,including education levels andskills/employment; drivers ofmigrations; and needs, risks andvulnerabilities. This documentpresents an analysis of surveysconducted using the FMS tool. Asimilar methodology is used inother regions (Horn of Africa andEurope) to allow for comparativeanalysis of flows and individuals’characteristics.
36

YOUTH AND MOBILITYChildren and Youth on the move across West and Central Africa in 2018
IOM Regional Office for West and Central AfricaZone 3, Route des AlmadiesDakar BP16 838Sénégal: Tel: +221 33 689 62 00Fax: +221 33 869 62 33
Equipe RO Dakar – DOE: [email protected]