Yemen Highway Design Standards (1986)
167
1- YEMEN ARAB REPUBLIC DEVELOPMENT OF NATIONAL HIGHWAY lv1ASTER PLAN DESIGN STANDARDS Dar Al-Handasah Consultants (Shair & Partners ) Sana'a AVa3) Beirut London Cairo FEBRUARV 1986
-
Upload
alwil144548 -
Category
Documents
-
view
139 -
download
4
description
Design standards for Yemen Road network in 1986
Transcript of Yemen Highway Design Standards (1986)

1-
YEMEN ARAB REPUBLIC
DEVELOPMENT OF NATIONAL HIGHWAY lv1ASTER PLAN
DESIGN STANDARDS
Dar Al-Handasah Consultants (Shair & Partners ) Sana'a AVa3)
Beirut London Cairo FEBRUARV 1986

! G
i ~
,; i' ': I
f L
,l
.I ,0
, I
~" (II
I ',-
{j.
r .i
-1,
1-tf' I " '( ~
,.....
W'
,
Table of Contents
",
. ,

T ABLE OF CONTENTS
INTRODUCTION
SECTION 1: BASIC GEOMETRIC DESIGN STANDARDS 1-1
1.1 General 1-1
1.2 Classification of Road Categories
and Terrain 1-1
1.2.1 Road Categories 1-1
1.2.2 Terrain 1-2
1.3 Design Speed 1-3
1.4 Roadway Capacity 1-3
SECTION 2 : GEOMETRIC CROSS-SECTION 2-1
2.1 Cross-Sectional Elements 2-1 c
2.1.1 Travel Lanes 2-1
2.1.2 Shoulders 2-1
2.1.3 Median 2-1
2.1.4 Cross-Slopes 2-4
2.1.5 Sidewalks 2-4 1" 2.1. 6 Side-Slopes 2-4
2.1. 7 Slope Benches 2-4 l' 2.1.8 Side Ditches 2-5
2.2 Clearances 2-5
'f 2.2.1 Right-of-Way 2-5
2.2.2 Structural Clearances 2-6
f SECTION 3 : GEOMETRIC DESIGN STANDARDS 3-1
T 3.1 Sight Distance 3-1
3.1.1 General 3-1
T 3.1.2 Stopping Sight Distance 3-1
3.1.3 Passing (Overtaking) Sight -~ Distance 3-2
3.1.4 Sight Distances on Horizontal
;f Curves 3-3
ID738A/G

3.1.5 Sight Distances on Crest Vertical I Curves 3-3
3.1.6 Sight Distance on Sag Vertical I Curves 3-5
3.2 Superelevation 3-7 I 3.2.1 General 3-7
3.2.2 Superelevation Rates 3-7 I 3.2.3 Curvature 3-8
3.2.4 Development of Superelevation 3-8 I 3.3 Horizontal Alignment 3-9
3.3.1 General Controls 3-9
I 3.3.2 Standards for Curvature 3-12
3.3.3 Consistency of Alignment 3-12
3.3.4 Alignment at Bridges 3-12 il 3.3.5 Transition Curves 3-13
3.3.6 Widening on Curves 3-13 I 3.4 Vertical Alignment 3-14
3.4.1 General Controls 3-14 I 3.4.2 Grade Standards 3-15
3.4.3 Position of Grade Line 3-16 I 3.4.4 Critical Grade Length and
Clim bing Lanes 3-16
I SECTION 4: FLEXIBLE PAVEMENT DESIGN 4-1
I 4.1 General 4-1
4.2 Traffic 4-1 )1 4.3 Pavement Design Methods 4-2
4.3.1 Shell Method 4-2 I 4.3.2 AASHTO Method 4-4
4.4 Bituminous Concrete Mix Properties 4-6
I 4.4.1 AsphaltS 4-6
4.4.2 Gradation 4-6
4.4.3 Job-Mix 4-7 I I I I
ID738A/G
I

SECTION 5: HYDROLOGY AND HYDRAULICS OF DRAINAGE
STRUCTURES 5-1
5.1 Hydrology of a Drainage Basin 5-1
5.2 By drological Determinations 5-1
5.2.1 General 5-1
5.2.2 Method of Judgement 5-1
5.2.3 Method of Formulae 5-2
5.2.4 Method of Direct Otservation 5-2
5.2.5 Method of Correlation Analysis 5-2
5.2.6 Method of Hydrograph Synthesis 5-2
5.3 Recommended Hydrological Methods 5-3
5.3.1 Rational Method 5-3
5.3.2 Modified Talbot Method 5-10
5.3.3 Slope Area Method 5-13 .--,
5.4 Basic Criteria for the Hydraulic Design of
Bridges 5-13
5.4.1 Location 5-14
5.4.2 Design Higp Water Level and
Bridge Height 5-14
5.4.3 Free Board 5-14
< 5.4.4 Length of ,Bridgeworks 5-15
5.4.5 River Type and Characteristics 5-16
5.4.6 Basic Data 5-16 ,-5.4.1 Bridge Scour 5-16
5.4.8 Guide Banks 5-18 ,-
5.5 Basic Criteria for the Hydraulic Design
of Culverts 5-19
f" 5.6 Basic Criteria for the Hydraulics of the
Roadside Drainage Channels 5-26
r 5.7 Irish Crossings 5-28
5.8 Spillways 5-30
r SECTION 6: ROAD MARKINGS AND FURNITURE 6-1
r 6.1 Road Markings 6-1
6.1.1 General 6-1
6.1.2 Colour 6-1
6.1.3 Road Marking Materials 6-2
f 6.1.4 Road Markings 6-2
ID738A/G r

------~===============================~~~---
6.2 Traffic Signs 6-10 6.2.1 Regulatory Signs 6-10 6.2.2 Warning Signs 6-10 6.2.3 Informatory Signs 6-13 6.2.4 Siting, Orientation and [
Foundations 6-13 6.3 Guard Rails and Crash Barriers 6-14 [ 6.4 Hazard Markers 6-20
SECTION 7: STRUCTURES 7-1
7.1 Introduction 7-1 7.2 Concept 7-1 - 7.3 Loading 7-1 7.4 Bridge Location 7-2 - 7.5 Bridge Superstructures 7-4 7.6 Bridge Substructures 7-10 - 7.7 B ridge Articulation 7-10 7.8 Other Bridge Components 7-14 7.9 Width of Carriageway on Bridges 7-19 7.10 Retaining Walls 7-20 7.11 Drainage Culverts 7-20 -
SECTION 8: GEOTECHNICAL CONSIDERATIONS 8-1 -8.1 General 8-1
J - 8.2 Site Investigation 8-1 8.2.1 Structures 8-1
- 8.2.2 Pavements 8-1 J 8.2.3 Materials 8-2
8.3 Embankments 8-4 J - 8.4 Retaining Structures 8-4
8.5 Cuts 8-5
I .-8.5.1 General 8-5 8.5.2 Slope Stability 8-5
8.6 Sand Dune Areas 8-10 I 8.6.1 General 8-10 8.6.2 Road Alignment 8-11 8.6.3 Sand Accumulation 8-12 8.6.4 Construction and Protection 8-13
ID738A/G
--
--• l
II
I
• J
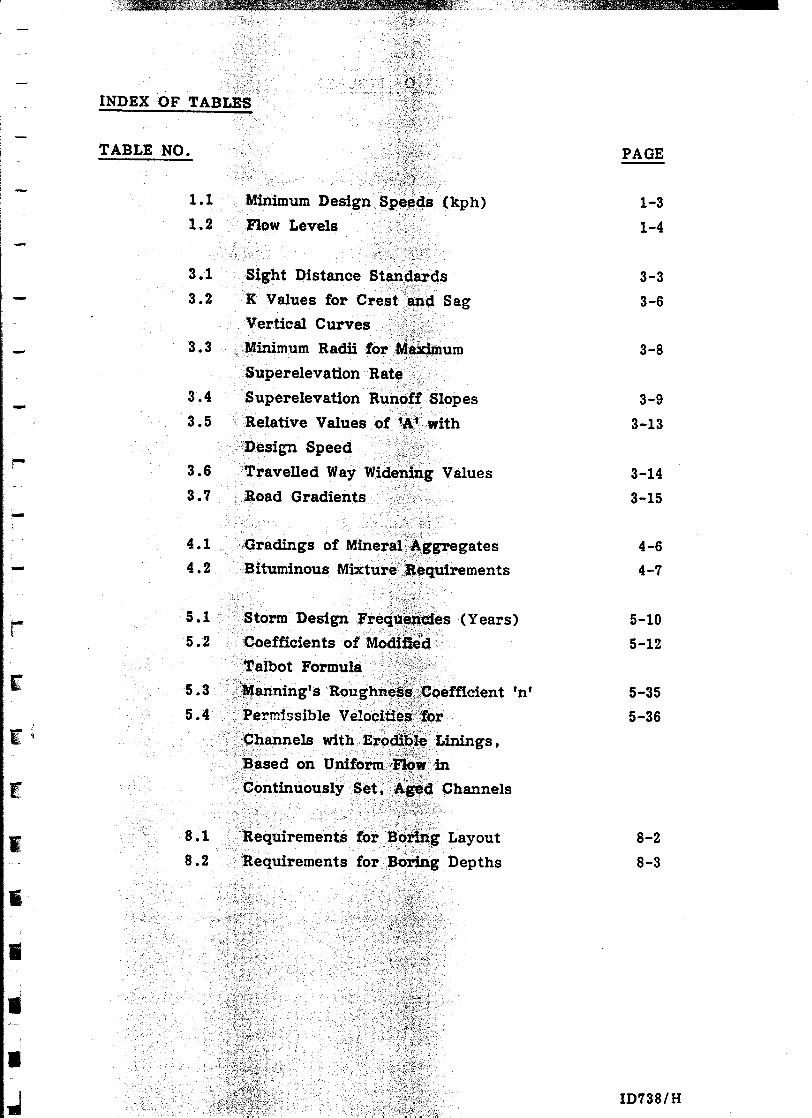
INDEX OF TABLES
TABLE NO.
1.1
1.2
3.1
3.2
3.3
3.4
3.5
3.6
Minimum Design Sp~4!9S (kph)
Flow Levels
Sight Distance Standards
K Values for Crest and Sag
Vertical Curves
lVIinimum Radii forJd~um Superelevation Rate.«
Superelevation Runoff Slopes
Relative Values of 'A1 with Design Speed <,; ..
:' .... '.
Travelled Way Widening Values
3. '1 . ,Road Gradients
4.1
4.2
5.1
5.2
5.3
5.4
Gradings of Minerai;4\ggregates
Bituminous Mixture Bequirements <I,'
Storm Design F1"eq~~~c1es Coefficients of Modifi~d Talbot Formula
(Years)
T,Manning'sRoughn~~·$.7Coefficient 'n' -.-'; .,
Permissible Velociti~!f·~;for . .'," ,'·,'c""
,"Channels with .. Ero~b,~e . Linings,
'Based on Uniform .• mijt·in Continuously Set, .A:~d Channels
8.1 .. Requirements forB~rlng Layout
8 . 2 'Requirements for Boring Depths
PAGE
1-3
1-4
3-3
3-6
3-8
3-9
3-13
3-14
3-15
4-6
4-7
5-10
5-12
5-35
5-36
8-2
8-3
ID738/H

----------'--:-
---
INDEX OF FIGURES
Figure No.
2.1
2.2
3.1
3.2a
3.2b
3.3
3.4
4.1
5.1
5.2
5.3
5.4
5.5
5.6
Cross-Sections - Dual Carriageway Roads
Road Cross-Sectional Elements
Horizontal Clearance for Stopping Sight Distance
Superelevation Details
Superelevation Details
Climbing Lanes
Truck Operation on Ascending and Decending
Grades
Relationship Between Pavement Damage and
Axle Load
Runoff Coefficient for Use in Rational Method
Isohyetals for Average Annual Rainfall (mm)
Rainfall Intensity - Duration - Frequency Curves
Rainfall Intensity Duration Frequency Curves
Rainfall Intensity - Duration - Frequency Curves
Nomograph for the Time of Concentration
2-2
2-3
3-4
3-10
3-11
3-1S
3-19
4-3
5-5
5-6
5-7
5-S
5-9
5-11
5.7 Headwater Depth for Concrete Pipe Culverts with
5.S
5.9
5.10
.. 5.11
Inlet Control 5-22
Head for Concrete Pipe Culverts Flowing Full
n = 0.011 5-23
Headwater Depth for Box Culverts with Inlet Control 5-24
Head for Concrete Box Culvert Flowing Full
n = 0.011 5-25
Nomograph for Solution of Manning's Equation for
Open Channel Flow 5-27
ID73SA/F
[
(
i I I I I'· ";
I I I

i ..
5.12
5.13
5.14
5.15
6.la
6.1b
6.1c
6.1d
6.1e
6.2a
6.2b
6.2c
6.2d
6.2e
6.2f
602g
6.3a
603b
S.3c
6.3d
603e
6.3f
7.1
7.2a
7.2b
7.2c
7.2d
7.2e
7.3a
703b
704
7.5a
7.5b
Grouted Riprap Lined Ditch
Typical Detail of Irish Crossing
Irish Grossing Guide Bank
Typical Arrangement for Reinforced Concrete
Culvert Spillway
Road Marking Details
Road Marking Details
Road Marking Details
Road Marking Details
Road Marking Details
Regulatory and Informatory Traffic Signs
Warning Traffic Signs
Sign Face Details
Sign Post Location and Assembly Details
Sign Post Location and Assembly Details
Sign Post Location and Assembly Details
Details of Hazard Marker and Kilometre Post
Location of Guard Rails
Details of Guard Rail
Detail of Crash Barrier
Typical Deta1ls of Crash Barriers
Location of Crash Barriers
Location of Crash Barriers
Proposed B ridge Loading
Bridge Deck Types
B ridge Deck Types
Bridge Deck Types
Bridge Deck Types
Bridge Deck Types
Bridge Pier Types
Bridge Pier Types
Types of Bridge Abutment
Bridge Parapet Types
Bridge Parapet Types
5-29
5-31
5-32
5-34
6-3
6-4
6-5
6-8
6-9
6-11
6-12
6-15
6-16
6-17
6-18
6-19
6-21
6-22
6-23
6-24
6-25
6-26
7-3
7-5
7-6
7-7 7-8
7-9
7-11
7-12
7-13
7-15
7-16
ID738A/F

7.5c Bridge Parapet Types
7.6 Section Through Typical Elastomeric Expansion
Joint
7.7a Types of Retaining Wall
7.7b Types of Retaining Wall
7.8a Pipe Culvert Details
7.8b Pipe Culvert Details
7.8c Pipe Culvert Details
7.8d Pipe Culvert Details
7.8e Pipe Culvert Details
7.8f Pipe Culvert Details
7.8g Pipe Culvert Details
7.8h Box Culvert Details
7.8i Box Culvert Details
7.8j Box Culvert Details
7.8k Box Culvert Details
7.81 Box Culvert Details
7.8m Box Culvert Details
8.1 Gabion and Masonry Walls
8.2 Gabion Walls - Surcharged
8.3 Gabion Walls - Unsurcharged
8.4 Details of Side Slopes in Cut
8.5 Typical Roadway Section - Sand Dune Areas
7-17
7-18
7-21
7-22
7-23
7-24
7-25
7-26
7-27
7-28
7-29
7-30
7-31 ./
7-32
7-33
7-34
7-35
8-6
8-7
8-8
8-9
8-14
ID738A/F
r I
t ,
~,
1 ~
I I I I .1 I I cl ) ,

...... -
fi l,.-
I.-
.l....'
;...,. fl
J.-'
~ .~
..... ;.b..
--:. ... /
.-
.k.i
r =-
r Jr-
--f. .:::-
r.
t
Introduction
,,!
,
/f "it
.-' :'
\ .. :

~-
i r
INTRODUCTION
These standards outline recommended design criteria and procedures
for the design of roads and bridges in the Yemen Arab Republic
(YAR). It was prepared as part of the 'Highway Master Plan Study',
undertaken from 1984 to 1985. Its aims are to define and set design
standards, procedures, methods of details reJated to the different
categories of roads found in the Y AR.
The Standards wilJ serve as an Interim Guide to help achieve
uniformity in designs prepared for the Highway Authority. The
criteria, procedures. methods and details, outlined herewith, shall be
used in the absence of more detailed studies for specific conditions.
However, it shal1 not absolve designers of their responsibility to make
such additional studies as may be required in the preparation of any
specific design.
ID738A/B
-'
\ , ,--,~ L
\ --
\ ""-0'
L
--
I
~
i
r. , I
~
-
, .; .
;")~~~<
... ~;.
", .'- :"
..... '
" ..
. SECTION 1': Basic Geometric Desig,n Standards
:-," ."
. ";-. :.-',-.
.1-
:-
-
---
! r
SECTION 1: BASIC GEOMETRIC DESIGN STANDARDS
1.1 GENERAL
This section deels specifically with the major details and classifications
relating to basic design standards and is intended to establish policies
for the design of highways. The overall objective of these policies is
to allow· the movement of the greatest number of vehicles possible,
with maximum efficiency, minimum hazard and at the same time remain
cost-effective.
As most of these policies and standards may be subject to amendment,
due to changes in conditions and terrain encountered at various
locations throughout the YAR, they should not be used as a
substitute for sound engineering judgement and experience.
1.2 CLASSIFICATION OF ROAD CATEGORIES AND TERRAIN
In the establishment of basic standards for future road improvement
construction, or upgrading, two main factors have been considered:
1.2.1
The categories of roads in the study network (classified by
function)
The different types of terrain, prevalent in the YAR.
Road Categories
There are three categories of road used in the study network, these
are:
Category A (Primary Roads)
Main transnational routes connecting governorate capitals, these
are asphalt surfaced.
Category B(Secondary Roads)
1 - 1 ID738A/B

----
-------
1. 2. 2
Secondary links, connecting major population centres with
governorate capitals, these are asphalt or gravel surfaced.
Category C (Tertiary Roads)
Tertiary links, connecting district centres to primary or
secondary roads, these are generally earth surfaced.
Terrain
The types of terrain which the highway alignment traverses will
impose certain geometric design criteria pertaining to the nature of
that terrain.
To provide a general basis of reference between terrain and geometric
design, four classifications of terrain have been established in the
YAR:
Flat: level to moderately rolling topography offering few or no
obstacles to the construction of a highway and having
continuously unrestricted horizontal and vertical alignment.
Rol1ing: hiJJs and foothi11s, the slopes rise and fall gent1y with
occasional steep slopes offering some restriction to horizontal and
vertical alignments.
Mountainous: rugged foothills, high steep drainage divides, and
mountain ranges offering continuous restrictions to horizontal
and vertical alignment.
Escarpment: very steep and rugged slopes of the natural
ground, resulting in the adoption of minimum design standards.
1 - 2 ID738A/B
r I ,
J .. 1
1.1 ,I J I I I J ,

~-----
1.3 DESIGN SPEED
Design speed is the maximum safe speed that can be maintained over
any specified section of highway. Geometric design elements should
be consistent with a design speed selected as appropriate for
environmental and terrain conditions. Low design speeds are
generally applicable to highways with winding alignments in
mountainous terrain and escarpments. High design speeds are
generally applicable to highways on level terrain. Table 1. 1 shows
minimum design speeds in kilometres per hour for the different types
of terrain and road category.
TABLE 1.1: MINIMUM DESIGN SPEEDS (KPH)
Road Category
Type of Terrain A B C
Flat 110 100 50 Rolling 90 80 40 Mountainous 50 40 30 Escarpment 30 20 20
1.4 ROADWAY CAPACITY
The capacity of a particular roadway is the av~~~~g~r,~1!.mum tfoa~fic volume in passenger cars per hour (PCUs) expected to eeeulL
A-..
frequently under ideal conditions.
The capacity of the roadway is also affected by a number of factors
such as; lane width. shoulders. surface conditions. alignments.
grade, volume of commercial vehicles. variation in traffic flow and
traffic interruption.
TabJe 1. 2 shows recommended flow levels for the various roadway
elements and is based on a composition of 15 per cent of heavy
vehicles in the traffic. Where heavy vehicles form more than
1 - 3 ID738A/B

15 per cent of the traffic lane flows, standard and maximum working
hourly level should be reduced by the following factors:
Heavy Vehicle Traffic Composition Reduction Factor for Heavy
Traffic Flow
15-20%
20-25%
TABLE 1.2: FLOW LEVELS
125 PCU/Hr/Lane
185 PCU/Hr/Lane
Road Type Peak Hourly Flows 16* Hour Average Daily Flow PCU/Hour/Both Directions PCU/Hour/Both Directions Standard Max. l-lorking Min. Max. Within
Normal PDR Range
All-Pu!:Eose Dual C'way Road
Dual 2-Lane 2 940 3 920 20 830' 41 280 - 55 130 Dual 3-Lane 4 410 5 880 42 886 61 860 - 73 500
All-Pu!:Eose Single C'way Roads
10 m wide 2 330 2 820 14 700 21 680 - 29 100 7.3 m wide 1 470 1 960 - 2 450 15 070 - 18 380
* For 24 hour Average Daily flows multiply the above values by 1.1
Equivalent Value in Passenger Car Units: Private Cars and light goods vehicles - 1 PCU Goods Vehicles over 30 cwt unladen, buses and coaches - 2.5 PCUs
o· Commensurate with exceptionally low values of the Peak Hourly to Daily Flow Ratio (PDR) only
1 - 4
Absolute Max. 0
55 130-73 500
30 630 20 830
ID738A/B
f'
(
(
, I
r. \
r 'I. I
-
\ -~ .!
tl -'
r !
I :1'
r "" - .
SECTION 2 : Geometric Cross-Sections

r
r
r , .-I
SECTION 2: GEOMETRIC CROSS-SECTION
2.1 CROSS-SECTIONAL ELEMENTS
2.1.1 Travel Lanes
The number of lanes to be used is a direct function of the volume of
traffic and the capacity of the roadway to allow the facility to operate
at a required and acceptable level of service.
Lane widths of 3.65 m wide are desirable in the interest of safety.
efficiency and ease of operation. However, when severe topographic
limitations such as in mountainous and escarpment areas or where the
right of way becomes a stringent control. then narrower lane widths
may be adopted.
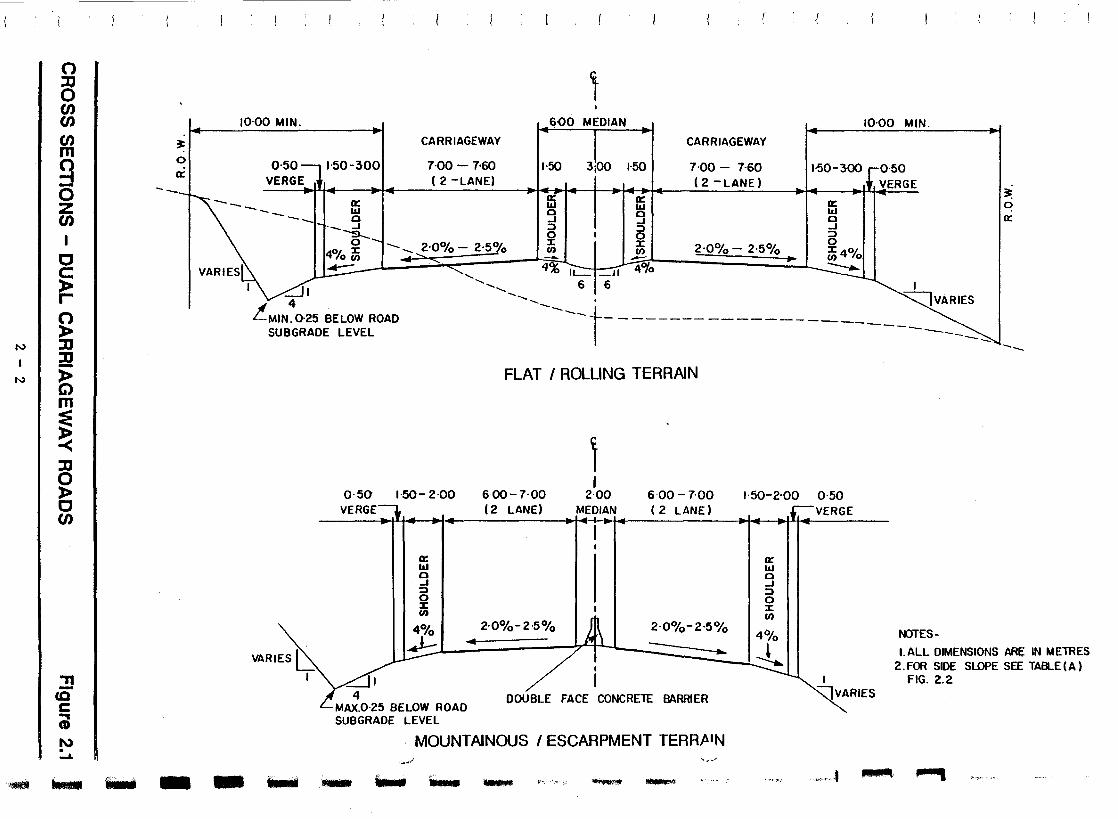
Figures 2.1 and 2.2 show recommended cross-sections depicting the
essential elements of the different road categories.
2.::".2 Shoulders
Shoulders are necessary to provide structural support for pavement
edges, emergency parking space for stopped vehicles and side
clearance between moving vehicles and stationary objects on the road.
Table (C) Figure 2.2 shows recommended shoulder widths for the
different road categories and terrain.
2.1.3 Median
The median is that portion of a divided highway separating the
travelled way for traffic moving in opposing directions.
Under restraining circumstances that arise due to economical,
topographical and environmental factors, such as those in the YAR,
the median width may be reduced to a minimum of 6 m in flat or
rolling terrain and 2 m in mountainous or escarpment terrain with the
provision of a crash barrier.
2 - 1 ID738A/B
0 :0 0 (J) (J)
(J) ~ m Q
0
0: -0 --z (J)
I
C C » r 0 »
NI :0 :0 -
NI ~ m
~ ~
:0 0 » c en
"11 -CQ C ... CD N . ...t.
10·00 MIN.
0.50::-1 1'50-300 VERGE~lt
CARRIAGEWAY
7·00 -7-60 ( 2 -LANE)
600
I-50
1 MEDIAN
3~ 1·50
CARRIAGEWAY
7-00 - 7·60 (2-LANE)
10·00 MIN.
1'50-300 [0'50 I I YERGE
~ 0: ffi I 0: 0: W Q W W Q -' 9 Q
-- -' :l:l -' -------- o
0::
VARIES
~__ 0 I 0 :l
401 ~ -- -- 2-0% - 2'5% ~ ~ 2-0% - 2-5% ~ 40' 10 (/) .... -- _...- ~ (/) 10 ...... %_-01 .- " 4 IL- --ll 4/0 ~
I~I '............ 6 6 I --............. • ~VARIES
L.MIN~o-25 BELOW ROAD SUBGRADE LEVEL
-------t- -------------------
VARIES~ I
FLAT I ROLLING TERRAIN
1 0·50 1'50- 2·00 600-7'00
(2 LANE)
1 2'00 6,00-7,00
(2 LANE) VERGE
"""'-11 4
0: W Q
-' g :I: (/)
4% I 20°1 ~ . 10-2,5%
MEDIAN
2'0%-2'5%
~ -MAX.0·25 BELOW ROAD SUBGRADE LEVEL
DOUBLE FACE CONCRETE BARRIER
MOUNTAINOUS I ESCARPMENT TERRftlN ' ..... .1 '" r"".1
1'50-2-00 0·50
0: W Q
-' :l o :I: (/)
4%
)....
VERGE
I
'JVARIES
-------- ---
NOTES-
I. ALL DIMENSIONS ARE IN METRES 2. FOR SIDE SlDPE SEE TABLE (A)
FIG. 2.2
........... __ ....... .- ....... - ~ ........... Mwl ...., ......

, I
a I b' I ,
a
~ , Y L:::::
I
q, q2 q2 q, ...- .. • -~ -::::::::::""1 - t"--,
L MAX. 0'~5 BELOW ROAD I
I H SUBGRADE LEVEL
RURAL TWO - LANE CROSS SECTION
x Y Z
HARD ROCK WEATHERED R. SOFT ROCK H=0·1·5 H= \·5·3·0 H> 3·0
4* 5 2 I 4 3 1·5
*3 FOR CATEGORY C ROADS
TABLE (A) SIDE SLOPES
TYPE OF SURFACE ql (%) q2 (%)
ASPHALT PAVEMENT 4 2·0 • 2·5
GRAVEL - 3·0
EARTH - 3·0
TABLE (B) CROSS SLOPES
CROSS SECTION VARIABLES (metres) ROAD
CATEGORY FLAT / ROLLING MOUNTAINOUS/ESCARPMENT
0 b Q b
A 1·50· 3·00 7·00·7·60 \·50 ·3-00 7{)0·7·6O
... B (PAVED) \·50· 2·00 600·7,00 1·50 • 2·00 600·7,00
B (GRAVEL) - 7·00 ·I(}OO - 7{)o .I(}OO
C - 5·00·6·00 - 500·600
TABLE (C) CROSS SECTION DIMENSIONS
ROAD CROSS SECTIONAL ELEMENTS Figure 2.2
2 - 3

2.1.4 Cross-slopes
Two lane roadways on tangents or on flat curves have a crown in the
middle of the carriageway and slope downwards towards both edges.
On divided highways, each one way pavement should have a
unidirectional slope across the entire width of the travelled way,
falling to the outer edge of each pavement.
The rate of cross-slope varies according to the type of surfacing
material used. Earth or gravel surfaces require steeper cross-slopes
on tangents than those with asphaltic surfaces. This is to prevent
the absorption of water into the surface.
Table (B) Figure 2.2 shows normal cross-slope rates for the different
types of road surface.
2.1.5 Sidewalks
Sidewalks are usually placed outside of a curb section in urban areas.
On rural roads sidewalks are usually not required except along
sections where there is intensive residential or commercial
development. Sidewalks should be of bituminous or concrete tile
surface. The minimum sidewalk cross-slope should be 1.5 per cent.
The absolute minimum sidewalk width should be 1 m.
2.1.6 Side-Slopes
Table (A) Figure 2.2 gives recommended values of cut and fill side
slopes.
It is strongly recommended that adequate geotechnical investigations
are made to de ~ermine required side-slopes in order to ensure that
the stability of the local soils is adequate. The minimum side-slope
for embankments should not be less than 1.5 to 1.0.
2.1. 7 Slope Benches
Where the material in a cut slope is sufficiently unstable to warrant
flatter than average slopes, then the provision of benches may be
2 - 4 ID738A/B
r (
,
i I I j
I

, --,
necessary in the case of deep cuts. The necessity for providing
benchc:" ~n unstabJe material, their width and vertical spacing should
be determined only after adequate material investigation.
The tops of alJ cut slopes should be rounded where the material is
other than solid rock. The amount of rounding depends on the
material, depth of rock and the natural contours of the ground (refer
to Section 8, Figure 8.4).
2.1. 8 Side Ditches
Side ditches should have an adequate hydraulic capacity to
accommodate drainage from the pavement and slope in the case of the
roadway being in cut. The depth of the ditch in cut sections,
normally, should not be deeper than 0.25 m beJow the sub grade for
safety and maintenance, however deeper ditches may be required for
short sections to drain flat gradient ditches to a c"lvert inlet or to a
section of highway th8.t is in embankment. Should hydraulic needs
dictate flitches of greatp.r capacity than that catered for by normal
depth 'VY ditches, th-s cesigner should design a flat-bottomed ditch of
sufficient width instead of depeening the 'V' ditch.
2.2 CLEARAN CES
2.2.1 Right-of-Way
Since thE right-of-way is one of the most major items in the cost of
the roadway, economic as we]] as engineering factors should be
anaJysed in order to achieve savings
(this m:-ty be possible to achieve by
alignment) •
in the cost of the right-of-way
making slight alterations to the . ." ~
-. The minimum requirement for the right-of-way boundary should be
40 metres in mountainous and escarpment terrain and 60 metres in flat
t and rolling terrain. -.
2 - 5 ID738A/B

2.2.2 Structural Clearances
(a) Lateral Clearance
A minimum lateral clearance of 1 m from the outer edge of the
shoulder to the nearest face of structures or obstructions should be
provided.
Bridge piers on a central reserve should be protected by safety
barriers placed at least 1.2 metres from the edge of the carriageway.
(b) Vertical Clearance
The minimum vertical clearance (headroom) for bridges over the
carriageway should be at least five metres with an additional allowance
of 0.1 metres given to resurfacing.
2 - 6 ID738A/B
r [
, E

·1 -
i I 1-
j
- .
. . !
I :
L
--
\ .
-J. - . ,.
,1 '
-' J , .-. --
, l.-
1 ' I -,--} •
t ' .- - .;
SECTION 3 : Geometric Design Standards

r
i
r
f
f
r
I
I
,
• lIt-
SECTION 3: GEOMETRIC DESIGN STANDARDS
3.1 SIGHT DISTANCE
3.1.1 General.
Sight distance is the distance at which a driver of a vehicJe can see
an object of a specified height on the road ahead assuming a specified
driver height, standard visual acuity and clear atmospheric
con di tions.
Two basic types of sight distances must be considered for safe and
efficient operation: stopping sight distance and passing (overtaking)
Sight distance.
3.1.2 Stopping Sight Distance
Stopping sight distance is the minimum distance required by an
average driver of a vehicle travel1ing at a given speed to react and
stop before reaching an object in its path. It is measured from the
driver's eyes which are assumed to be 1. 05 m above the pavement
surface to an object 0.15 m high on the road.
Stopping sight distance depends on the initial speed of the vehicle,
the perception and reaction time of the driver and the coefficient of
friction between the tyres and the road surface.
L'vIinimum stopping sight distance is computed using the fo]]owing
equation:
where Ss = Minimum stopping sight distance in metres
V = Vehicle running speed in kilometres per hour
t = Combined perception and reaction time in seconds
f = Coefficient of friction
3 - 1 JD738A/B

Table 3.1 shows stopping sight distance values for various design and
running speeds. These values are based on stopping on level
grades, on a perception plus reaction time of 2.5 seconds and a
coefficient of friction for wet pavement. Stopping sight distance on
grade can be computed using the following equation:
V2 Vt s -
s 252 (f:tO.Ol G) -\- -3"G
where V
f
G
=
= =
Vehicle running speed in kilometres per hour
Coefficient of friction
Longitudinal grade %
I (The stopping sight distance is measured from the driver's eyes which I
_ (, \'(.::t'~ are assumed to be 1.05 m above the pavement surface to an object
. 0 .15 m high on the road.)
3.1.3 Passing (Overtaking) Sight Distance
The provision of passing sight distance on crests is usually costly.
However, the requirements are included in these standards for
application where it is economically feasible and where the combination
of alignment and profile do not require the use of crest vertical
curves.
Passing sight distance is the minimum sight distance that must be
available to enable the driver of one vehicle to pass another vehicle
safely and comfortably, without interfering with the speed of any
oncoming vehicle travelling at the design speed. should it come into
view after the passing manoeuvre is started.
The sight distance is measured from the drivers' eyes, assumed to be
1.05 m above the pavement surface to an object 1.3 metres high on
the road.
Minimum values for passing sight distance are shown in Table 3.1.
3 - 2 ID738A/B
J , ,
J J J I I J J I

TABLE 3.1: SIGHT DISTANCE STANDARDS
Desi2n Coeff. of Min. StoEE:ing Min. Passing Speed Friction Sight Distance Sight Distance (kph) (m) (m) - -
20 0.42 18 -30 0.40 30 -40 0.38 45 280 50 0.36 65 340 60 0.34 85 420 70 0.31 110 480 80 0.30 140 560 90 0.30 170 620
100 0.30 200 680 110 0.29 240 740
-
3.1.4 Sight Distances on Horizontal Curves
Where an object off the pavement such as a bridge, pier, building,
cut slope or natural ~"'owth, restricts sight distance, the minimum
radius of curvaturs is determined by the stopping sight distance.
Figure 3.1 Sh0''':-: sig!1 t distances for various curve radii and the
offset distance from lane centreline to the obstruction. The line of
sight is assumed to intersect the obstruction at the midpoint of the
line of sight. The intersection point would then be 0.76 m above the
centreline of the inside lane.
Allowance _ for differences in braking distances on grade should be
made for sight determination on horizontal curves.
3.1.5 Sight Distances on Crest Vertical Curves
The minimum length of a crest vertical curve is based either on the
minimum stopping sight distance or on the minimum passing sight
distance, if passing is a design requirement. Adopting the passing
sight distance criteria. will result in having long curves requiring
extensive earthwork in many places which may not be justified for
secondary and tertiary roads. The minimum vertical curve length is
expressed by the following equation:
3 - 3 ID738A/B

15
14 en w ~ 13 w :E - 12 ~
. - g II
30 40 50
l 7 I / I /
Stopping sight distance (s.)
t. Highway
t. Inside lane
-~
Line of sight
'-- Sight obstruction
DESIGN SPEED ( K. P. H.) 60 70 80 90 100
I / 1/ / / V JV '/ J V
I I
I / / j /' / [7 / V V II / V / 7 II JV / IV 1/ / /
J / / J /' I / / V / / / / / ~ 10 - ~~f ~/ ~ o;t~14;~~~~11-~~ / ~ / f-~C ~ -#7 " :P':v ~n~ z «
- t; 9 o
r.n 8 w
- ...J U 7 ~ r.n ~ 6
! -- II
u 520
-
" Q:-) Q:- ~ Q:
/ / /'V/jlj /V// v/v/// 7 I 7 71 / / /v / 1//// V/::/
J / V V V ,v / V [77 /V7[0 ~v / / / / /VjV V V /r~ ~v:,~t:/
40 60 80 100 120 140 160 180 200 220
S. : STOPPING SIGHT DISTANCE ALONG ~ CURVE ( METRES)
5 s : 2 R Arc Cos ( R ~C )
Arc Cos Expressed in Radians
110
V
V / /
I 2 4(
(
(
J
}
I I J
'J J J I I J
- HORIZONTAL CLEARANCE FOR STOPPING SIGHT DISTANCE Figure 3.1 "I
3 - 4 -

L = KA
where L = Length of vertical curve in metres
J{ = Constant of vertical curvature
A = Algebraic difference in per cent of gradient
K values for stopping sight distance are computed by:
S 2 S
Ks --405
where Ss = Minimum stopping sight distance
K values for passing sight distance are computed by:
2 Sp
where Sp = minimum passing sight distance.
r.:inLnum values for K for various design speeds are shown in
Table 3.2.
3.1. 6 Sight Distance on Sag Vertical Curves
The minimum length of a sag vertical curve is based on t:, '~linimum
stopping sight distance which is controHed by the vehicle headlight
sight distance. It assumes a headlight height of 0.6 m and a 10
upward divergence of the Jight beam from the longitudinal axis of the
vehicle. For overall safety. sag vertical curves should be long
enough so that the light beam illuminates the roadway ahead for a
distance of at least the stopping sight distance.
The minimum length of a verticaJ curve is expressed by the equation:
L = KA
3 - 5 ID738A/B

-
-----
------
where K for sag vertical curves is expressed by:
K = s
S 2 S
122+3.5 Ss
and where K = s
=
Constant for stopping sight distance at
vertical sags
Stopping sight distance.
Values for K for various design speeds are shown in Table 3.2.
TABLE 3.2: K VALUES FOR CREST AND SAG VERTICAL CURVES
'K' Values Crest Vertical Curves
~es1gn Speed Stopping Passing Sag Vertical Curve (kph) Conditions Conditions
20 1 - 2 30 2 - 4 40 5 83 8 50 11 123 12 60 18 188 18 70 30 244 24 80 49 333 32 90 72 408 41
100 99 490 49 110 143 581 60
Note: The minimum length of curves should be rounded up to an even
10 m.
3 - 6 ID738A/B
(
[
[
[

r
---
: r
-~ -
3.2 SUPERELEVATION
3.2.1 Gener.al
As a vehicle traverses a horizontal curve. the centrifugal force
working on the vehicle is opposed by the roadway superelevation and
by the side friction between the tyres and the roadway surface.
Curves should be superelevated to balance the effect of the
centrifugal force. The rate of superelevation will depend on the
vehicle speed. the curve radius and pavement surface characteristics.
The minimum alJowable radius for any design speed can be computed
using the following equation:
R = V2 127 (e+f)
where R = Minimum radius of circular curve in metres
v = Vehicle speed in kilometres per hour
e = Maximum superelevation rate in metres per metre
f = Side friction factor
3.2.2 Superelevation Rates
Side friction factors for wet pavements are used in highway design.
The maximum safe side friction factors for the maximum superelevation
rate of 0.08 m/m ya!'y linearly from 0.17 for V=20 kph to 0.12 for
V=110 kph.
The maximum superelevation rate will be dependent on the type and
characteristics of the surfacing material and generally should not
exceed 0.08 m/m.
Lower superelevation rates may be necessary in urban areas where
restricted speed zones or at-grade intersections are the controlling
factors. In addition. established street grades. curbs or drainage
3 - 7 ID738A/B

may impose limitations on design. A supereJevation rate of not more
than 0.06 m/m shouJd be used for urban roads.
3.2.3 Curvature
The minimum radii for superelevated curves for bitumen surfaces for
various design speeds are shown in Table 3.3. The radii have been
rounded to the nearest 5 metres.
TABLE 3.3: MINIMUM RADII FOR MAXIMUM SUPERELEVATION RATE
v (kph) e f R (m/m) (m)
20 0.08 0.17 15 30 0.08 0.16 30 40 0.08 0.16 50 50 0.08 0.15 85 60 0.08 0.15 125 70 0.08 0.14 175 80 0.08 0.14 230 90 0.08 0.13 305
100 0.08 0.13 375 110 0.08 0.12 475
3.2.4 Development of Superelevation
The length required to develop the required supereJevation should be
adequate to ensure both a good appearance and satisfactory riding
qUality. The length of runoff should be long enough so that the
runoff slope meets the criteria shown in Table 3.4. The runoff slope
is the longitudinal gradient between the edge of the travel1ed-way
profile and the of the profile grade line of the carriageway.
3 - 8 ID738A/B
I (
(
I I I I I il
I I I I I I I

--
i __
,~
Ii ir
i __ .
r
TABLE 3.4: SUPERELEVATION RUNOFF SLOPES
Design Speed (kph) Maximum Relative Slope (%)
20 0.91 30 0.B2 40 0.74 50 0.66 60 0.59 70 0.54 BO 0.50 90 0.47
100 0.44 110 0.41
.. , -,
The absolute minimum length of supereJevation runoff used shouJd be
30 metres, however in special restrictive situations where the
standard supereJevation rate is not feasible or the desirable runoff
length is not attainable, the highest possible rate and the longest
length respectively should be used.
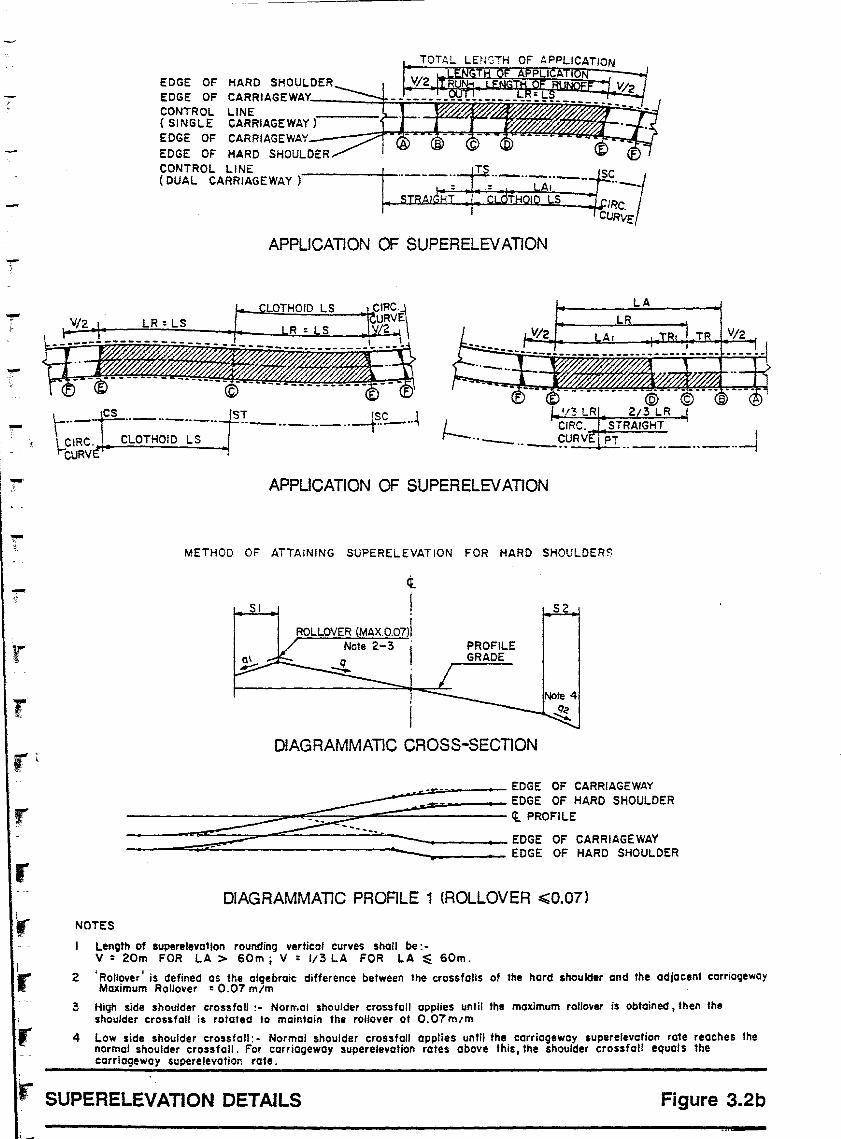
Figures 3. 2a and 3. 2b illustrate desirabJe methods for developing
supereJevation.
3.3 HORIZONTAL ALIGNMENT
3.3.1 General Controls
The most important consideration in determining the horizontal
alignment of a road is the provision of a safe and continuous
operation at a uniform design speed for substantial lengths of
highway. The major aspects controJling horizontal alignment are:
type or category of facility, safety, design speed, topography,
vertical alignment and construction cost. All these factors must be
balanced to produce an alignment that is safe, economical and in
harmony with the natural elements of the land.
3 - 9 ID73BA/B

METHOD OF ATTAINING SUPERELEVATION FOR PAVEMENT REVOLVED ABOUT THE CENTRE LINE OF
A SINGLE CARRIAGEWAY ROAD OR INNER EDGES OF EACH CARRIAGEWAY OF A DUAL CARRIAGEWAY ROAD
t ~ I .
CARRIAGEWAY MEDIAN CARRIAGEWAY CARRIAGEWAY
~ PROFILE GRADE
~ ~ E::: , ~
8 I B I B
DUAL CARRIAGEWAY SINGLE CARRIAGEWAY
DIAGRAMMATIC CROSS SECTION
~ ~ I~ENGTH OF v.c. (SEE NOTE ),1 ;. - V
SLOPE RELATIVE TO PROFILE GRADE: YN
,!-ENGTH OF V~. (SEE NOTE ) .. ,
~.... E!,.. _ FI EDGE OF -=:;::::::;:;;~..=...:---t'i CAR R I AG E WAY
iii Ao Bo ,CO:CI Eo F ~ ---T~-------T~-----=~+E~--~--~~----------------~~-----w~PROFILE
--181 a82
02 I I
ILENGTH OF v.e. (SEE NOTE)
GRADE
I I I! I
~>~i-<~------>~i--~-------'~<r-------~-~'-----------------~--------~'~k-t PROFILE ® GRADE
: 'Q' V/2 ~ANGENT R~OJP LENGTH OF c6>RUNOFF LR 1/2 B N V/2
NORMAL V/2 TR: 1/2 8· QQ. N TRI: 1/2 8·QO-N:TR LAI : 1/28' (q-Qo)'N V/2 FULLY
CROWN V/2 LENGTH OF SUPERELEVATION LA=I/2B'(Q+QO)'N I
V/2 ~~~Q~ELEVATEO
TOTAL LENGTH OF APPLICATION
DIAGRMMMATIC PROFILE
i
FI I ! 01 Ao,Bo,Co,Do,Eo,Fo EDGE OF 0I I REVOLVING AXIS
;; CARRIAGEWAY ;:..N CI~~;;;:::::::~~~:-----F~~:.!..---I g.
AI 11.2: 02J. • EDGE OF
<I' CD
!--!CARRIAGEWAY qo: NORMAL CROSSFALL
ON STRAIGHT (m/m) I"
q : CARRIAGEWAY CROSSFALL (m/m)
8/2 B/2
DIAGRAMMATIC SECTION
NOTE-
I. LENGTH OF SUPERELEVATION ROUNDING VERTICAL CURVES SHALL BE:-V : 20m FOR LA > 60m
V : 1/3 LA FOR LA ~ 60m
SUPERELEVATION DETAILS
3 - 10
'0 ~ <I' , <I' -
Figure 3.2a
r I
, £
-
r
r -: I '
r
TOTAL LENGTH OF APPLICATION
1~~U~ ~~~IA~~~;'T/iJf~~ (SINGLE CARRIAGEWAY) t -£OG£ OF CARRIAG£WAY - -:~. - ---- - - - _ .
EDGE OF HARD SHOULDER
CONTROL LI N£ I ~ (DUAL CARRIAGEWAY) ----·;:·-:-".;·-:t;·-1
.. STRAIJtiT CLdTHOl6 kS IRC.
CURVE
APPLICATION OF SUPERELEV ATiON
\---t'------'j' -ise -1 ~CIRC.~LOTHOID LS _u _____ . --
CURV
: :
APPLICATION OF SUPERELEV ATiON
METHOD OF ATTAINING SUPERELEVATION FOR HARD SHOULDERS
SI
<t I
ROLLOVER (MAX.O.07)1 Note 2-3 . PROFILE
GRADE
DIAGRAMMATIC CROSS-SECTION
52
. ~--=~::.:-s---- EDGE OF CARRIAGEWAY
~;;--~-- : EDGE OF HARD SHOULDER
; •• ~-:; ~o::O:~£eARRIAG£WAY __ :: _ EDGE OF HARD SHOULDER
DIAGRAMMATIC PROFILE 1 (ROLLOVER ~O.07) I r NOTES
I r
r
Length of $uperelevaf!on rounding vertical curves shall be:-V : 20m FOR LA > GOm; V : 1/3 LA FOR LA ~ Gam.
2 • Rollover' is defined as the algebraic difference between the cross falls of the hard shoulder and the adjacent carriageway Maximum Ral/over : 0.07 m/m
3 High side shoulder crossfaU ~- Norrr.al shoulder crossfall applies until the maximum rolloller is obtained. then the shoulder cross foil is rotated to maintain the rollover at 0.07m/m
4 Low side shoulder crossfall: - Normal shoulder crossfal/ applies until the carriageway superelevation rate reaches the normal shoulder crossfall. For carriageway superelevation rates above this, the shoulder crossfal! equals the carriageway superelevation rate.
r SUPERELEVATION DETAILS Figure 3.2b ,I':;

-
--
-
---
----
3.3.2 Standards for Curvature
The minimum radii of superelevated curves are given in Table 3.3.
Radii larrrer than the minimum radii curves should be used wherever
possible. this will increase the safety resulting from improved sight
distance and vehicle operating conditions.
3.3.3 Consistency of Alignment
Horizontal alignment should be as directional as possible and should
be compatible with the topography.
Compound circular curves consisting of two or more contiguous
unidirectional curves should be avoided and a single curve adopted if
economically or physically possible. If this is unavoidable, the radius
of the flatter curve should not be more than 50 per cent greater than
the radius of the sharper curve.
Broken back curve combinations composed of a short tangent between
two curves in the same direction should be avoided. Under such
conditions the use of transition curves is preferable. Abrupt
reversals in alignment should be avoided. A reversal in alignment is
suitably designed by including transition curves of sufficient lengths
between two reversing circular curves to allow for superelevation
runoff.
Sharp curves should not be introduced on sections of high fill as
drivers may have difficulty in estimating the severity of the curve.
3.3.4 Alignment at Bridges
Horizontal alignment at bridges should be designed to avoid having
superelevation transitions 011 a bridge since this usually results in an
unsightly appearance of the bridge and its railing. It is therefore
recommended, if at all possible, that the entire bridge should be
located on a tangent or a circular curve. Tapers and flare ends
should also be located clear of structures. The radii across the
bridge should be as large as possible.
3 - 12 ID738A/B
r I
t I I I ,)
I

3.3.5 Transition Curves
Transition eurves are required to reduce the rate of change of
centrifugal force. The curve to be used is the c]othoid, where the
length of the particular clothoid is defined by:
where L = Length of clothoid
A = A constant and a function of the design speed (V)
R = The rac.::us of the curve
Table 3. 5 below give minimum values of A corresponding to design
speeds.
TABLE 3.5: RELATIVE VALUES OF 'A' WITH DESIGN SPEED
Design Sreed V (kph) Minimum Values of A
20 30 30 40 40 55 50 70 60 80 70 100 80 110 90 130
100 140 110 150
Provision of transition curves where the design speed is less than
50 kph is not essential.
3.3.6 Widening on Curves
Pavement widening on curves is required on sections with sharp
horizontal curvature in order that vehicles or trucks continue to
remain within the lane which they are occupying and can fol1ow the
centreline of the road while negotiating the curve.
3 - 13 ID738A/B

--
I ........ ::'"
Travelled way widening values are given in Table 3.6. Widening is to
be applied uniformly to the inside of the curve and should be
transitioned throughout the length of the superelevation runoff.
TABLE 3.6: TRAVELLED WAY WIDENING VALUES
Total Amount of Widening for Pavement Width (Metres)
Radius (m) 5.0 5.5 6.0 6.5 7.0 7.3
Less than SO 2.30 2.05 1.80 1.55 1.3 1.0
SO - 100 1.90 1.65 1.40 1.15 0.90 0.80
100 - 200 1.50 1.25 1.0 0.8 0.60 0.60 200 - 500 1.20 0.90 0.60 - - -500 - 1 000 0.60 - - - - -Over 1 000 - - - - - -
For curves of a radius of 30 m or less t the actual tracldng paths of
articulated vehicles should be checked using templates to see that
adequate widening has been provided.
3.4 VERTICAL ALIGNMENT
3.4.1 General Controls
Vertical alignment is control1ed by a variety of factors such as
safety t topography, type or category of facility, design speed,
horizontal alignment, construction cost, drainage, vehicular
characteristics and aesthetics.
For aesthetic reasons the length of vertical curves should be
substantially longer than the length required for stopping sight
distance. A broken back grade line (two vertical curves in the same
direction separated by a short length of tangent grade) is not
desirable, particularly in sags.
A ro]]er coaster type of profile grade should also be avoided.
3 - 14 ID738A/B
[
(
I 1
J .J I I
--
-------
--------
--- ---------~~---
The gradient of the main highway should be reduced as much as
possible at the 10('[1t::::'1 of an at-grade intersection.
Superelevation runoff occuring on a vertical curve requires special
attention in order to ensure that the required minimum vertical
curvature is maintained across the pavement. Both edge profiJes
should be checked and adjusted where necessary in order to maintain
the desired minimum vertical curvature.
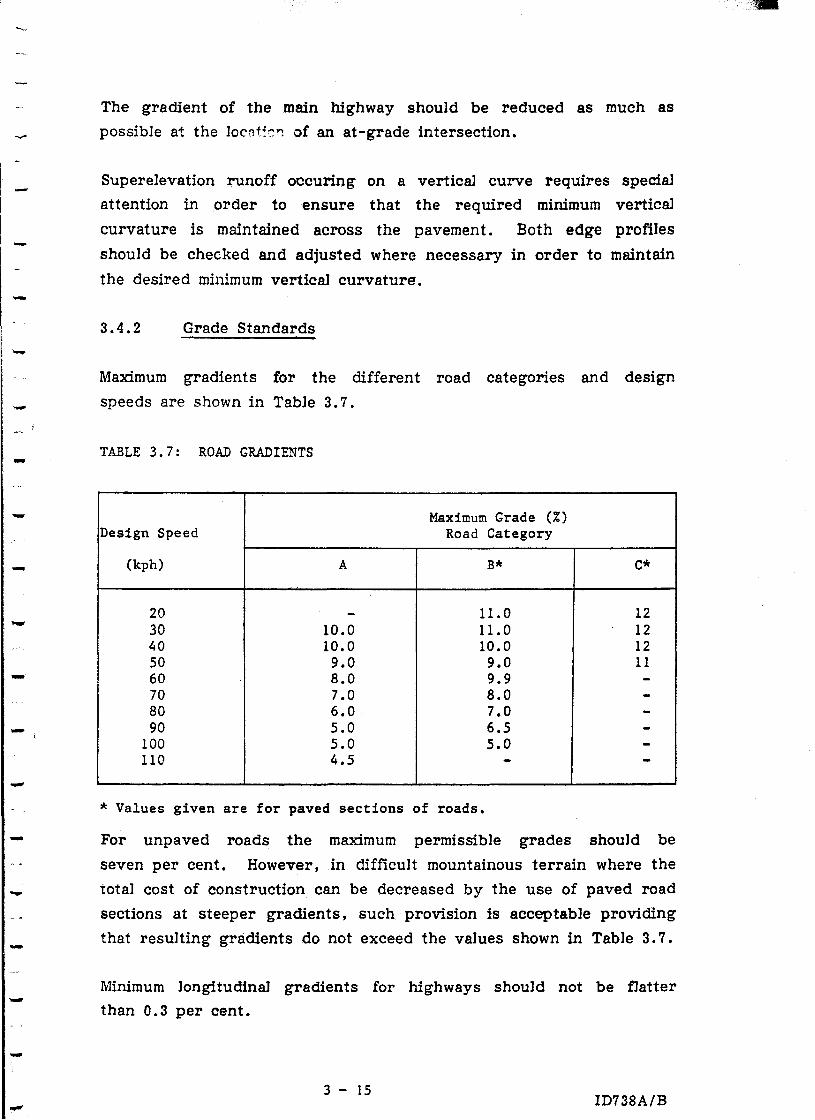
3.4.2 Grade Standards
Maximum gradients for the different road categories and design
speeds are shown in Table 3.7.
TABLE 3. 7: ROAD GRADIENTS
Maximum Grade (%) Design Speed Road Category
(kph) A B* C*
20 - 11.0 12 30 10.0 11.0 12 40 10.0 10.0 12 50 9.0 9.0 11 60 8.0 9.9 -70 7.0 8.0 -80 6.0 7.0 -90 5.0 6.5 -
100 5.0 5.0 -110 4.5 - -
* Values given are for paved sections of roads.
For unpaved roads the maximum permissible grades should be
seven per cent. However, in difficult mountainous terrain where the
total cost of construction can be decreased by the use of paved road
sections at steeper gradients, such proviSion is acceptable providing
that resulting gradients do not exceed the values shown in Table 3.7.
Minimum longitudinal gradients for highways should not be flatter
than 0.3 per cent.
3 - 15 ID738A/B

, -3.4.3 Position of Grade Line
For two lane undivided roads, the profile grade line should coincide
with the pavement centreline. For divided roads with narrow
traversable medians (less than 6 m) the profile grade line should
coincide with either the centre line or the inner edge of pavement.
3.4.4 Critical Grade Length and Climbing Lanes
Critical grade length is determined from the reduction in speed which
is the difference between the average running speed and the tolerable
minimum speed on grade.
In some instances the terrain may preclude shortening or flattening
grades to meet these controls. Where a speed reduction greater than
the suggested design guide cannot be avoided, undesirable types of
operation may result on roads with numerous trucks, particularly on
two-lane roads with volume approaching capacity and in some
instances on multi-lane highways. Where the critical length is
exceeded, considerations should be given to providing an added uphill
lane for slow moving vehicles, particularly where volume is at or near
capacity and the truck volume is high. Truck climbing lanes of
widths equal to the adjacent through lane, but not less than 3.1 m,
may be pr9vided in hilly and mountainous terrain. These lanes will
increase capacity, decrease delays, and reduce accidents.
Justifications for providing climbing lanes are based on the relative
speeds of trucks and motor cars, traffic volume limits and the length
of the climbing lane.
(i) Speed
To justify a climbing lane the length and grade under consideration
must be long enough to cause a decrease in truck speed by at least
20 kph. For example if the initial speed of the truck is taken to be
60 kph and the speed of the truck does not fall below 40 kph,
climbing lanes would not be justified on that grade irrespective of the
traffic volumes.
3 - 16 ID738A/B
1 I I 1 t
'\. ) " '"
]
J }
]
J )
)
l )
I I , J I

-
-
-f
_I
---
_., i '
r
T
r
T
r
-
(ii) Traffic Volume
A climbing lane is considered necessary when the Design Hour Volume
equals or exceeds the design capacity of the highway on the grade.
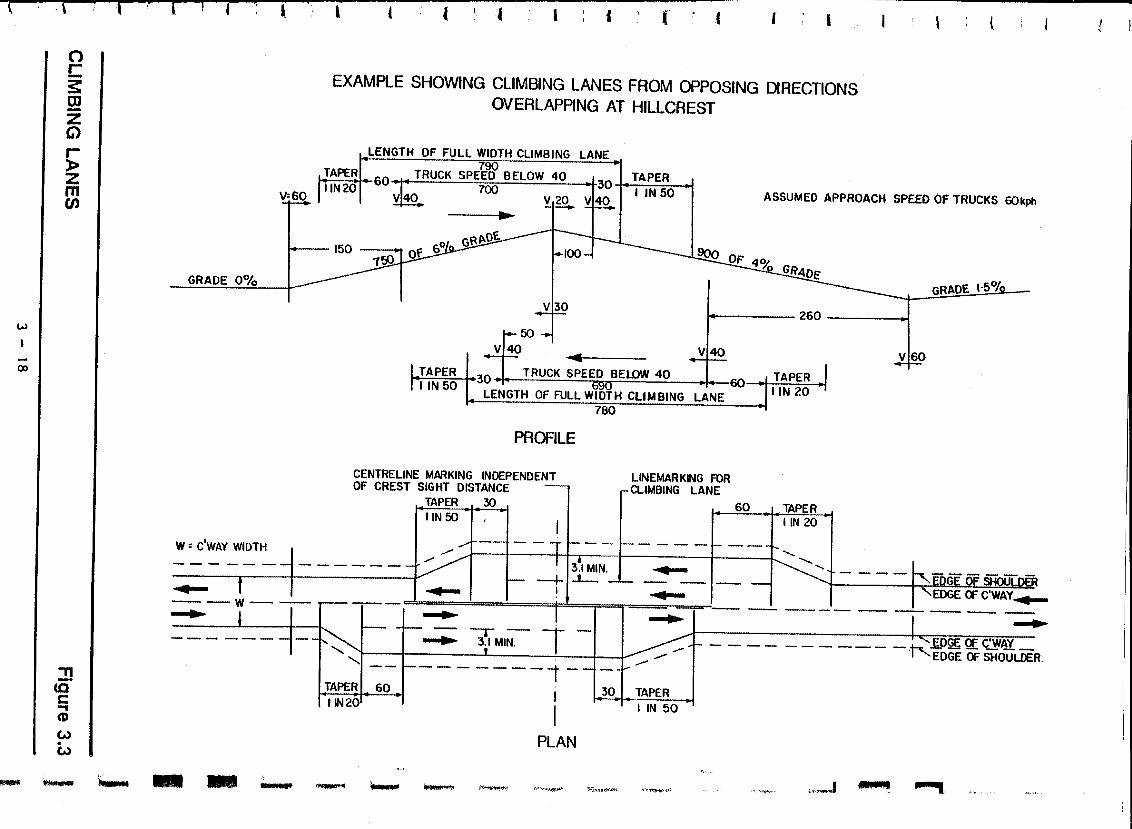
(iii) Total Length of Climbing Lanes
The minimum length of a climbing lane should be 250 m excluding
tapers. Sight distances should be checked and where necessary the
climbing lane should be extended. Climbing lanes should end at the
point where the truck regains a speed equivalent to f or higher than t
the speed for which the climbing lane was initiated. It is desirable to
end the climbing lane At a point beyond the crest of a vertical curve.
Figure 3.3 shows a typical plan and profile for the location of
climbing lanes.
Figure 3.4 shows the operating characteristics of a 250 mass/power
ratio to be used for design purposes.
3 - 17 ID738A/B
--c- . \ r- r ( 1 '. --,~-- -.--- --f--1f - -,--:- --i------i t I I {
w
00
o C 3: ~ z C)
r» z m CJ)
::!! to c: ., CD C".) . C".) -- I-..
EXAMPLE SHOWING CLIMBING LANES FROM OPPOSING DIRECTIONS OVERLAPPING AT HILLCREST
LENGTH OF FULL WIDTH CLIMBING LANE 790
TAPER 60 "1" TRUCK SPEED BELOW 40 .1 30 I. TAPER liN 20 700 .... _-
V=60 , V 40 V,20 ASSUMED APPROACH SPEED OF TRUCKS 60kph ... 1+--150 '" 100
GRADE 0%
W: C'WAY WIDTH
I- 260 .1 50
VI40 VI40
,TAPER IIN50 30 I TRUCK SPEED BELOW 40 I 60 1 .... _.. 1 ... 690 ..... .... - ..
LENGTH OF FULL WIDTH CLIMBING LANE
PROFILE
CENTRELINE MARKING INDEPENDENT OF CREST SIGHT DISTANCE
TAPER .. I_ 30 IIN50
780
LINEMARKING FOR CLIMBING LANE
60 TAPER liN 20
VI60
GRADE 1,5°,..
..-f III L', ...... ------------- .....-.....---W--......
- - ---
---,--,.....-, ~l .....--.-- ...... I ....
lAPE~I" 60 I IN 20
- ---
I -------1-
PLAN
- "~·~";l\'I,.~"th¥ ",'''..;.''''I~M'l;~
-~TAPER
I IN 50
~,,~,~.1'Y$!I'i '(':~'1"'~'1i"'f
.... - - - - - - - - - __ ,h '£P!& t::JfC'WAY _
I "' EDGE OF SliOUllER.
'"'-"~.r., ~"P'_!_, ... ,~J ~ ......,
1

-
----
-, , -1
r
-, r
T
T
r
Deceleration Curves
80~~r---~--~--'---II---r--J
"C ~ 40~----~~~~--~~--~~~~-----+----~ Q. en
.r::. Q. .¥ -"C CD CD Q.
(J)
.¥ (,) :J
~
0~0----2~0-0---4-0~0----60~0----8~0-0----10~00----12~0-0--~1400
80
60
40
20
Distance (m)
Speed vs distance chart on uniform ascending grades for trucks with mass: power ratio = 250
Acceleration Curves
200 400 600 000 1000 1200 1400
Distance (m)
Speed vs distance chart on uni form descending and ascending grades for trucks with moss: power ratio = 250
TRUCK OPERATION ON ASCENDING AND DESCENDING GRADES
3 - 19
Figure 3.4

r, ." ; ~ .
r .I
r' J_
.. /;
.L
- .... _.-•. '1'
'" ~ ...
r. r
t .~:;~;,~~, '. {. -'-
--"''>~
-;,.:,-
.: .. :-'
SECTION4: .. . Flexible Pavement· DeSign
.; .
~ '.'.'_:: .<-.. -.-:
)

'-
r
-
4.1 GENERAL
Pavement design for bituminous roads in the YAR will be carried out
by means of two well-accepted methods: the Shell and AASHTO
methods of pavement design.
In determining the thickness of pavement, the two major factors to be
considered are traffic loads and the strength of the soil sub grade .
Other factors which need also to be considered in the pavement
design are: environmental and climatic conditions, the serviceability
index, the ambient temperature and properties of the paving material.
Pavement layer thicknesses will be obtained by both the Shell and
AASHTO methods and based on these results, as well as the
availabirty of construction materials, the designers will make their
own recommendations for the pavement design of the particular road.
4.2 TRAFFIC
The loads imposed by light vehicles do not contribute significantly to
the structural damage caused to road pavement by traffic. For
pavement design purposes only the number of buses and trucks and
their axle loadings need be considered.
A traffic analysis for each road will be made. Such an analysis
should be based upon information of the following:
Total traffic counts carried out over a suitable period of time ./
Truck and commercial traffic counts classified in terms of vehicle .
type t number of axles , axle configuration
Truck loading policy being used, and if possible the degree of ,.-
overloading that is actually taking place.
In order to obtain an average traffic over the design life of the road,
it is necessary to predict an annual growth of the commercial traffic.
4 - 1 ID738A/D
--
----
-
-'---
-
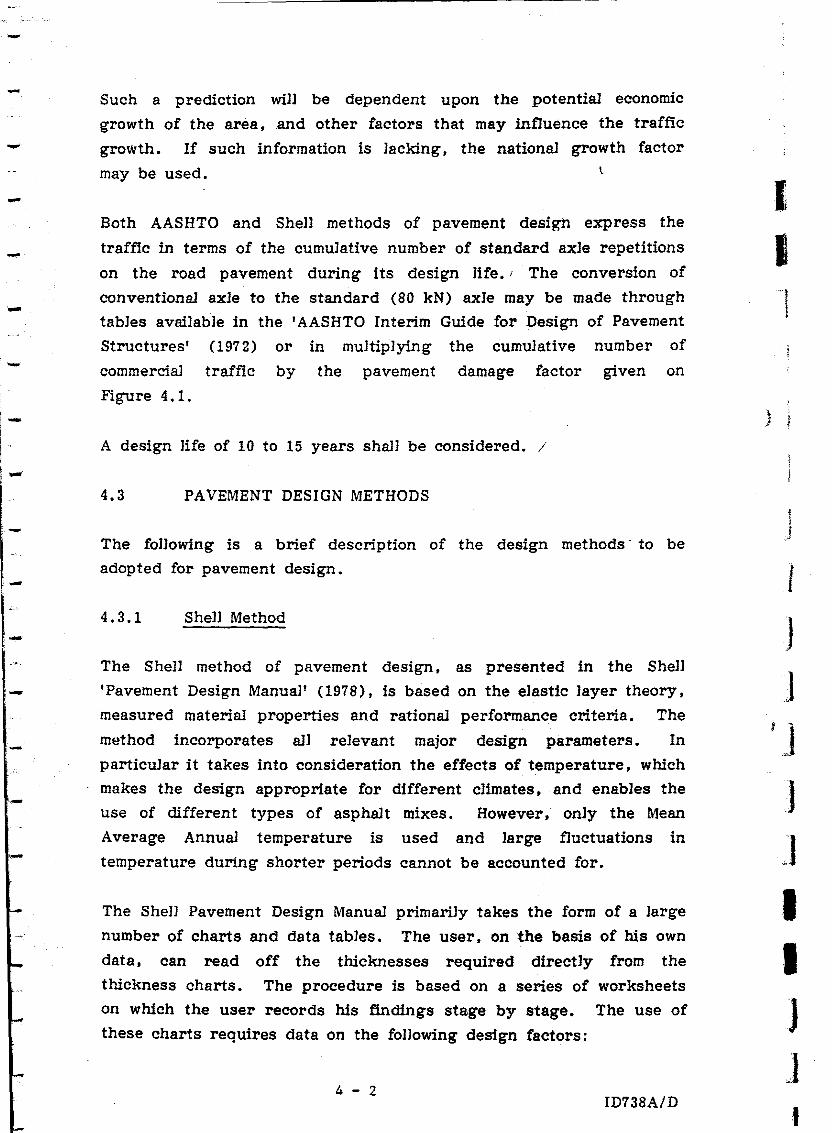
Such a prediction wi]] be dependent upon the potential economic
growth of the area, and other factors that may influence the traffic
growth. If such information is Jacking, the national growth factor
may be used. t
Both AASHTO and Shel1 methods of pavement design express the
traffic in terms of the cumulative number of standard axle repetitions
on the road pavement during its design life. I The conversion of
conventional axle to the standard (80 kN) axJe may be made through
tabJes available in the I AASHTO Interim Guide for Design of Pavement
Structures' (1972) or in multiplying the cumulative number of
commercial traffic by the pavement damage factor given on
Figure 4.1.
A design life of 10 to 15 years shall be considered. /
4.3 PAVEMENT DESIGN METHODS
The fonowing is a brief description of the design methods' to be
adopted for pavement design.
4.3.1 Shel1 Method
The Shell method of pavement design. as presented in the Shell
'Pavement Design Manual I (1978), is based on the elastic layer theory,
measured material properties and rational performance criteria. The
method incorporates all relevant major design parameters. In
particular it takes into consideration the effects of temperature, which
makes the design appropriate for different climates. and enables the
use of different types of asphalt mixes. However, only the Mean
Average Annual temperature is used and large fluctuations in
temperature during shorter periods cannot be accounted for.
The SheJ] Pavement Design Manual primarily takes the form of a large
number of charts and data tables. The user. on the basis of his own
data. can read off the thicknesses required directly from the
thickness charts. The procedure is based on a series of worksheets
on which the user records his findings stage by stage. The use of
these charts requires data on the following design factors:
4 - 2 ID738A/D
I I "'1
1
I
J J
iJ
J ]
I I J J I

Proposed Leoal Altle Load
~
~ ~ ~ ~ ,
~
,~
1\ ,
~
~
=
2
trI
.. G)
CD c: c: ~
.E t- -
~ g
.9 CD c ..
ct
'"
V
ttl
I N
I
Pavement OamaOe
RELATIONSHIP BETWEEN PAVEMENT DAMAGE AND AXLE LOAD Figure 4.1
4 - 3

4.3.2
Traffic: expressed as the cumulative equivalent number of 80 kN
standard axles per lane
Temperature: expressed as the mean annual temperature in the
road area. For pavement design purposes the 'weighted' mean
annual air temperature (w-MAAT) win be computed
Subgrade: expressed as the subgrade modulus (N/mZ) which is
converted from the design CBR
Bituminous materials: expressed in terms of stiffness and fatigue
characteristics. The selected mix code wi]] be dependent on the
penetration grade of the bitumen used as we]] as the design of
the mix.
AASHTO Method
The flexible pavement design procedure presented in the 'AASHTO
Interim Guide for Design of Pavement Structures' (1972) is based on
the results of the AASHTO Road Test, supplemented by existing
design procedures and available theory.
The design procedure uses two simplified charts and the one to be
used wiJJ depend upon the level of serviceability required in the form
of nomographs which have been developed from the AASHTO Road
Test data. The use of these charts requires data on the fol1owing
design factors:
Subgrade strength: expressed as the soU support value which
incorporates an empirical correlation with the design CBR value
of the sub grade
Projected traffic: the cumulative volume of traffic during the
design life expressed in equivalent 80 kN standard axles
Environmental and climatic conditions calJed a Regional Factor
based on rainfall and frost conditions in the project area, and
the expected condition of the pavement structure in terms of
saturation flooding
4 - 4 ID738A/D
r (
1 . i
j
I t I )
I I J 1 J

-
T
"
Structural ,properties of the materials: expressed as a umtless
coeffieientfor the different pavement layers
Serviceability index: the type and quality of service expected
from the pavement structure during the anticipated life.
The combined effect of the above-mentioned factors enables the user
to work out the required structural number which is converted into
the required thickness of each pavement layer. by using pavement
layer coefficients.
The following coefficients are generally used in the pavement
structure in order to convert structural numbers to actual
thicknesses:
Asphaltic concrete wearing course 0.44 (Marshall
stability)
~ 900 kg,
Asphaltic concrete binder course 0.40 (Marshall
stability)
~ 800 kg
Asphaltic concrete base course 0.35 (Marshall
stability
~ 800 kg
Crusher run base course 0.14 (CBR > 80%)
Granular subbase course 0.11 (CBR > 30%)
Considerable care is needed to uSe the correct coefficients in terms of
the materials being used. The coefficients given above are those to
be used t assuming the materials are the same as those used in the
AASHTQ..testroad,e. g.', the granular base would be fully crushed , ,
stone.. non-rounded, non-weathered, having a minimum CBR of
80 per cent.
4 - 5 ID738A/D

If other materials are to be used because of their availability. other
coefficients should be used. Guidelines are shown in Table 4.1.
In YAR the use of the crusher run base course should be preferred
over the bituminous base course for the following reasons:
Good quality crushed stone and gravel is readily available.
therefore, its use is more economical.
Crusher run base course is less sensitive to variations in mixing
and compaction than the bituminous base; therefore. it is easier
to control.
4.4 BITUMINOUS CONCRETE MIX PROPERTIES
4.4.1 Asphalts
Asphalt for bituminous concrete should be petroleum asphalt cement.
grade 60-70 penetration. A lower penetration asphalt should be
considered when road gradients are in excess of 10 per cent.
4.4.2 Gradation
The combined mineral aggregate for the bituminous mixes should
conform to the gradings in Table 4.1.
TABLE 4.1: GRADINGS OF MINERAL AGGREGATES
Per cent Passin Base Binder Wearing
AASHTO Sieves Course Course Course
l~ inch 100 100 100 1 inch 80-100 100 100 3/4 inch 70-90 80-100 100 ~ inch - - 80-95 3/8 inch 55-75 60-80 -No. 4 44-62 45-65 48-62 No. 10 33-48 30-50 32-45 No. 40 16-27 15-32 16-26 No. 80 - - 8-18 No. 200 3-10 3-10 4-8
4 - 6 ID738A/D
r I
I I

, r
4.4.3 Job-Mix
When tested according to the Marshall Method, the bituminous
mixtures should conform to the requirements in Table 4.2.
TABLE 4.2: BITUMINOUS MIXTURE REQUIREMENTS
Wearing Base Course Binder Course Course
Asphalt Binder (%) 4-7 4-7 4-7
Stability (kgs) 800 800 900
Flow (mm) 2.4-5.0 2.4-5.0 2.4-4.0
Voids in Total Mix (%) 4-7 4-6 4-5
Voids filled with Asphalt (%) 60-75 60-75 70-80
4 - 7 ID738A/D
lf
j
w , .... ,
-' . "'\',,":,,'~' .. -'
". _.~ ." "~:>_~"':'; ... x<::
,'. __ ., ... , ',' ·~>:~:~~~~~eF;: '. ,.,.,.. . ........ '
.... ~ '.-.~ .. ','
J
: .;".:" ..
- ", ,
.........
;tt~fli," .
. -".-
',' " ,
, , >
. ;',
• ~.. : ,A .-
... , ....
........ ... . .
SECTION 5 :':. >'.- ~,',' .,' Hydrology ··ari4 Hydraulics ·of:_':',>.;,,·.,,:' .'. Drainage-:Structures
.', -': ::. .'
.-: ..... . ':,., " :
. :.~:
.. :' .. :- . . ' .
" -.-
. ......
<'", ,',
. :.~
." •. u~ •• _ ••
J r r r r
r lf
,
I
I
I
I
I
I
I
SECTION 5: HYDROLOGY AND HYDRAULICS OF DRAINAGE
STRUCTURES
5.1 HYDROLOGY OF A DRAINAGE BASIN
For the design of small drainage structures, the peak discharges
under consideration are those of rt:noff from small drainage basins.
There is a significant difference between small and Jarge drainage
basins. For conditions in the YAR a limit of 10 km 2 is adopted as
the criterion of a smal] drainage basins for practical purposes.
From a hydrological point of view, the runoff from a drainage basin is
influenced by climatic and physiographic factors. The climatic factors
include the rainfaJl. and evapotranspiration. Physiographic factors
include the draina ~t;' area, its shape, slope J land use, surface
infiltration condition, soil type, permeability, topography and channel
characteristics.
5.2 HYDROLOGICAL DETERMINATIONS
5.2.1 General
The existing methods of hydrological determination of waterway areas
may be classified into a variety of categories.
5.2.2 Method of Judgement
By this method the hydrological determinations are dependent on
practical experience and individual judgement. The judgement
developed by the engineer is invariably guided by personal
-observation and general informatio[l coJJected on the ground such as
the flood height. the size of channel, and drainage structures in the
vicinity of the stream, this may be satisfactory if the judgement is
sound. However. the method has disadvantages since no judgement is
perfect and because conditions vary greatly from problem to problem.
5 - 1 ID738A/C

5.2.3 Method of Formulae
By this method a formula is developed to determine the waterway
area. The formulae range from simple to complex ones; many like the
Rational and Talbot Formulae are still very popular in engineering
practice. The greatest merit of formulae is their function as a guide
to quickly determining the general range of the probable minimum,
maximum and average values. The method can also be considered as
practicable and serviceable for rough calculations. However, the
disadvantage of this method is the uncertainty involved in the
selection of the proper coefficient for most formulae to meet closely
the conditions of the problem under consideration.
5.2.4 Method of Direct Observation
This method involves making careful field surveys of drainage area
and stream characteristics and then making a precise hydrologic
analysis and hydraulic study. This is used to arrive at the required
size and shape of the waterway which wiU carry off the water
quickly.
5.2.5 Method of Correlation Analyses
This method can be used in ungauged catchments and involves the
correlation of important hydrological factors by relating them to
gauged catchments. These factors may include catchment area, slope
and shape of catchment, type of soil, land-use, stream frequency,
percentage urbanisation, average annual rainfall, soil moisture de fecit
etc. The peak discharge is found by using an appropriate formula
relating these hydrolOgical factors or by a nomograph for practical
applications.
5.2.6 Method of Hydrograph Synthesis
For this method, flow records and the corresponding· rainfall records
are required. Isolated rainfall events that produce single-peaked
hydrographs are selected. The base flow is subtracted from each
hydrograph and the volume of the storm runoff measured. The
rainfall infiltration is then estimated by standard methods and the
effective rainfall calculated. The catchment area is measured and the
5 - 2 ID738A/C
;
r (
1
I i
• , t
J
I I I I I J J ,
'-
-
volume of effective rainfall found. This volume is compared to the
actual volume of runoff from the hydrograph to check for any
discrepancies. The hydrograph obtained is defined as the unit
hydrograph i.e. - the runoff p!"oduced bya known intensity and
duration of rainfall. This process is repeated and a number of unit
hydrographs are obtained from which the average is found. The
return period and profile of the design storm is chosen and by using
the wet hydrograph, the design hydrograph can be found by the
principle of superposition.
5.3 RECOMMENDED HYDROLOGICAL METHODS
The merits and demerits of each method should be carefully
considered by the designer as appropriate to specific con<.litions and
available hydrometeorological data atrailable in the country. However
it is recommended that the hydrological determinations for small
drainage basins shall be made hy the Rational Method and for large
drainage basins by the modified Talbot Formula. Wherever conditions
allow. these determinations should be checked by the method of direct
observation, I.e .• Slope-Area Method.
5.3.1 Rational Method
The Rational Formula for the determination of runoff is as follows:
Q = 0.278 CIA
where Q = Discharge in m 3/ sec
C = Runoff coefficient
I = Rainfall intensity in mm/hour for a duration equal
to time of concentration
A = Drainage area in km!.
The coefficient of runoff C is the variable of the Rational Method
least sUsceptible to precise determination. Its use ih the formula
implies a IlXed ratio for any given drainage area, whereas in reality,
the coefficient accounts for abstraction or losses between rainfall and
5 - 3 ID738A/C

--
-
-
runoff which may vary for a given drainage area as influenced by
differing climatological and seasonal conditions. The range of
coefficients for different characters of tributary areas are shown in
Figure 5.1. The runoff factor selected should reflect the character
of the area after the development.
Determination of rainfall intensity for hydraulic design involves
consideration of the fo11owing factors:
Average frequency of occurrence
Intensity duration characteristics of rainfall for selected
average frequencies of occurrence
Time of concentration.
The three factors are brought together in an Intensity-Duration
Frequency Curve (IDF).
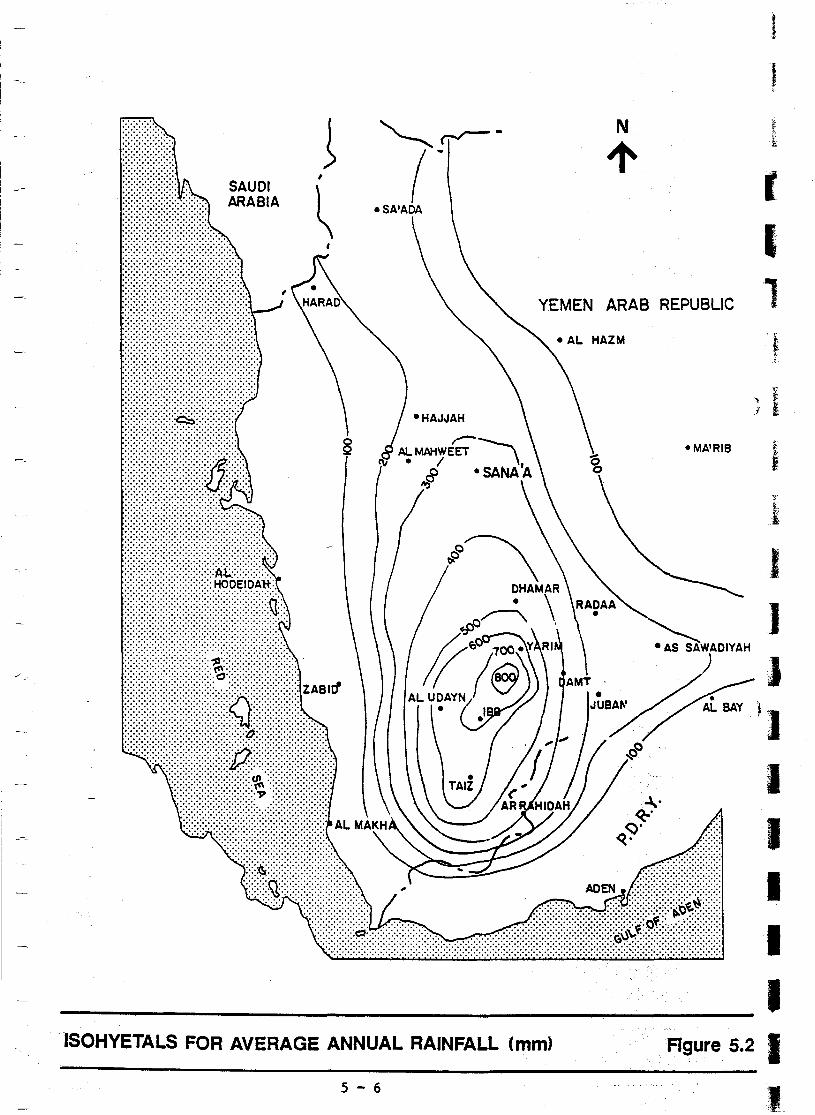
The rainfall distribution in the Y AR is dispJayed in isohyetals and is
shown in Figure 5.2. This shows that the mean annual rainfall in the
country varies from less than 100 mm to more than 700 mm. Because
of this large variation in the annual rainfall, three sets of Intensity -
Duration - Frequency Curves for three ranges of rainfall i.e. less
than 200 mm t 200-400 mm and more than 400 mm t have been presented
in Figures 5.3, 5.4 and 5.5 for use in the hydraulic deSign of
structures depending on their location.
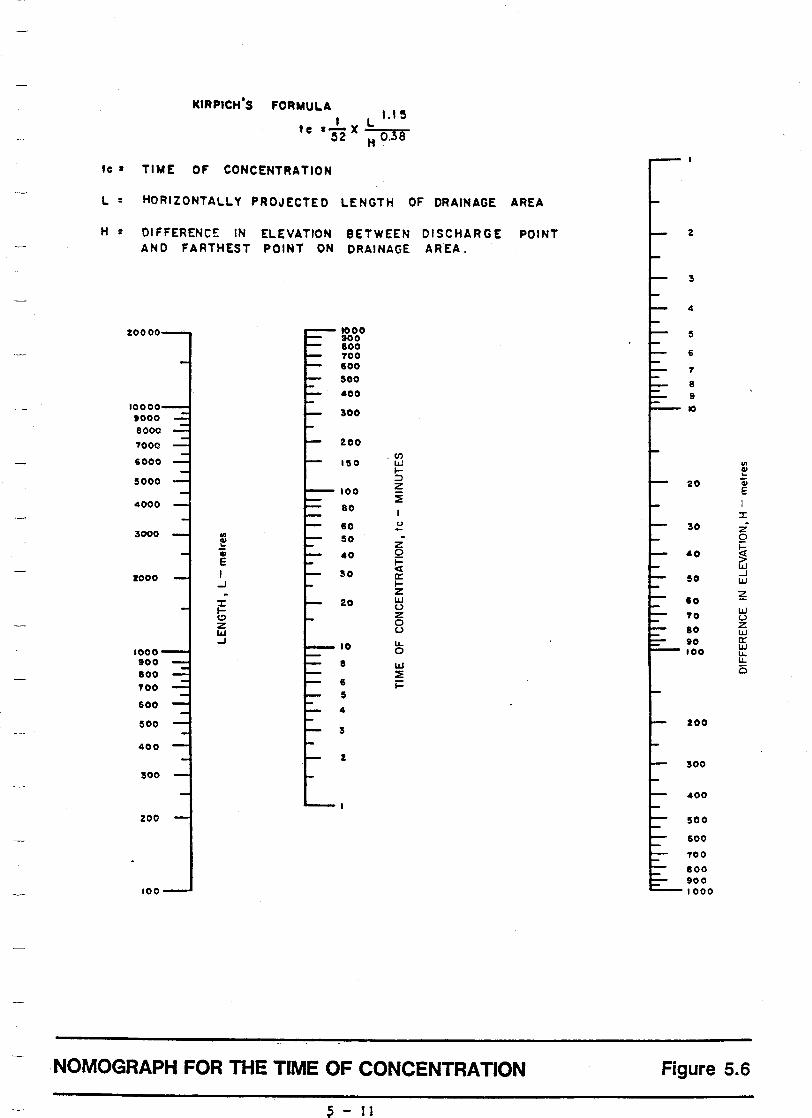
The time of concentration at any point in a hydraulic design is the
time required for runoff from the most remote portion of the drainage
area to reach that pOint. The time of concentration is estimated from
the Kirpich formula:
tc
where
L 1-15 -
= 52 X HO'38
tc =
L =
The time of concentration in minutes
Horizontally projected length of drainage area in
metres
5 - 4 ID738A/C
(
I
I
I )
}I
I I I I I I

-
-
f
f
r
AO~--~~--------~~~----------------~
..... ..... o z ::>
0-8
e::: 0-6
..... o
IZ !::! 0-4 (.) c;: ..... L.a.J o (.)
0-2
BAND 3
0-0 L-_______ ..L...-______ ..L...-_____ "-_____ ----'
o
BAND 1
BAt;lD 2
BAND 3
BAND 4
50 100
RAINF' ALL INTENSITY I
ROWNO BARREN IN UPPER SAND VALUES, FLAT IIARR£N
ISO
mm/hr.
IN LOWER BAHO. I1tEI' FORESTED • STEEP GlASS WEADOWS
Tlt.lBER lAHDS OF MODERATE TO STEEP SLOPES. WOUNTAINOUS. FAIIMING
FLAT PElMOUS SURFACES, FLAT F'NtIotl»IDS WOODED IJtU. AND Wu.oows
200
r RUNOFF COEFFICIENT FOR USE IN RATIONAL METHOD
- 5 - S
LIMIT USED FOR DETERMINING Ie'
Figure 5.1
i _-
~~-
(" -SAlADA
-HAJJAH
ALMAHWr;;~ - / \, a -SANAA hj
YEMEN ARAB REPUBLIC
- AL HAZM
" J
-MAIRIB
t
t ,
~ ~
i-
f I 1 ~
'" i
) . .. .
)
I·· E
I I I I
ISOHYETALS FOR AVERAGE ANNUAL RAINFALL (mm) Figure 5.2 I 5 - 6 ,-

1
I
•••••
I , 1
-I
, iJ
ISO
150
140
130
120
a: 110 ;:) o ::c a: ~ 100
f3 a: ~ 90 ~ ::::i ...I
i 80 z
:: 70 -~ l-e;; 60 z &&J ... Z -
30
20
10
r--- . - -T- .'-_.- . 1 , • I I
'-, ~ -
~~ .., ,
" 1; ~
~ ~ "-0. -
',,- .. ~d ~
~ Uc: ~A . ~ ~ ~
~. ~~ I' ~ ~ "
is' ~
~ ~ ~. I~o ~, ~ l~ ~ J-.
~ ~,~ ~ '-
, C';..
" ,~ ~
~ r\. ~ .. ~ /,.., .-J-.
" "'"' ~~ .... ~4..f 5', ~ ~ ..
" ~, I~ ~ " ~\ ~re: ~ ~ r\. 4.0 10:, r--
~ ~ , ~" "<411
" ~ ~ ~ ~
" '" ~'\ ~~ ~ -.. ~ I' '-."" ~ ~ , ..... , ~ "" ~ ~ "' ~ "- "-.....
, ~ , t: "'I11III , ....... ~ ~ " f'" ~ r-.. ~
< \ 2 3 4 5 10 15 20 30 60
TIME OF CONCENTRATION (Te) IN MINUTES
CURVE J : LESS THAN 200m .m. ANNUAL RAINFALL
, RAINFALL INTENSITY - DURATION - FREQUENCY CURVES
~
~ ""II1II
~ ~ ~ 110..
~ ~ r--.. ~ .... ~
120
Figure 5.3

180
170
1 -- 160
1\ , ~~ ,",_
OJ
'tb ~ '~ ~ ~~
" "', ISO
140
130
a:: ;:)
~ 120 a:: LIJ ~
ff} 110
a:: I-LIJ
! 100 -' ::! 2
3: 90
-:: >-I- 80 u; Z LIJ I-3e 70
-' -' 4 "- 60 z ;( a::
50
40
30
2.0
'" I ... ,. 1\ , ~ ,~ ~ ~
v
1\ , -,.
~ , 1'1 ~ ~ ~ 1', , , , ~
~ "
, ~ "..L. /0
~ ~
1\ ~ 1\ -f~d' ~
~. , ~, " r\ \~ ,
,~ ;.; 1\
~ ~ ~ \ ~\ ~.A
'U'
~ I, 1,\ ~ .. ~ .. ~ .~ ~
~" ~\ ~ ~ f'-~ ..
, 1\..' ~\ ~
"I
~ , ~" " ~ IIIrIr.. ...
~
~ " 0 ~ ~ ~ ~ ~ ~ ~ ~
~ ~ ~
, ......
......... ..... ~ ~ ~ ~ .... .
10
2 3 4 5 10 15 20 30 60 TIME OF CONCENTRATION (Tel IN MINUTES
CURVE 2: FROM 200m.m. - 400m.m. ANNUAL RAINFALL
RAINFALL INTENSITY - DURATION - FREQUENCY CURVES
5 - 8
~ ~ --.. .....
I
}
, ~ ~ ~ ~ ~ ~
120
I I
I
I I , ¥-:
I I J l l I I J
Figure 5.4 I ,

r r I
r
J
I
I
J.
I
I
1
l
-I ~\
i· 1 .. ~
i -I
a: ;:) o %
200
190
180
170
160
150
a: 140 IIJ Q.
en ~ 130 tIIJ ~
:j 120 ~
~ ;:::; 110 -->!:: en z 100 IIJ
~ ..J 90 ..J
it z ~ 80
70
60
50
40
30
20
[ I , ~l'
.~. ~-. - "--..,.---
'~ 1\ " ~
" $ ~ "Eft r_ .~
~) ~ ~ J- . ,
" ~
\ .~
\ , , ~ U\ ,
\ , , 0
~~ 'b ~ ~ ;..
~:, ...
1\ , \, ~ ~ ~
.~
~. " '~ \ ~ ~ '1 , ,
\ , \ \' \
"" , :
~ , \\ ~ ~ ". ~
Y1>1S\
~ \ \ ~ , \ ~ , ~ ~ , i\\ '" \
~ ~ " \ ~ \ ~ , , \' ~\ ~ ,
~ , \.\ ~\ l\
" ~ " \ \ ~ '" , ~ , , ~ ~ ~ ,
" , ~
i\ r\ '-~ ~ , '" ~ ~
"'" ~ .
2 :5 4 5 10 15 20 30 . , 60
TIME OF CON :ENTRATION (Tc) iN MINUTES
CURVE 3 : MORE THAN 400m.m. ANNUAL RAINFALL
i RAINFALL INTENSITY - DURATION - FREQUENCY CURVES
5 - 9
~ ~ ~ ~
~ ~ l1li... ~ ~ ~ ~ ~ ....
120
Figure 5.5

H = The difference ill elevation between discharge
point and farthest point on drainage area in
metres
The time of concentration for the corresponding values of L and H
can be directly read from the nomograph given in Figure 5.6.
The degree and cost of repairing damage caused by exceeding the
capacity of a drainage structure combined with hazards and
inconvenience to the public and the classification of the highway,
control the determination of the design frequency and therefore the
design discharge. Frequency with regard to hydraulic design. is the
average interval between discharges equal to or greater than a given
discharge. or the probability that such a discharge will occur in any
one year. For example a 10-year peak discharge is a flow that may
be expected to be equalled or exceeded on an average of once every
10 years or 10 times in 100 years.
The design frequency for the determination of design discharge shall
be selected for the indicated structures shown on Table 5.1.
TABLE 5.1: STORM DESIGN FREQUENCIES (YEARS)
Type of Structure Road Category
A B & C
Bridges 100 50 Culverts 50 25 Roadside ditches 10 10 Stormwater channels 10 10 Stormwater Inlets 10 10 Gutters 10 10 Irish Crossings 50 50
5 .3 .2 Modified Talbot Method
The modified Talbot Formula is defined as
Q = A i
5 - 10 ID738A/C
[
I
, [
KIRPICH'S FORMULA L 1.1 ~ I
tc -'B2 X H 0.38
tc • TIME OF CONCENTRATION
L : HORIZONTALLY PROJECTED LENGTH OF DRAINAGE AREA
H : DIFFERENCE IN ELEVATION BETWEEN DISCHARGE POINT 2
AND FARTHEST POINT ON DRAINAGE AREA.
3
4
%0000 1000 !S 300 800 TOO 6
600 1 500 8 400 9
10000 300 10
tOOO 8000
1000 200 ,fJ)
6000 I!SO LLJ '" ~ GI "-
!SOOO ::l 20 a:;
100 Z E ~ 4000 80
::I: 60 u 30 Z -3000 '" 50 - 0 GI Z ~ "-a:; 40 0 40 ~ E ~ LLJ
I ~O .J 1000 c:: 50 LLJ -J ~ Z ~
::I: 20 LLJ 10 ~ U LLJ C) Z TO U Z 0
80 Z U LLJ LLJ
90 c:: -J 10 u.. LLJ
1000 0 100 u.. u.. 900 8 LLJ 0 800 ::E TOO 6
5 i=
600 4 !SOO ZOO
3
400 Z
300 300
400
ZOO 500
600
TOO 800 900
100 1000
NOMOGRAPH FOR THE TIME OF CONCENTRATION Figure 5.6
- 11
-------
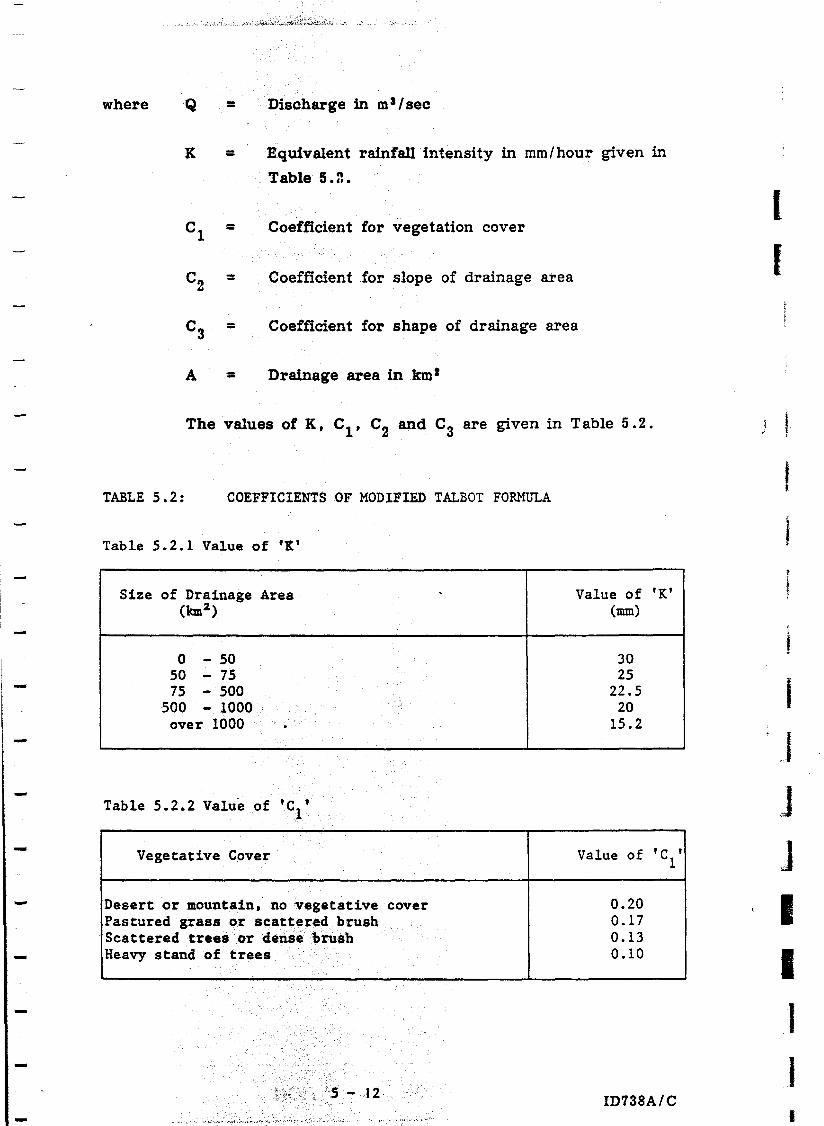
where Q = Discharge in m 31 sec
K = Equivalent rainfall intensity in mmlhour given in
Table 5.a.
C1 = Coefficient for vegetation cover
C2 = Coefficient for slope of drainage area
Ca = Coefficient for shape of drainage area
A = Drainage area in km I
The values of K, C1 ,C2 and C3 are given in Table 5.2.
TABLE 5.2: COEFFICIENTS OF MODIFIED TALBOT FORMULA
Table 5.2.1 Value of 'K'
Size of Drainage Area (1cm2 )
0 - 50 50 - 75 75 - 500
500 - 1000 over 1000 .
Table 5.2.2 Value of 'c ' 1
Vegetative Cover
Desert or mountain, no vegetative Pastured grass or scattered brush
. Scattered trees or dense brush Heavy stand of trees
.
cover
Value of (mm)
30 25
22.5 20
15.2
Value of
0.20 0.17 0.13 0.10
'K'
'c ' 1
ID738A/C
I (
t
j
I J J J I I J I I
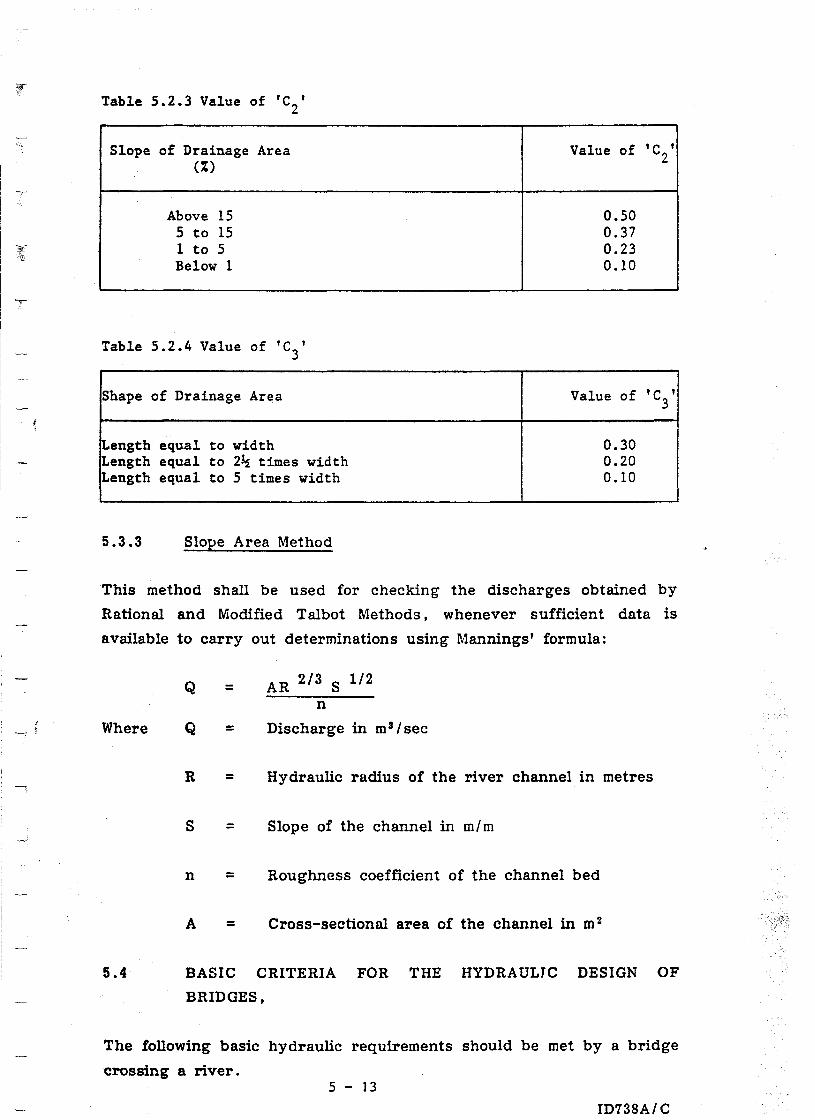
Table 5.2.3 Value of 'ez'
Slope of Drainage Area Value of 'e2 ' (%)
Above 15 0.50 5 to 15 0.37 1 to 5 0.23 Below 1 0.10
Table 5.2.4 Value of 'e3 '
Shape of Drainage Area Value of 'e3 '
Length equal to width 0.30 Length equal to 2~ times width 0.20 Length equal to 5 times width 0.10
5.3.3 Slope Area Method
This method shall be used for checking the discharges obtained by
Rational and Modified Talbot Methods, whenever sufficient data is
available to carry out determinations using Mannings' formula:
Q = AR 2/3 S 1/2
n
Where Q = Discharge in m3 /sec
R = Hydraulic radius of the river channel in metres
S = Slope of the channel in m/m
n = Roughness coefficient of the channel bed
A = Cross-sectional area of the channel in m 2
5.4 BASIC CRITERIA FOR THE HYDRAULJC DESIGN OF
BRIDGES,
The following basic hydraulic requirements should be met by a bridge
crossing a river. 5 - 13
ID738A/ C

5.4.1 Location
The site selected should enable construction of a safe, economical and
easily maintained crossing, having l'egard to the nature of the
waterway and to the use of such training works as may be appropriate
to deal with adverse natural features.
5.4.2 Design High Water Level and Bridge Height
For the purpose of selecting a minimum height for the bridge
superstructure. the design high water level should normally be
selected after giving due consideration to the fo1lowing:
5.4.3
The maximum historical water levels as observed or recorded or
obtained from local people or as inferred from observed or
recorded levels at another point on the river or waterway from
which levels can reasonably be transferred to the site in
question
The water level derived from frequency analysis and
corresponding to flood of a frequency appropriate to the
importance and value of the structure.
Free Board
An appropriate clearance should be allowed between the design high
water level and the lowest part of the superstructure. The fonowing
items should be taken into account in determining the free board:
The maximum expected height of waves, where not allowed for in
determining the design high-water level
The projection of floating debris.
The liability of the superstructure to damage by water.
A free board of 1.5 metres minimum should be provided over the
maximum expected flood level to the lowest point of the underside of
deck.
5 - 14 ID738A/C
r I
l E

5.4.4 Length of Bridgeworks
General
The length of bridgeworks should be such that the water way opening
is able to pass the maximum flows without endangering the bridge or
adjacent structures by scour, without creating major maintenance
problems and without causing unacceptable backwater effects
up-stream.
Trial Waterway Gpening Width
Where no other guidance regarding a suitable width of waterway opening
is avaiJable t a first trial width may be selected from the empirical
regime formula for stable alluvial channels
=
Where =
Q ::
C =
CQ i
The waterway surface width in metres at design
discharge
Design discharge in cum I sec
Co-efficient
The suggested range of C is from 3.26 to 4.89. The upper end of the
range should be used for shifting channels in sandy materials, but
for relatively stable channels in more scour-resistant materials the
lower value may be used.
Waterway opening width and cross-sectional area should always be
calculated normal to. the principle direction of flow as it enters the
bridge in major floods.
'The scour, backwater, velocities, etc., should be estimated under
design flow conditions for various widths and then the optimum
arrangement should be selected to satisfy design criteria and minimise
total costs of approaches, foundations, superstructure and training
works.
5 - 15 ID 38A/C
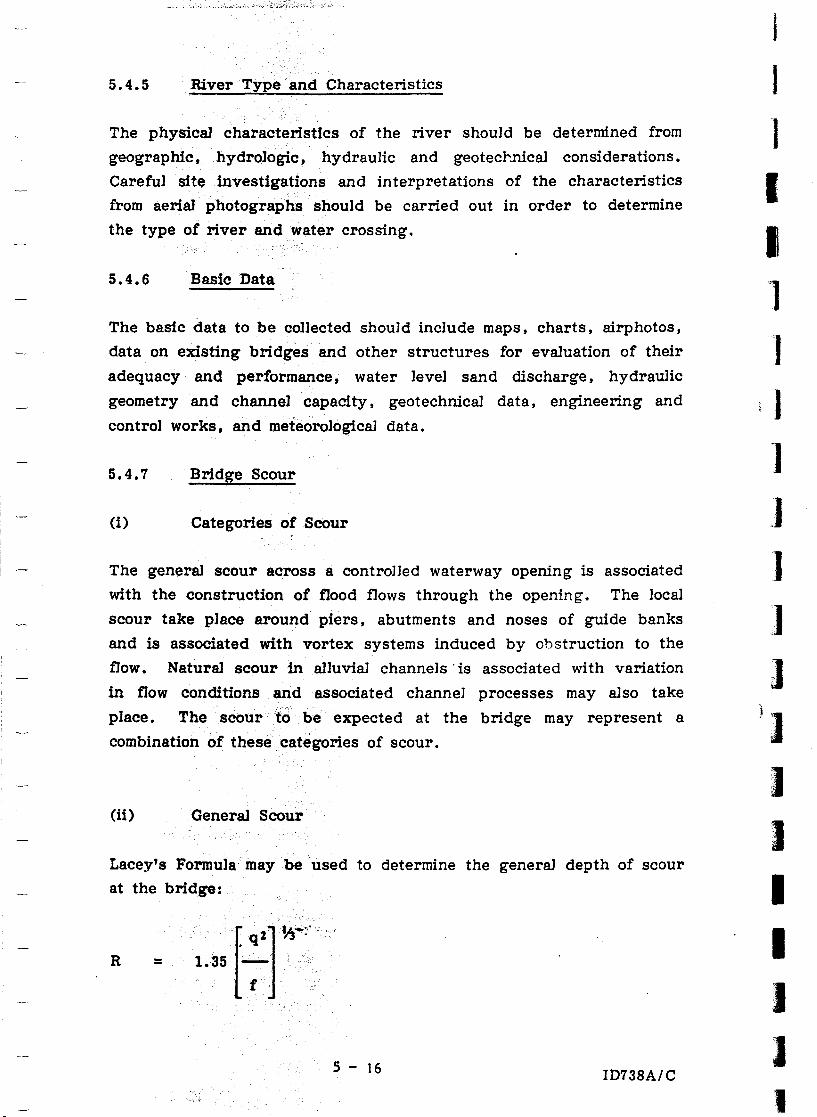
5.4.5 River Type and Characteristics
The physical characteristics of the river should be determined from
geographic, hydrologic, hydraulic and geotecbnical considerations.
Careful site investigations and interpretations of the characteristics
from aerial photographs should be carried out in order to determine
the type of river and water crossing.
5.4.6 Basic Data
The basic data to be col1ected should include maps, charts, airphotos,
data on existing bridges and other structures for evaluation of their
adequacy and performance, water level sand discharge, hydraulic
geometry and channel capacity, geotechnical data, engineering and
control works, and meteorological data.
5.4.7 Bridge Scour
(i) Categories of Scour
The general scour across a controJJed waterway opening is associated
with the construction of flood flows through the opening. The local
scour take place around piers, abutments and noses of guide banks
and is associated with vortex systems induced by obstruction to the
flow. Natural scour in alluvial channels' is associated with variation
in flow conditions and associated channel processes may also take
place. The scour to be expected at the bridge may represent a
combination of these categories of scour.
(ii) General Scour
Lacey's Formula may be used to determine the general depth of scour
at the bridge:
R =
5 - 16 ID738A/C
J
J
1 I I 1 )
J
]
]
:1 ]
J }l
I I I I I J 1

where R = Depth of scour in metres
Q = Discharge intensity in cu.m/sec/m
f = Lacey's silt factor
f = 1. 76 (d )t m where
and
= mean diameter of silt particles in millimetres
(iii) Loca] Scour
The general scour as estimated from the above formula should be
visualised as occurring under a single span bridge without piers in the
channel. Piers placed in the waterway opening tend to produce
additional local scour even where they do not produce any significant
reduction in the net waterway width. In general, the local depth of
scour depends on; the pier width, length, shape, alignment, footing
detai:s, on velocities and depth of flow. on the type and size of bed
material and on the rnte of bed transport. In practice these factors
cannot all be taken into account and it is necessary to use simplified
relationShips derived from model tests, which give an indication of
the worst scour that might occur.
The local scour depth allowance for piers aligned parallel to flow
depending on the shape may vary between 1. OW and 2. OW where W is
the width of the pier. These values should be used as a multiplying
factor to the general scour value (R) obtained by Lacy's Formula.
The local depth of scour may be very much greater in the case of a
skewed pier. The multiplying factors for local scour at skewed piers
to be applied to the above local scour allowances may vary between
unity and 4.5 depending upon the angle of attack and the
length-to-width ratio of the pier. Angles ofa.ttack greater than 5 to
100 should therefore be avoided whenever practicable.
5 - 17 ID738A/C
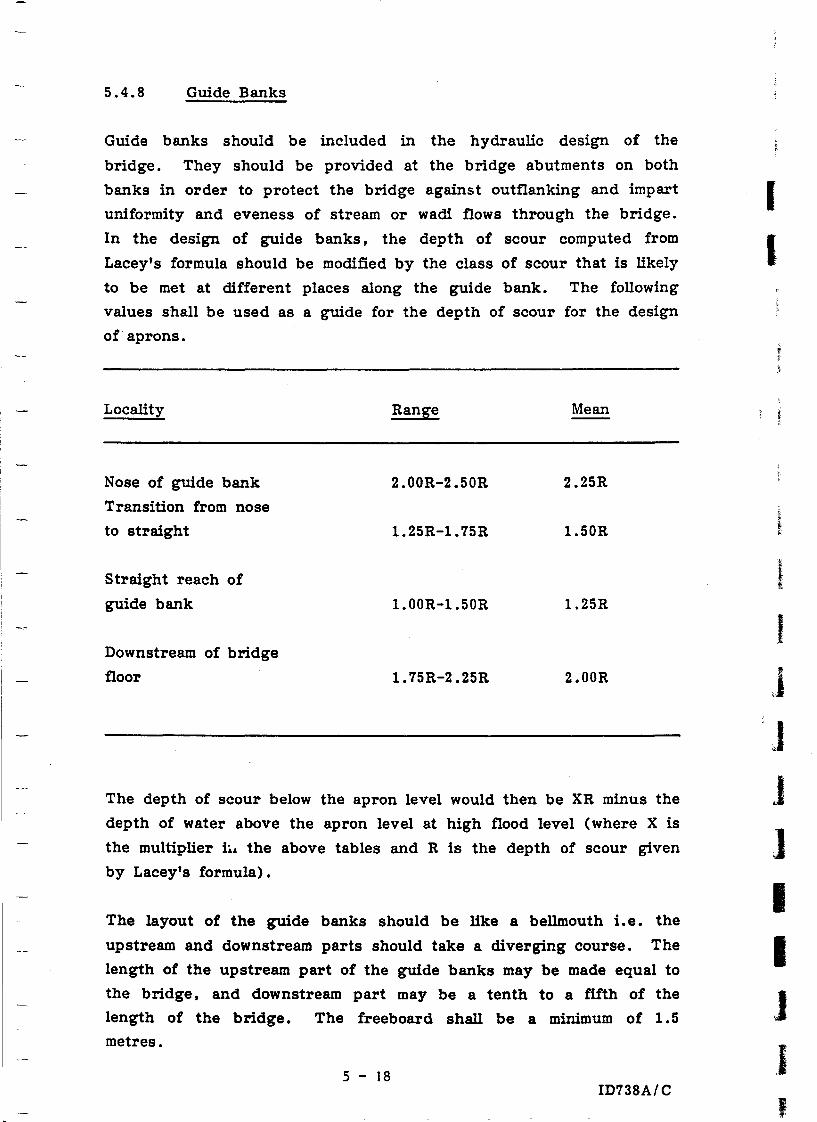
5.4.8 Guide Banks
Guide banks should be included in the hydraulic design of the
bridge. They should be provided at the bridge abutments on both
banks in order to protect the bridge against outflanking and impart
uniformity and eveness of stream or wadi flows through the bridge.
In the design of guide banks, the depth of scour computed from
Lacey's formula should be modified by the class of scour that is likely
to be met at different places along the guide bank. The following
values shall be used as a guide for the depth of scour for the design
of aprons.
Locality
Nose of guide bank
Transition from nose
to straight
Straight reach of
guide bank
Downstream of bridge
floor
Range
2.00R-2.S0R
1.25R-1.75R
1. OOR-1.50R
1. 75R-2 .25R
Mean
2.2SR
1.50R
1.25R
2.00R
The depth of scour below the apron level would then be XR minus the
depth of water above the apron level at high flood level (where X is
the multiplier h~ the above tables and R is the depth of scour given
by Lacey's formula>.
The layout of the guide banks should be like a bellmouth i.e. the
upstream and downstream parts should take a diverging course. The
length of the upstream part of the guide banks may be made equal to
the bridge, and downstream part may be a tenth to a fifth of the
length of the bridge. The freeboard shall be a minimum of 1.5
metres.
5 - 18 ID738A/C
(
I
J ]
I I J

5.5 BASIC CRITERIA FOR THE HYDRAULIC DESIGN OF
Ct:JLVERTS
The design of highway culverts involves the determination of flow,
hydraulic performance. economy and the type of structure and
its Jc~ntion.
Two major types of culvert flows may be expected: flows with inlet
control and flows with outlet control. For each type of control ,
different factors and formulae are used to compute the hydraulic
capacity of a culvert. Under inlet control, the cross-sectional area of
the culvert barrel. the inlet geometry and the amount of headwater or
pounding at the entrance are 0f primary importance. Outlet control
f involves the additi 'JnaI consideration of the elevation of the tail water , in the outlet channel and the slope, roughness and lengths of the
, culvert barrel.
r
f
I
If normal depth in the culvert is less than the barrel height with the
inlet submerged and outlet free. then this culvert is said to be
flowi~g under inlet control. i. e.. the entrance will not admit water
fast enough to fiJ] the barrel and the discharge is determined by
the entrance conditions. The inlet functions like an orifice for which
Q = Cd A~h
where Q = Discharge in Cli. m / sec.
h = Head on centre line of orifice in metres
A = Area of orifice in sq. metres
g = Acceleration due to gravity in m/sec2
Cd = Orifice coefficient of discharge.
The head required for a given flow Q is therefore
h
5 - 19 ID738A/C

The value of Cd for a sharp-edged entrance without suppression of
the contraction is 0.62 while for a well-rounded entrance Cd
approaches unit.
When the normal depth of design flow is greater than the barrel
height and the inlet is submerged the culvert will flow full. also when
the inlet and outlet of a culvert are submerged the culvert in each
case wiJJ be operating with outlet control. The discharge capacity of
such a culvert wi]] depend on the total head loss (hL ) in the culvert.
=
where
=
=
hv =
=
Where:
Ke =
n =
L =
v =
g =
h + h f + h e v
Entrance loss = K V2 e-
2g
Friction loss in the barrel
Velocity head in the barrel
(Ke + 1 + 29 n 2 L) where V2
2g
Coefficient of culvert entrance
=
=
Manning's roughness coefficient
Length of culvert barrel in metres
V2
2g
V2
2g
Mean velocity of flow in culvert barrel (m/sec)
Acceleration due to gravity (9. Slm / sec 2 )
5 - 20 ID73SA/C
)
r I
I I I I J I
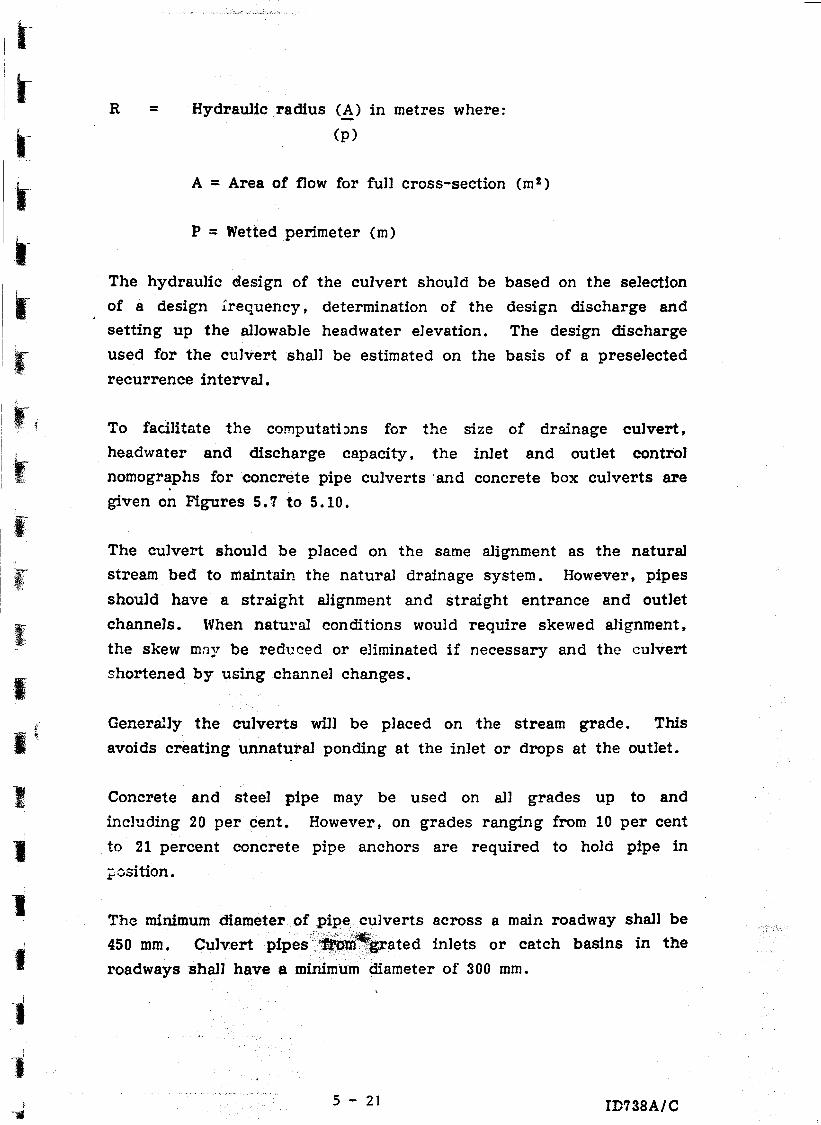
r r
r
f
I
I ~
1
1
I
R = Hydraulic radius (A) in metres where:
(p)
A = Area of flow for fun cross-section (m!)
P = Wetted perimeter (m)
The hydraulic design of the culvert should be based on the selection
of a design lrequency, determination of the
setting up the allowable headwater elevation.
used for the culvert shall be estimated on the
recurrence interval.
design discharge and
The design discharge
basis of a preselected
To facilitate the computati:>ns for the size of drainage culvert,
headwater and discharge capacity, the inlet and outlet control
nomographs for concrete pipe culverts . and concrete box culverts are . given on Figures 5.7 to 5.10.
The culvert should be placed on the same alignment as the natural
stream bed to maintain the natural drainage system. However, pipes
should have a straight alignment and straight entrance and outlet
channels. When natural conditions would require skewed alignment,
the skew mny be reduced or eliminated if necessary and the culvert
shortened by using channel changes.
Generally the culverts wi]] be placed on the stream grade. This
avoids creating unnatural ponding at the inlet or drops at the outlet.
Concrete and steel pipe may be used on all grades up to and
including 20 per cent. However, on grades ranging from 10 per cent
to 21 percent concrete pipe anchors are required to hold pipe in
;osition.
The minimum diameter of pipe culverts across a main roadway shall be
450 mm. Culvert pipes'"~~ated inlets or catch basins in the
roadways shall have a minimum diameter of 300 mm.
5 - 21 ID738A/C

-
4500 300
~200 200 E.ample
3900 0 1050 mm (1.05 m) 0 3.4 cumecs
3600 HW
3300 100 0 H ...... (m)
(1) 25 ;:,6
3000 (2) 2.1 2.2 (3) 2.2 2.3
50 Dinm 2ioo
40
2400 30
20 ~100 /
/" on ./ III ;800 ...
dY' t;
~ ;.po.""
>' 'E I 1500 ./
0 / en 1350 I-a:
W
......... ~ > ..J 1200 ;:) ......... E u :::J 2
......... u I 0
IIJ
~scale (,!) Entrance type a: 900 ex 0
~ U
(1) Square edge with headwall ..J 825 en ex 25 (2) Groove end with headwall Z 0.5 (3) Groove end projecting a: 150 W 0.4 I-~ To use scale (2) or (3)
615 0.3 prOlect horizontally to scale (1). then use straight inclined
600 0.2 line through 0 and Q scales, or reverse as illustrated.
525
0.1
4~0
0.05
3iS
0.03
300
HEADWATER DEPTH FOR CONCRETE PIPE CULVERTS WITH INLET CONTROL
5 - 22
(1) (2) (3)
6 6
5 5
[ 6
4 i 5 4
I 4 " , 3
3
3 1 I
2 2
2
1.5 1.5 , • . 1
1.5
i , .l
Z
~ 1.0 1.0
ti: IIJ 1.0 Q
f .9 .9
.9
.8
J .8
.8
.7 .7 I .7
)
J .6 .6
6
J J .5 .5
.5
I I J
Figure 5.7
I

I ..,-
, .~
r
r
r
r
r " ,
I
I
I
I
• I
I
..
::'0 JOOO
2700
2400
2100 10
1800
1650
!l 1!l00 ~
4
J
'" Co) CU e a I ..... 0
W· c,:) a:: 4 :c u CJ)
E
,:;
,4
,J
:1
1350
1200
/' ,/ 1050
900
825
i~
6i5 1/1 ... ... Gi 600 .§
'E I 5:>5
'0
ffi 4,50
ti ~ 4 E Ji5
..l 4, Z a: IIJ
~L JOO
~ L 40
0 1200 kc
HEAD FOR CONCRETE PIPE CULVERTS FLOWING FULL n=0.011
f) - 23
0,5
o .j
o ...
:: ... .. e
.4
5
1.0
I 2 ..... :r: o 4 III :c 3
.:
Figure 5.8
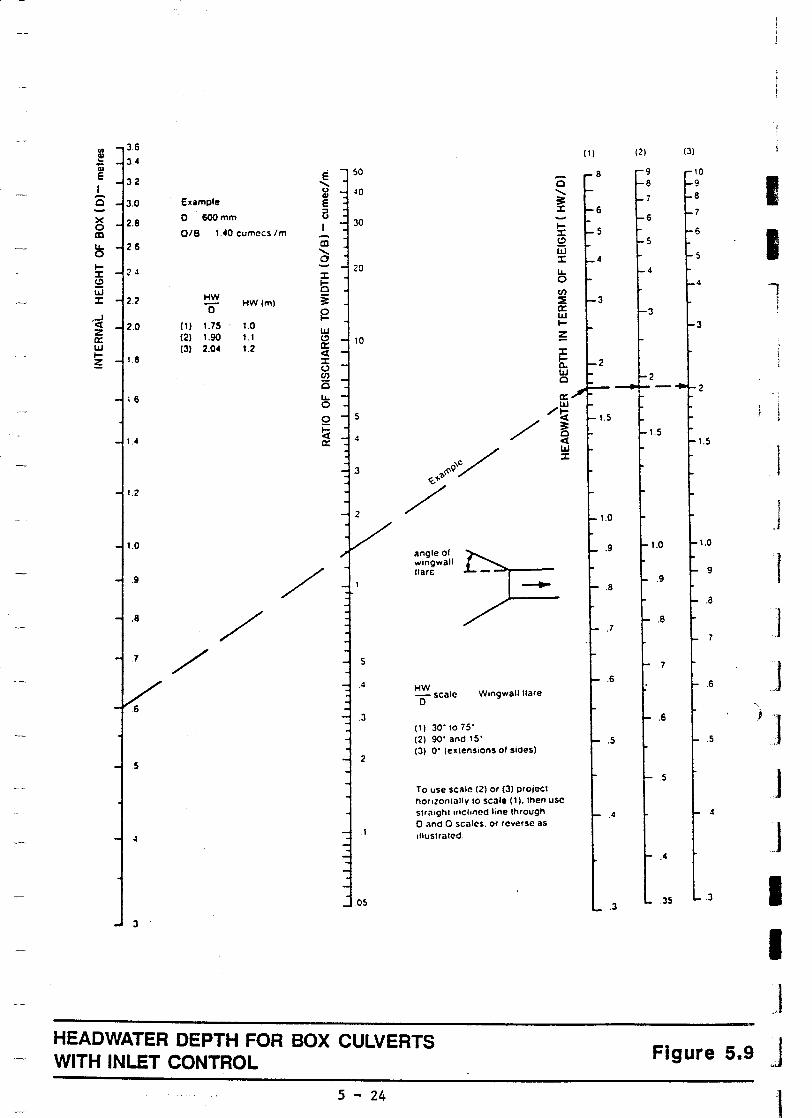
.. 36 ~ 34 Gi E 32 I -Q 3.0 Example
E "-u QI E
X 2.8 0 CD
o SOOmm
0/8 1.40 cumecs 1m
:::l U
~ 26 en "-0
I- 24 :I: (!)
W :I: 2.~
.;:1 2.0
Z a:: W I-
1.8 ~
HW HW(m)
0
(I) 1.75 1.0 (2) 1.90 1.1 (3) 2.04 1.2
:I:
5 ;: ~ W (!) a:: « :I: (.) CJ)
0 16 u.
0
0
1.4 fi a::
1.2
1.0
.9 /
.8 /
6
3
50
40
30
20
10
5
4
5
.1
angle of wingwall lIart
/
~scale o W.ngwall lIare
(1) 30' to 75' (2) 90' and 15' (3) 0' (extensions of sides)
-Q
"-~ ~ (!)
W :I:
~ CJ)
~ a:: w I-
~
~ o a:: w
/~
~ « w :I:
TO use scalp. (2) or (3) prOlect hortzontally 10 scale (1). then usc str;lIght ."cl.np.d line through o "nd a scales. or reverse as .lIustrated.
HEADWATER DEPTH FOR BOX CULVERTS WITH INLET CONTROL
5 - 24
(1) (2) (3)
8 9 10
I 8 9 8
6 7 6
5 6
I 5
4 5
4
4
I 3 f 3
3
2
2
1.5 1.5
1.0
.9 1.0 1.0
.9 .9 I
.8 .8
.8
7 .7 J
.7
.6 .6 J .6
.5 .5
.5 ] .4
J .4
.35 .3 .3 I
I J
Figure 5.9 J

r
r
r
.,
r '. r
I
r
I
I
to U CI)
E a I
200
100
50
40
JO
20
10
o s
2
Q... 11 -
12
10
5 E tT 4 ."
.3
(!) Z IJJ Z z a: ::J ::::> I-
I HEAD FOR CONCRETE BOX CULVERT FLOWING FULL n=0.011
5 - 25
2
.3
4
.s
1ft CI) .. W E I -:::t:
'l.<:F 0 < IJJ :::t:
-2 ~:P 't H 2.25
3
(.;ln1P~ _IC __ _
----- -4
5'
10
Figure 5.10

5.6 BASIC CRITERIA FOR THE HYDRAULICS OF THE
ROADSIDE DRAINAGE CHANNELS
Stormwater drainage channels alongside the roads are generally
designed as open channel flow. The hydraulics of a storm water
channel design is based on Manning's Formula:
Q =
where:
Q = Design flow in cubic metres/per sec
n = Manning's coefficient of roughness
A = Area of channel in square metres
R = Hydraulic radius in metres
S = Slope of channel in metres per metre
The values of Manning's coefficient 'n' for some types· of channels in
common use are given in Table C. The design of the channel is
facilitate by using the nomograph for the solution of Manning's
formula shown in Figure 5.11.
Roadside ditches shall be designed for a 10-year storm frequency,
however small channels and stream alignments shall be designed for a
50-year frequency.
In providing for erosion protection the actual velocity should be
checked against the maximum safe values for the unprotected earth.
When the velocity exceeds the maximum permissible, means of
reducing velocity to safe levels or for protecting the channel should
be used. TabJe 5.4 lists maximum permissible velocities for various
erodible linings.
Where channel erosion is expected then a stable form of channel lining
should be provided. The channel bed and side-slope shall be lined
5 - 26 ID738A/C
I I
, j
']
J JJ
J J I I J J

S R R ;?/J 5 t/2 V V
~ n
4
.06 15
.2 .08 10
.1 8
1 In 10
DB 6
.06
.2
.04 4
W ll.. 0 ..J en
.02 lit .~
e 2 ~ u E • I&J ~
1 ttl 100 .01 ,
Z E ~ .6 :::;
I ooB 0 C) >-<[ ~ a: ... .006 .8 Z U
u a: 9 ;:) ::::i l- I&J .004
;:) > <[ a: .8 c >-::z:
.6 .002
2 .. \1/\ 1000 001
.0008
0006 4
. 0004 .2 .
6
.0002
S R V n
I In 10000 0001
KEY
NOMOGRAPH FOR SOLUTION OF MANNING'S EQUATION FOR OPEN CHANNEL FLOW
5 - 27
n .004
.006
.OOB
010
.02
.03
C .04 en
-C) Z Z z .06 <[
:i
.08
.1
.2
.3
.4
Figure 5.11
with either rock riprap or concrete for permanent protection and
stabilisation. Fig. 5.12 illustrates the use of rock riprap in roadside
ditches for protection against erosion.
Abrupt changes in the alignment or in grade should be avoided. The
drainage channel should have a grade that produces velocities that
neither erode nor cause deposition in the channel. This optimum
velocity will depend on the size, the shape of the channel, the
quantity of water flowing, the material used to line the channel and
upon the nature of the soil and type of sediment being transported.
The point of discharge of a drainage channel (outfall) into the natural
water course should be given particular attention. The alignment of
the drainage channel should not cause eddies with attendant scour in
the natural water course or near the outfall structure. In erodible
soils, if the flow line of the drainage channel is appreciably higher
than that of the watercourse at the outfall, a spillway or chute should
be provided to discharge the water into the watercourse in order to
prevent erosion in the drainage channel.
The approximate grade of the channel is computed from a topographic
map. To prevent deposition of sediment the minimum gradient for
earth channels should be 0.5 per cent.
For roadside ditches a free board to top of ditch of 0.20 metres and
for small channels a free board of 0.30 metres shall be provided.
5.7 IRISH CROSSINGS
An Irish Crossing is formed by lowering the highway grade to the
streambed level from bank to bank. These crossings are commonly
used across dry drainages or where the day-to-day stream flow is
low.
The Irish Crossing may be vented or it may have culverts, formed by
. partially lowering the highway grade for floods and providing culverts
to handle the day-to-day flow.
5 - 28 ID738A/C
r (
, f
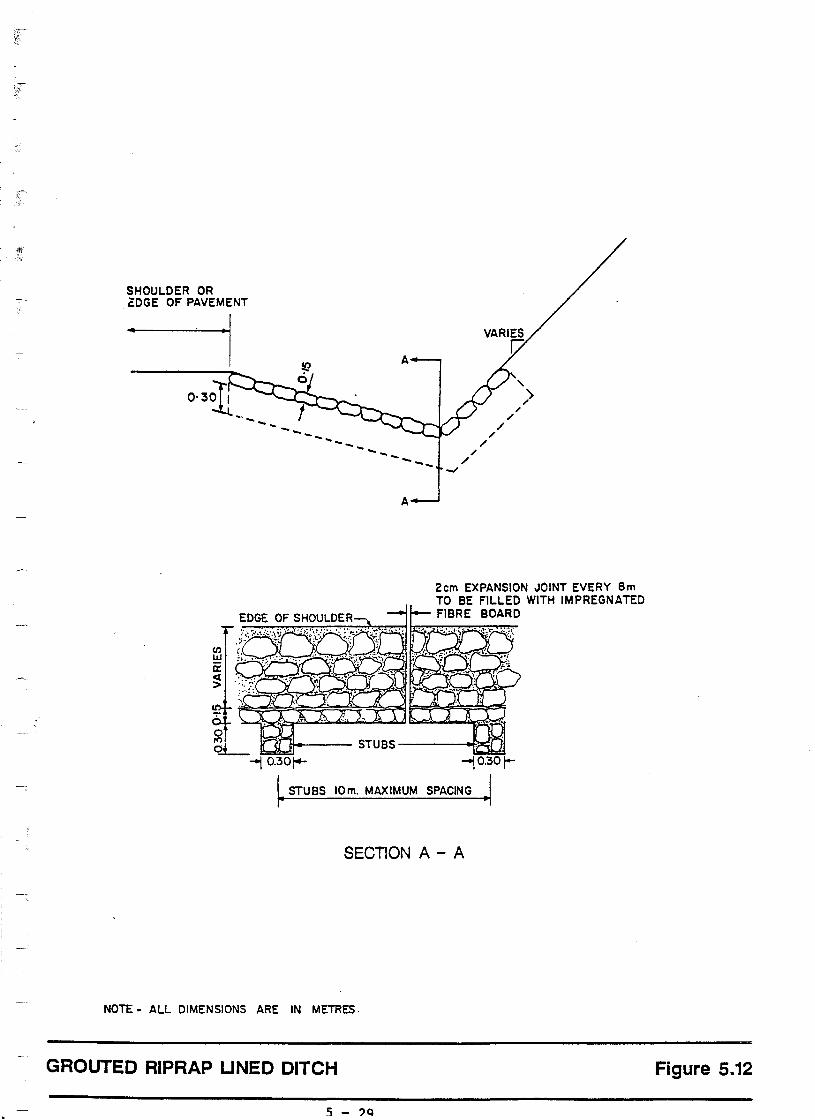
SHOULDER OR C:DGE OF PAVEMENT
O'31l "-... ---- ... --... - " " " /
" /
, ,,'> ,
2cm EXPANSION JOINT EVERY 8m TO BE FILLED WITH IMPREGNATED FIBRE BOARD
H4_-- STUBS----~
-1 0.30~ -! 0.30 t-
I. STUBS 10m. MAXIMUM SPACING ~
SECTION A - A
NOTE - ALL DIMENSIONS ARE IN METRES.
GROUTED RIPRAP UNED DITCH
5 - ?Q
Figure 5.12
The design storm frequency for hydraulic design are as given in
Table 5.1 according to the classification of the road.
The Irish Crossing shall be protected against scour and damage by
undermining, on the upstream and downstream by aprons made from
rock rap or loose riprap gabions. The dimensions of the downstream
apron shall be determined from the depth of scour computed from
Lacey's formula for scour depth. The apron should be carried far
enough along the downstream edge of the crossing to protect against
high water.
The Irish Crossing shall be provided with upstream and downstream
guide banks in order to protect it against outflanking and keep the
wadi channel within the crossing. Guide banks will not be required
when the wadi banks are composed of sound non-erodable rock. The
guide banks shall be protected against scour by covering them with
gabions or stone pitching on the embankment slope and an apron at
the base. The design of the apron shall be based on the depth of
scour as worked out by the Lacey's formula. A minimum free board
of 1.0 metres above the highest flood level shall be provided in the
design of guide banks.
Typical details of Irish Crossing, including details of guide banks are
shown in Figures 5.13 and 5.14.
5.8 SPILLWAYS
A stepped spillway in reinforced concrete at the downstream end of
the culvert for steep side slopes shall be provided as shown on
Figure 5.15. The spillway is a stepped channel with two side walls
and bottom formed in steps, which is required to carry the discharge
from the culvert to the natural water course and for dissipating the
excessive energy before reaching the end of spillway. The width of
spillway is governed by the distance between the wing walls of the
culvert. The minimum width shall however be computed from the
relationship:
Y . = 1.293Q
Z3/2
5 - 30 ID738A/C
1
'1 i J . ,
)
]
]
]
]
) ~ • I I I I I J I

lnl
wi
-I -< "0 -0 ~ r C m -I ~ -r 0 "11
:0 en ::t:
0 :0 0 en ~ z C>
"11 cO c ... (I)
<.n . ..... W
"I "~-J --. ".""""
L J I. DOWNSTREAM APRON ./ UPSTREAM APRON
r -I
2·50 2·00 "301 VARIES (2·00 MIN) 2·50
PROFILE GRADE +12mm. STEEL
t3 FLOW @ O·GOm. c/c. 0·5 THICK ROCK GABIONS 0'50m" ROCK GABIONS tFLOOD POST06 FLOOD POST ANCHOR FOR GABIONS
E:) I ~ -:J 'WAW4': V "::1 K=( J W r H 'q 1(""" ") x ::i:7 1 ~ v= H_ ~n yo;;;> v v 7f, ye;( V D ir:J < i 1: A\iY/X'
o
0 10
REINFORCED CONCRETE CLASS 210/20
RUBBER ASPHALT OF ELASTIC TYPE
~ FLOOD POST .
OPEN MACADAM
10.301
NOTE- ALL DIMENSIONS ARE IN MILLIMETRES UNlESS OTHERWISE INDICATED .
+16mm. BARS
IOmm • STIRRUPS AT O·20mm.c/c.
COVER
REINFORCED CONCRETE CLASS 210/20
SECTION A-A
BANK TO BE PROVIDED UNLESS THE WADI BANKS ARE OF SOUND NON- ERODABLE ROCK
ROCK GABIONS
DUMPED RIPRAP JFLOW ~ D/S
CARRIAGEWAY CONSTRUCTION AT IRISH CROSSING PLAN
HiO
DUMPED RIPRAP
JOINTS
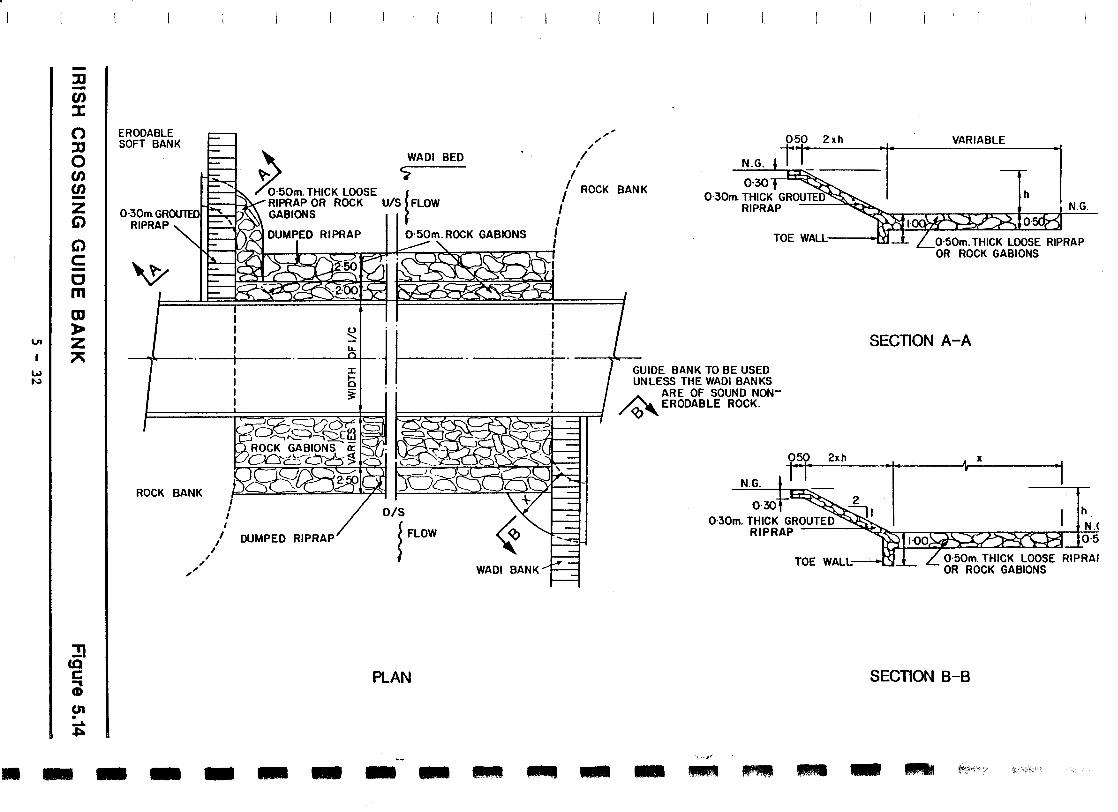
V11
W N
:0 en :t: 0 :0 0 en en -z G')
G') C -c m OJ » Z
"
:!! CO C
"" CD
U1 . -'" ~
ERODABLE ,,~
SOFT BANK /
"
~ WADI BED
'?': ~
~ RIPRAP OR ROCK U/S FLOW
I I
I / ROCK BANK
I 0·50m. THICK LOOSE f
I P-<:-f)~,\\ GAB IONS II DUMPED RIPRAP 0·50m.ROCK GABIONS
I I , TOE WALL .~]' 7a.50~U: :~S~-{R~RAP
ROCK BANK
" ,,"
-t~ j.~.. i . --nUIDEJ~~~ ~~gIEB~~Et& _ . I UNLE E OF SOUND NON ---+-_...... Fe : A. ~:OOABLE ROCK
~ ii /~,
"
, I ,
I I
I I
WADI BANK
PLAN
'.,,11'
OR ROCK GABIONS
SECTION A-A
SECTION B-B
h N.( 0·5
• _________ .... __ .. ,. .. __ t'f""'r.,c·

---
---
where y &; Z = The width and depth of the spillway in metres
Q = The discha.rge in cu. m I sec.
The lower end of the spillway shall be provided with a stilling basin
in the form of a cistern as shown on F1gure 5.15 for dissipating the
surplus energy of the water. The length of the cistern wi)) depend
on the discharge while the depth shall be between 15 and 30 cm below
the bed level of the natural water course. For general guidance the
length of the cistern may be equal to the width of the spillway
channel. A stone apron in the form of a rock gabion 50 cm in
thickness shall be provided at the downstream end of the cistern for
the safety of the whole spilJway structure in keeping the scour away
from it.
The length of the apron will depend on the discharge and sha.]] be
calculated from Lacey's formula:
R = 1.35 [r] ~ Where:
R = The scour depth in metres
q = The discharge intensity in cu.m/sec
f = The Lacey's silt factor
The length of apron shall be equal to 2.23 R, assuming that the
apron wiJ) settle in the scour hole at a 1: 1 side slope.
Special care is required in the excavation and construction of the
spi1Jway, to ensure its placement on well-compacted material so as to
minimise settlement. The spillway should preferably be constructed
as late as possible fo)]owing construction of the embankment.
5 - 33 ID738A/C
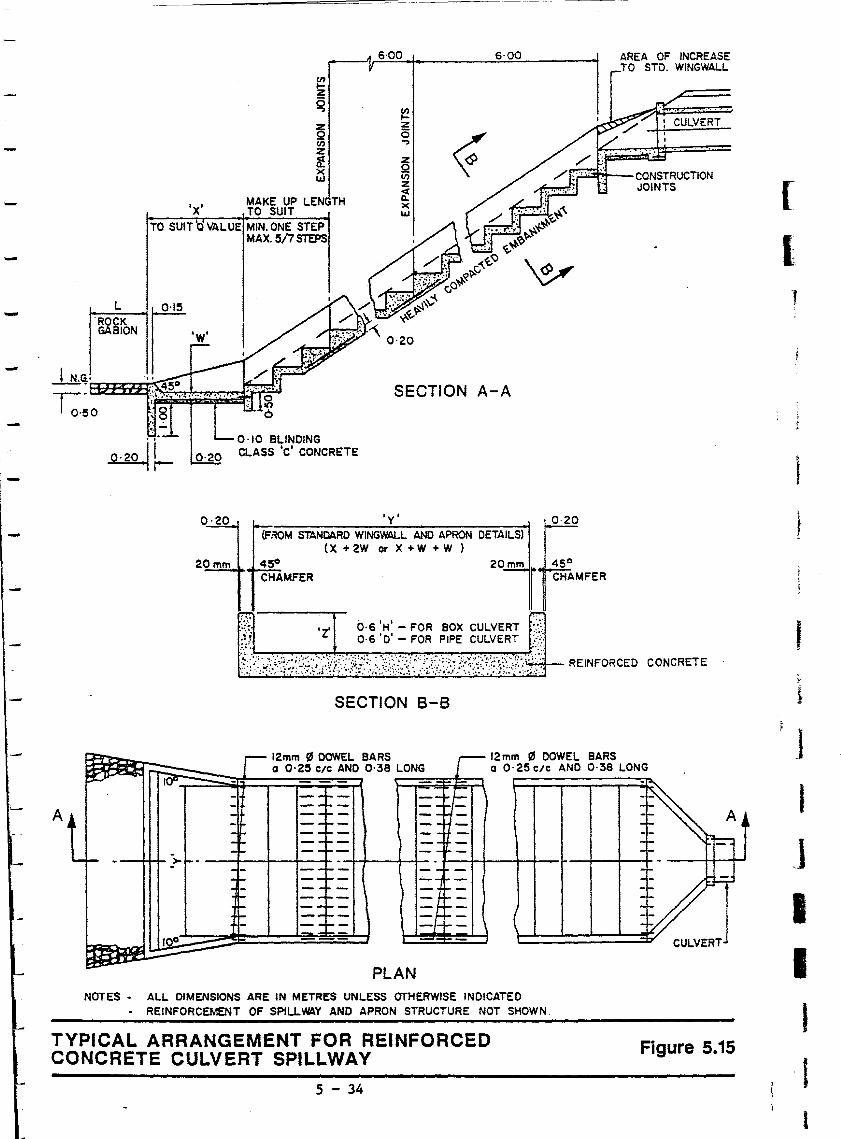
--
-
L 'ROCK GASION
• • MAKE UP LEN TH X TO SUIT
TO SUIT 'a VALUE MIN. ONE STEP MAX. 5/7 STEPS
0·10 BLINDING
0·20 CLASS ·C· CONCRETE
6·00 6'00
~ z 5 ..,
SECTION A-A
'y' (F.~M STAN~RD WINGWALL AND APRON DETAILS)
(X + 2W or X + W + W )
20mm 45° CHAMFER
~----..,....-
~i:~ 'Z' •• ! .~." .
SECTION B-B
AREA OF INCREASE TO STD. WINGWALL
:"':'=---CONSTRUCTION JOINTS
f2mm "DOWEL BARS f2mm , DOWEL BARS Q 0·25 CIC AND 0·38 LONG a 0'25c/c AND 0·38 LONG
A
-++-+-> ---t--t--t---+
PLAN NOTES - ALL DIMENSIONS ARE IN METRES UNLESS OTHERWISE INDICATED
- REINFORCEMENT OF SPILLWAY AND APRON STRUCTURE NOT SHOWN.
TYPICAL ARRANGEMENT FOR REINFORCED CONCRETE CULVERT SPILLWAY
5 - 34
Figure 5.15
[
(~
,
I J I I I 1 I

f
,-
-
TABLE 5.3: MANNING'S ROUGHNESS COEFFICIENTS 'n'
A
1. 2.
3.
4.
B.
1.
Open Channels, lined (straight alignment, uniform section)
Concrete formed no finish Concrete bottom with side slopes in rip rap Concrete bottom with side slopes of random stone in mortar Brick masonry
Open Channels, excavated (straight alignment)
Earth Channel, clean recently completed Earth Channel, clean after weathering Earth Channel, with short grass and few ~eeds Earth Channel. in gravelly soil, clean Earth Channel. dragline excavated or dredged clean Earth Channel, dragline excavated light brush on banks Earth Channel, dense weeds high as flood depth Earth Channel, clean bottom. brush on sides Natural Stream Channel. some grass and weeds little or no brush Natural Stream Channel, dense growth of weeds Natural Stream Channel. some weeds light brush on banks Natural Stream Channel, some weeds heavy brush on banks
5 - 35
Mannings' 'n' range
0.013-0.017
0.023-0.033
0.017-0.020 0.014-0.017
0.016-0.01B 0.017-0.020 0.022-0.027 0.022-0.025
0.027-0.033
0.035-0.050 0.08-0.12 0.05-0.0B
0.03-0.035 0.035-0.05
0.035-0.05
0.05-0.07
ID73BA/C

TABLE 5.4: PERMISSIBLE VELOCITIES FOR CHANNELS WITH ERODIBLE LININGS, BASED ON UNIFORM FLOW IN CONTINUOUSLY SET, AGED CHANNELS
Maximum Permissible Velocities (m/sec) for
Water Soil Type or Lining Water Carrying (Earth, No Vegetation) Clear Carrying Sand and
Water Fine Silts Gravel
Fine sand (noncolloidal) 0.45 0.75 0.45 Sandy loam (noncolloidal) 0.5 0.75 0.6 Silt loam (noncolloidal) 0.6 0.9 0.6 Ordinary firm loam 0.75 1.0 0.67 Volcanic ash 0.75 1.0 0.6
Fine gravel 0.75 1.5 1.1 Stiff clay (very colloidal) 1.1 1.5 0.9 Graded, loam to cobbles (colloidal) 1.1 1.5 1.5 Graded, silt to cobbles (colloidal) 1.2 1.7 1.5 Alluvial silts (noncolloidal) 0.6 1.0 0.6
Alluvial silts (colloidal) 1.1 1.5 0.9 Coarse gravel (noncoilloidal) 1.2 1.8 2.0 Cobbles and shingles 1.5 1.7 2.0 Shales and hard pans 1.8 1.8 1.5
5 - 36 ID738A/C
1 )
--1
1 ..
J ;
j
J , J
J J ]
]
J I I J J ~1

r r L· ~
r L·
I .--
. ·.-',:~'r· '.~.:~ .
.... ::t"' • . ;~:t.
", '0;"'
. :'
. ~- ,,': ,"
. ~ ... . "
)
'"!:."
....•.
SECTION6: RoaclMarkings and Furniture
"'.'
...... ;~ ..
"
,_-.'.-
-; ': .
" .
SECTION 6: ROAD MApTnNGS ft1'!'!) FURNITURE
6.1 ROAD MARKINGS
6.1.1 General
Road markings may be defined as markings on the surface of the road
for the control, warning t guidance or information of road users.
They may be used to supplement the regulations or warnings of other
traffic control devices such as traffic signals or signs. Alternatively
they are used alone to produce results that cannot be obtained by the
use of other devices.
Road marking practices adopted in various countries have been
reviewed to produce a set of recommendations to be used for roads in
the Yemen Arab Republic.
6.1.2 Colour
Review of current marking procedures adopted in various countries
indicates that there are mainly two major colour systems. a
single-colour system and a two-colour system. White is used for the
single-colour system. while white and· ye]]ow are used for the
two-colour system.
Single-colour system countries include England (England uses solid
yellow on curbs for parking restrictions but this is not considered a
main colour) Nigeria, the Netherlands, Sweden and Germany.
Two-colour system countries are divided into two groups. The first
uses ye]Jow for restrictions and includes Finland, Japan, USA and
Switzerland. The second uses yeUow for delineating the edges of the
carriageway and inc1udesSaudi Arabia, Italy and Canada.
A two-colour system is recommended for use in the Y A R with the use
of ~Tellow to delineate the edges of the carriageway and white for all
other markings.

6.1.3 Road Marking Materials
The various types of road marking materials currently used include
paints, thermoplastics, adhesive sheet materials, inset mastic asphalt,
hot sprayed plastic, etc. J with paint and thermo-plastics being the
most common.
r,,~Paint is recommended for the YAR with the material being applied to a . ,l! I thickness of 1.5 mm. Where pedestrian crossings, stop lines J special
l')'" \. I letters, arrow~- or symbols are required, the thickness of application ( ~ should be 3 mm.
6.1..4 Road Markings
Road markings are classified into three types, longitudinal (parallel to
the centre line of the carriageway), transverse (perpendicular to the
centre line) and misce]]aneous.
(a) Longitudinal Markings
Four types of longitudinal markings are required, namely:
Warning lines .
Lane lines ~.
Centre of carriageway lines .
Edge of carriageway lines. ,
The recommended types, dimensions and applications of these are
given in TabJe 6.1 and on Figures 6.1a to 6. lc.
(b) Transverse Markings
These include the stop line and give way line.
6 - 2 ID738/D
1 -I
I '1
) j
]
J:' .-
]
]
1 )]
1 1 I I J ]

·T~ JUNCTION AHEAD SIGN*
" 3OOmm. WHITE STOP LINE
1.20mm. WHITE WARNING LINE (6m.lile x 3m. gop)
150mm. x 30m. CONTINUOUS WHITE LINE
150mm. YELLOW EDGE CONTINUATION LINE (O.5m.tine x O.5m. gop)
INTERSECTION WITH NON PRIORITY ROAD SIGN*
~I
r==::::=======::;:1.2:m:·s(min) -- - - - - - -:,..=--====-======-====--""",,
,.", INTERSECTION WITH NON / PRIORITY ROAD SIGN*
150mm. YELLOW EDGE LINE
" TURN LEFT SIGN
T - JUNCTION (DUAL CARRIAGEWAY)
~ ~ I5Omm. YELLOW CONTINUATIOO ~ (Im.I~' "m . .,,)
LINE
120mm. WHITE WARNING LINE (6m. line x 3m. gap)
*DISTANCES FOR POSITIONING OF WARNING SIGNS SHALL BE DETERMINED BY DESIGN SPEED.
ROAD MARKING DETAILS Figure 6.1a
6 - 3

·X"ROAD JUNCTION AHEAD SIGN~
300 mm. WHITE STOP LINE
120 mm. WHITE WARNING LINE (6m.line x 3m. gap)
120 mm. x 30m. CONTINUOUS WHITE LINE
120mm. WHITE WARNING LINE (6m.line x 3m. gap)
INTERSECTION WITH NON ~ PRIORITY ROAD SIGN*
R= 15m. (min)
1.2"m.( min.) ~=-==============~~-----------
I~ R= 15m.(min)
INTERSECTION WITH N:lN PRIORITY ROAD SIGN*
/ ...:.
150mm. YELLOW CDNTINLIATION SIGN LINE (1m. line x 1m. gap)
R = 15m. (min)
ISO mm. YELLOW EDGE CONTINUATION LINE (O'Sm,lin,e x O·Sm. gap)
·X· ROAD JUNCTIClII AHEAD SIGN*
CROSSROAD JUNCTION (DUAL CARRIAGEWAY)
* DISTANCES FOR POSITIONING OF WARNING SIGNS SHALL BE DETERMINED BY DESIGN SPEED.
ROAD MARKING DETAILS Figure 6.1b
6 - 4
I 1
I J
J I I J 1 ,

il
\
1
GIVE WAY SIGN
(O'5m
l20mm. WHITE WARNNG LlNE/ (6m. line x 3m. gop)
120mm. WHITE WARNING LINE ( 6m.line x 3m. gap)
120mm. x 30m. CONTINUOUS WHITE LINE (Minimum)
ISOnvn. YELLOW EDGE CONTINUATION LINE ( 0·5 m. line x 0·5m. gap)
/150 mm. YECLDW EDGE LINE
I ~.~· ________ ~50~Om~.~ _____ ~
T - JUNCTION (SINGLE CARRIAGEWAY)
·1 120nm. WHITE LANE LINE (3m. line x Sm. gap - <SOkph.) (Sm. line x 12m. gop -> SOkph.)
25m. TAPER 3Om.(LAY-BY) 45m. TAPER
l20mm. WHITE LANE LINE (3m. line x Sm. gap - <SOkph) (6m. lite x 12m. gap - >SOkph)
] 15Omm. YEJ EDGE COtmMJATION (O·5m. line I O·Sm. gap)
LAY - BY I BUS STOP
ROAD MARKING DETAILS
6 - 5
LINE
. Figure 6.1c
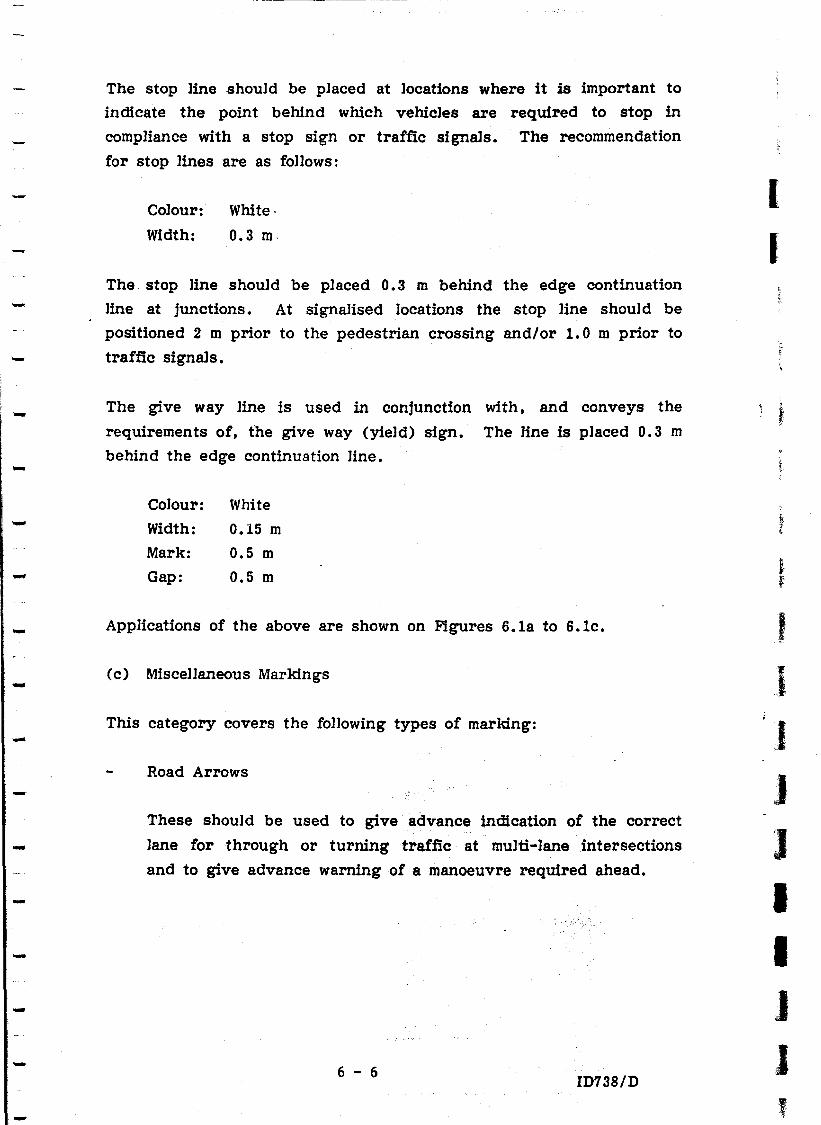
-----------'-:-
----
The stop line should be placed at locations where it is important to
indicate the point behind which vehicles are required to stop in
compliance with a stop sign or traffic signals. The recommendation
for stop lines are as fonows:
Colour: White·
Width: 0.3 m·
The stop line should be placed 0.3 m behind the edge continuation
Une at junctions. At signalised locations the stop line should be
positioned 2 m prior to the pedestrian crossing and/or 1. 0 m prior to
traffic signals.
The give way line is used in conjunction with, and conveys the
requirements of, the give way (yield) sign. The line is placed 0.3 m
behind the edge continuation line.
Colour: White
Width: 0.15 m Mark: 0.5 m Gap: 0.5 m
Applications of the above are shown on Figures 6.la to 6.lc.
(c) Misce])aneous Markings
This category covers the fol1owing types of marking:
Road Arrows
These should be used to give advance indication of the correct
lane for through or turning traffic at multi-lane intersections
and to give advance warning of a manoeuvre required ahead.
6 - 6 ID738/D
-1
I I
i t'
~
~ t , f
t i
.. 1 J l I I J J J
-";-

Chevron Markings
These are used to deflect drivers from the nose of a
channelising island where a traffic stream divides. The
chevrons are angled to deflect traffic in either stream.
Similarly. chevron markings may be used to extend the nose of a
ehannelising island where two traffic streams merge.
Hatched Markings
These are diagonal and appropriate on the approaches to a
central median island and in certain circumstances, to an island
refuge on a two-way carriageway, with the angle of the hatching
arranged to deflect drivers.
Pedestrian Crossings
These markings are used to delineate the part of a carriageway
which should be used by pedestrians to cross the road. Whilst
regulating pedestrian movements, it acts as a warning to drivers
that pedestrians will be crossing at that point.
For pedestrian crossings, the fol1owing are recommended:
The crossing should consist of alternate black and white
strips having equal widths of 0.5 m Jaid across the full
width of the carriageway, and the stripes immediately
adjacent to the sides of the carriageway being black having
a width ranging from 0.5 m to 1. 3 m
The recommended longitudinal length of the stripes is
2.5 m. However, longer stripes (up to 4.5 m) should be
used where the speed limit exceeds 60 kph. In these
situations, the crossing should be controlled by a set of
traffic lights.
Examples of the applications of the suggested road markings are given
on Figures 6.ld to 6.le.
6 - 7 ID738/D

1000
+-750
L 4000
TYPE A
(FOR SPEEDS < 60 kph)
T 575
~l 1860
j
1500
t 1200
1 6000
300 ~~
,T 570 .L
I 2400
l~ -.-525 ..L
TYPE B
(FOR SPEEDS ) 60 kph)
LANE INDICATION ARROWS
T 860
~ 2800
J
500 150 YELLOW EDGE LINE BLACK STRIPE
WHITE STRIPE
PEDESTRIAN CROSSING
NOTE: ALL DIMENSIONS ARE IN MILLIMETRES
ROAD MARKING DETAILS Rgure 6.1d
6 - 8
I I I I I I I I I I I I I I I I I I I I

f .. i
I
-. I
J
I -,
~ DIRECTION OF TRAFFIC
~~===~,,~~~~~-::-~~e~_J450min
~~~~~~~~~'~ DIRECTION ~ OF TRAFFIC
150
WHITE HATCHING
HATCHING DETAIL
DIRECiJON 300
YELLOW EDGE LINE
_ Or: TRAFr:/~ y~OO
==--=--=~~ f'/ ~YELLOW EDGE LINE
~l, ~ ~90o< < d. L !600 ~ \ ISO (1::45=om::in==-1---lsOT
DIRECTION ~ LWHITE CHEVRON OF TRAFFIC
CHEVRON MARKING DETAIL AT INTERS ECTIONS
~ 150f
(CHEVRONS TO BE REVERSED WHEN TRAFFIC FLOW OCCURS IN OPPOSITE DIRECTIONS)
NOTE: ALL D1MENSICNS ARE IN MILLIMETRES
I ROAD MARKING DETAILS Figur~ 6.1e
6 - 9

6.2 TRAFFIC SIGNS
There are three basic types of traffic signs, namely, regulatory ,
warning and informative.
6.2.1 ReguJatory Signs
These are intended to give notice of requirements, prohibitions or
restrictions with which the driver must compJy. They are genera1ly
circular in shape. There are three types of regulatory signs,
nameJy:
Priority signs
Prohibitory signs
Mandatory signs.
Figure 6. 2a shows the internationally accepted regulatory signs, The
recommmended dimensions for these signs are as fol1ows:
Diameter of stop signs: 900 mm
Height of give way triangle: 900 mm
Diameter of prohibitory and mandatory signs: 900 mm.
Regulatory signs are erected at locations where action is to be taken
or where restrictions apply.
6.2.2 Warning Signs
Warning or danger signs are used to give adequate warning to traffic
and pedestrians of hazardous conditions on or adjacent to the highway
system. Most warning signs are triangular in shape with the 8.pex of
the !iiangle uppermost. The recommended height of the triangle of
the warning signs is 900 mm.
distance of 45 m - 150 m from
visibility distance of 60 m - 75
These signs should be placed at a
the hazard and should have a clear
m. Figure 6. 2b shows some of the
more commonly used warning signs.
6 - 10 ID738/D
r t
f
i I I I I
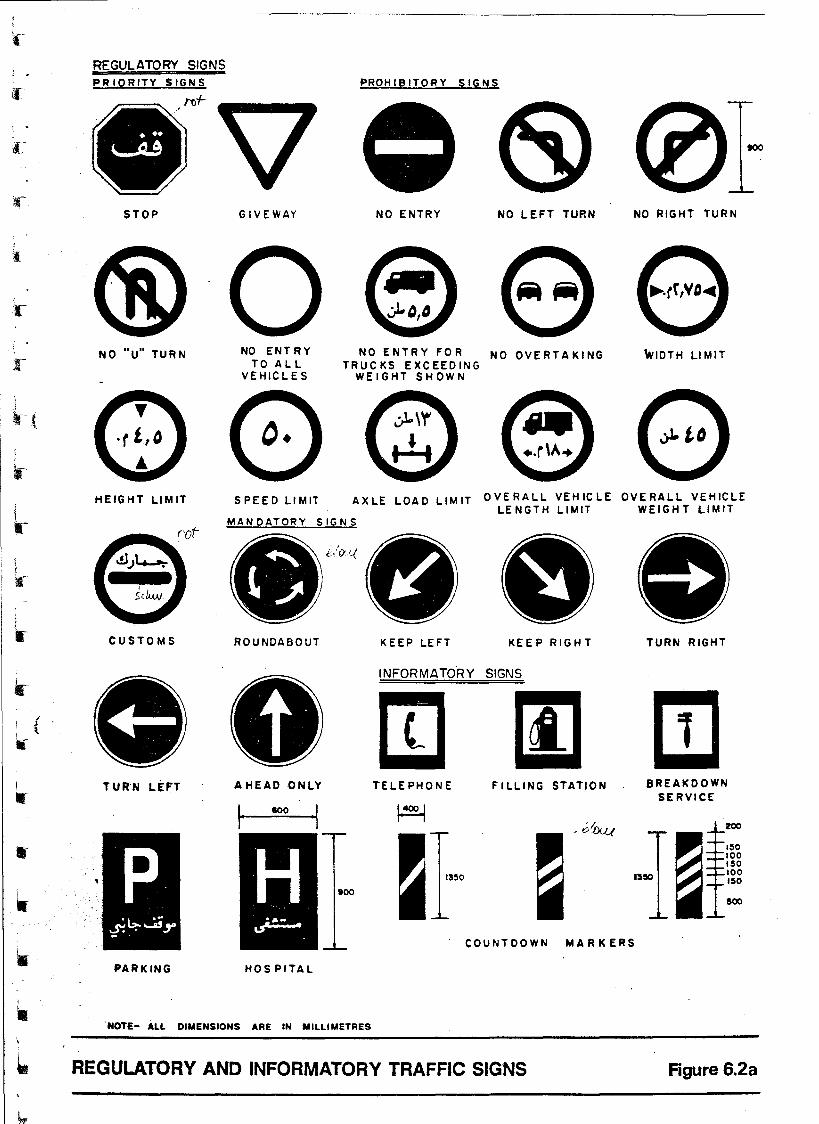
i f J '\
If
1 I(
I •
REGULATORY SIGNS PR IORITY
STOP
NO "u" TURN
HEIGHT LIMIT
CUSTOMS
T UR'N LEp:'T
PARKING
GIVEWAY
NO ENT RY TO AL L
VEHICLES
SPEED LIMIT
ROUNDABOUT
't,· , .
A HEAD ONLY
HOS PITAL
PROHIBITORY SIGNS
NO ENTRY NO LEFT TURN NO RIGHT TURN
NO ENTRY FOR NO OVERTAKING WIDTH LI MIT TRUCKS EXCEEDING
WEIGHT SHOWN
AXLE LOAD LIMIT OVERALL VEHICLE OVERALL VEHICLE LENGTH LIMIT WEIGHT LIMIT
KEEP LEFT KEEP RIGHT
INFORMATo'RY SIGNS
TELEPHONE FILLING STATION
COUNTDOWN MARKERS
TURN RIGHT
BREAKDOWN SERVICE
200
ISO 100 ISO 100 ISO
'NOTE- ALL DIMENSIONS ARE IN MILLIMETRES
REGULATORY AND INFORMATORY TRAFFIC SIGNS Figure 6.2a

I
LEFT BEND RIGHT BEND DOUBLE BEN!) DOUBLE BEND STEEP ASCENT (FIRST TO THE LEFT) (FIRST TO THE RIGHT)
STEEP DESCENT ROAD NARROWS UNEVEN ROAD SURFACE SEVERE DIP /
LOOSE CHIPPINGS
ROAD WORKS
INTERSECTION WITH NON
PRIORITY ROAD
ROUNDABOUT
OTHER DANGER
FALLING ROCK
TRAFFIC SIGNALS
INTERSECTION WITH NON
PRIORITY ROAD ( STA~GERED)
END OF DUAL CARR IAGEWAY'
t· ROO(.'a' 'I
SHARP CHANGE IN DIRECTION
IRISH CROSSING
PEDESTRIAN CROSSING CHILDREN / SCHOOL
AIRFIELD
INTERSECTION WITH NON
PRIORITY ROAD
TWO - WAY TRAFFIC AHEAD
MERGING TRAFFIC FROM THE LEFT (MAY BE REVERSED)
T. JUNCTION AHEAD CROSS ROAD
~400 i .. inl
JUNCTION AHEAD
NOTE- ALL DIMENSIONS ARE IN MILLIMETRES
WARNING TRAFFIC SIGNS
SLIPPERY
ROAD SURFACE
DOMESTIC ANIMALS
TWO-WAY TRAFFIC ACROSS
MERGING TRAFFIC FROM THE RIGHT (MAy BE REVERSED)
laoo
WATER DEPTH GAUGE AT
IRISH CROSSING
Figure 6.2b

6.2.3 Informatory Signs
These are used to convey a message to motorists such as services
available, points of interest and other geographical or cultural
information and also to show route designations, destinations,
directions or distances •
. Figure 6.2a shows some of the informatory signs. The size of the
signs showing rou te designations. destinations, etc. f depends on the
contents and the size of the lettering. For the wording it is
recommended to include names and numerals in both Arabic and
English. For the Arabic wording, it is recommended to use the
'Naskh' style rather than the 'AnguJar'. For the English letters and
numerals, it is recommended to use the British Transport Medium
Alphabet complying with the 1968 Geneva Convention on Road Signs
and Signals.
It is proposed that the 'Aleph' height of the 'Naskht script sha]] be
equal to the English letter height (e.g .• capital letter height).
Details of these letters, together with signface spacing arrangements
for legends, symbols and borders. etc .• are shown on Figure 6.2c.
6.2.4 Siting. Orientation and Foundations
(a) Siting
The m:'1imum horizontal distance between the post of the sign and the
edge of the carriageway should be 0.6 m.
The minimum vertical distance between the bottom of the traffic sign
and the carriageway leveJ should be:
2.0 m in urban areas. However, where direction signs are
mounted on pedestrian guard rails or islands this distance may
be reduced to 0.9 m.
1.50 m in rural areas.
6 - 13 ID738/D

(b) Orientation
To reduce the effects of specular glare, signs should be set to an
angle of 93 0 away from the general alignment of the near-side edge of
the carriageway.
(c) Foundations
Figures 6. 2d to 6. 2f show recommended foundations details for single,
dual and multi-post traffic signs. For large signs it is recommended
to take into consideration the wind velocity and the safe bearing
pressure of the soil in order to obtain the sizes of the foundation and
the reinforcement details. The details of a standard kilometre post
are also shown on Figure 6.2g.
6.3 GUARD RAILS AND CRASH BARRIERS
~.\,
Guard rails are used where vehicles accidently leaving the road would ......
be subjected to hazard. They are largely used on sections of high
embankment, but their installation may be justified in the following
si tuations :
At roadside obstacles; non traversable hazards and fixed objects
close to the travelled way
At approaches to structures
At an isolated sharp curve on a road otherwise built to higher
standards
At locations subject to fog
At crossings of water courses
On narrow medians of dual carriageway roads.
The need to provide guard rails at embankment sections is governed
by the height of embankment and its side slope. Consideration
should be given to the instalJation of guard rails where the height of
the embankment is higher than 3 m and the side slopes are steeper
than 4: 1.
6 - 14 ID738/D
r (
I ; I I I t
1
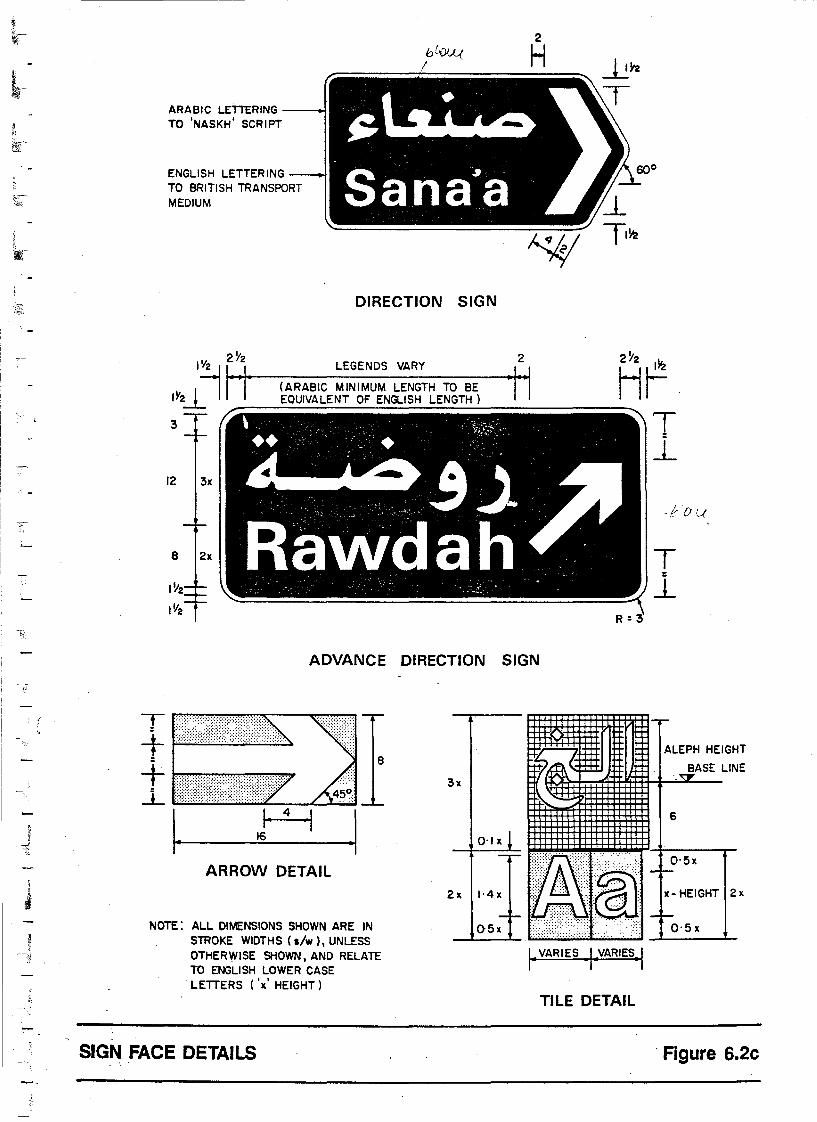
'. -
-
'--
-
ARABIC LETTERING --+I TO 'NASKH' SCRIPT
ENGLISH LETTERING TO BRITISH TRANSPORT MEDIUM
I Y22Y2
DIRECTION SIGN
LEGENDS VARY
IY2~ ~ 1-'1' (ARABIC MINIMUM LENGTH TO BE EQUIVALENT OF ENGLISH LENGTH)
3
12 3x
8 2x
1\12
1112
ADVANCE
T ['7'7:;77I77r~~\7'77:'1
+~~~~
+ trrIT:7:~~77 8
-L 1illJillJ21ill2lL----L~
1
I· 4 • 16 -I
ARROW DETAIL
NOTE: ALL DIMENSIONS SHOWN ARE IN STROKE WIDTHS (s/w), UNLESS OTHERWISE SHOWN, AND RELATE TO ENGLISH LOWER CASE
. LETTERS ('x' HEIGHT)
SIGN FACE DETAILS
DIRECTION
3x
2 HP t-I T ~
-!:Oct
T .L
R=3
SIGN
a m'-"'" ALEPH HEIGHT
.. ~ASE LINE
6
TILE DETAIL
. Figure 6.2c

..
0'1
0'1
., • en -C> Z
" 0 ~ r 0 0
~ 0 z > z c > en en m ~ m ~ c m
~ r en
:n co r:: CiJ en N 0.
. ' .. •
3·OOm. MIN. TO EDGE OF PAVEMENT*
l'Om >--MIN.
SHOOLDER
'90
·50
". ~-- 1Ij--~ -r'- , ~ r,-~
/',1",
'18 6mm.HARD ::T RUBBEIl:\ ·10 WASHER
.52 2Onvn.HARD RUBBER
.10 I WASHER ~
W-;;~
10mm.8OLTS AND NUTS. NUTS TACK WELDED TO BOLTS.
·45 '45 a.W W go:: 0::
W (I) <t <t ..J ZZ ..J III 0 <t <t <t III 0:: ii: C) 0:: => <t Z=> 0:: > o~--
·10
if;~f:'M;"}1;;kJ ,. :·t, " ~.
~'{'~~I f;';::'1 1·80 f:~:',:l'f:;"'I' ~;:r~Jf),~; t, ::,Wf.~.::) ~':J';:";;: '.10
.50
K>JI1
~ E f~ a.o ,0 ~N ..:..
POST -I
~~2;!-ij ':~;~1 :~~~:; ~~; ~r{. 3n;
,", . '0.'
SECTION A-A
IRON BARS
CLASS 210/25 CONCRETE
WARNING AND REGULATORY SIGNS
NOTES : I. ALL DIMENSIONS IN METRES UNLESS OTHERWISE SHCNlN. 2, * 0·50m. MIN. TO EDGE OF CURBED PAVEMENT 3, ALL STEEL POSTS HAVE 3" INTERNAL DIAMETER
~. ~ I -r-' ...,-...
\
w 'I I' B1 '-+18 I .15
!IiIIj:"""'''''', ~'i """f""""" 1 . . I
~ III <t
7nvn.HARD RUBBER WASHER
fimm.HARD RUBBER WASHER
'-.. IOrrm.BOLTS N4 ,/NUTS.MJTS TJV:,:
0= ~
r~15 W!5 I 3!5W W!5 ~:J
I, ~:
::>=> STEEL POST E ~
I 2~
~i I
/4W/5 JI
W .1
3Omm.HARD RUBBER -'I WASHER
jWEll£D 10 BOl
STEEL POST
,~11~!~! SECTION B-B
~~~-I4e DEFORMED BARS
~~~IOeIRON BARS
~~-CLASS 210/25 CONCRETE
INFORMATORY AND PLACE IDENTIFICATION SIGNS

3.0m. TO W/5 EDGE OF PAVEMENT'"
3" INTERNAL DIAMETER ----II STEEL POST
'3W/10
W
. 3W/1O
'18 :-·15 -
-'15
w/5 I
I W/5 W/5 _I ·70 I
I- W c .. -I
LARGE TRAFFIC SIGNS
NOTES: I. ALL DIMENSIONS IN METRES UNLESS OTHERWISE SHOWN. 2 .... 0·50m. MIN. TO EDGE OF ItURBED PAVEMENT 3.ALL STEEL POSTS HAVE 3' INTERNAL DIAMETER
SIGN POST LOCATION AND ASSEMBLY DETAILS
. 6 - 17
7mm. HARD RUBBER ---. WASHER.
15mm. HARD 10mm. BOLTS AND RUBBER~tt-r---t NUTS. NUTS TACK WASHER WELDED TO BOLTS.
'3Omm.HARD RUBBER -' WASHER
SECTION C-C
Figure 6.2e
[
(
I I

..... :::r z cd: cd: a:: co ::J ~ a:: - -o 10 N ·1
·80
T
1
D
1·00 MIN.
* a:: UJ 0 ...J ;:) 0 :J: (/l
u.
STEEL POST 0 ~ u cd: co
10 IS IRON BAR
CLASS 210/25 CONCRETE
DIRECTION SIGNS
NOTES I. ALL DIMENSIONS IN METRES UNLESS OTHERWISE SHOWN. 2. * 0·5m. TO EDGE OF CURBED PAVEMENT 3.ALL STEEL POSTS HAVE 3"INTERNAL DIAMETER
6mm.HARD RUBBER_ WASHER
SECTION 0-0
SIGN POST LOCATION AND ASSEMBLY DETAILS
6 - 18
10mm. BOLTS AND NUTS. NUTS TACK WELDED TO BOLTS
Figur:e 6.2f

I ~7 ~. ~
~, 't ~ ........
900 ,~ '( 675
~~ 1"""/ ~~A~
A
600
+-<0, ~<O FACE A
75 ::::l:-~
100 .'~ 5O:I
100 C· •
.,-/
- GREEN RER..ECTIVE PAINT ~ LETTERS AND FIGURES ON KILOMETRE POST ,
900 - WHITE REFLECTIVE
PAINT FOR BODY
~~ r 6 r
II I II J L L_JL_J I L _____ JJ ±fC
FRONT ELEVATION FACE B
16 OIA. MAIN ROAD
375
L GROUT 601A. LINKS @ 225 C-C
PLAN CROSS SECTION
STANDARD KILOMETRE POST
REFLECTIVE DISC ro(min)
to .:.: ... : .. :.:::::' 150 ... -1. . -'-T
350 t--2f; NOT TO EXCEED :350 I METRE ABOVE +- CARRIAGEWAY 225 SURFACE.
to 350 ..i.-. J
HAZARD MARKER NOTE: ALL DIMENSIONS ARE IN MILLIMETRES
75 T
; ,
. ',1
'1
I
1 j
I I '1
t
f
1
J ]
]
,:J
J I I J
DETAILS OF HAZARD MARKER AND KILOMETRE POST Figure 6.2g J 6 - 19
i'J

T
T
T
Guard rails are expensive and require continual maintenance, hence
they should not be indiscriminately used. Field inspection should be
carried out to assess the need of guard rails at the less obvious
locations by considering the following factors:
Heights of embankment and its side slope
Road width
Accident bJackspots
Visibility
Climatic con di tions
Speed and volume of traffic.
Guard rails are deSigned to resist impact by deflecting the vehicle so
that it continues to move at a reduced velocity along the guard rail.
Typical guard rail details are given on Figures 6. 3a and 6. Sb.
At escarpments. the use of reinforced concrete crash barriers is
recommended. Dimensions and details are given on Figure 6. 3c.
6.3d. 6.3e and 6.3f.
6.4 HAZARD MARKERS
Hazard markers can be used tc indicate the edge of the carriageway
on embankments. mountain roads and other points where special
dangers exist. Typical details of a hazard mRr 1q;r post are shown in
Figure 6. 2g.
6 - 20 ID738/D

0'1
IV
r-0 0 ~ -0 z 0 -n C> c » :n c :n ~ r-en
:!! to C -t CD
en .
EDGE OF PAVEMENT DIRECTION OF TRAFFIC ~
EDGE OF SHOULDER ~----~------------~~
[ , i t-=== I I 1 I It II it t t ttl 1.14 ,..-..--- i I I I I - I I
11.40 15.24 I LIMITS OF: 11.40 I.. SPACING OF POSTS I. 90 • .. SPACING OF POSTS 3.81 ol·CULVERT .. SPACING OF POSTS I. 90 •
APPROACH END NORMAL STRETCH HIGH FILL DEPARTURE END OR HAZARD
GUARD RAIL FOR BOX CULVERTS, HIGH FILL (>3m) OR HAZARD
DIRECTION OF TRAFFIC ~
0.30-, EDGE OF HARD SHOULDER
"l 1 1:
LAP IN DIRECTION OF TRAFFIC
EDGE OF PAVEMENT
I
10.1 PARABOLIC FLARE L: II. 40 NORMAL STRETCH GUARD RAIL FACE
ANCHOR END RAIL -' SPACING OF POSTS I. 90 SPACING OF POSTS 3.81
TYPICAL APPROACH END
DIRECTION OF TRAFFIC --. EDGE OF PAVEMENT DIRECTION OF TRAFFIC ......
POSfS~-O:95c/c OVER 11.40 LENGTH ADJACENT o CONCRETE BARRIER
r----EDGE OF PAVEMENT
GUARD RAIL FACE
1: 1.14~
I 11.40 I • APPROACH END 0
PACKER
CONCRETE PARAPET
GUARD RAIL AT BRIDGE APPROACH
EDGE OF HARD SHOULDER
x
NORMAL STRETCH SPACING OF POSTS
3.81
1: r 1: r
POSTS AT 1.90 clc FOR 11.40
TYPICAL DEPARTURE END
ANCHOR EN RAIL WITHOI FLARE
w 0) NOTE ALL DIMENS'ONS ARE IN METr""
-- '~i'<~
~ .... "'- - _ .. .....

TOLERANCE
..... ___ ~V.;::.E~RG;:.:E=-___ ~ ___ , __ "\_'-"~ :-_C'.:,;.,:_R~~_
1.00
N ,.. o
Z :e 2
10 ,.., o
'(
I
" • .. " ~ !t "
,.-___ BLOCK. WOOD OR SAME AS POST SECTION
0,30 MIN, FOR NORMAL STRETCH
151.44 TO 0,30 FOR APPROACH END 12 GAUGE x 3. BI ARMCO FLEX
~-mr--c,rL SEAM OR APPROVED EQUAL
~, ": !.:
" . ':.,:
~.
(THICKNESS 2,74mm)
10 It)
o
ARMCO POST UNP 120 OR APPROVED EQUAL
POST HOLES TO BE BACKFILLED LEAN CONCRETE OR COMPACTED >95% ~RY DENSITY
TYPICAL POST DETAIL
ANCHOR POST~
f
WITH TO
(ALL LAPS IN THE DIRECTION OF TRAFFIC)
TYPICAL END RAIL ANCHORAGE FOR APPROACH AND DEPARTURE ENDS
'\ FO
.027
0.70
l I
~r::.;~ ~~.-]~ o
I~ 0.084 r 0.002
(USED ON L Y WHERE TAMPING IS OMITTED)
SECTION THROUGH W - BEAM W - BEAM TERMINAL SECTION
NOTE - ALL DIMENSIONS ARE IN METRES
DETAILS OF GUARD RAIL Figure 6.3b
6 - 22

REMOVABLE LIFTING DEVICE
WELDED ANCHOR ----_
INSERTS FOR CABLE SUPPORTS IN BARRIER WALL
BARRIER CONCRETE CLASS 270/20
REINF BARS 12 mm 0 AT 300mm CIC BOTH WAYS AT 40 mm COVER (MIN I
PREFORMED 60 mm 0 SLOT TO BE PRESSURE GROUTED AFTER PLACEMENT OF BARRIER ( NOT REQUIRED IF BARRIER IS CAST
850
IN SITU )-------------~-_1
DOWEL BARS 30 mm 0 450mm ---_+_. LONG AT I· 25 CIC PRESET IN BASE CONCRETE
O' 100 X 0·300 DRAINAGE SLOT _____ "
AS REOUIRED ALONG CENTRAL MEDIAN. AT 5· OOm .SPACING
CONST JT (LEVEl)---------~
180
20 mm CHAMFER
BASE CONCRETE CLASS 210/50 ---- ~ ....... .,.;.:,;.:,...;..:.;;.;~::..;.;;;..:;:;:f_"_'~p;.:.".,~ WITH SQUARE MESH FABRIC A252 ( 200 " TO BS 4483 BOTH WAYS. ~ 150
TOP AND BOTTOM
NOTE ALL DIMENSIONS ARE IN MILLIMETRES
DETAIL OF CRASH BARRIER
6 - 23
[
I
, ;, "
j I.
I ! f 4'
.. i
I I .1
1 I I
Figure 6.3c J .J .., $i ~

5x 2.5 PH'!:'I c:: : ,., 0';
L r 0.48r 1t:=::J::====::J::====:::C====:=C====:::C====::::J
j
5x2.5 PANELS: 12.5 1 TOP OF BARRI~ 0 •
~ _ FINISHED GROUND LINE
r--lt==:IC===:::JC=====:J~:/===~======~======~ 0.85-*-1 F i ~ I b ~ A =to.05
ELEVATION
SINGLE FACE BARRIER TERMINATION DETAIL
-
I-51t 2.5 PANELS: 12.5 .\
0.71.ct PLAN
TOP OF BARRIER:. !" 51t2.5 PANELS: 12.5
11.0005 FINISHED GROUND .LINE
0.8~t I I I /' .:::::::: I i
F E 0 C B A +
ELEVATION
DOUBLE FACE BARRIER TERMINATION DETAIL
----F ~ __ ---F
"';""---E ---E
----0 ---0
----c --c
---B
t=:==:::::j' -A f--------=!- A
END VIEW END VIEW
SINGLE FACE BARRIER DOUBLE FACE BARRIER
":)TE ALL DIMENSIONS ARE IN METRES
TYPICAL DETAILS OF CRASH BARRIERS Figure 6.3d
6 - 24

t.
......
I
0\1
N VI
r 0 0 ~ -0 Z
~ 0 :u » en ::J: m » :IJ ::0 -m :u en
,.. _. Ul C ... CD CJ)
W CD
....... '--i
EMBANKMENT WIDENED
10 ACCOMMODATE B~~~~~_ -----
SIDEWALK
CURB LINE CARRIAGEWAY
rn 0.85
EMBANKMENT SLOPE
- - ~ .-..
VARIES
fULL HEIGHT BARRIER
rA ....... ~-:r;.-.:' •• .:.
L!
miDGE
PA PET
i ...
PLAN
~
VARIES
FULL HEIGHT BARRIER
EMBANKMENT WIDENED
£_~~~CCOMMODATE BARRIER
;:·:-?~!;R?;:;:·,·i! .. :···,.· 'fllOnpzm -----SIDEWALK
CURB LINE
CARRIAGEWAY
(AT BRIDGE APPROACHES WITH SIDEWALK)
SINGLE FACE CONCRETE BARRIER
BEHIND SIDEWALK
SECTION A - A
'...-' ..... --- - - - --
LEGEND
I;.;.;.; .....•. ) FULL HEIGHT, SINGLE FACE CONCRETE BARRIER .,. (FOR DETAILS SEE FIGURE 6.3d)
Vll.llllJ BARRIER TERMINATION SECTION (FOR DETAILS SEE FIGURE 6.3d)
t=::::I TRANSITION SECTION FROM BRIDGE PARAPET
IHlIHfJll SIDEWALK rn BRIDGE
.... DIRECTION OF TRAFFIC FLOW
NOTE-ALL DIMENSIONS ARE N METRES
.... )4',
~ .. ".~;~ ..- .. ~,."",*, ..
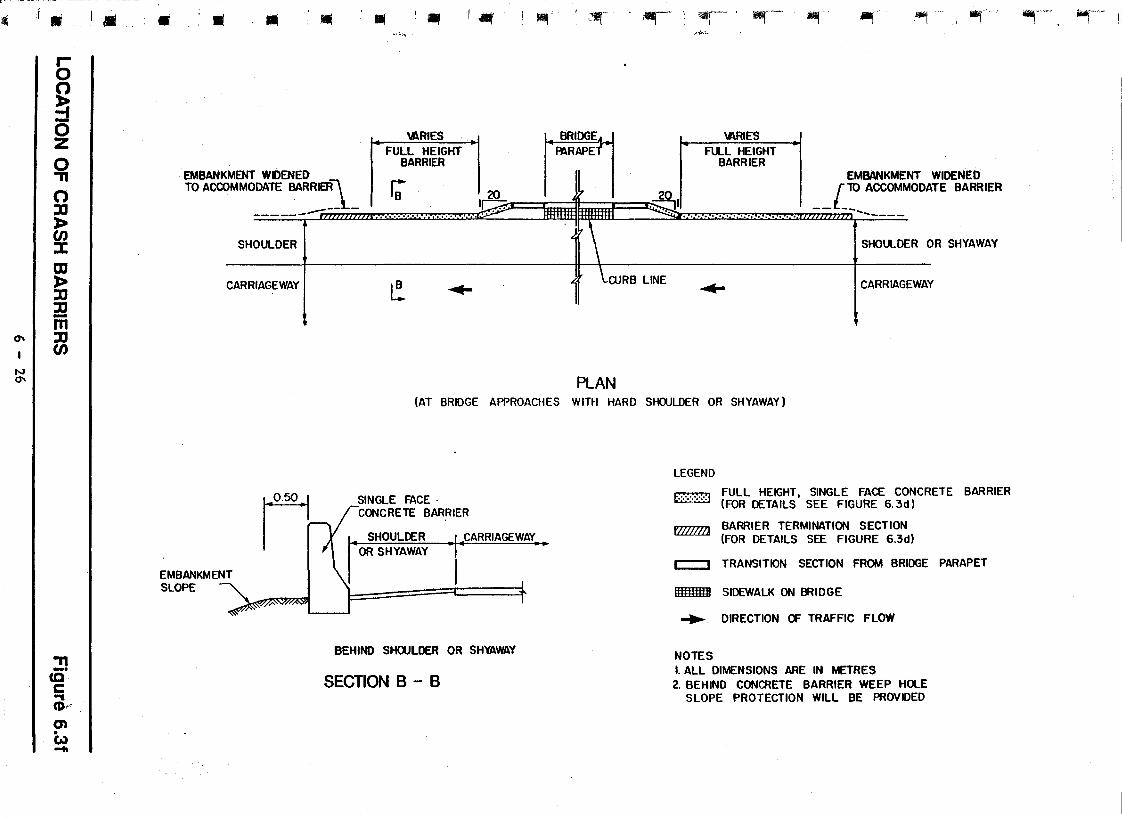
•
"'. . I N
'"
'a
r-0
R ~ -0 z 0 ."
0 :0 » en ::t OJ » :0 :0 -m :u en
." _. ca c ... CD,"" 0)
W -
I. • !. • ..
EMBANKMENT WDENED TO ACCOMMODATE BARRI~l
-- -----=
SHOULDER
CARRIAGEWAY
.. .. ~'.'I.; ...
\ARIES FUll HEIGHT
BARRIER
r;
I.
20 I~
l! ~
1I1Iil\" '.:9f . ~.' '; -r~~" -r- MI"
r71RIDGE
~RAPE
t ~, .~IJ ". • '\ • ''CruRB LINE
PLAN
,",~ .... ~
\ARIES FUll HEIGHT
BARRIER
.........
~
~' *'I, -r
EMBANKMENT WIDENED L 10 ACCOMMODATE BARRIER
... _-SHOULDER OR SHYAWAY
CARRIAGEWt! ~
(AT BRIDGE APPROACHES WITH HARD SHOOLDER OR SHYAWAY)
EMBANKMENT SLOPE
ri SINGLE FACE . 'CONCRETE BARRIER
BEHIND SHWlDER OR SHYAWAY
SECTION B - B
LEGEND
rnm FULL HEIGHT. SINGLE FACE CONCRETE BARRIER ".:". (FOR DETAILS SEE FIGURE 6.3d)
t7lZ1lllJ BARRIER TERMINATION SECTION (FOR DETAILS SEE FIGURE 6.3d)
c::::=:J TRANSITION SECTION FROM BRIDGE PARAPET
IIIIIIIIIII SIDEWALK ON BRIDGE
.... DIRECTION CF TRAFFIC FLOW
NOTES I. ALL DIMENSIONS ARE IN METRES 2. BEHIND CONCRETE BARRIER WEEP HOLE
SLOPE PROTECTION WILL BE PROVIDED
~""'.. -r"~,'

r: !
r I
( I I.-
,. t . . ~'"
I.·.· L..l '.
t·
, ";//:.~.--'.:
.. :. __ .~;: '- .'. ::';:'''<t''-~.~~\ ",: _:-~;~.~~: .... ~~~:-': .",~,,,~:'- '.
" ..
•. ...1.-
. '" .
. •... ~ ..
', ... ~ •• F
SECTION;:'f'7 Structures-:~- .-
,:.'
:':' .
. .. .,- ...
i"
"
~ "'-. - .. ·:'5Si'f .. '.~.~~(~~(:> - ., ..
·1
I
J
·1
J
1
SECTION 7: STRUCTURES
7.1 INTRODUCTION
In any highway project the need to cross wadis, valleys and other
obstacles often arises. Apart from major tunnels, such crossings
represent critical points of the highway both during and after
execution of the project. For this reason, it is important to consider
all aspects of bridge design, construction and maintenance. Some of
the more important features of bridge design and construction are
described here. Such a description can, however, be only brief
since each aspect Is a field of speciality in itself.
It must be noted that like other disciplines of applied science, the
technique of bridge design and construction evolves continuously and
must be reviewed periodically to account for changing circumstances,
adapt to new techniques of analysis and adopt new materials,
equipment and plant.
7.2 CONCEPT
Conceptual design forms the most important phase of the design. It
requires an appreciation of every facet of bridge design, construction
and maintenance.
The assessment of materials and labour available locally, including the
degree to wrich the transfer of constructional technology is
practicable are also called for. The overall economy of the
structures, the amount of problems encountered during construction,
durability and aesthetic quality and th~ degree of maintenance
subsequently necessary are all directly or indirectly attributable to
the conceptual design. It is therefore, imperative that conceptual
designs of bridges be carried out by persons of great experience and
vision with established stature in their profession.
7.3 LOADING
Bridge loadings adopted by the industrialised countries are invariably
linked to statutes and enforceable by law, which restrict the gross
7 - 1 ID738/F

and axle weights of commercial vehicles including their speeds. widths
and laden heights t and in some cases, the lanes to which they must
adhere to. Where such laws either do not exist. or if they exist
where there is no mechanism of enforcing them. the loading to be
used for bridge design must be viewed with caution. This must of
course be balanced by the need to design and build economic
structures by not being over conservative.
The AASHTO loading specifications provide a good basis because not
only are they widely recognised. but also they are used in most
countries of the Middle East in various derivative forms. One such
derivative is the bridge loading currently used in the Kingdom of
Saudi Arabia, shown on Figure 7.1. In view of the close
geographical and commercial link with Saudi Arabia. it is proposed
that the loading shown on Figure 7.1 be adopted for the design of
highway bridges in the Yemen Arab Republic.
The loads are to be applied in accordance with AASHTO specifications
and the design of structural components should accord with AASHTO •.
Environmental factors such as wi~d speed, duration and intensity of
rainfall, temperature variation and siesmicity of the region will have
to be determined from existing records where such records exist.
Where records are not available, field measurements will have to be
made. When such data are available, it should be possible to
formulate design parameters in the manner given by AASHTO or other
internationally recognised standards.
7.4 BRIDGE LOCATION
It is important to integrate bridge design with the design of highway
alignment and profUe. The two processes are interactive and any
attempt to divorce the two operations will result in badly located
structures which are difficult to build and costly to maintain.
of the basic rules are:
Some
Not to locate a bridge on a sag curve. Impact forces are
greater and there is the danger of waterlogging which can cause
corrosion of reinforcing and prestressing steels.
7 - 2 ID738/F
r [
I

T-
z *~I ~l ,I/t g Illi. 4·30 :1- Variable :1 (4-30m_ to g{)Om.)
~llE! Cf) ~ u ::> a:
~ 4~kN ' _____ J l~kN ~ --~ -§~B ~ T ~
I g I ~ .:.. ~~ ~ .,3= -' ~~ - ~
40kN -----~ 13tkNf ~-00
~..J .... (3 .-
V= Variable spacing (4'30m_ to g-OOm) inclusive. Spacing to be used is that which produces maltimum stresses.
* In the design of orthotropic steel decks (excluding transverse beans) one oxle load of
(19-88 Tons) or two altll loads of 130kN (13'26 Tons) each ,spaced I-20M. apart may be used whichever produces the greater stresses ** For the slab design the centre line of wheels shall be assumed 30cm. from the face of the curb.
All dimensions are in metres.
(a) STANDARD TRUCK LOADING
1150 kN (15·30 Tons) FOR MOMENT
J--- CONCENTRATED LOAD 220 kN (22-43 Tons) FOR SHEAR
UNIFORM LOAD 20 kN PER LINEAR METRE (2·04 Tons)
OF LOAD LANE
(b) STANDARD LANE LOADING
PROPO:::::> BRIDGE LOADING
7 - 3
-
tp I-0 --z
~
0 0 0
2 U)
0 a:
U) <t 6 0
Z <t I-Cf)
Figure 7.1

-= I
Not to locate a bridge on a tight curve. Horizontal forces are
greater and it is easy for incompetent designers to overlook the
effect of curvature. The bridge is also difficult to build.
A void changes of crossfall along the bridge in order to avert
complex construction and unsightly appearance. Where varying
crossfall is unavoidable, then the superelevation application
should be as long as practicable and uniformly applied from one
end of the bridge to the other in order to give a pleasing effect
of carriageway edges and paraphet profiles.
Not to introduce concurrent high horizontal and vertical curves
within the bridge length. It is not only difficult to build but
also visually unattractive.
Bridge design must also interface with the design of services, ducts
and other facilities that have to be carried on the bridge. Some
forms of deck construction will not accommodate even the smallest of
ducts while others are ideal for services.
7.5 BRIDGE SUPERSTRUCTURES
The most common forms of bridge deck using reinforced or
prestressed concrete are shown on Figures 7.2a to 7.2e. Bridge
decks using steel, either in the form of plate girders or box sections
have not been included principally for economic reasons. At present,
because all structural steel will have to be imported into the Y AR,
steel bridges are not economically viable. Technically, steel bridges
are more susceptible to fatigue failure than concrete and thus require
a high degree of. skill, quality control and testing during
manufacture. Finally, steel bridges require a stricter regime of
maintenance than' concrete ·bridges.
In general, beam-and-slab type of bridge decks are more sensitive to
axle loads than the slab or box-girder types and are therefore more
prone to damage if subjected to over-loaded trucks. Again in
7 - 4 ID738/F
r I

SIDEWALK
I
I. L
OVERALL WIDTH
WIDTH (CURB TO CURBI
L
.-THICKNESS OF TOP SLAB
t
L .\. o
L .1 PRECAST BEAMS WITH CONTINUOUS R8NFORCED CONCRETE SLAB
(a) TYPE 1
r SIDEWALl
I I-
OVERALL WIDTH
WIDTH (CURB TO. CURB)
THICKNESS OF TOP SLAB
L L L
., ·rEWAL!'1
-I PRE:.~.:T BEAMS WITH INTERMEDIATE R8NFORCED TOP SLAB
(b) TYPE 2
r SIDEWALK
I- -I-
I
~ L
OVERALL WIDTH
WIDTH (CURB TO CURB)
I
.\.
DEPTH OF CONSTRUCTION
L
SIDEWALK
, -I
L
PRECAST BEAMS WITH CONTINUOUS R8NFORCED CONCRETE SLAB
(c) TYPE 3
BRIDGE DECK TYPES Figure 7.2a
7 - 5

OVERALL WIDTH
WIDTH (CURB TO CURB)
I
L L
I
.1. L
RECTANGULAR PRECAST BEAMS WITH CONTINUOUS R8NFORCED CONCRETE SLAB
(d) TYPE 4
I
I· L
OVERALL WIDTH
WIDTH (CURB TO CURB)
-I.
DEPTH OF CONSTUCTION
L -I. IN-SITU BEAM AND SLAB DECK
(e) . TYPE 5
L .1
OVERALL WIDTH I r -SIOEWALK WIDTH (CURB TO CURB) SIDEWALK r -\' -\' -\
~~;.~I t-----~L.. _________________ ....J~---- j
BRIDGE DECK TYPES
IN-SITU SaJOSLAB DECK
(f) TYPE 6
7 - 6
Figure 7.2b
(
(
I I l 1
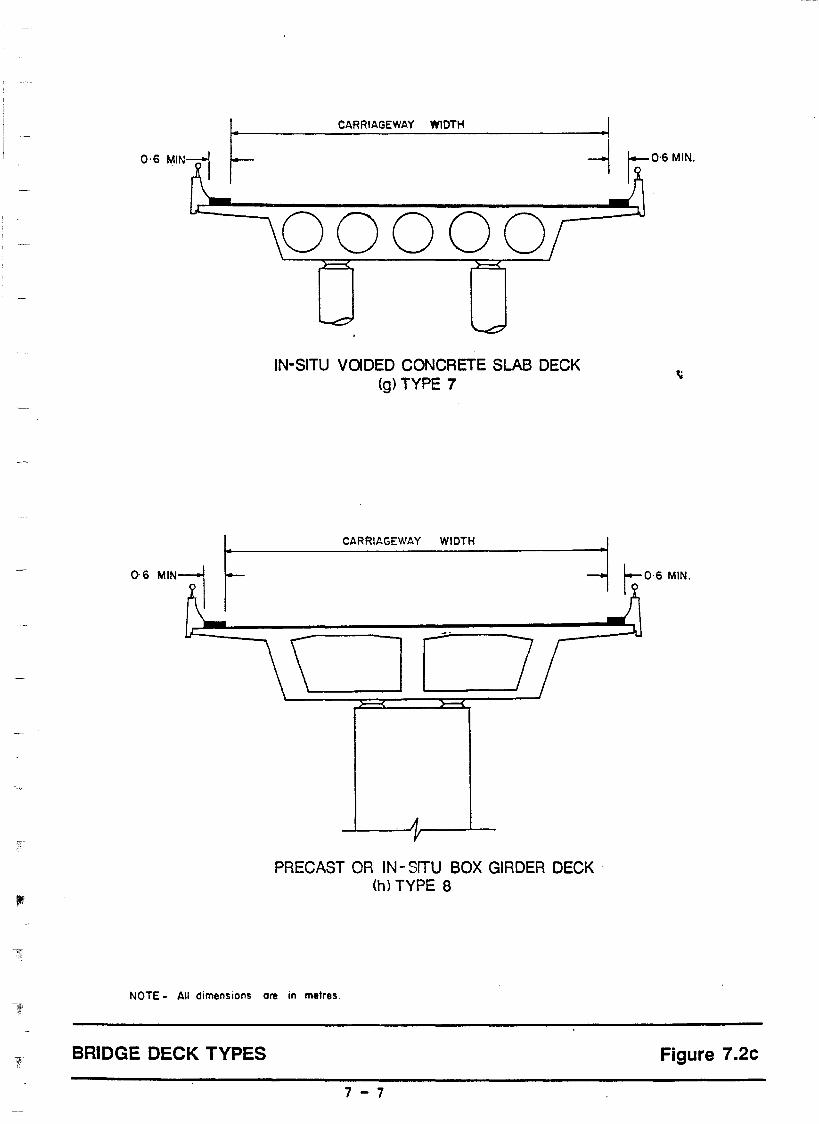
06 MINlI ~
06 MIN~ ~
CARRIAGEWAY WIDTH
IN-SITU VOOEO CONCRETE SLAB DECK (g) TYPE 7
CARRIAGEWAY WIDTH
00
.1 --l li°'; MIN.
PRECAST OR IN - SITU BOX GIRDER DECK . (h) TYPE 8
NOTE - All dimensions ore in metres.
BRIDGE DECK TYPES Figure 7.2c
7 - 7

:I: (.) a:: ~
I ~-{
--' -z ~ CI)
1L 0
:I: I-(!) z ILl -'
,... ...... -'
,... ...... -'
,... ...... -'
BRIDGE DECK TYPES
,.------.. I I I I ~ I
~::::::l...- - - -~ I ~ ----7 .... ;>-'-...1
I I /
/
\ \
\ \ ....... -, b:===;i----==-:.........> I
'" I (' I : I L... ____ ....l
7 - 8
W (!)m Ow -a.. 0:>-CDf-J: u:= 0:-«
Figure 7.2d
[
I
}
)
t
J
I I I 1 ,

~ ..J
:J
z
u-~ en
u.. 0
I :I: l-t!) I z ILl ..J
~ ..J
BRIDGE DECK TYPES
r. I
- i i II II ...
7 - 9
~ ~ a. Wo o~ ~W c..:>a. W>-o~ W ....J ::.. ro-ex: c: ex: >
Figure 7.2e

,
general, prestressing bridge decks produce more durable structures
because of the possibility of eliminating cracks in~uced by high
tensile strain in the concrete.
7.6 BRIDGE SUBSTRUCTURES
Typical bridge piers and bridge abutments are shown on
Figures 7. 3a, 7. 3b and 7.4. Except for major bridges of a certain
type whose piers are often of steel construction, bridge piers and
abutments are today built exclusively in concrete. Depending on the
subsoil conditions at the bridge site, piers and abutments may be
supported on piles or pad footings. Where the salt content of the
soil surrounding the substructure is high, sulphate resisting cement
with or without additional protective membrane may have to be used.
As a guide, Table 49 of the British Standard Code of Practice CP 110
is recommended.
7.7 BRIDGE AR TI CULA TION
It is important to allow bridge decks to undergo dimensional changes
with the rise and fall of air temperature. Otherwise stresses are
built up and local damage results. To facilitate such movements,
bearings are provided to allow the deck not only to expand and
contract freely, but also to deflect and rotate on the supports when
transversed by vehicles.
For small span bridg'1s, the most common type of bearings used today
is the elastomeric type. Though simple and convenient, great care is
necessary in their design, quality control and installation. From
experience, the following is recommended in respect of elastomeric
bearings:
Design to BS 5400: Part 9.
Carry out materials test to BS 5400: Part 9 except for a ozone
resistance test which should be performed in accordance with
ASTM D1149.
Carry out vertical load test to 1.5 times rated load in accordance
with BS 5400: Part 9.
7 - 10 ID738/F
I I 1
"\
1 ..
I j
1
1 ]
, I
J
J
J I I J J 1

MAX. PIER HT.
PIER BASE
MAX. PIER HT.
PIER BASE
<t BRIDGE I I
LENGTH 0 PIER WIDTH OF
WALL
NATURAL GROUND LEVEL
WALL TYPE PIER
(a) TYPE 1
~ BRIDGE I
LENGTH OF'CROSSHEAD WIDTH OF CROSSHEAD
] MAX. DEPTH
~ ____ ~ ___ .,....:::=--_ _ OF CROSSHEAD
ENGTH
I
OF I SUPPORTIN PIER
I
WIDTH OF SUPPORTING PIER
NATURAL GROUND LEVEL
WALL TYPE PIER VV1TH CROSSHEAD
(b) TYPE 2
BRIDGE PIER TYPES
7 - 11
<t PIER i I I
Figure 7.3a

-
-
-
---
EQUAL COLUM SPACING
--. N I
x. MA PIE RHT.
..
~
---PIER B ASE
MAX. PIER HT.
PIER BASE
L
It. BRIDGE
LENGTH OF!CROSSHEAD
I L , L .J .
I
L
•
I:
WIDTH OF CROSSHEAD
--. MAX. DEPTH --L OF CROSSHEAD
CDWM NS
I
ATURAL GROUND LEVEl. ;
MUL TJPLE COLUMNS AND CROSSHEAD
(c) TYPE 3
LENGTH
ct BRIDGE
OFlcROSSHEAD
'MAX. DEPTH -1.. OF CROSSHEAD
NATURAL GROUND LEVEL
TWO COLUMNS VVlTH BALANCED CROSSHEAD
(d) TYPE 4
BRIDGE PIER TYPES
7 - 12
t PIER I
I WIDTH OF CROSSHEAD
I I I I I I I
.'1 I I I
-I
.1
1 I I I I I
Figure 7e3bl
I
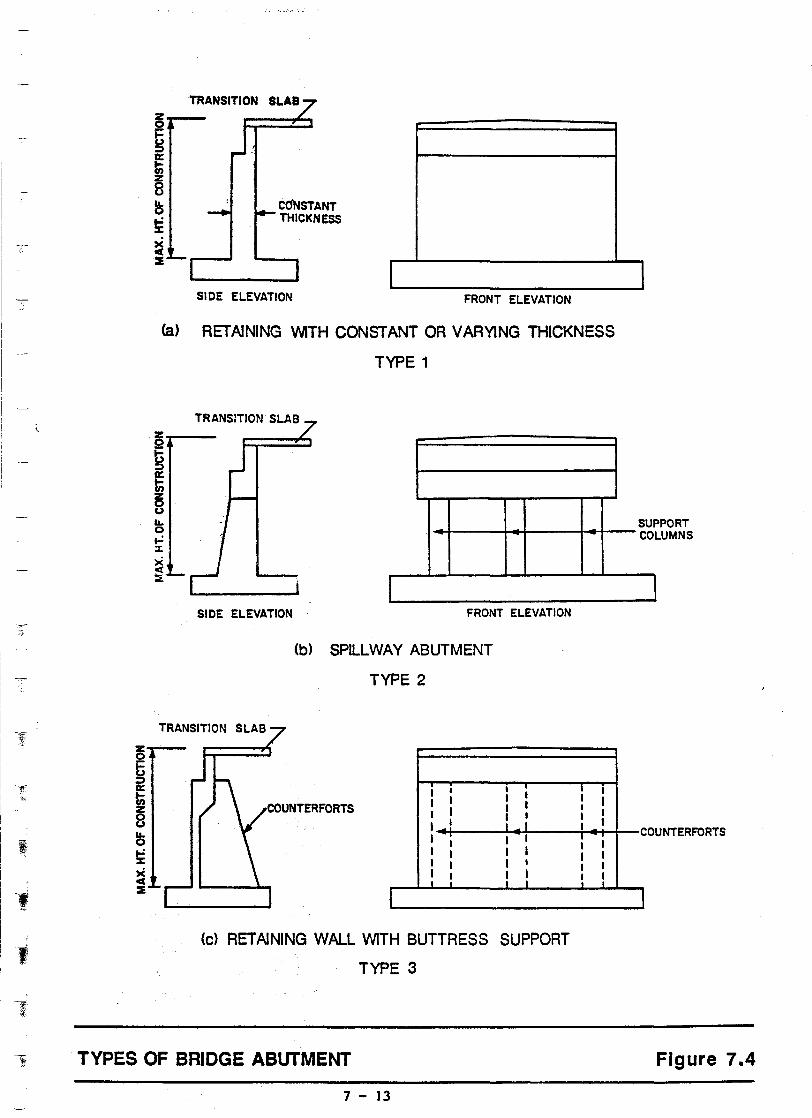
1
I SIDE ELEVATION FRONT ELEVATION
(a) RETAINING WITH CONSTANT OR VARYING THICKNESS
TYPE 1
TRANSITION SLAB
I SIDE ELEVATION FRONT ELEVATION
TRANSITION SLAB
(b) SPILLWAY ABUTMENT
TYPE 2
I I
I I I I
I I
I I I I I I I I I
I
, • I I I
1 I 1
I I I I I
, 1 1
(e) RETAINING WALL WITH BUTTRESS SUPPORT
TYPE 3
TYPES OF BRIDGE ABUTMENT
7 - 13
: I I , I I
I I
i I I I I I
1 1
I
SU PPORT LUMNS CO
J
COUNTERFORTS
I
Figure 7.4
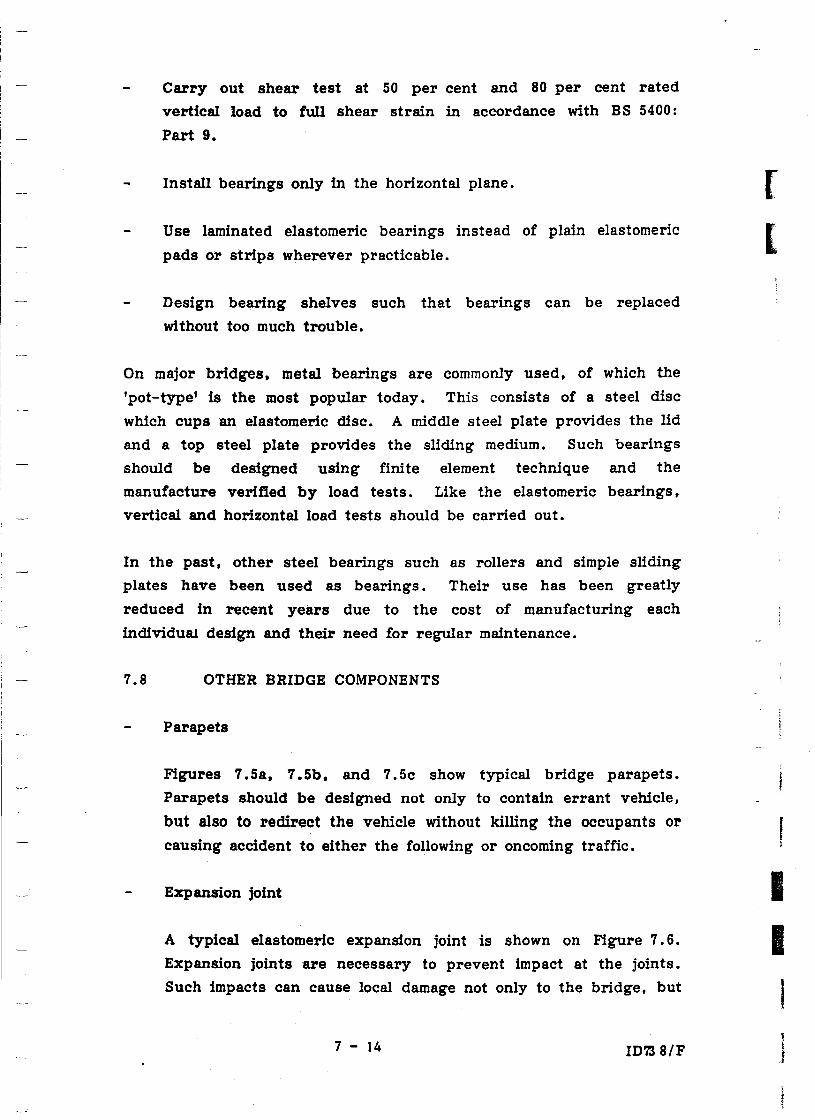
Carry out shear test at 50 per cent and 80 per cent rated
vertical load to full shear strain in accordance with BS 5400:
Part 9.
Install bearings only in the horizontal plane.
Use laminated elastomeric bearings instead of plain elastomeric
pads or strips wherever practicable.
Design bearing shelves such that bearings can be replaced
without too much trouble.
On major bridges, metal bearings are commonly used, of which the
'pot-type' is the most popular today. This consists of a steel disc
which cups an elastomeric disc. A middle steel plate provides the lid
and a top steel plate provides the sliding medium. Such bearings
should be designed using finite element technique and the
manufacture verified by load tests. Like the elastomeric bearings.
vertical and horizontal load tests should be carried out.
In the past, other steel bearings such as rollers and simple sliding
plates have been used as bearings. Their use has been greatly
reduced in recent years due to the cost of manufacturing each
individuaJ. design and their need for regular maintenance.
7.8 OTHER BRIDGE COMPONENTS
Parapets
Figures 7.5a, 7.5b, and 7.5c show typical bridge parapets.
Parapets should be designed not only to contain errant vehicle,
but also to redirect the vehicle without killing the occupants or
causing accident to either the following or oncoming traffic.
Expansion joint
A typical elastomeric expansion joint is shown on Figure 7.6.
Expansion joints are necessary to prevent impact at the joints.
Such impacts can cause local damage not only to the bridge, but
7 - 14 ID'i'J S/F
[
[
I I
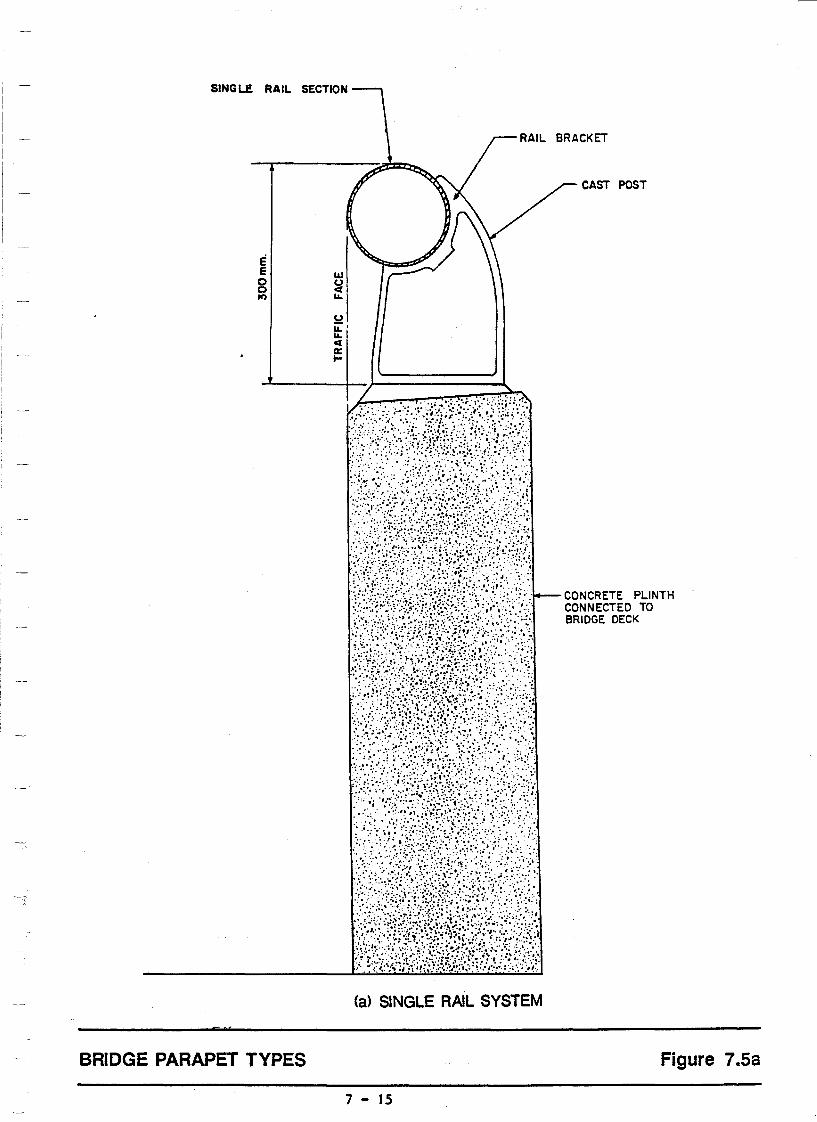
SINGLE RAIL SECTION
F
IE E o o If)
(a) SINGLE RAIL SYSTEM
BRACKET
CAST POST
CONCRETE PLINTH CONNECTED TO BRIDGE DECK
BRIDGE PARAPET TYPES Figure 7.Sa
7 - 15

E e o o ID
E E
8 ..,
BRIDGE PARAPET TYPES
POST--f---
(b) 2-RAIL SYSTEM
7 - 16
2 -RAIL
FRANGIBLE POST
t----CONCRETE PLINTH CONNECTED TO BRIDGE DECK
Figure 7.Sb
\ .'
~ t
i
; i;
~
(
I f g f
!
~-
i "
i j
I I
J I ]
J I I I
J I

FRANGIBLE POST --ii---I~ 3- RAIL
(c) 3 -RAIL SYSTEM
BRIDGE PARAPET TYPES
7 - 17
CONCRETE PLINTH CONNECTED TO BRIDGE DECK
Figure 7.Sc

(J)
~ 2 5 .., 2 ~ 0
~ 2
~ 5 ~ 2
~: 2 5 eX .., 0 uJ- 122 2 UJ UJ a.. ~ a.. ~ UJ UJ (.!) > 0 0 :z 0 (.!)
en :z 2 0 UJ 0 ~ UJ
0 m a: ~ a:
(J) 0 :E
> !:i
X 0
0 a.. m UJ
C) 2 X u:: uJ--
C) :z en ~
0 U 2 UJ
0 a: ~ a: 0 :E
> X 0 a.. w
SECTION THROUGH TYPICAL ELASTOMERIC EXPANSION JOINT
7 - 18
Figure 7.6
I I ]
J
]
]
]
]
J ;~
i I I I I I I

~;
~
• • I
• I
• I
•
'1.9
---------- ~--~---- ~~-~--
also the vehicle. An elastormeric type of expansion joint is
recommended in general because they are watertight and thus
prevent water and other liquids from reaching the bearing
shelves where corrosion and unsightly stains would otherwise be
caused.
Deck waterproofing
Waterproofing of the bridge deck i.. a worthwhile investment
because even the densest concrete and asphalt are not
watertight. Once moisture penetrates the deck, corrosion of
reinforcing and prestressing steels will inevitably take place.
Maintenance problems associated with steel corrosion in bridge
deck are very serious and any measure to minimise them should
be considered.
Deck surfacing
A layer of wearing course on the bridge deck is recommended.
It is difficult to cast deck concrete to the exact road profile and
the wearing course is useful in achieving the correct profile.
,The wearing course also reduces impact on the bridge and
provides a quieter and smoother surface than concrete.
WIDTH OF CARRIAGEWAY ON BRIDGES
The width of the carriageway over the bridge should not be less than
the width of the carriageway of the approach road.
Where sidewalks are not provided on bridges, a raised verge of
600 mm minimum width should be provided adjacent to parapets as
emergency walkways.
7 - 19 ID738/F
.~.

7.10 RETAINING WALLS
Typical types of refraining walls are shown in Figures 7. 7a and 7. 7b.
Gravity type walls which consist of mass concrete with or without
'plums' can be used where the ground slope is fairly gentle and the
height of retained fill not high. For higher retained fill heights, the
cantilever type of retaining walls, with or without counterforts, is
generally adopted. In steep escarpments, it may be possible to use
anchored walls if sound rock is encountered.
7.11 DRAINAGE CULVERTS
Typical structures for storm water drainage are shown in Figures
7 . Sa to Figure 7. Sm. Essentially, a drainage structure consists of
either a pipe or box culvert under the highway embankment with inlet
and outlet structures.
Reinforced concrete pipe and box culverts shall be designed in
accordance with 'AASHTO Specifications for Highway Bridges, Twelfth
Edition, 1977'. The design loading is that for a 600 KN-Truck (refer
to Figure 7.1 - Proposed Bridge Loadings).
The design of the culvert for any given opening size is governed by
the height of fill above the culvert and the nature of ground
conditions at the culvert location.
Where the iul height varies along the length of a culvert, the details
appropriate to the maximum fill ~eight encountered, shall be used for
the whole length of the culvert, provided that the difference in the
height of fill encountered does not exceed one metre: where this
difference in height exceeds one metre, the culvert must be designed
as a particular case, relating to the prevailing conditions. The
design criteria should also be investigated where the fill height
encountered is less than one half metre or greater than seven metres.
Culverts using tubular steel pipes or fabricated arch segments are
not envisaged for use in the YAR. At the present. time, concrete
culverts constructed in-situ are not only cheaper but are also
logistically more practicable in the more mountainous regions of the
country.
7 - 20 ID73S/F
[
I
I I I I ,I I I I I

TOP OF EXiSTInG CARRIAGEWAY FILL SLOPE ~"'----=:';~~:'::";';'';'';'';'''---et
CARRIAGEWAY CONSTRUCTION
PERMEABLE BACKING u.....---+-( POROUS BLOCKS)
GRANULAR FILL
MASS CONCRETE WITH PLUMS
MASS CONCRETE
(a)
TOP OF EX!ST1Nl FLL SLOPE
SOUND ROCK
GRAVITY RETAINING WALL
CARRIAGEWAY
WEEP PIPES
GROUTED RIPRAP
CARRIAGEWAY CONSTRUCTION
LJ.--I--- PERMEABLE BACKING (POROUS BLOC KS)
GRANULAR FILL
MASS CONCRETE
SOUND ROCK
CANTILEVER RETAINING WALL
GROUTED RIPRAP
(b) CANTILEVER RETAINING WALL
TYPES OF RETAINING WALL Figure 7.7a
7 - 21

TOP OF EXISTING CARRIAGEWAY ----*-------------------~ FILL SLOPE
~-t--PERMEABLE BACKING (POROUS BLOCKS)
GRANULAR FILL ANCHORED WALL
GROUTED RIPRAP
MASS CONCRETE
(c) ANCHORED RETAINING WALL
TYPES OF RETAINING WALL
7 - 22
Figure 7.7b
r (
I I

,"Il
.....
N VJ
• l! "tJ m o c !< m ~ c m ~ r-
." rE" t: ., (I)
...... en OJ
,. • • • .; .; ~ ',IW{ 'j ~. '
" \ .,-,
(LENGTH ALONG ~_ CULVERT) r "l l ", T "1 "I EMBANKMENT SLOPE
I~I 2
! LONGITUDINAL FAll
I I
I·--·~·--·I·
PRECAST A'" -" •• _ .. ..-- w __ ... - I "'lET I CHANHElIlEDWITH SEGMENT S SCOUR PROTECTION AS 1-·1 PIPE CULVERT • _ DETAIL. DIRECTED BY ENGINEER
(SIMILAR TO INLET)
SECTION A - A
Lo: LI'+2LI
(OVERALL CULVERT LENGTH)
. / SKEW I
ANGLF/ l-e-,'
EMBANKMENT TOE LINE
D J:L. 600 1400 750 1400 900 2000 1050 2000
~~ T I R.C.CONCRETE ~ ..-/RETAINING WALL
••••
Hf ,
NOTES: D : INTERNAL DIAMETER OF CULVERT
/ /
LI : LENGTH OF INLET AND OUTLET OF CULVERT H f: HEIGHT OF FILL
. £. CULVERT jA
R.C. CONCRETE CUT OFF WALL
SETTING OUT POINT
TYPICAL PIPE CULVERT - GENERAL ARRANGEMENT
." .
.. ' . "
o
TY~CALCROSSSEcnON
I

....
..., ~
JZ -a m o c !< m ~ c m ~ -Iii
..., {ij" c ... CD ~
en r:r
-
f d
.f-d
~ ~a
/(FOR UNIFORM SOIL
00 FOllNDATION)
~ t~
BEDDING DETAILS
"-(FOR ROCKS OR MIXED SOIL FOUNDATION)
NORMAL BACKFILL IN ACCORDANCE WITH GENERAL SPECIFICATION .
.., (SOOmin) , < < , ',r4:
L .Jo(..;,)" T{0"""" :,:"f:-UNDISTURBED EXCAVATION , Q , , , ,
~", ",' ... ~ " ,', " ' " , ,
I. 2110 ,I (mall.)
MAX. TRENCH WIDTH
,...
NOTES -
I. All dimensions are in miUimetres.
2. TRENCH WIDTH. The dimensions shownon this drow~ must be strictly adhered to. To avoid accidental slips, the trench should preferible be constructed using trench sheeting. the sheating being withdrawn p'!"ooressively as tha work advances, before the backfill is placed. Any soft area or local hard spot in the trench bottom Should be dug out and the bottom leval restorad with wen tamped granular material.
3. BEDDING.
a- Setected free draining, compactabte granular moteriat such as gravet or broken stona of approllimately IOmm. sile, wall tamped under and alongside the pipe.
b- Uniform compoctable material free from tr.. roofs, vegetable motter, clay lumps etc. well tamped by hand In 75 - 150mm. layar ••
c- Uniform compactable material as 'b' but lighlly tamped by hand.
4. LAYING a JOINTING •
During jointing, the pipe shall be supported on its point of balance just clear of the trench bottom. Aftar jointing, the pipe shall be lowered on to bed and the Ii fting sling removed. If is important that the oIpe is supported evenly along its whole length. Under no circumstance Should bricks or other pocking mat.rial be placed under the pipe to adjust its level.
DIRECTION OF FLOW 1
I
..... I
PIPE JOINT
PIPE CULVERTS - BEDDING AND JONTING DETAILS
- ...... JIIIlIIIIIIIIII
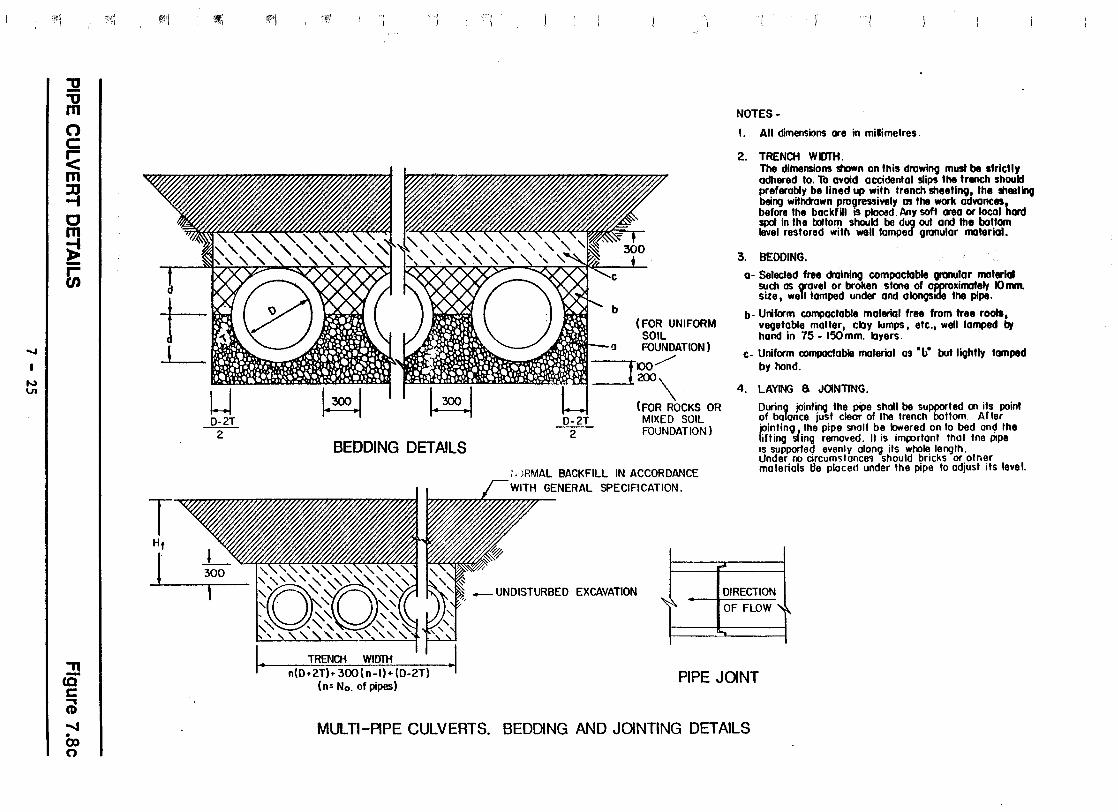
.....
N 1.11
"~)
:g ." m o c: !< m ~ c m ; ~
-n _. CQ c: a; ...... o
en o
'~~I ,~ ~H1 'M (
b (FOR UNIFORM
NOTES-
I. All dimensioM ore in milimetres.
2. TRENCH WIDTH. The ditnensioM shown on this drawing must be .frlctly adhered to. To avoid occidental slips the trlOCh should preferably be lined up with trench sheetino, the !heeting being withdrawn pra9ressively os the work aavances before the backfill IS placed. flIIy soft orad or Iocol hard ~ in Ihe tXlftom should be dug out and the bottom level restored with well tamped gronular material.
3. BEDDING.
0- Selecled free draining compactable gra,.,lor moterlal such os gravel or broken stone of approximately 1Onvn. size, well tamped under and alongside the pipe.
• SOIL
-,-_~~. !;;?,TOO) _l¥&:lIIJ::QL.;~:DCIDIU~~ ~~~.~_ \
b- Uniform compactable malerial free from tree rooll. vegetable molter, cby lumps. etc., well tamped br hand in 75 - l50mm. byers.
c- Uniform compoctable moterial as "bO but lightly tamped
by hondo
4. LAYING 6 JOINTING.
T Hf
1"
U D-2T
-2-
300
BEDDING DETAilS
I I I I • TRENCH WIDlli ~(D.2T). 3OO(n-I)+(D-2T) •
(n= No. of pipes)
(FOR ROCKS OR MIXED SOIL
2 FOUNDATION)
i.' )RMAL BACKFILL IN ACCORDANCE WITH GENERAL SPECIFICATION.
During jointing the p~ shall be supported (Jl its point of balance just clear of lhe Irench botlom. After jointing, the pipe snail be lowered on to bed on~ Ihe lift ing 51 Ing removed. It is imporlanl tnat tne PIpe is supported evenly along ils whole lenglh. LInder ro circumc;toncl!') should bricks or otner materials tle placed under the pipe to adjust its level.
.. _ UNDISTURBED EXCAVATION DIRECTION
~~ OF FLOW'"
...
PIPE JOINT
MULTI-PIPE CULVERTS. BEDDING AND JOINTING DETAILS
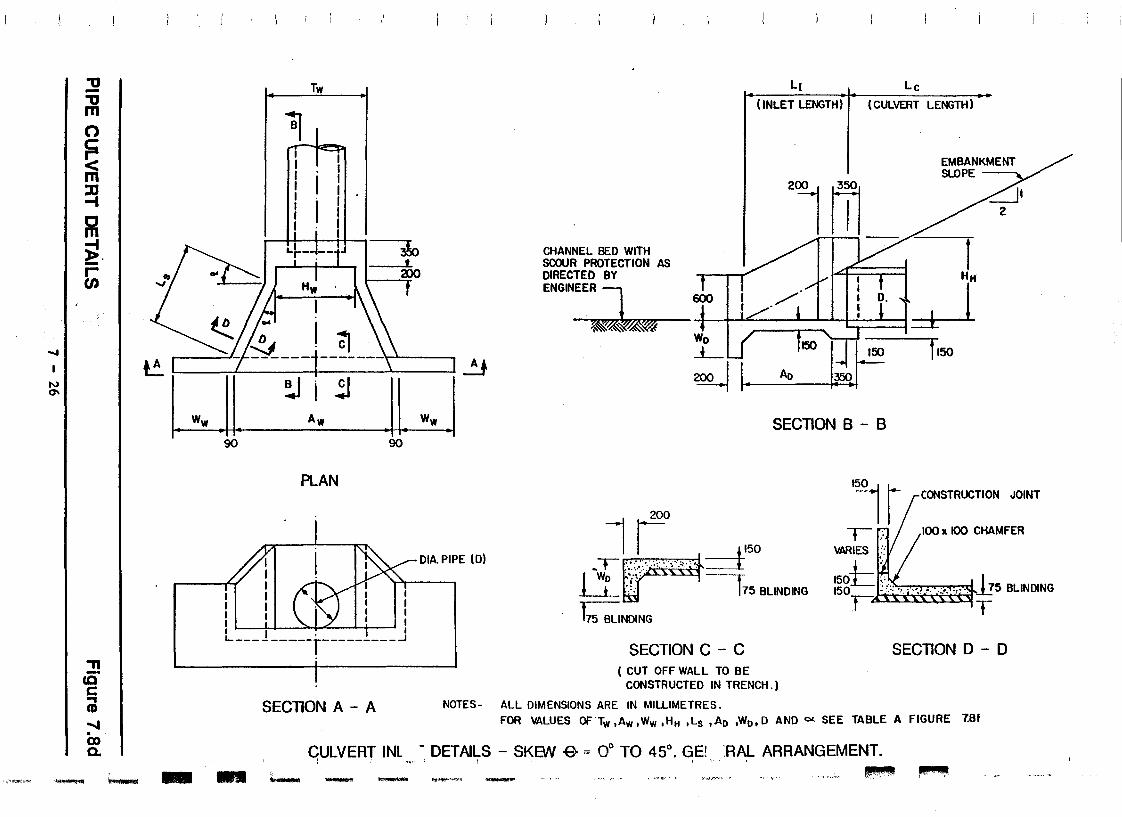
'-I
N 0\
-0 --0 m o ~ m ~ ~ ~. -r en
:!! co c ., CD -... ex, a.
Tw
11
3&>
PLAN
SECTION A - A
DIA. PIPE (0)
CHANNEL BED WITH SCOUR PROTECTION AS DIRECTED BY ENGINEER I ~
Ll Lc (INLET LENGTH) (CULVERT LENGTH)
kr. . IJ _I' i" ±- i.::::·/j III! '·1=:±--l
1150 -L-
200 .1
SECTION B - B
1 (0 150 ,r,:
·WO ~:::~:.::'" • .. . tF·· .. ;·:-.. ·····~··· ==f ~ ';~.: 175 BLINDING :~. .. ..... :!.~::3l.?5 BLINDING
f75 BLINDING
SECTION C - C ( CUT OFF WALL TO BE
CONSTRUCTED IN TRENCH.)
T
SECTION D - D
NOTES- ALL DIMENSIONS ARE IN MILLIMETRES.
FOR VALUES Of"Tw ,Aw ,Ww ,HH ,Ls ,AD ,Wo,D ANO c>< SEE TABLE A FIGURE 7.BI
CULVERT INl - DETAILS - SKEW e- = 0° TO 45°, GEl 'HAL ARRANGEMENT. ! I .... ,'" I j ' ;', t
.",_ ... , ,- ""'- - - - - ~ ~~~~~"II ~ """" ~
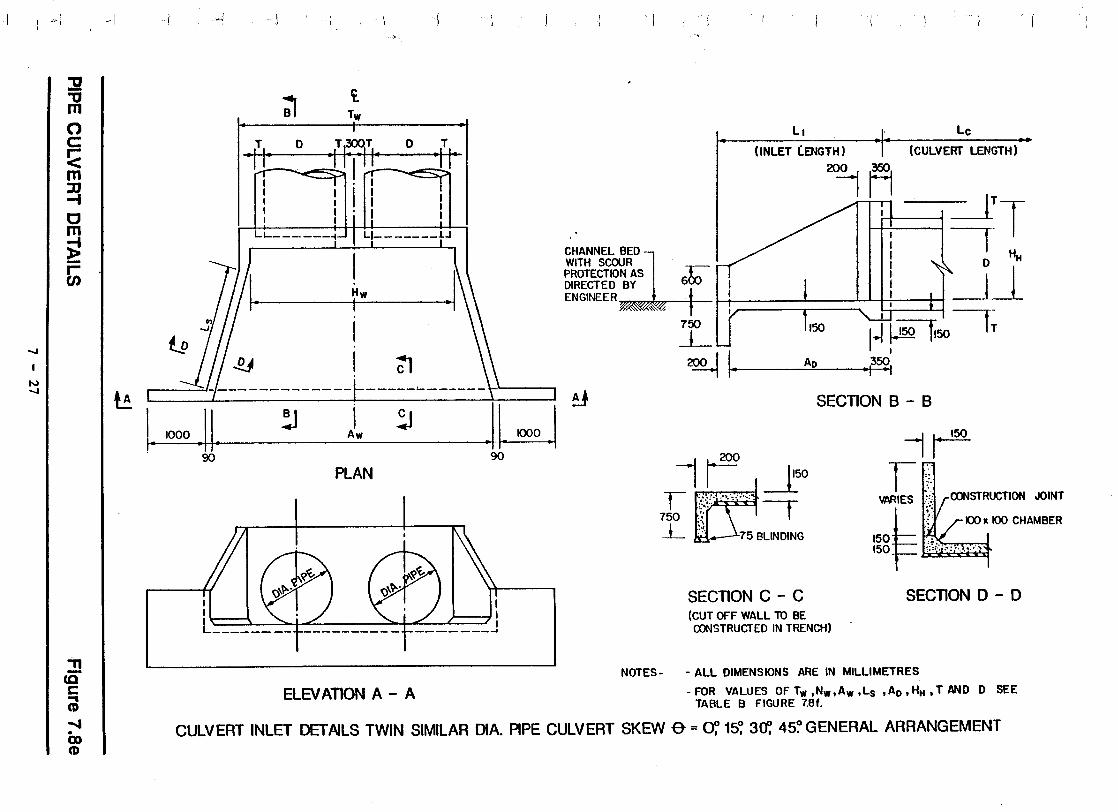
.....
N .....
,> 1
:g "'0 m o c !< m ~ c m ~ lii
:!! CQ C '"" CD ...... Co CD
-·1
~
l.p
:J t-Tw
-----'-------\-''------,
PLAN
'>.. :1:/ )==-I ! \-==-\ ':::i:0 _______ _ L _____ _
LI Lc (INLET lENGTH) (CULVERT LENGTH)
20~ f1 " ,=---1
TT CHANNEL BED I I D H III' Jl H s~tl tiC I!~ ENGINEER, . I ,,,,,.---=:;=:=-
~
, 150 '-lJ ,
I. AD I~ ~ 1100 h 350 -, -,
SECTION B - B
200
11 ~O f ~~Y' ..... ,.;-.. , I
750 :','
L;} 75 BLINDING
SECTION C - C (CUT OfF WALL TO BE OONSTRUCTED IN TRENCH)
1~ Ii::.
VARIES JOINT
~~ h2lX:id::~ SECTION D - D
NOTES - - ALL DIMENSIONS ARE IN MILLIMETRES
ELEVATION A - A - FOR VALUES OF Tw ,Nw,Aw ,LS ,AD ,HH. T AND D SEE TABLE B FIGURE 7.8f.
CULVERT INLET DETAILS TWIN SIMILAR DlA. PIPE CULVERT SKEW e == O~ 15~ 3(f, 45?GENERAL ARRANGEMENT

TABLE A. PIPE CULVERT INLET DETAILS FOR SINGLE PIPE
INTERNAL DIAMETER OF PIPE (D) VARIABLE DIMENSIONS
600 750 900 1050 1200
WJOTH OF TRENCH (T w) 1400 1400 1700 1700 2000
WIDTH OF HEADWALL (H w ) 1100 1100 1400 1400 1600
WIDTH OF APRON (A w ) 2200 2200 2500 2500 2900
WIDTH OF WINGWALL (W w) 750 750 1000 1000 1000
HEIGHT OF HEADWALL (HH ) 1100 1100 1400 1400 1675
LEN.GTH OF SIDE (Ls ) 1100 1100 1675 1675 2294
DEPTH OF APRON (AD) 1200 1200 1800 1800 2400
DEPTH OF CUT- OFF WALL (Wo) 500 500 750 750 750
ANGLE OF SIDE- WALL (0<) 25° 25° 17° 17° Ira
TABLE B. PIPE CULVERT INLET DETAILS FOR TWIN PIPES
INTERNAL DIAMETER OF PIPE (D) VARIABLE DIMENSIONS
900 1050 1200
WIDTH OF TRENCH (Tw) 3200 3550 3950
WIDTH OF HEADWALL (Hw) 2900 3250 3550
WIDTH OF APRON (Aw) 4000 4350 4850
LENGTH OF SIDE (Ls ) 1675 1675 2100
DEPTH 6F APRON (AD) 1800 1800 2400
HEIGI~T OF HEADWALL (HH ) 1400 1400 1675
THICKNESS OF PIPE (T) 150 175 175
PIPE CULVERT DETAILS . Figure 7.8f
7 - 28
1
I
, .I
t l
I '1
1
I I ]
I ]
,]
J ]
] ..
I I J ]
I

.....
N \0
~-
::g "tJ m o c:: !< m ~ c m ~ li)
::!1 CO C .., CD ...... en
CO
nl_ .- .. - IIIIl .~ >l$1
-:1
WIDTH OF APRON
PLAN
.. W~iJlf1
I I
6" '~;51 I I I 1 __________ 1 ___ 1
SECTION A- A
INTERNAL VARIABLE DIMENSIONS DIAMETER OF PIPE (D) G L T
600 500 (1100 NP\ 100
. .. _!50 __ ,-5~0 (1300 NP-50) 125 WHERE NP IS NUMBER OF PIPES.
".,1 ,1 , .... [ --) , _ •. 1
I
CHAftIIEL BED WITH SCOOR PROTECTION AS DIRECTED BY ENGINEER"
W~~
~~--1T f ---r 1100
r=-~~:=::-l1 ~ 1 202\-J. --I ~ I.;;TT
--I ,.200
500 ,;;;.-" .",<:~ '. T-~' i _;{ T-75 BLINDING
±I~
175 BLINDING
SECTlONC-C (CUT -OFF TO BE CONSTRUCTED IN TRENCH)
1200
SECTlONB-B
-\ rOO T-·
:"f \ARIES '-' 10011100 CHAMFER
~_~;, I ".'!'.-.~ .~ ... "i.~'!i-' --1..
t;"~ f75
SECTION 0-0
NOTE- ALL DIMENSIONS ARE IN MILLIMETRES.
CULVERT INLET DETAILS FOR 600 AND 750 DIA. MULTI-PIPE CULVERTS. GENERAL ARRANGEMENT

.....
w o
m o )(
o c ~ m ~ c m ~ t;
!! CQ C
'"' CD ..... ex, ::r
'~-"¥h,", ~
LI LC Lr
Headwall details
(Length alori <i culvert)
Ernlxlr* ment slope
Eirb<J*ment slope- Hf
.....• -~.;.- .-~-~"-.--'-;.-;-;-:-;.--.: .~ ... '!: -:-::_.' J
Chamel bed with SCQI'
o protection as directed L th ~ be . .. . o by engineer I eng VI culvert tween expaIlSIOIl JOInts to Length of culvert between expansion joints to
1 be not more thon 12metres be not more than I metres
t--
"
I L1= 2P I oos-&
SeHing out point
75 Blildrv;! Concrete
Outlet [)etai Is (similar to inlet)
l.oogitulinal fall Detail X . -- ~ .... '
I Box Culvert
SECTION A - A
':.t.
75 Blinding Concrete
~Iet Details
2.0 Oil Dowell bars at 600el; debonded on one side only.
240 EKponsion Serviseal or similar approved waterstop (on all surfaces
. 11 con tad with soil)
Copwith compressible filer on debonded ~12 Servieised I<ork-Pak or similar approved
RC-Concrete retainiAg wall side
R.C.Concrete cut off wall Servicised Kork-Pak or similar approved
::=*::::«.::::z::£: _______ ::::-:::::."::::.::.:III. II ~ reinfon:ed ~~?JA DETAIL X FLOW (EXPANSION JOINT DETAIU
t ~~ Hf
rna'.' '.' . I , B
".. .\ ' .
ElCpansion joint
TYPICAL CROSS SECTION NOTE: ALL DIMENSIONS ARE IN MILLIMETRES UNLESS OTHERWISE SHOWN
TYPICAL R.C. BOX CULVERT - GENERAL l\RRANGEMENT ." - - ,.... .......
.......",., , -~~'" l""'Ij',.y-'it'I'i''ti \1~' .. 1·~_'!':l'III'~"

.....
w -
~
OJ o >< o c: !;: rn =I c rn ~ ~
!! (Q c a ..... . en
I-HF
TS
o
TS
JII;~ ',(1/ '~I ')
I~"HP" W TW ·1
"I " 8 TW . -I I-f··';J:··:· .. ,,>·:/'::··:·:···.." : .. , .... ' ~"il =1' . ~ ........ ' .: 0'25B ::.:.; 0·258 .::. 1i ._ H
, , .' ... . .
:'"
~ ..
,;_ ..
····,1 "",: ..
': .. . '," ".;
. :. . ~' .. ."
11
. :~':-.'.; :'.: : ~ CONSTRUCTION JOINT
. " L :.:' 50mm.
; "':::,' '~~'.~-;~.~' ~ :" .. ~';':'::'. T
ONE CELL BOX CULVERT (TH = O.5TS)
"FI T+'I:"'-'~""" "I :~w
o
T,
' . . .
.: ,' ..... ~;-: :.
ONE CELL BOX CULVERT (TH = 0)
i ') I
H 1·~--"v.P,"~.'. W "I FI ~ 1, ~
TS
o
TS
"I W I- 8 "I WI- 8 "I W ,-
...... ::. ::.' .' ........... , .•.•••• < •••••• , : • ' ••••• '., .• : .•••• '. • ........ =i ··'r·":;:'~;;ifj'''r~'t: T
, t ~.' •• : :~:.J'~! H : ',:. r:.:
.... ::: .
"
't! :.'/' .' ~ . ~:' :'
.,: . «;: ~:.'.":, ~. '.'
.... :'
'.' 50mm. 1<· !NSTRUCTION JOINT
·~···:'~:,:··;:.::.}~::F0::~.:·; .. T
TWO CELL BOX CULVERT (TH O.5TS)
HFI .rf B "ITf B ..ff ---~-.-."
., ,.....;.........+--+ ..........
TS Tsl -D
r.\ . " ' .. ~., .. _ ....... '" ~ TWO CELL BOX CULVERT (TH "" 0)
NOTE: TW ,T S ,TH ,VARY FOR DIFFERENT HEIGHTS OF FILL ABOVE CULVERT.

~w
....... I-----i
.' :" :.
o ...• : ...
B TW
. :: .... .. ., .
. ..
w
B TW
.... ...•. . •.. -,
B ·1
. . ,'"
.' CONSTRUCTION JOINT
:1-. -: '.: .' .... . ....... ' ." .: .'. .... T 50mm
. TS'T-_ ....,;...---.;___.,---.;:.......,.,;. ..;... ..:,; .. ;....;: ... -....;.;.;" ._--.;..:.....:...... ..• _ . ..;...,.;.. ........ .:.:,. .......... > .......... ,_.: ...:.--->.._-..;......:.;..:...;..., /-. ..;,.' ... ..,.;. ' ..... ';..,.;.:' ',;...-_< • ...:.. ..• '---',..J
BOX CULVERT - THREE OR MORE CELLS
~~~~~
HF PIT B ·rr B ·if B '11 T~~·-r·'~··~·=,~·~·~·~~=-~~~·~~~:·; .. ·= .. 4==·=·~·~·(,:~·.~,·~· .. ~~·~~·I·~~:~~~·-~.~,;·~\ :::Ll ~ ;.LL- -r-~'. 'L -,....D;
o TS
. l ~~~
T5 T5
TS TS
TS .. TS TS .,
TS TS T5
Ts~- ~.~"--".....,..........,.......,.-':.:.:.. '.':":>.2'-.. ::::::. ::::::. '.='=."=:' .~<.~i...:~;t;; ... ~ ... ~. ~'.::;:" :Z;::'Z".3.'/3:{~~:~r
BOX CULVERT - THREE OR MORE CELLS (TH = 0)
NOTES: TW ITS I TH I VARY FOR OIFFERENT HEIGHTS OF FILL ABOVE CULVERT.
BOX CULVERT DETAILS
7 - 32
Figure 7.8j
I I t
t
I I J
I 1 J ]
J I I J J ,

·1
.....
w w
'iIIII1
OJ o >< o c: ~ m ~ c m
~ In
." _. (Q c ... CD -... en ';1\
~ ''''1 '-: -1 ~ "''''''i 4
..Ji.-"Ie COSe -I
-:J I I
200Ll115~ r-
300
DETAIL 1
11-1\=-400
DETAIL 2 ~/lkrPANSKlN JOINT DETAIL DRAWN FOR 15° SKEW
300 20
NEL BED WITH SCOUR
~~~~ECTION AS DIRECTED I' ./ _~ t - .? 10 ~ENGINEER I ./'" _--I /"'_ A .l 600 I . __ -
!:!..J' /_ . f ;"... .,.- •• ...... '~ ••.• I .. , ...... ~ ... ,.t : •• _
~MBANKMENT SLOPE
EXPANSION JOINT TO BE PROVIDE C IF WI":;:;! 12000
~ ~ :J ~ ~o t: ("""""" ee e , W. ~R~f'RTOFHm:A't'lNOt:,"LS I I !I ~ I I IJ ' ~. (40'4OQlToo""" WI - cos 9 I
•
PLAN (DRAWN FOR 9:0)
D
SECTION A-A NOTE ALL DIMENSIONS ARE IN MILLIMETRES
0= depth of bOlt culvert
T= thickness of side wall
SECTION 8-8
A [
-1····;·,,···-··, ' ..... ,. ::,(,:' ~:.~~.:t",.~:: ~·~~rf~~ ~.~~~ 1000 f,'.;, T
- .~;:~:
SECTION C-C
NOTE; CUT OFF WALL TO BE CONSTRUCTED IN TRENCH
0 4000
H 3000 2500 2000
I I 1500 1000
I t::~J f/) w 0: :!
150 T
SECTION D-D
CULVERT INLET DETAILS ONE CELL BOX CULVERT SKEWe- = OOto 15°GENERAL ARRANGEMENT
T 350 275 225 200 200 200

......
w ~
m o x o c ~ m =t c m ~ rCJ)
-r1 cO' e OJ ...... 2!
.......... '-- L-
c=v r
JL cose
:J
~ EXPANSION JOINT TO B
PROVIDED IF WI ;0.1200 :1
BENCHING IN STRUCTURAL CONCRETE
300
it5
2ooL_ ,-300
DETAIL 1 DRAWN FOR 15° SKEW
20
o
1J~200 :~~
DETAIL 2
FOR DETAILS OF EXPANSION JOINT SEE CULVERT HEADWALL DETAILS
'J ;J ~ " g. -:001-----'-
. _ _ W, ' ...... (40-4OOIT .. 30' : J ----------------------------------------------------------------l~--~'
0 T 4000 350 PLAN SECTION B-B
_ -...:1'= .... ---- --
:1 .1 D
.. ' '.(.~-::~~
SECTION A-A NOTE: ALL DIMENSIONS ARE IN MILLIMETRES
D: depth of box culvert
T:: thickness of side waH
::.1 ~.'. ": ':.: ':-.. : .
300
11 150
~ . .~:.. . ':-. . . .'
1000 'V r,;., 75 BUNDING
SECTION C-C (CUT OFF WALL TO BE CONSTRUCTED IN TRENCH)
f3 ii ~
3000 275 2500 225 2000 200 1500 200 r1 ....
'::~.:.;: 1000 200 , ...... ~. ':'.
ONSTRUCTION JOINT 100xi00 CHAMFER
150
.' :: ::~:}::.~.::~:.~:-: .
I. VARIES .,
SECTION D-D
CULVERT INLET DET '.S MULTI - CELL BOX CULVERT SKEV B- = 0°10 15° GENERAL ARRANGEMENT I '.,- .... ~,(¥ ,
__ '--L.-~:......-o......-_------.....-- -
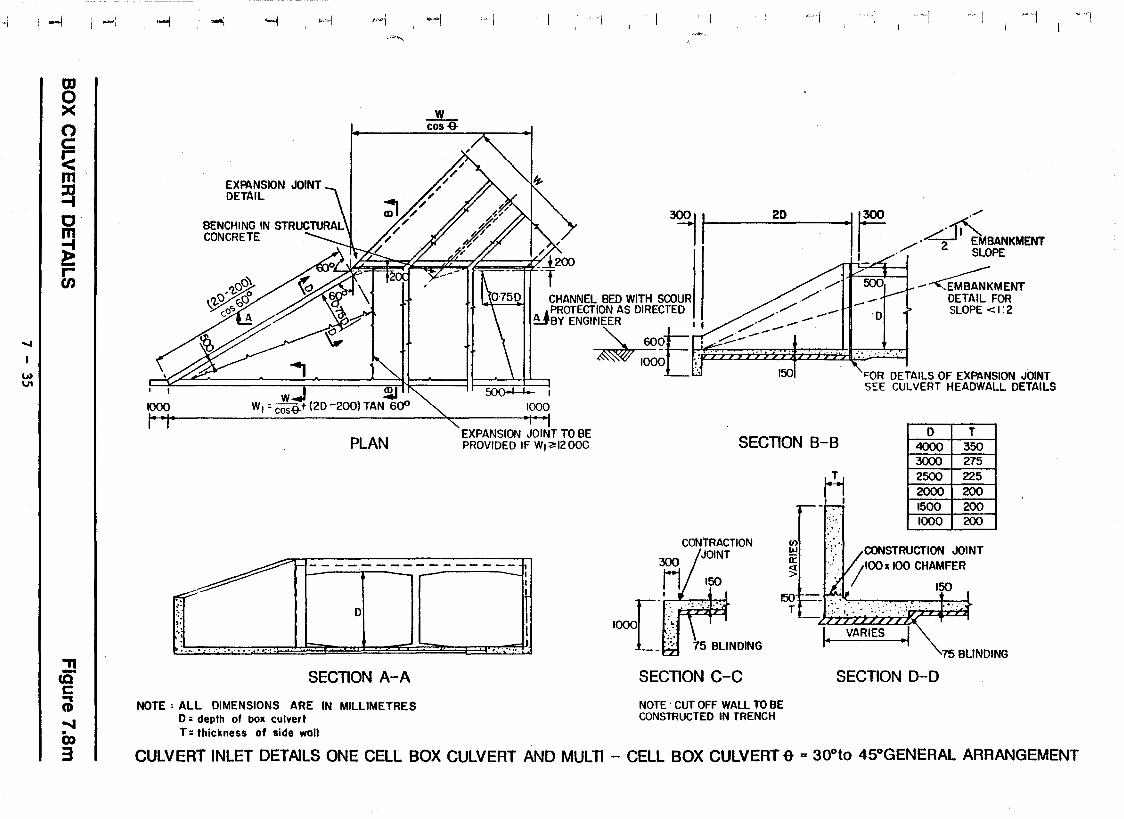
·\
....
w VI
I-I
CD a x 0 c: !< m ~ 0 m
~ r-en
." cS" c .., CD ...... ix» 3
-I ,-1 ...J.. -.j "''''I ,.~ol.<""
.JL cos -&
EXR\NSION JOINT DETAIL
( , ( -c'l I
'1 2D "Ii '1-
CHANNEL BED WITH SCOURI/ /' /" A ,PROTECTION AS DIRECTED /' H---
,/
~MBANKMENT /' 2 SLOPE
-~KMENT DETAIL FOR SLOPE <1:2
~BY ENGIN~ ME' I /",~~..-"- --- 0 ~O •. ~---
~ . ~. ~ II \ II 1000 :: ..,., ..... w:J ~ ""''''_, L "'OR DETAILS OF EXPANSION JOINT W, : cos~t (20 -200) TAN 600 SEE CULVERT HEADWALL DETAILS
.., ....
1000
PLAN EXPANSION JOINT TO BE PROVIDED IF W,~1200G
H - - - - - - - ---II -r-- I
,; ," ::: .: ~.
. ~ ", ,'. . ...... - .:. ~ .:.: .
o
i-- -' '--
SECTION A-A
NOTE: ALL DIMENSIONS ARE IN MILLIMETRES D = depth of box culvert T = thickness of side wall
._ ••• 11. •••• ':
I t~1
D T 4000 350 SECTION B-B
CONTRACTION 300 /JOINT
i1 I
[ ill", '. '," ,,',;' . .1."
1000 .. ~
_:~: 75 BLINDING
SECTION C-C
(I) w 0: ~
150 T
NOTE: CUT OFF WALL TO BE CONSTRUCTED IN TRENCH
3000 275 2500 225 2000 200 1500 200 1000 200
'I/CONSTRUCTION JOINT .... ,Y /100 x 100 CHAMFER
150
I. VARIES .1
SECTION D-D
CULVERT INLET DETAILS ONE CELL BOX CULVERT AND MULTI - CELL BOX CULVERT e = 300 to 45°GENERAL ARRANGEMENT

--:- ..... ~---.~ .. ~ -~-.t"':"-"""-·Y·""-··-" .... -t"-.: ... ... ,;:" ~ .~ .j:- .. .;.~ -: .. '
"'<'
. ~:.' ' ........ ,~ ~)~;;1:~<~:-~ --
. ~~~~ ~ .... ~.- '. ~.
, .-{ ... ~.::: , -
, ':" ~-~<.:y:~.-::..~~
,..:,.! •...
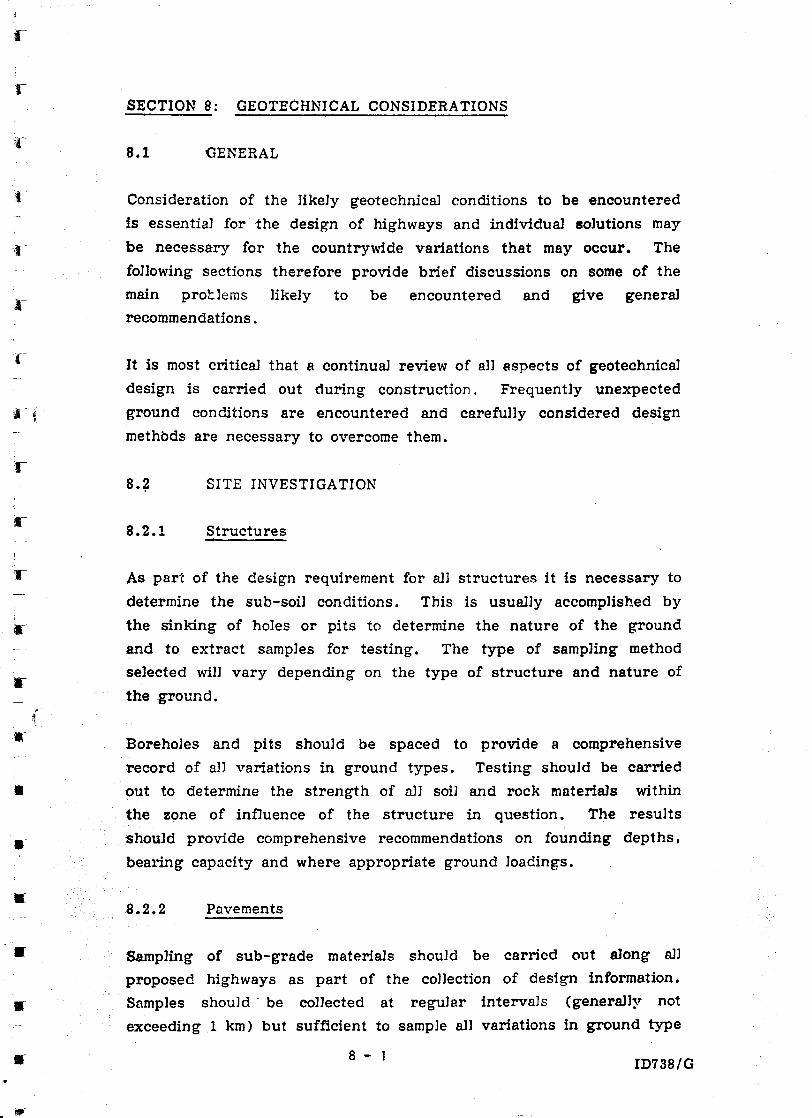
r
.-
• • .-
.-
SECTION 8: GEOTECHNICAL CONSIDERATIONS
8.1 GENERAL
Consideration of the likely geotechnical conditions to be encountered
is essential for the design of highways and individual solutions may
be necessary for the countrywide variations that may occur. The
following sections therefore provide brief discussions on some of the
main protlems likely to be encountered and give general
recommendations.
It is most critical that a continual review of aJJ aspects of geotechnical
design is carried out during construction. Frequently unexpected
ground conditions are encountered and carefuJJy considered design
methods are necessary to overcome them.
8.~ SITE INVESTIGATION
8.2.1 Structures
As part of the design requirement for all structures it is necessary to
determine the sub-soil conditions. This is usually accomplished by
the sinking of holes or pits to determine the nature of the ground
and to extract samples for testing. The type of sampling method
selected will vary depending on the type of structure and nature of
the ground.
Boreholes and pits should be spaced to provide a comprehensive
record of all variations in ground types. Testing should be carried
out to determine the strength of aU soil and rock materials within
the zone of influence of the structure in question. The results
should provide comprehensive recommendations on founding depths •
bealing capacity and where appropriate ground loadings .
8.2.2 Pavements
Sampling of sub-grade materials should be carried out along all
proposed highways as part of the collection of design information.
Samples should be coJJected at regular intervals (generally not
exceeding 1 km) but sufficient to sample all variations in ground type
8 - 1 ID738/G

and all areas of problematic conditions. All samples shouJd have
standard grading compaction and classification tests carried out on
them to define fully the expected road sub-grade conditions.
8.2.3 Materials
The location of quarries, borrow pits and sources of construction
material should be clearly identified at the design stage of every
project. Sources of fine and coarse aggregate shouJd be fu]]y
investigated to determine size distribution, durability and strength.
The location of sources should be selected to take into account the
length and difficulty of haul routes.
Tables 8. 1 and 8.2 list the layout and depth requirements of
boreholes for different conditions.
TABLE 8.1: REQUIREMENTS FOR BORING LAYOUT
Areas for Investigation
Development of site on soft compressible strata
Large structure with separate closely spaced footings
Isolated rigid foundation, less than 250 m2 in area
Slope stability, deep cuts, high embankments
8 - 2
Boring Layout
Space borings 30 to 40 m at possible footing locations. Add intermediate borings when sites are determined.
Space borings approximately 15 m in both directions, including borings at possible walls and footings, and establish geologic sections at the most useful orientations.
Minimum of two sample borings at opposite ~orners. Add more for erratic conditions.
Provide three to five borings on line in the critical direction to establish a geological section for analysis. The number of geological sections depends on the extent of stability problem. For an active slide, place at least one boring upslope of sliding
. area.
ID738/G
[
I
I I

r
• • • • • •
( • ,
TABLE 8.2: REQUIREMENTS FOR BORING DEPTHS
~reas of Investigation
Isolated rigid foundations
Long wall
Slope stability
Deep cuts
High embankments
Highways
8 - 3
Boring Depth
Extend to depth where vertical stress decreases to 10 per cent of bearing pressure. Generally all borings should extend no less than 10 m below lowest part of foundation unless rock is encountered at shallower depth.
Extend to depth below dredge line between 3/4 and l~ times unbalanced height of wall. Where stratification indicates a possible deep stability problem. selected borings should reach top of hard stratum.
Extend to an elevation below active or potential failure surface and into hard stratum. or to a ·depth for which failure is unlikely because of geometry of cross section.
Extend to depth between 3/4 ~nd 1 times base width of narrow cuts. Where cut is above groundwater in stable materials, depth of 3 m below base may suffice. Where base is below groundwater. determine extent of previous strata below base.
Extend to depth between ~ and one and a quarter times horizontal length of side slope in relatively homogeneous foundation. Where deep or irregular soft strata are encountered, borings should reach hard materials.
Extend auger ~orings to 2 m below top of pavement in cuts, 2 m below existing ground in shallow fills. For high erebankmen~s or deep cuts, follow criteria given above.
ID738/G

8.3 EMBANKMENTS
The design and construction of embankments requires the carefuJ
selection and pJacing of a wide range of materials. These may vary
from rockfiJI to dune sand but should ideally be well graded and
suitable for compaction.
In the construction of embankments a distinction may be made between
two different types of material used, earthfiJl and rockfi11. This
distinction can be based upon either the grading of the materiaJ used
and/or the method used for placement and control.
Earthfill is usually selected from wen-graded soil materiaJ, not
exceeding 60 mm in size. This should be pJaced in layers not
exceeding 300 mm thickness and compacted to at least 90 per cent of
its maximum density. RockfiH consists of sound dense rock up to
300 mm maximum size placed in layers a maximum of 600 mm thick.
Unlike earthfiJJ. the density of rockfiJJ is difficult to determine with
confidence. Therefore when extensive use of rockfil1 is to be made,
triaJ embankments are necessary to determine the optimum conditions.
Similar trial embankments are also required for the use of aJJ
probJematic embankment materials.
Embankments should only be placed on suitably prepared and
compacted ground. In no circumstances should embankments be
pJaced on slopes greater than IH to IV and all slopes steeper than 4H
to IV should be benched before placing of fill.
Stability of all major embankment~ should be carefully checked and no
side slopes should exceed 1. 5H to IV. Designs should· also include
slope protection and drainage measures where appropriate and
especialJy where there is 8 possibility of scouring. On his::h
embankments, over 10 m, benches should also be provided to facilitate
construction of surface water run-off ditches and allow access for
maintenance.
8.4 RETAINING STRUCTURES
In areas of high filJ and where availabJe construction space is limited,
it may be necessary to construct soil retaining structures. These can
8 - 4 ID738/G
r {
-
J J I I .1 J I :if
T
T
..- ..
\
T
..
{
I ,
be of reinforced concrete (as described in Section 7). grouted
masonry t or gabions. Typical dimensions for the Jetter two are
shown on Figures 8.1, 8.2 and 8.3.
A11 retaining structures should be checked for stability during design
and particular care should be taken to ensure good founding
conditions. On major lengths of wall (over 20 m) boreholes should be
sunk to Cietermine ground conditions. All walls. unless free draining
(Le.. gabions) should be designed with adequate weep holes to
prevent the build-up of water pressure behind the structure.
8.5 CUTS
8.5.1 General
The construction of highways almost invariably requires the
excavation of a number of cuts. The geometry of these depend on a
number of different variables of which the most important is usually
the nature of the ground conditions. Ideally. 8 complete survey of
the likely conditions- for each major cut t<> deterr!line the ground
type(s) to be encountered should be unCiertaken.
A· detailed assessment of the stability of each cut is seldom practical
at design stage although regular inspection and evaluation of all cuts
during construction is essential. Figure 8.4 provides guidelines on
s]opegeometries which have proved successful on completed works
but should not be taken as indicative of guaranteed stability.
8.5.2 Slope Stability
In some cases it may be necessary to make provisions for slope
stability measures in the design of cuts. One of the principal causes
of slope instability is water and particularly the heavy run-offs that
occur during periods of storm. Care should therefore be taken to
divert water away from excavations to prevent the erosion of cut
faces and the initiation of slides.
8 - 5 ID738/G

G') » ~ o z » z c s: » en o z ::xJ -< ~ r r
.001 en 0\
"l'~ ~~:'l~
!! C,Q c: ... CD (X) . .....
.....
I, 1.00 STEPS 0.50
EXIST"H; ~D
:~ I.Oxl.Ox30or 4.0 . LONG GABIONS
30cm. THICI( BACK FILL <F GRADED CRUSHED STONE I·.:::~ OR GRAVEL (MINIMUM)
HEIGHT VARIES
2 4 ~I 1[7
TYPICAL SECTION THROUGH GABION RETAINING WALL '~, ..... '" < ..... - - -- -- ~;1 ."~:""!\'\'
HEIGHT OF WALL
0.21
0.30 0.60
CONCRETE (New Jersey) BARRIER
.3Om THICK FILL <F GRADED CRUSHED STONE OR GRAVEL
TYPICAL SECTION THROUGH MASONRY RETAINING WALL
CARRIAGEWAY
NOTE- ALL DIMENSIONS ARE IN METRES
~ ....,

{ ?! ,
TYPE 1 A WALL FRONT FACE ON 1:6 BATTER
TYPE 1 WALL Numberd H 8(m) VOlJJv1E M3 per M in length
Courses (m) I·AWalt I·e Walt I-A Wall I·B Walt
I 1.0 1.0 1.0 1.0 1.0 2 2.0 1.5 1.5 2.5 2.5 3 3.0 2.0 2.0 4.5 4.5 4 4.0 2.5 2.5 7.0 7.0 5 5.0 3.0 3.0 10.0 10.0 6 6.0 3.0 3.5 13.0 13.5 7 7.0 3.5 4.0 16.5 17.5
GASION WALLS - SURCHARGED
8 - 7
MAX. 11/2
EMBANtO.£NT I~ '~
1;
(X)URSE
NUMBER\li[""5;:i!l~~ ~
TYPE 1 - B WALL FRONT FACE STEPPED
GENERAL NOTES-
H
Gabion walls ShaD be CCJ'IStructed to the lines OIld grades as staked or directed by the Engineer.
2 Intermediate wall heights shall be obtained by using 0.5 m. or 0.3m. deep ~bions i1 one of the CIOUrses.
3 Gobions stall be placed so the vertical joints between baskets are staggered on alternate courses unless ctherwise apprCMId by the Engineer.
4 The horizontal joints between ~bion courses shall not be staggered unless authOrized by the Engineer.
5 All dimensions .... In mitres.
Figure 8.2
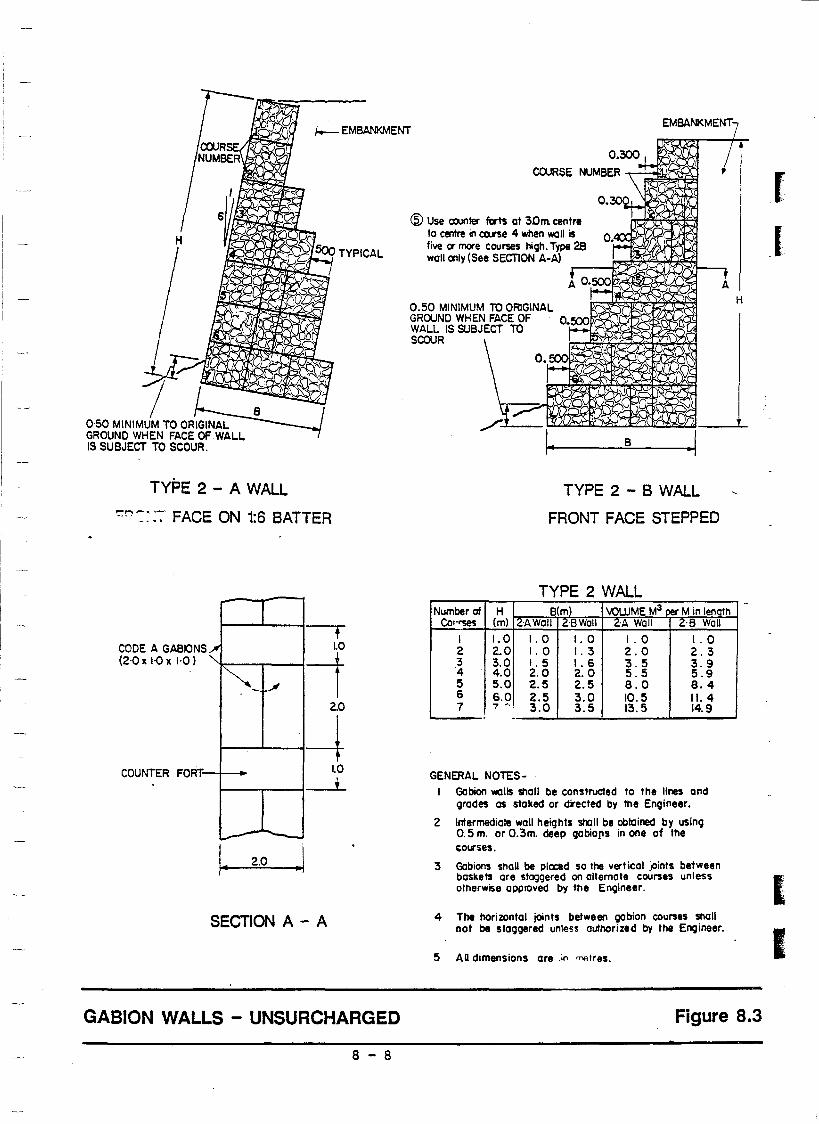
!f'~~ 0·50 MINIMUM TO ORIGINAL GROUND WHEN FACE OF WALL IS SUBJECT TO SCOUR.
TYPE 2 - A WALL
'::r"~~:-:- FACE ON 1:6 BATTER
i<: CODE A GABIONS (2·0 x 1-0 x 1'0)
COUNTER FORT-
~- -"
~ ---I. 2.0 .\
-, LO
1 2.0
-t 1.0
---1..
SECTION A - A
GABION WALLS - UNSURCHARGED
8 - 8
Number of H
COJRSE NUMBER \~~~
B
TYPE 2 - B WALL
FRONT FACE STEPPED
TYPE 2 WALL B(m~ VOW ME M3 per M in lenqth
Co,·~ (m) 2·AWall 12·BWall 2·A Wall 2'B Wall
I 1.0 1.0 1.0 1.0 1.0 2 2.0 1.0 1.3 2.0 2.3 3 3.0 1.5 1.6 3.5 3.9 '4 4.0 2.0 2.0 5.5 5.9 5 5.0 2.5 2.5 8.0 8.4 6 6.0 2.5 3.0 10.5 II. 4 7 7 -'. 3.0 3.5 13.5 14.9 . .
GENERAL NOTES-Gabion walls shall be constructed to the lines and grades os staked or directed by the Engineer.
2 Intermediate wall heights shOll be obtained by using 0.5 m. or 0.3m deep gabio!,s in one of the lOourses.
3 Gabions shaU be pla:ed so the vertical joints between baskets are staggered on alternate courses unless otherwise approved by the Engineer.
4 The horizontal joints between gabion courses Shall not be staggered unless authorized by the Engineer.
5 AD dimensions are .j,., """Ires.
H
Figure 8.3 -
I
I I

l'
-f
-1
CASE I EARTH CUT
CUT >7m HIGH
SHOOLDER
e o o ,...
x ~ :i
3·00 BENCH
CASE II CONGLOMERATE
(WITHOUT BLASTING)
SHOULDER
3·00 (IN MOOERATLY FISSURED ROCK) I I!' 00 (FOR llGHLY FISSURED ROCK :-\2 BENCH
CUT>IOm . . CUT> 10m HIGH
HIGH 10 I -=:JI
E 0 0
!2
" x < ~
:r CUTS ~ 10m HIGH
CASE 11\ WEATHERED ROCK
SHOULDER
E 0 0
!2 " x < ~
:i
10 --==1
CUTS < 10m HIGH
SHOULDER
CASE IV SOUND ROCK
SOUND ROCK :: Typically massive unweathered rock block size 0'5 rJ.
WEATHERED ROCK :: Typically slightly to moderately weathered rock, fractured, jOint
spacing greater than 300mm.
CONGLOMERATE :: Typically poorly cemented soil consisting of silt, sand, cobbles and boulders.
EARTH All non cemented low strength soil materials.
DETAILS OF SIDE SLOPES IN CUT Figure 8.4
8 - 9

Where conditions likely to lead to slope failure are identified, various
methods of slope stabilisation can be used, including:
Wire netting
Rock bolts
Sprayed concrete
Retaining wans {masonry OF' reinforced concrete)
Gabions.
The design of these measures should be optimised to suit the
conditions for each individual site.
8.6 SAND DUNE AREAS
8.6.1 General
All roads in sand dune areas require careful investigation to ensure
that the accumulation of sand is minimiseG and does not provide a
hazard to the road user. It is important that the alignment is
selected after careful consideration of the wind direction. If at an
possible. roads should be elevated on embankments above general
dune crest height and cuts and all features causing wind speed to
drop and sand deposition to occur should be avoided.
In areas of varying wind direction, typically Barchan type dune fields
and where considerable dune movement is occurring, extreme
difficulty can be encountered in construction and maintaining any
type of road.
In dune areas the availability of materials for road construction is
usually severely limited and the need to import material, often for
considerable distances should always be considered.
8 - 10 JD738/G
[
I
I I

if ! '4
1-
r
l-
r 1 r
I
r f
r r
8.6.2 Road Alignment
The following considerations should be used to select alignments in
transverse sand dune areas.
If the road is parallel or inclined to dune but perpendicular to
the prevailing wind direction t few problems are usualJy
encountered. The read shouJd be constructed in the interdune
spaces keeping away from the leeward side of any dunes. I: two
transverse sand dunes are located close by. the gently sJoping
windward side of the sand dune, which is fairly well stabilised.
should be selected with balanced cut and fill so as to avoid any
chances of blockage of carriageway by the active fore dune •
If the alignment of the road runs perpendicular to dunes or
parallel to the prevailing wind direction. several sand dunes may
have to be crossed and cutting of dunes and filling of the space
in between two dunes may be necessary to maintain proper
grade. Cuttings or embankments are not likely to be adversely
affected by strong winds and dust storms if their direction is
the same . as that of road alignment. Cuttings are on the
contrary widened sometimes by wind erosion since the velocity of
wind is ir: :,~eased. due to fluming. However. embankments near
cuttings may sometimes be blown away and deep trenches
formed.
If an alignment makes an angle more than five degrees with the
direction of prevailing winds, embankments can be seriousJy
affected. Any fine soil in berms, gets blown from the windward
direction and is accumulated on the other side or even on the
carriageway and thus creates a serious maintenance problem
Experience shows that an alignment requiring cuttings and
fillings of more than three metres should be avoided at all costs.
An alignment involving minimum cuttings and fillings is
considered to be the best one
Another possibility in transversing transverse dunes is
the crests of the dunes rather than cutting dunes.
slopes of one in six need to be provided.
8 - 11
to join
Stable
ID738/G

In areas of longitudinal sand dune alignment, the following should be
adopted:
8.6.3
Road alignment in the wind direction poses few problems and can
easily follow the line of interdune plain in the case of sand
dunes. However, in the case of several longitudinal sand dunes
being located adjacent to each other, the alignment should be
located on the dune lee slope since this requires minimum cut
and fill
Roads perpendicular to wind direction (or parallel to longitudinal
dunes) or inclined to it, pose serious problems, since the
prevailing wind direction is similar to that of the axes of the
dunes. Cuttings and embankments can be subjected to serious
sand drift and erosion
Valleys or saddles in a chain of longitudinal sand dunes can be
safely utilised for aligning the road. The alignment of the road
will often become circuituous by following the interdune spaces
but will be the best from construction and maintenance points of
view.
Sand Accumulation
The cross-section of the road should be carefully examined to
minimise wherever possible the accumulation of sand. A level road
will receive a thin layer of sand over the leeward side during normal
direction wind conditions. The layer will be thin and will probably
not impede the vehicles even if equipped with high pressure tyres.
When a reversed direction wind occurs, the thin layer of sand will
shift to the other side of the road. This should not, however, be
serious enough to impede the vehicles. A crown to the road will
aggravate the down wind side accumulation. For this reason the
crown must be kept to the absolute minimum. Flat roads are
preferred.
A slight super elevation on the leeward side of the road will keep the
surface of the road free from sand carried by normal direction winds.
8 - 12 ID738/G
I I
I I
I
I
I
I
The road will, however, become covered with sand during the time of
a reverse direction wind storm. This construction should generally
be avoided.
Depression of the normally downwind side of the road will immediately
result in an accumulation of sand. The depth of the accumulation will
depend upon the amount of depression. This factor must be taken
into consideration when makin g 'banked' turns. Turns should have
as long a radius as possible without banking.
8.6.4 Construction and Protection
Typical construction, on embankments, is shown on Figure 8.5. Such
construction is suitable in Rreas of stable or Jow mobility dunes. If
dunes are very mobile it is necessary to consider the use of other
forms of sand stabilisation to prevent inundation of the road.
A vailabJe methods are:
SRnd fences
Shrub and tree planting
Sand trenches
Asphalt spraying
Geotextiles.
The method to be used should only be selected after careful study of
its effectiveness nnd the environmental consequences for each
particular site.
8 - 13 ID738/G

(Xl
I
-.&:-
--
(1)-1 »-< Z-O Co C» c· Z:u ma »» :u C
~~ (1)-(
t.J) m ~ a Z
:!! co c ... CD 0) . 01 --~ -
SHLD. CARRIAGEWAY SHLD. 6·OOm.
~"1}~ .....
1 5 01 I 150LJ ,/;for H)4 < 1'5%1 (1·5% < I· 10 (. ~ /" 6 for H(4
3'OOm
""77~-.... ___ -.....
:----:-:-.. -- - "~~O ~ ................. ', ..... , ... ;; .~... O~ I ...... . .. . ... ; ... ~ .. :.,..' . ........ ~ A#'''' .. : ............ :. I .', ," .... , .. :-;-.; .... .
~====J-~=:I=t:;:: GRAVEL BASE OR GEOTEXIIL: .,. .' ,
SURFACE BENCHED TO FORM WINDROWS
050m MIN. SELECTED IMPORTED FILL
REINFORCING LAYER
ROAD CONSTRUCTION
030m(FINISHED THICKNESS)NATURALLY OCCURING GRAVEL SUB-BASE (CBR), 25% COMPACTED IN TWO LAYERS
NOTE:
A MAXIMUM SUPER ELEVATION RATE OF 5% FOR CARRIAGEWAY AND SHOULDERS SHOULD NOT BE EXCEEDED
-- ... --._--- -- ,,,,~~~I ~1lM\II!
TYPICAL ROADWAY SECTION SAND DUNE AREAS
.- ,.. "- ,- -- ,_ .
- -- ~ ~ -