XL2 DataExplorer User Manual€¦ · and NTi Audio AG (“NTi Audio”). By installing or using the...
115
www.nti-audio.com USER MANUAL Mar.20 / MBe User Manual XL2 Data Explorer PC-Software for the Analysis of XL2 Sound Level Data Doc version 1.9.0/0e Refers to SW v1.9.0 or higher and XL2 firmware v3.24 or higher NTi Audio AG is an ISO9000:2015 certified company
Transcript of XL2 DataExplorer User Manual€¦ · and NTi Audio AG (“NTi Audio”). By installing or using the...
www.nti-audio.com
User ManUal
Mar.20 / MBe
User ManualXL2 Data Explorer
PC-Software for the Analysis of XL2 Sound Level Data
Doc version 1.9.0/0eRefers to SW v1.9.0 or higher and XL2 firmware v3.24 or higher
NTi Audio AG isan ISO9000:2015 certified company

3Contents
© 2020 NTi Audio AG, MBe
Table of Contents
Part I Introduction 5
................................................................................................................................... 71 Installation
................................................................................................................................... 82 Specifications
................................................................................................................................... 103 Software structure
................................................................................................................................... 124 Tutorial
................................................................................................................................... 195 License agreement
Part II Project view 21
................................................................................................................................... 241 Data import
................................................................................................................................... 282 Preferences
................................................................................................................................... 343 Project info
Part III Chart view 35
................................................................................................................................... 391 Overview chart
................................................................................................................................... 402 Audio bar & player
................................................................................................................................... 423 Setup Levels
................................................................................................................................... 444 Audit Intervals
................................................................................................................................... 465 Main chart, Info section
................................................................................................................................... 486 Spectrogram, RTA spectrum
................................................................................................................................... 517 Cursor
................................................................................................................................... 538 Zoom & pan
................................................................................................................................... 549 Markers
................................................................................................................................... 6510 Export subset to project
Part IV Result view 68
................................................................................................................................... 711 Markers (in Result view)
................................................................................................................................... 732 Audit Intervals (in Result view)
Part V Level Calculations 74
................................................................................................................................... 751 Statistics
.......................................................................................................................................................... 75Level statistics
.......................................................................................................................................................... 78RTA statistics
.......................................................................................................................................................... 79Percentiles
................................................................................................................................... 802 Day Night Level
.......................................................................................................................................................... 81LDEN examples
................................................................................................................................... 843 Rating Level
.......................................................................................................................................................... 85Impulse analysis
.......................................................................................................................................................... 87Tone analysis
......................................................................................................................................................... 87Third Octave Tone analysis
......................................................................................................................................................... 90FFT and Tone analysis
.......................................................................................................................................................... 94Time of day
.......................................................................................................................................................... 95Lr calculation
.......................................................................................................................................................... 99National standards
......................................................................................................................................................... 99BS 4142:2014
......................................................................................................................................................... 102DIN 45645-1/-2
......................................................................................................................................................... 104DM 16 marzo 1998
XL2 DataExplorer User Manual4
© 2020 NTi Audio AG, MBe
Part VI Reporting 107
................................................................................................................................... 1081 Print preview
................................................................................................................................... 1112 Data Export
Index 112

Part
I
XL2 DataExplorer User Manual6
© 2020 NTi Audio AG, MBe
1 Introduction
The XL2 Data Explorer is a PC-based software application with a powerful data processor for easy andfast analysis of sound level measurement data. Visualize, analyze and control millions of data points withthis tool that is dedicated to acoustic consultants and noise measurement professionals. It provides aconvenient way to view and manage your data and quickly create professional customized reports.
Features
· Data visualization
· Concatenation of projects
· Fast zoom and pan
· Audio playback synchronized to graph
· Markers with on-the-fly calculation
· Automated tonal and impulsive marker generation
· Percentile levels Ln calculation
· Rating level Lr calculation
· Export a data subset to a new project
· Customized reporting
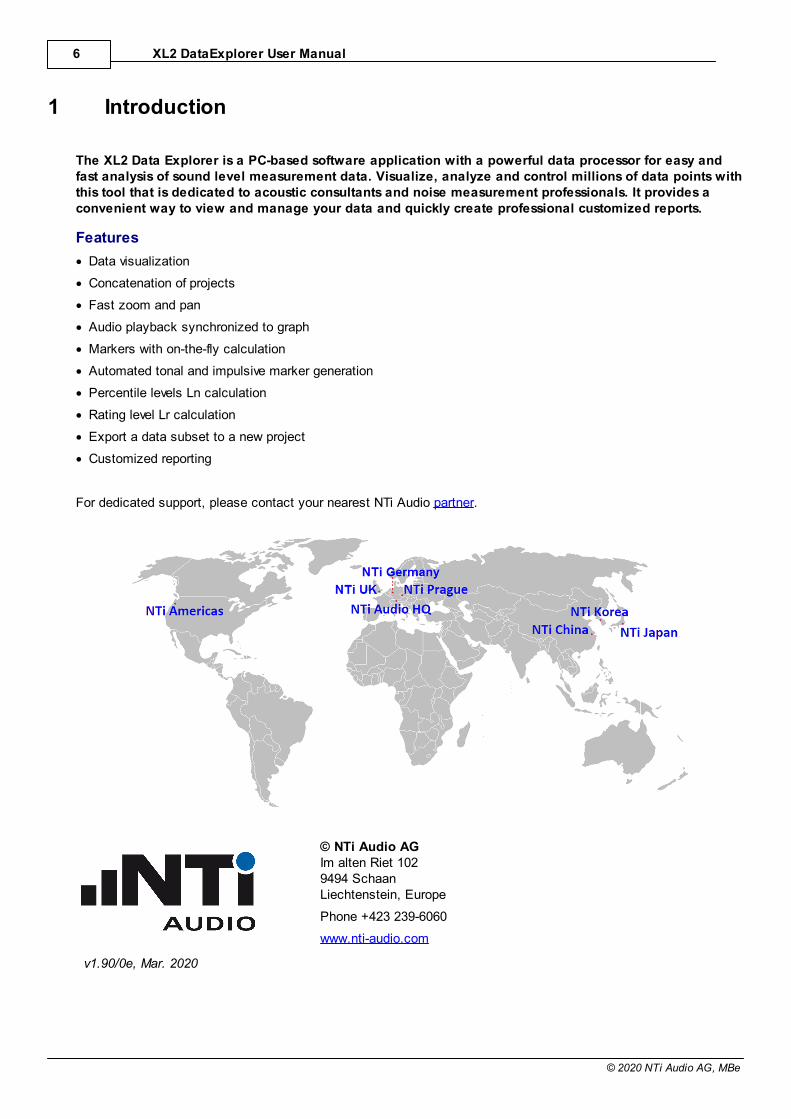
For dedicated support, please contact your nearest NTi Audio partner.
© NTi Audio AGIm alten Riet 1029494 SchaanLiechtenstein, Europe
Phone +423 239-6060
www.nti-audio.com
v1.90/0e, Mar. 2020
Introduction 7
© 2020 NTi Audio AG, MBe
1.1 Installation
System requirements
· Supported operating systems:
o Windows XP SP3
o Windows Vista SP1 or later
o Windows 7
o Windows 8 Pro or 8.1 Pro
o Windows 10
· Hardware requirements:
o Recommended Minimum: Pentium 1 GHz or higher with 512 MB RAM or more
o Video board with shader model 3.0 or higher (DirectX 9.0c)
· Minimum disk space: 2 GB
Hint Result data that is exported from the XL2 Data Explorer to MS Excel is saved in "*.xlsx" format.
Please check the compatibility of your MS Office installation with this file format, and install theMicrosoft Compatibility Pack if necessary.
Software installation procedure
1. Access your personal account in My NTi Audio
2. Download the XL2 Data Explorer installation package
3. Double left-click on the installation file
XL2 Acoustic and Audio Analyzer
· Firmware V2.70 or higher (legacy data require minimum firmware V2.32 or higher)
· XL2 Data Explorer option installed on the XL2 device, or Data Explorer 365 license (if in doubt, contact yournearest NTi Audio partner).
XL2 DataExplorer User Manual8
© 2020 NTi Audio AG, MBe
1.2 Specifications
Supported data types
· XL2 Sound Level Meter data
· Broadband, 1/1 and 1/3 octave band data
· Audio data playback aligned to graphs
Data handling
· Optimized for fast analysis of big data (millions of points)
Markers
· 11 different marker types available
· Exclude and event marker with on-the-fly calculations
· Overlapping markers of same type are merged automatically
· Notes
Percentiles
· Percentiles for wide band, 1/1 and 1/3 octave spectrum
· Simultaneous percentile calculation of full spectrum
· Flexible setting from 0.1% to 99.9%
· Class width = 0.1 dB
Calculated levels
· LAFT5eq_dt – LAeq
· LAIeq – LAeq
· LCeq – LAeq
· LAFmax – LAeq
· LAImax – LAFmax
· LAImax – LASmax
· LAE
· Sum of frequency bands (e.g. 50 Hz to 250 Hz)
Audit intervals
· 1, 5, 10, 15, 30, 60 minutes
FFT and Tone Analysis
based on narrow-band method in accordance with the standards ISO 1996:2-2017, DIN 45681 Ber2:2006-08 and BS4142:2014 with frequency steps of
· 2.93 Hz for linear audio (48 kHz, 24 bit)
· 1.46 Hz for compressed audio
Introduction 9
© 2020 NTi Audio AG, MBe
Automated Marker Generation
· Level
· Pure Tone (based on RTA levels)
o ISO 1996:2-2017, BS 4142:2014, DM 16 marzo 1998 (Italy)
o Leq – Max or Leq – Mean (neighbors)
o User-defined minimum tone duration
o Distinguishing between small and prominent tones
· Impulsive Sound (based on broadband level)
o LAIeq – LAeq, LAFmax – LAeq, DM 16 marzo 1998 (Italy)
o LAImax – LAFmax, LAImax – LASmax
· Time
Day-Night Levels
· Lden, Ldn, Lday, Levening, Lnight
· User-defined penalty
Rating Level
· BS4142:2014, DIN 45645-1/-2, DM 16 marzo 1998
· User-defined measurement periods and reference time interval
· Marker-based and reference time interval based correction
· Counter and duration of selectable marker
Reporting
· Data export to MS Excel
· XPS report
XL2 DataExplorer User Manual10
© 2020 NTi Audio AG, MBe
1.3 Software structure
Views
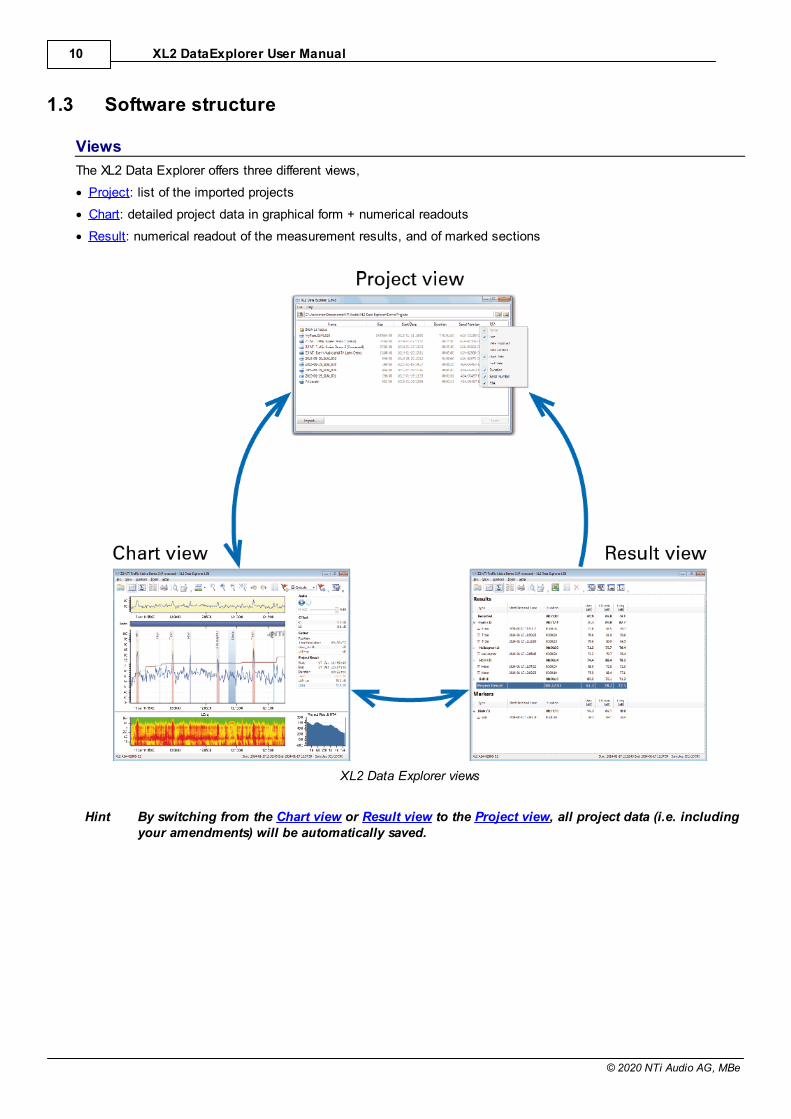
The XL2 Data Explorer offers three different views,
· Project: list of the imported projects
· Chart: detailed project data in graphical form + numerical readouts
· Result: numerical readout of the measurement results, and of marked sections
XL2 Data Explorer views
Hint By switching from the Chart view or Result view to the Project view, all project data (i.e. includingyour amendments) will be automatically saved.
Introduction 11
© 2020 NTi Audio AG, MBe
Multiple instances
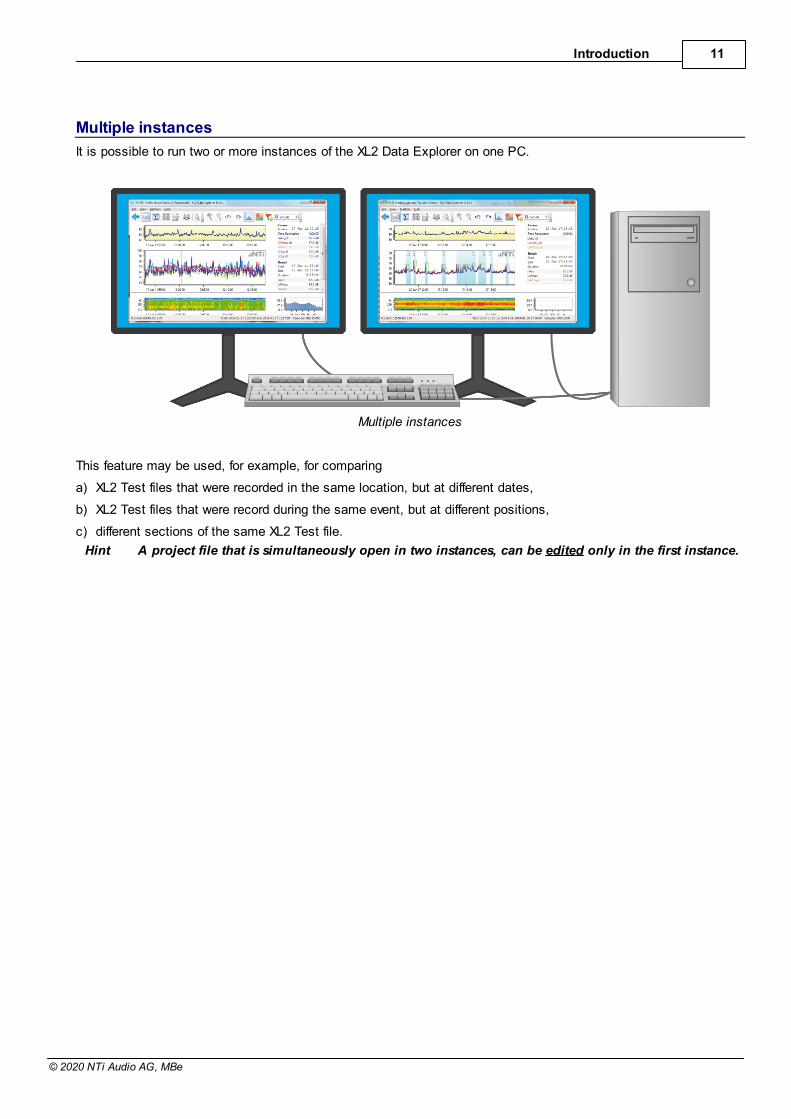
It is possible to run two or more instances of the XL2 Data Explorer on one PC.
Multiple instances
This feature may be used, for example, for comparing
a) XL2 Test files that were recorded in the same location, but at different dates,
b) XL2 Test files that were record during the same event, but at different positions,
c) different sections of the same XL2 Test file.
Hint A project file that is simultaneously open in two instances, can be edited only in the first instance.
XL2 DataExplorer User Manual12
© 2020 NTi Audio AG, MBe
1.4 Tutorial
The following step-by-step guideline demonstrates a typical use of the XL2 Data Explorer.
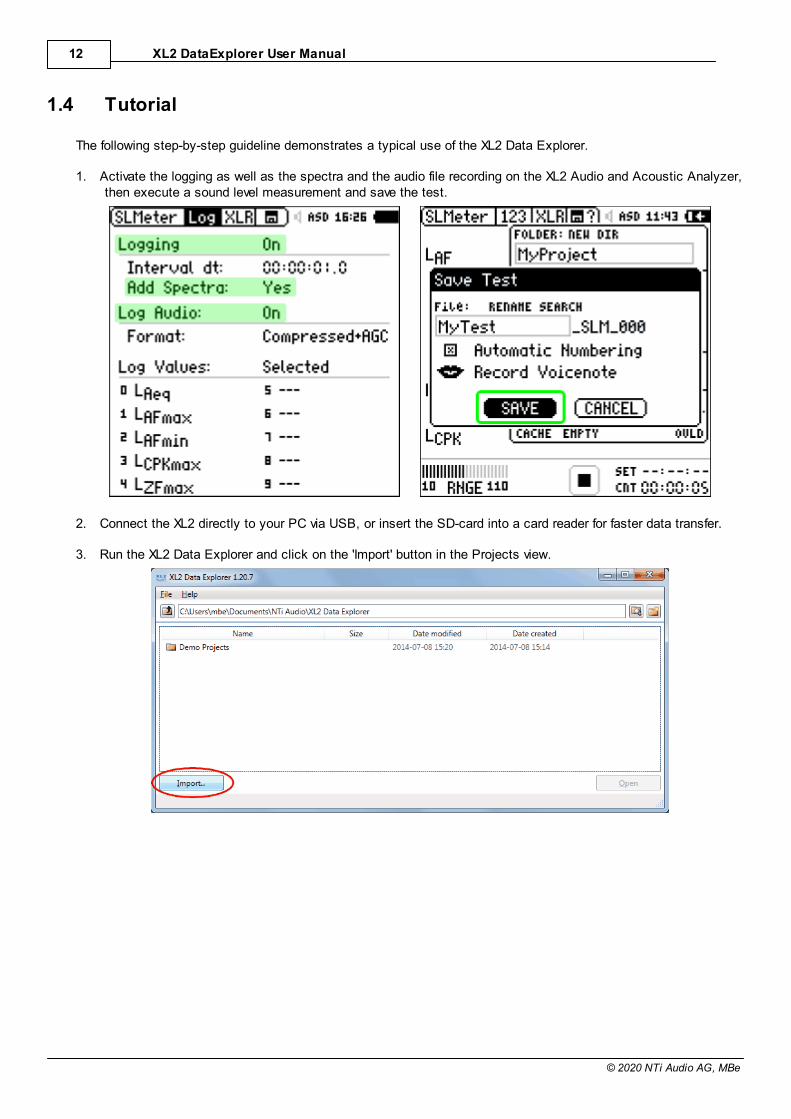
1. Activate the logging as well as the spectra and the audio file recording on the XL2 Audio and Acoustic Analyzer,then execute a sound level measurement and save the test.
2. Connect the XL2 directly to your PC via USB, or insert the SD-card into a card reader for faster data transfer.
3. Run the XL2 Data Explorer and click on the 'Import' button in the Projects view.
Introduction 13
© 2020 NTi Audio AG, MBe
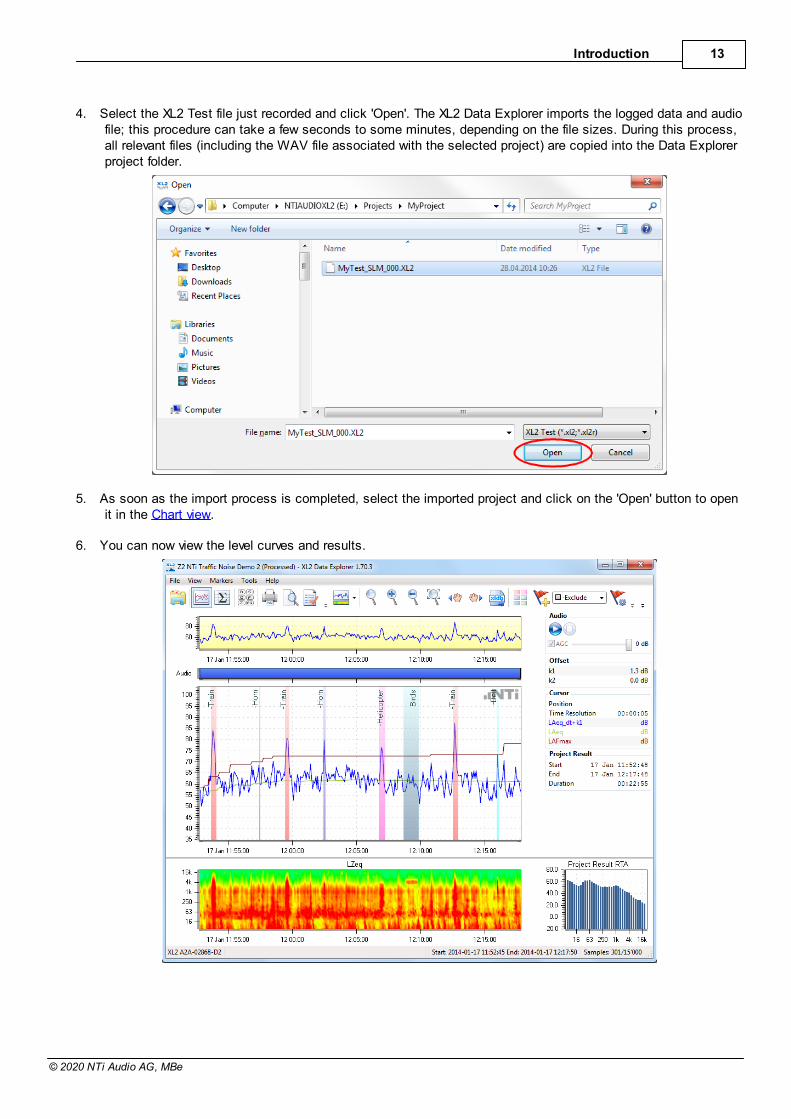
4. Select the XL2 Test file just recorded and click 'Open'. The XL2 Data Explorer imports the logged data and audiofile; this procedure can take a few seconds to some minutes, depending on the file sizes. During this process,all relevant files (including the WAV file associated with the selected project) are copied into the Data Explorerproject folder.
5. As soon as the import process is completed, select the imported project and click on the 'Open' button to openit in the Chart view.
6. You can now view the level curves and results.
XL2 DataExplorer User Manual14
© 2020 NTi Audio AG, MBe
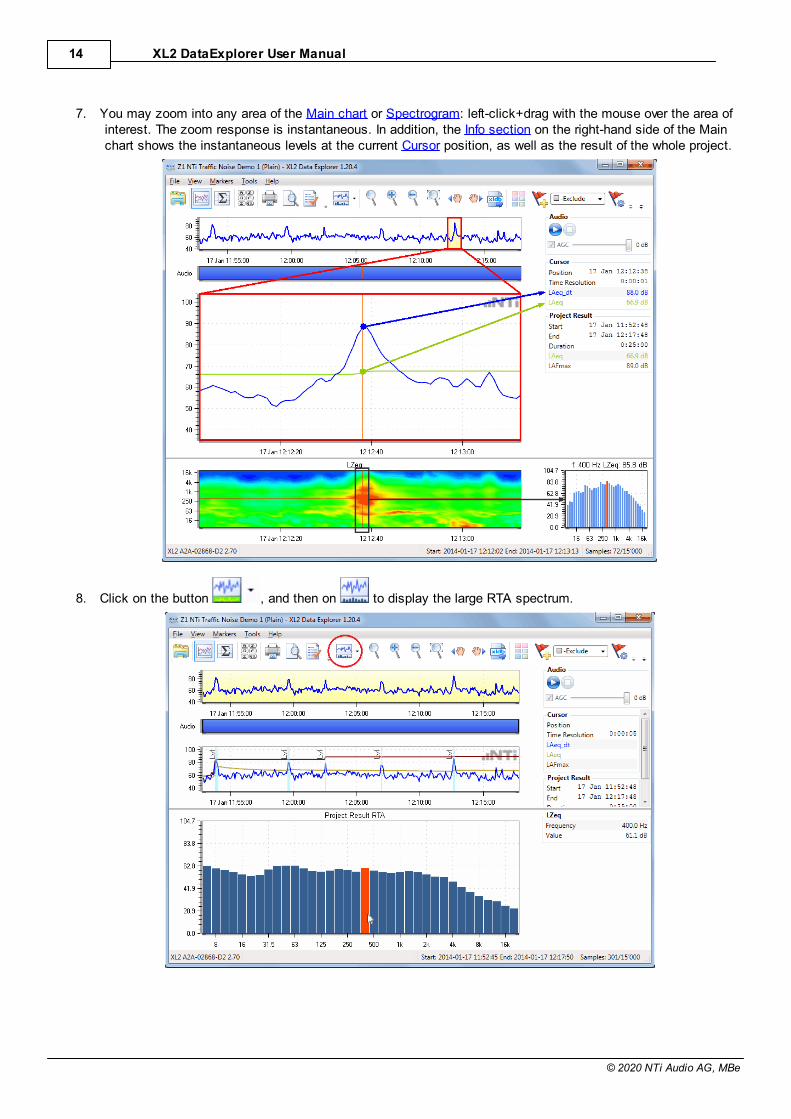
7. You may zoom into any area of the Main chart or Spectrogram: left-click+drag with the mouse over the area ofinterest. The zoom response is instantaneous. In addition, the Info section on the right-hand side of the Mainchart shows the instantaneous levels at the current Cursor position, as well as the result of the whole project.
8. Click on the button , and then on to display the large RTA spectrum.
Introduction 15
© 2020 NTi Audio AG, MBe
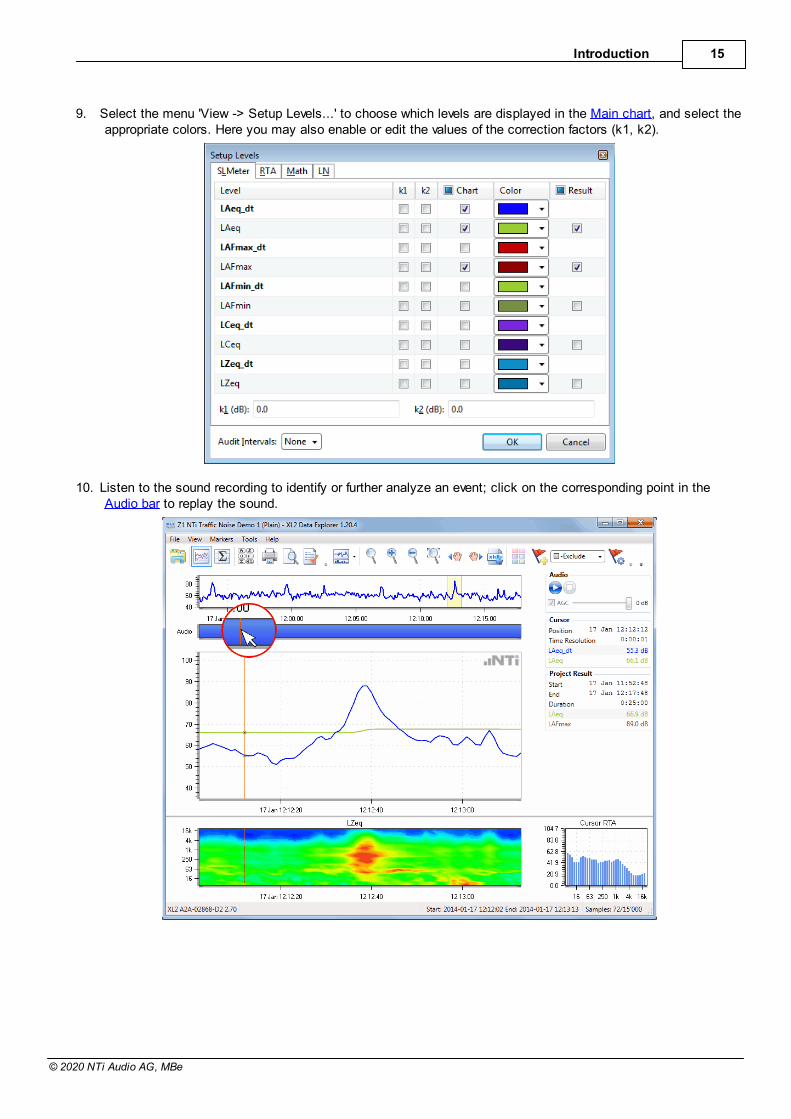
9. Select the menu 'View -> Setup Levels...' to choose which levels are displayed in the Main chart, and select theappropriate colors. Here you may also enable or edit the values of the correction factors (k1, k2).
10. Listen to the sound recording to identify or further analyze an event; click on the corresponding point in theAudio bar to replay the sound.
XL2 DataExplorer User Manual16
© 2020 NTi Audio AG, MBe
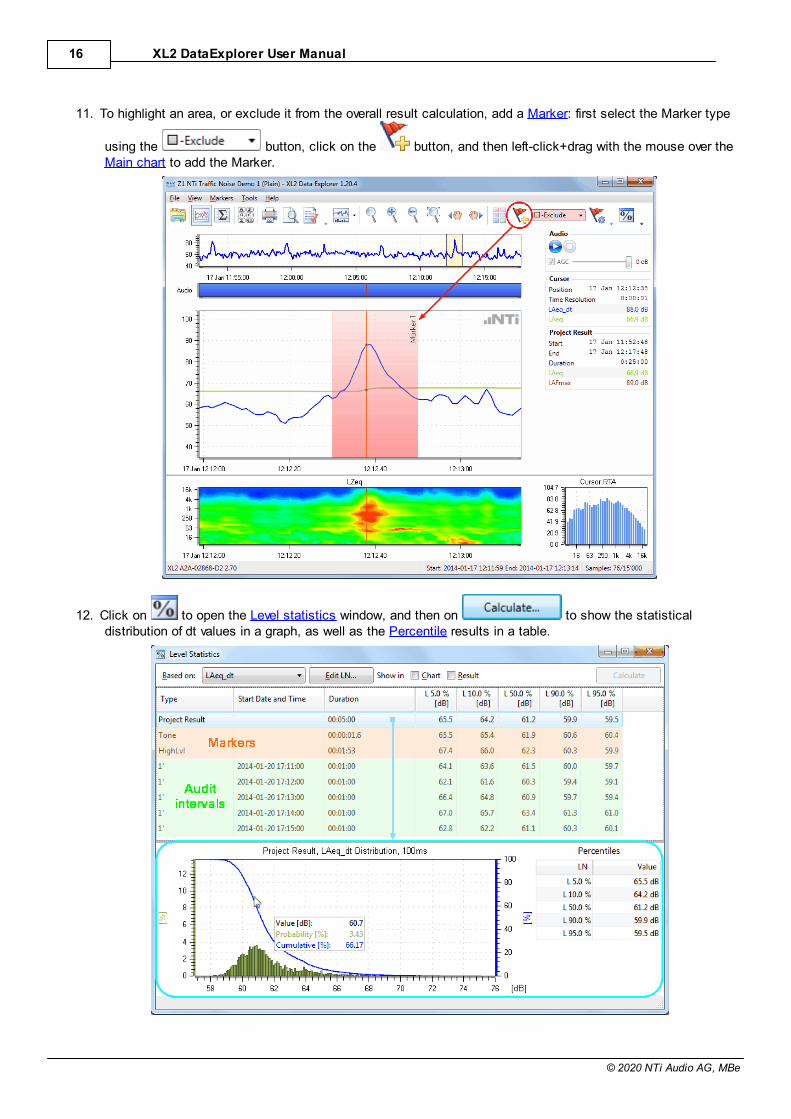
11. To highlight an area, or exclude it from the overall result calculation, add a Marker: first select the Marker type
using the button, click on the button, and then left-click+drag with the mouse over theMain chart to add the Marker.
12. Click on to open the Level statistics window, and then on to show the statisticaldistribution of dt values in a graph, as well as the Percentile results in a table.
Introduction 17
© 2020 NTi Audio AG, MBe
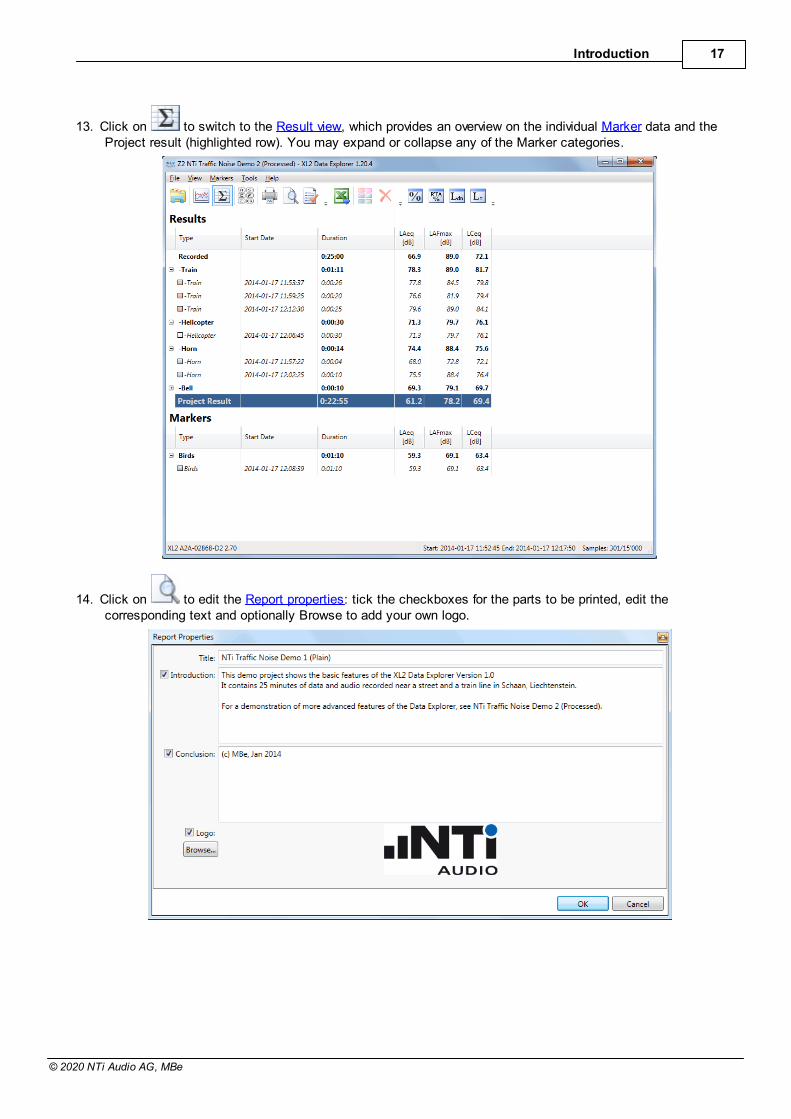
13. Click on to switch to the Result view, which provides an overview on the individual Marker data and theProject result (highlighted row). You may expand or collapse any of the Marker categories.
14. Click on to edit the Report properties: tick the checkboxes for the parts to be printed, edit thecorresponding text and optionally Browse to add your own logo.
XL2 DataExplorer User Manual18
© 2020 NTi Audio AG, MBe
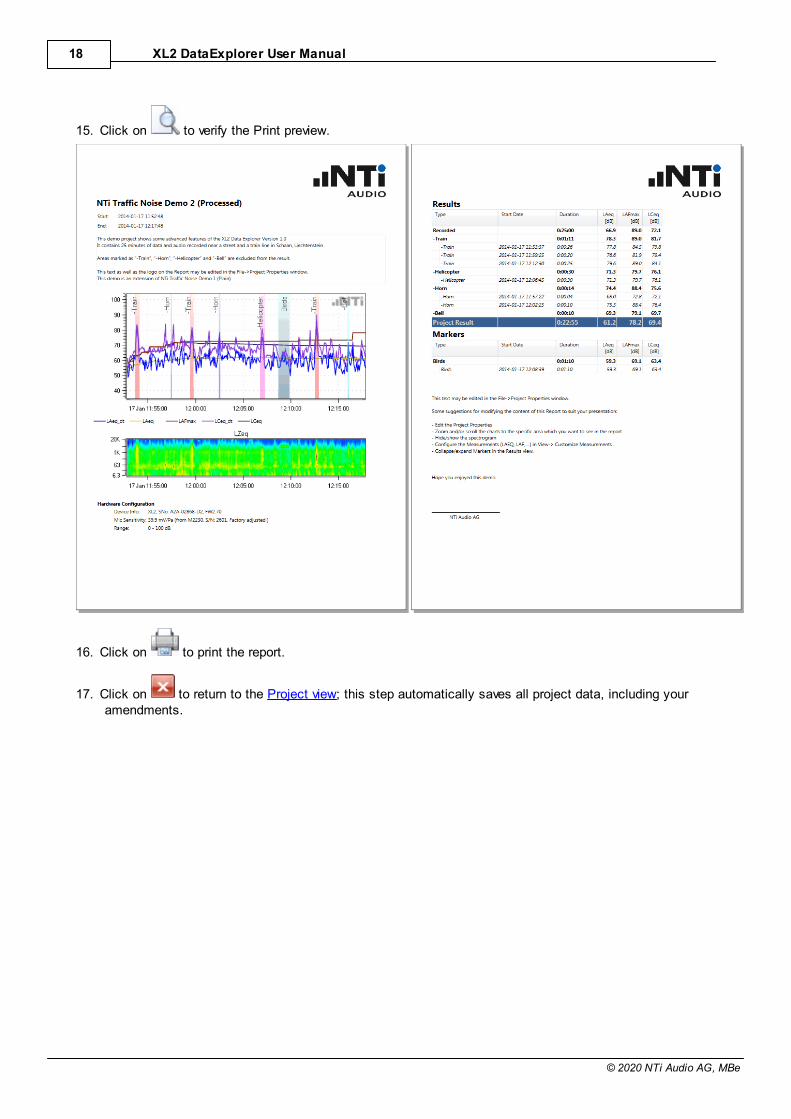
15. Click on to verify the Print preview.
16. Click on to print the report.
17. Click on to return to the Project view; this step automatically saves all project data, including youramendments.
Introduction 19
© 2020 NTi Audio AG, MBe
1.5 License agreement
Scope
This End-User License Agreement (“EULA”) is a legal agreement between you (either an individual or a single entity)and NTi Audio AG (“NTi Audio”). By installing or using the NTi Audio software, content or documentation (collectivelythe “NTi Audio software”) accompanying this EULA, you accept these terms and are consequently bound to them. Ifyou do not agree to the terms of this EULA, do not install or use the NTi Audio software.
The NTi Audio software is licensed, not sold, to you by NTi Audio for use only under the terms of this licenseagreement. This EULA only gives you some rights to use the software. You may use the software only as expresslypermitted in this EULA.
This EULA also applies for all upgrades or updates to the NTi Audio software (if any), supplements, internet-basedservices, and support services for this NTi Audio software, unless other terms accompany those items. If so, thoseterms will govern.
License Uses and Restrictions
A. Software Installation: Subject to the terms and conditions of this license agreement, you are granted a limited,non-exclusive license to use and run the NTi Audio software. Data transfer from an XL2 Audio & Acoustic analyzerto the NTi Audio software is only enabled if the corresponding license is installed on the analyzer.
B. No Reverse Engineering: You may not and you agree not to, or to enable others to, copy (except as expresslypermitted by this license agreement or by the usage rules if they are applicable to you), publish, distribute,decompile, reverse engineer, disassemble, attempt to derive the source code of, decrypt, modify, or create derivativeworks of the NTi Audio software or any services provided by the NTi Audio software, or any part thereof.
C. Termination: This license is effective until terminated. Your rights under this license agreement will terminateautomatically or otherwise cease to be effective without notice from NTi Audio if you fail to comply with any term(s)of this license agreement. Upon the termination of this license, you must cease all use of the NTi Audio softwareand destroy all copies, full or partial, of the NTi Audio software.
Services
The NTi Audio software may enable access to NTi Audio and third party services and web sites (collectively andindividually, “NTi Audio services”). Such NTi Audio services may not be available in all languages or in all countries.Use of these NTi Audio services requires internet access and use of certain NTi Audio services may requires an NTiAudio ID, may require you to accept additional terms and may be subject to additional fees. By using this softwarein connection with an NTi Audio ID or other NTi Audio account, you agree to the applicable terms of service for thataccount.
Disclaimer
A. NTi Audio and all our affiliates do not give any warranty, guarantee or conditions for this software, i.e. you bearthe sole risk of using it. This limitation applies to anything related to this software, including breach of contract,warranty, guarantee or condition, strict liability, negligence or other tort to the extent permitted by applicable law. Italso applies if NTi Audio knew or should have known about the possibility of the damages.
B. The NTi Audio software and services are provided “as-is”, i.e. with all faults. You bear the sole risk of using it. NTiAudio gives no express warranties, guarantees or conditions. NTi Audio excludes the implied warranties ofmerchantability, fitness for a particular purpose and non-infringement.
C. You acknowledge that the NTi Audio software and services are not intended or suitable for use in situations orenvironments where the failure or time delays of, or errors or inaccuracies in the content, data or informationprovided by the NTi Audio software or services could lead to death, personal injury, or severe physical orenvironmental damage, including without limitation the operation of nuclear facilities, aircraft navigation orcommunication systems, air traffic control, life support or weapons systems.
D. No oral or written information or advice given by NTi Audio or an NTi Audio authorized representative shall createa warranty. Should the NTi Audio software or services prove defective, you assume the entire costs of all necessaryservicing, repair or correction.
XL2 DataExplorer User Manual20
© 2020 NTi Audio AG, MBe
E. In no event shall NTi Audio be liable for personal injury, or any incidental, special, indirect or consequentialdamages whatsoever, including, without limitation, damages for loss of profits, loss of data or information, businessinterruption or any other commercial damages or losses, arising out of or related to your use or inability to use theNTi Audio software or services or any third party software or applications in conjunction with the NTi Audio softwareor services, however caused, regardless of the theory of liability (contract, tort or otherwise) and even if NTi Audiohas been advised of the possibility of such damages. In no event shall NTi Audio’s total liability to you for alldamages exceed the amount of ten US dollars (USD 10.00). The foregoing limitations will apply even if the abovestated remedy fails of its essential purpose.
Separate Provisions
If any provision of this EULA shall be held to be invalid, illegal or unenforceable, the validity, legality andenforceability of the remaining provisions shall in no way be affected or impaired thereby.
Privacy
At all times your information will be treated in accordance with NTi Audio’s privacy policy, which is incorporated byreference into this license agreement and can be viewed at http://www.nti-audio.com/privacy-statement
Controlling Law
This license agreement will be governed and construed in accordance with the laws of Liechtenstein, Europe,excluding its conflict of law principles. No amendment to or modification of this EULA will be binding unless inwriting and signed by NTi Audio. The English version of this EULA shall govern, to the extent not prohibited by locallaw in your jurisdiction.

Part
II
XL2 DataExplorer User Manual22
© 2020 NTi Audio AG, MBe
2 Project view
The Data Explorer always starts up in the Project view. The Project view is also accessible from the Chart or Result
views by clicking the button.
· After the initial installation, the Project view shows the 'Demo Projects' folder.
· From then on, it always opens the same folder that had been selected the last time.
NOTE The XL2 unit must have a Data Explorer Option installed to allow the direct import of XL2 Testfiles to the Data Explorer software.
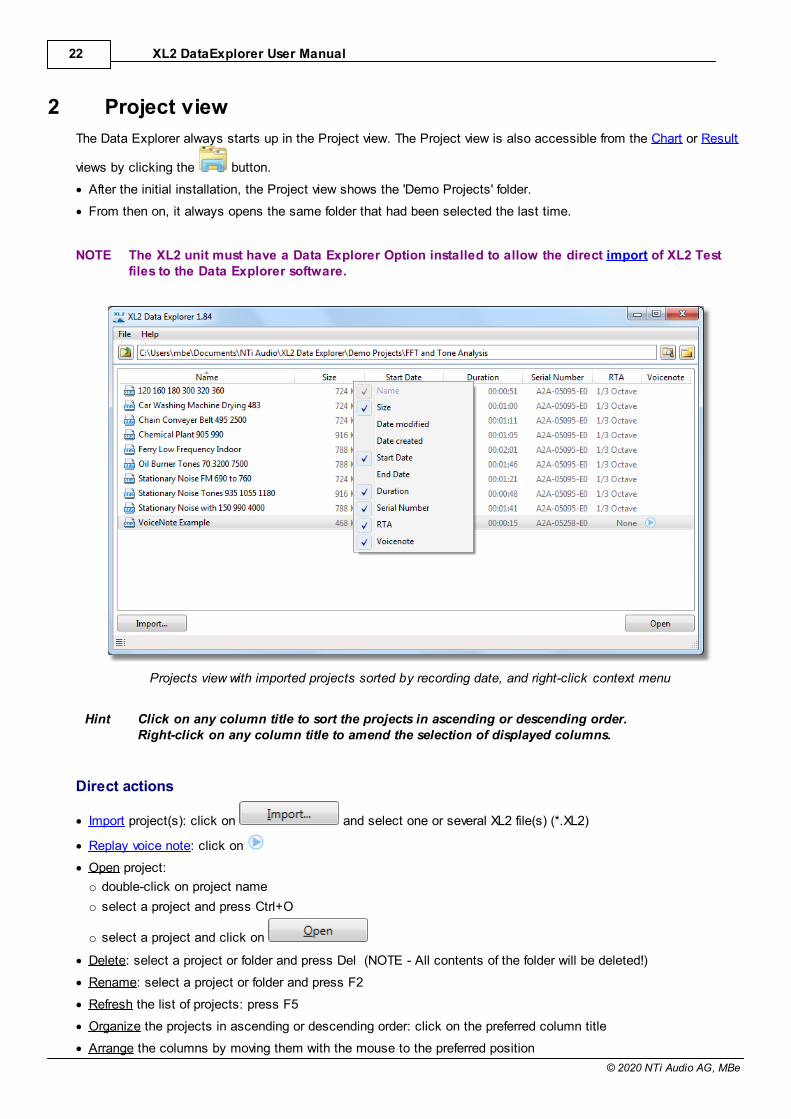
Projects view with imported projects sorted by recording date, and right-click context menu
Hint Click on any column title to sort the projects in ascending or descending order.Right-click on any column title to amend the selection of displayed columns.
Direct actions
· Import project(s): click on and select one or several XL2 file(s) (*.XL2)
· Replay voice note: click on
· Open project:
o double-click on project name
o select a project and press Ctrl+O
o select a project and click on
· Delete: select a project or folder and press Del (NOTE - All contents of the folder will be deleted!)
· Rename: select a project or folder and press F2
· Refresh the list of projects: press F5
· Organize the projects in ascending or descending order: click on the preferred column title
· Arrange the columns by moving them with the mouse to the preferred position
Project view 23
© 2020 NTi Audio AG, MBe
· Copy to: right-click on a project and select 'Copy To...'
· New folder: right-click in the Project view and select 'New Folder...'
· Up one folder level: click on
· Change working folder: click on
· Create new folder: click on
Save project
All amendments to an open project (e.g. Markers, layout of the Chart view or Result view) are automatically saved.Furthermore, upon returning to the Project view, the project file (*.xldb) is closed. Consequently, if you want torestore a previous project status, you may either
· manually undo every amendment,
· or restore an older version of the project file on your PC.
Copy project
You can copy & paste a Data Explorer project e.g. to another location, and open the copy if the PC has the XL2Data Explorer software installed.
XL2 DataExplorer User Manual24
© 2020 NTi Audio AG, MBe
2.1 Data import
Data flow
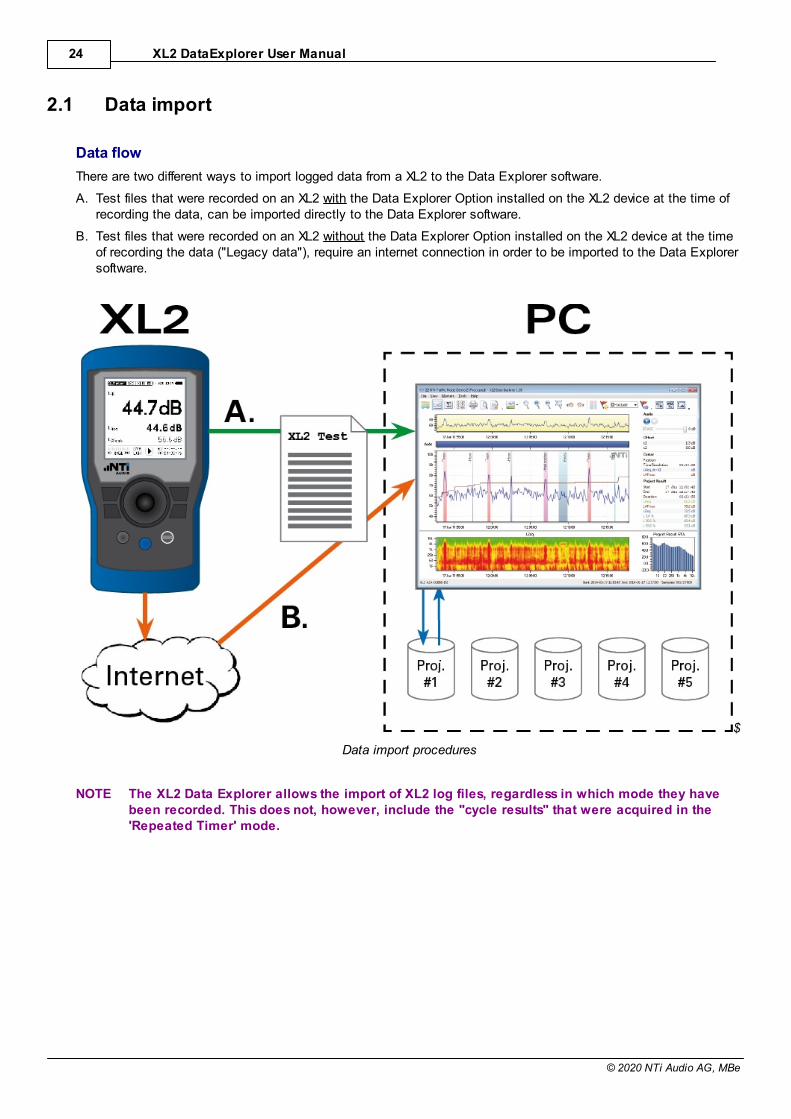
There are two different ways to import logged data from a XL2 to the Data Explorer software.
A. Test files that were recorded on an XL2 with the Data Explorer Option installed on the XL2 device at the time ofrecording the data, can be imported directly to the Data Explorer software.
B. Test files that were recorded on an XL2 without the Data Explorer Option installed on the XL2 device at the timeof recording the data ("Legacy data"), require an internet connection in order to be imported to the Data Explorersoftware.
$
Data import procedures
NOTE The XL2 Data Explorer allows the import of XL2 log files, regardless in which mode they havebeen recorded. This does not, however, include the "cycle results" that were acquired in the'Repeated Timer' mode.
Project view 25
© 2020 NTi Audio AG, MBe
Import procedure
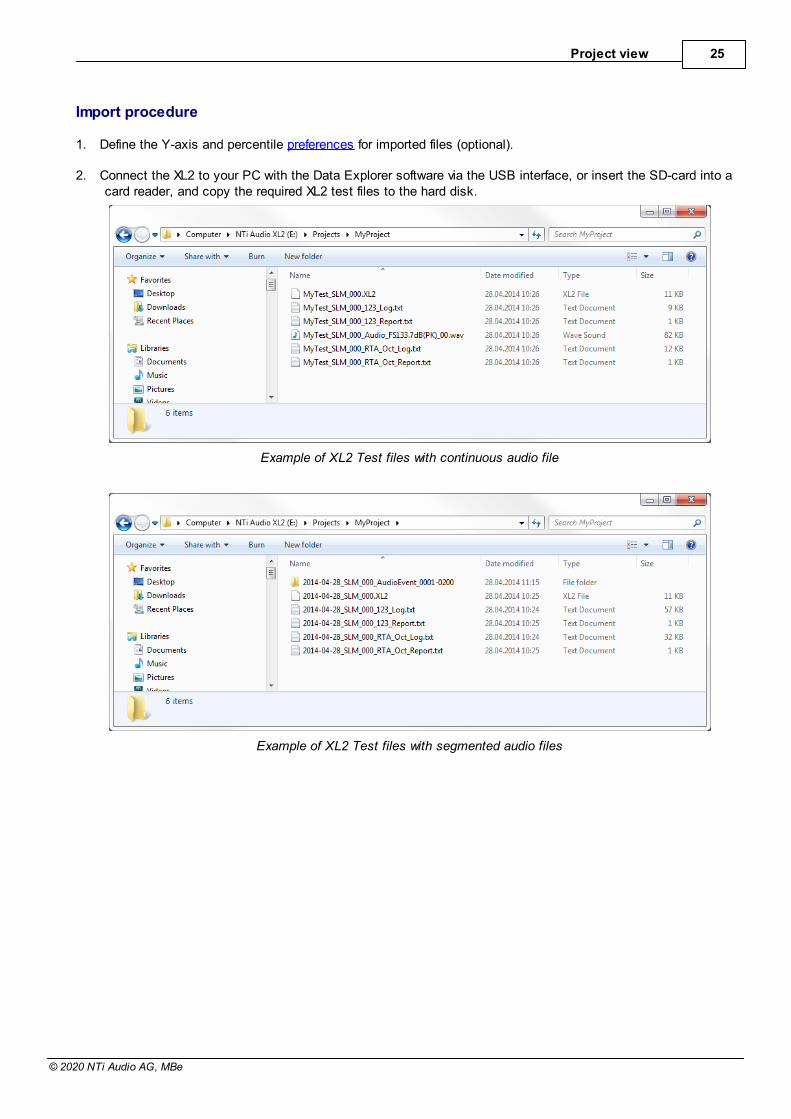
1. Define the Y-axis and percentile preferences for imported files (optional).
2. Connect the XL2 to your PC with the Data Explorer software via the USB interface, or insert the SD-card into acard reader, and copy the required XL2 test files to the hard disk.
Example of XL2 Test files with continuous audio file
Example of XL2 Test files with segmented audio files
XL2 DataExplorer User Manual26
© 2020 NTi Audio AG, MBe
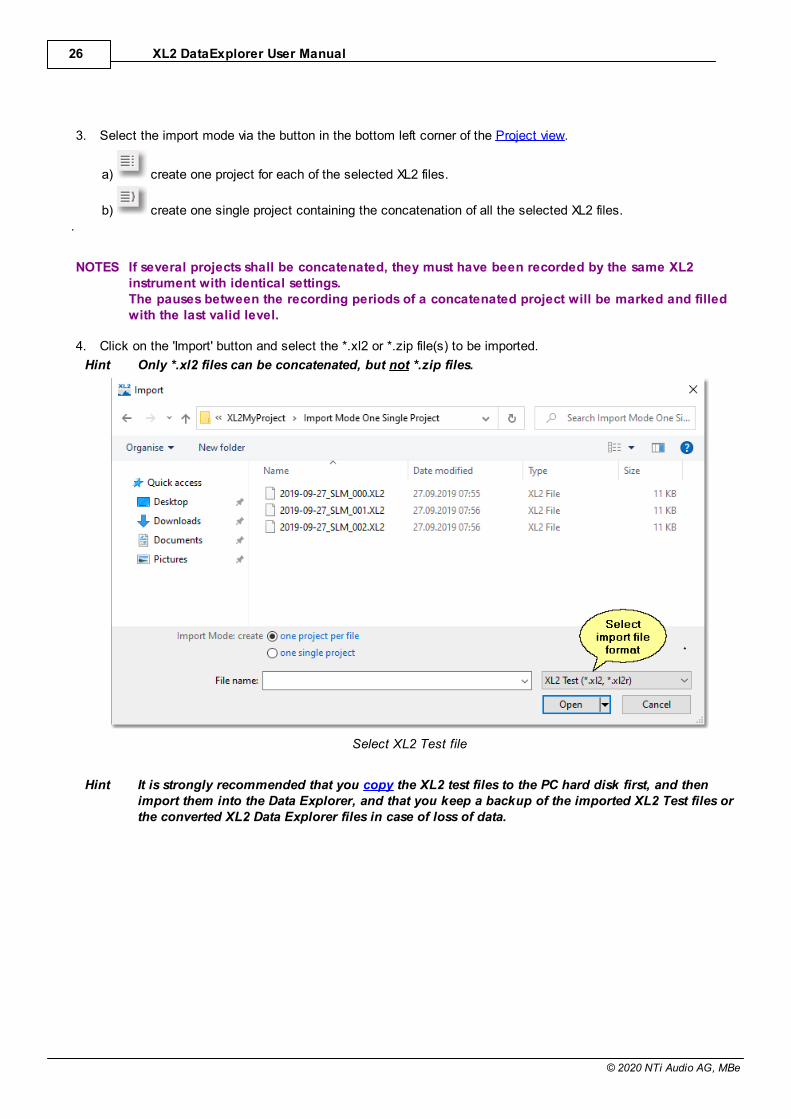
3. Select the import mode via the button in the bottom left corner of the Project view.
a) create one project for each of the selected XL2 files.
b) create one single project containing the concatenation of all the selected XL2 files..
NOTES If several projects shall be concatenated, they must have been recorded by the same XL2instrument with identical settings.The pauses between the recording periods of a concatenated project will be marked and filledwith the last valid level.
4. Click on the 'Import' button and select the *.xl2 or *.zip file(s) to be imported.
Hint Only *.xl2 files can be concatenated, but not *.zip files.
Select XL2 Test file
Hint It is strongly recommended that you copy the XL2 test files to the PC hard disk first, and thenimport them into the Data Explorer, and that you keep a backup of the imported XL2 Test files orthe converted XL2 Data Explorer files in case of loss of data.
Project view 27
© 2020 NTi Audio AG, MBe
Weather data import
There are two alternatives to import weather data to your Data Explorer project,
a) from a NoiseScout location that includes a weather station,
b) from an autonomous weather station.
Weather data import from NoiseScout location
If your NoiseScout location includes a weather station, you may import the corresponding data as follows.
1. Download the logged data from the NoiseScout location to your PC,
2. Drag & drop the downloaded *.zip file to the Project view.
The imported project contains the logged sound levels & weather data, which may be marked for further analysis.
Data import from autonomous weather station
If you may want to import the data of an autonmous weather station into your data Explorer project,
1. Click on the button in the Automatic Marker Generation panel,
2. Select the text file that contains the data from your weather station.
XL2 DataExplorer User Manual28
© 2020 NTi Audio AG, MBe
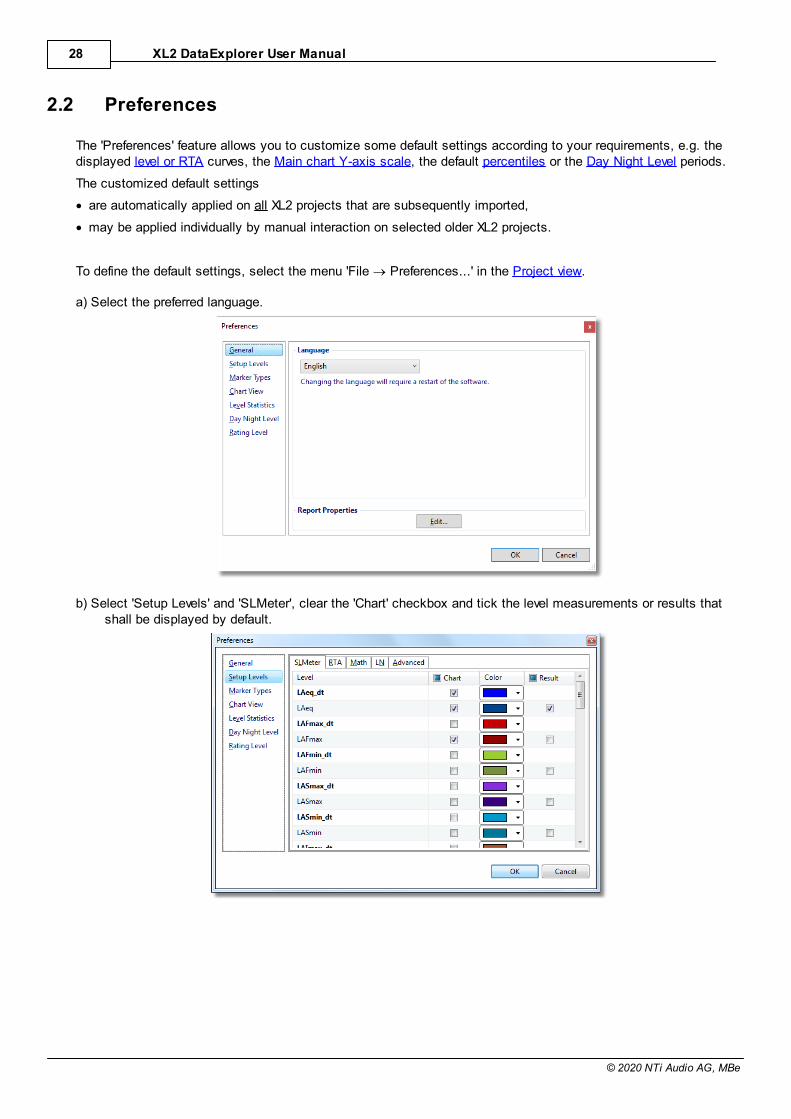
2.2 Preferences
The 'Preferences' feature allows you to customize some default settings according to your requirements, e.g. thedisplayed level or RTA curves, the Main chart Y-axis scale, the default percentiles or the Day Night Level periods.
The customized default settings
· are automatically applied on all XL2 projects that are subsequently imported,
· may be applied individually by manual interaction on selected older XL2 projects.
To define the default settings, select the menu 'File ® Preferences...' in the Project view.
a) Select the preferred language.
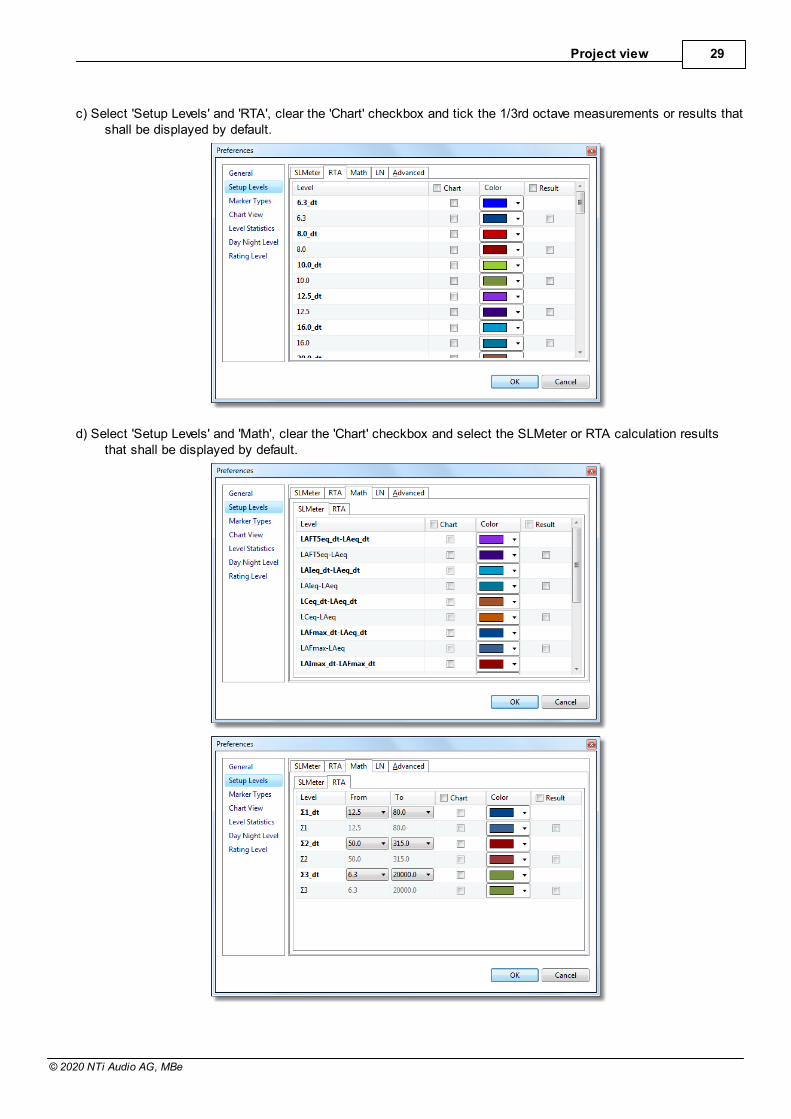
b) Select 'Setup Levels' and 'SLMeter', clear the 'Chart' checkbox and tick the level measurements or results thatshall be displayed by default.
Project view 29
© 2020 NTi Audio AG, MBe
c) Select 'Setup Levels' and 'RTA', clear the 'Chart' checkbox and tick the 1/3rd octave measurements or results thatshall be displayed by default.
d) Select 'Setup Levels' and 'Math', clear the 'Chart' checkbox and select the SLMeter or RTA calculation resultsthat shall be displayed by default.
XL2 DataExplorer User Manual30
© 2020 NTi Audio AG, MBe
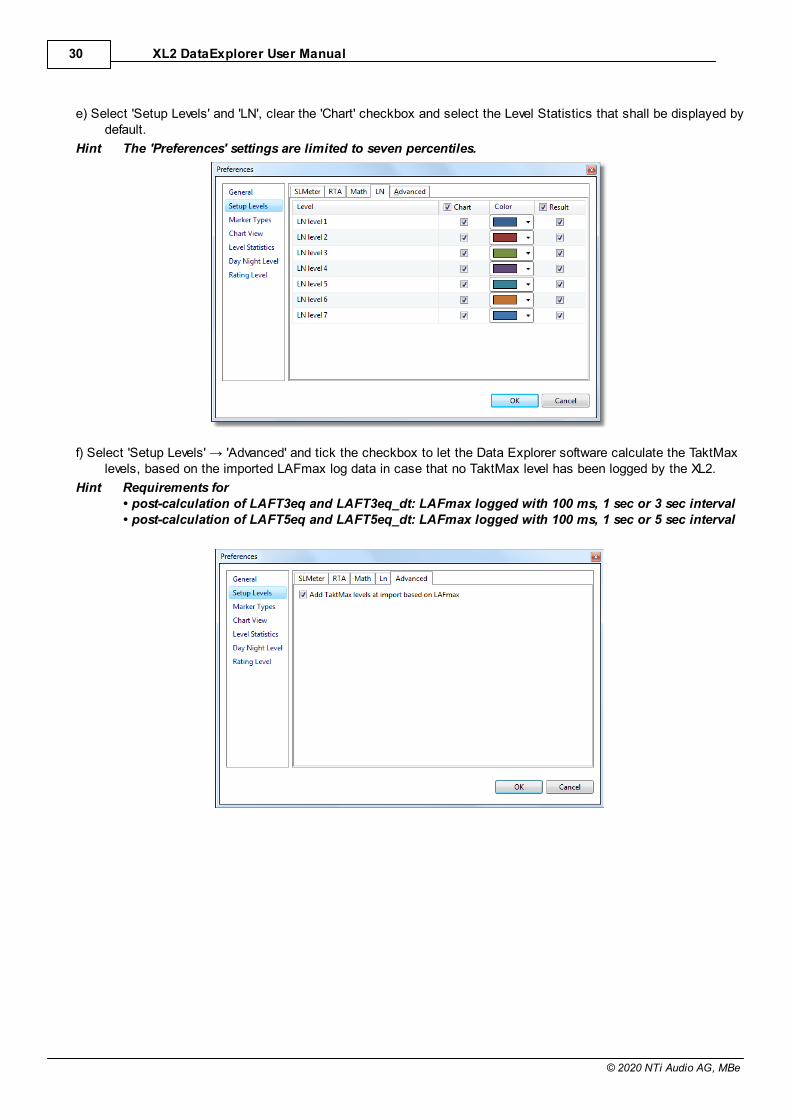
e) Select 'Setup Levels' and 'LN', clear the 'Chart' checkbox and select the Level Statistics that shall be displayed bydefault.
Hint The 'Preferences' settings are limited to seven percentiles.
levels, based on the imported LAFmax log data in case that no TaktMax level has been logged by the XL2.
Hint Requirements for• post-calculation of LAFT3eq and LAFT3eq_dt: LAFmax logged with 100 ms, 1 sec or 3 sec interval• post-calculation of LAFT5eq and LAFT5eq_dt: LAFmax logged with 100 ms, 1 sec or 5 sec interval
Project view 31
© 2020 NTi Audio AG, MBe
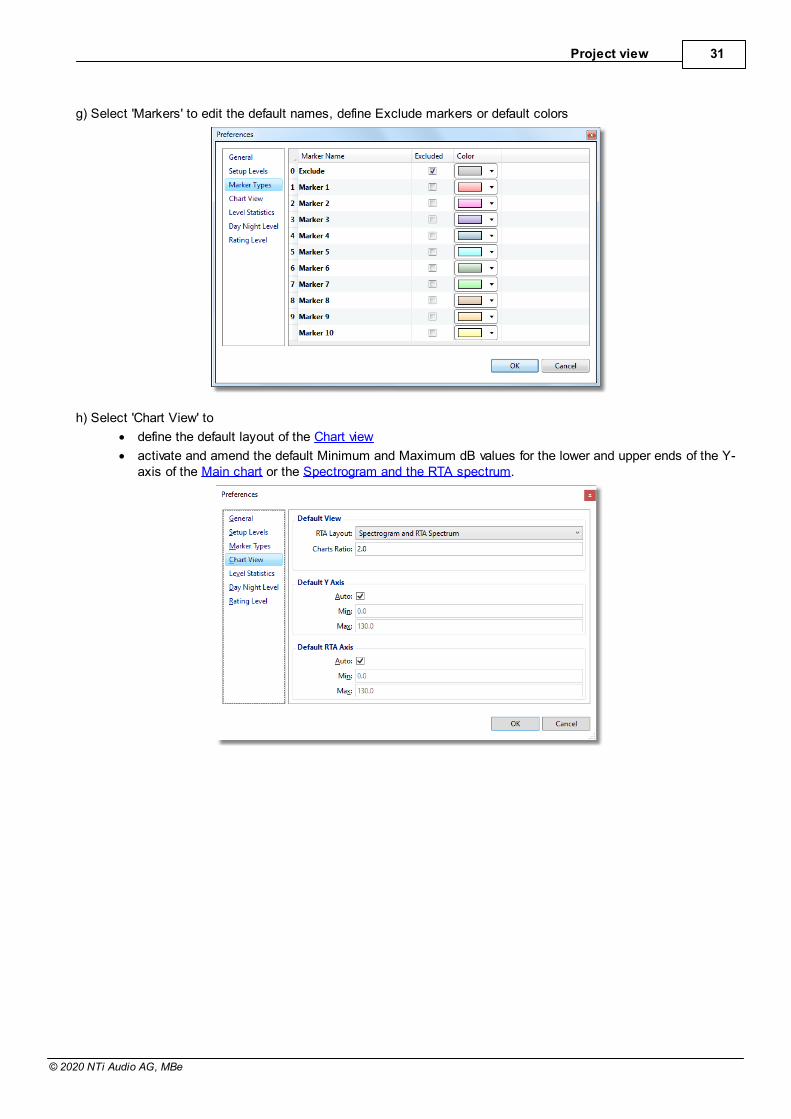
g) Select 'Markers' to edit the default names, define Exclude markers or default colors
h) Select 'Chart View' to
· define the default layout of the Chart view
· activate and amend the default Minimum and Maximum dB values for the lower and upper ends of the Y-axis of the Main chart or the Spectrogram and the RTA spectrum.
XL2 DataExplorer User Manual32
© 2020 NTi Audio AG, MBe
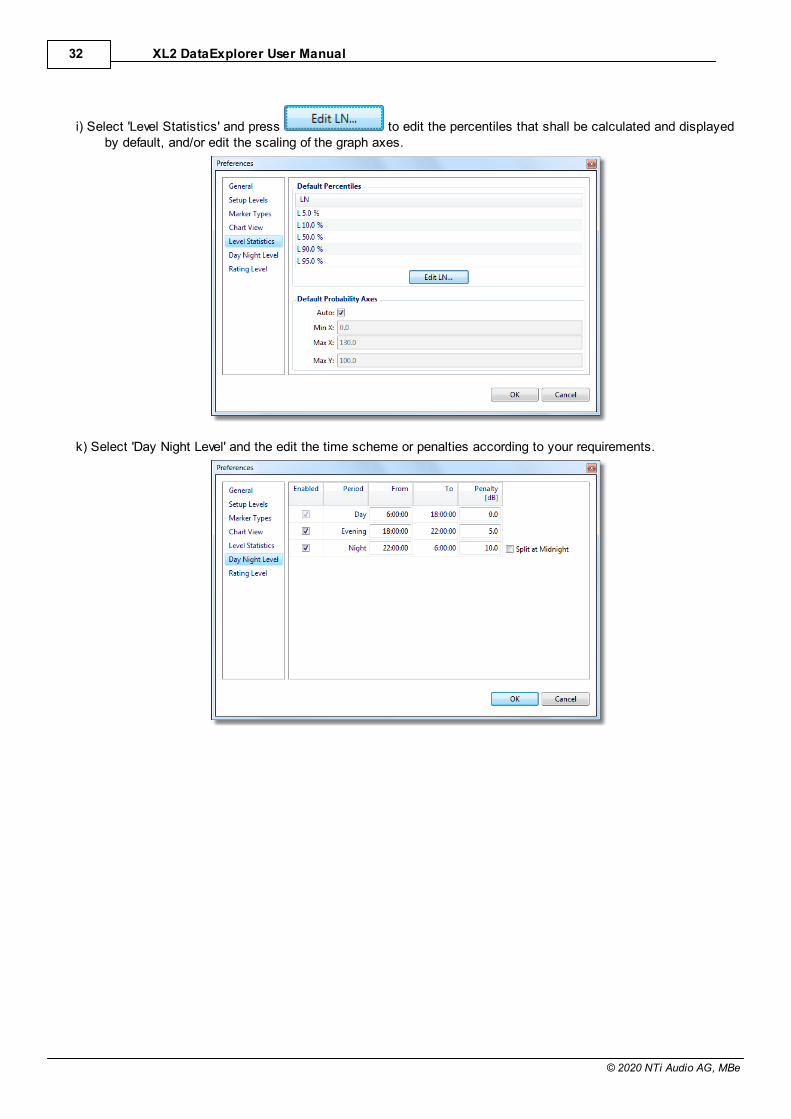
i) Select 'Level Statistics' and press to edit the percentiles that shall be calculated and displayedby default, and/or edit the scaling of the graph axes.
k) Select 'Day Night Level' and the edit the time scheme or penalties according to your requirements.
Project view 33
© 2020 NTi Audio AG, MBe
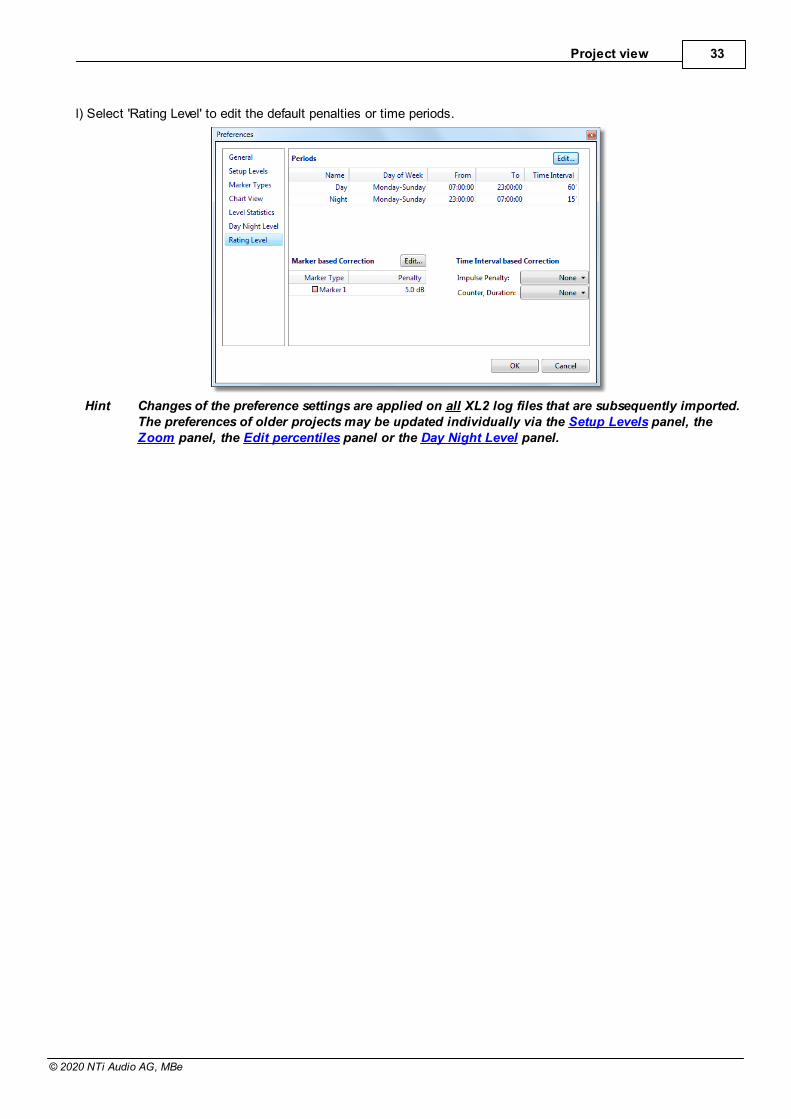
l) Select 'Rating Level' to edit the default penalties or time periods.
Hint Changes of the preference settings are applied on all XL2 log files that are subsequently imported.The preferences of older projects may be updated individually via the Setup Levels panel, theZoom panel, the Edit percentiles panel or the Day Night Level panel.
XL2 DataExplorer User Manual34
© 2020 NTi Audio AG, MBe
2.3 Project info
As soon as an XL2 test file has been imported to the Data Explorer, it becomes a Data Explorer Project with thefollowing content:
· Logged level data
· Recorded audio file (if applicable)
· Project info (see below)
· Events (Markers) created by the XL2 or by the user from within the Data Explorer
· Print preview
· List of level measurements
· Expansion level / layout of Result view (also after exit & re-enter)
Hint To re-establish the original status of a Data Explorer Project after you have amended the data,simply re-import the *.XL2 Test file
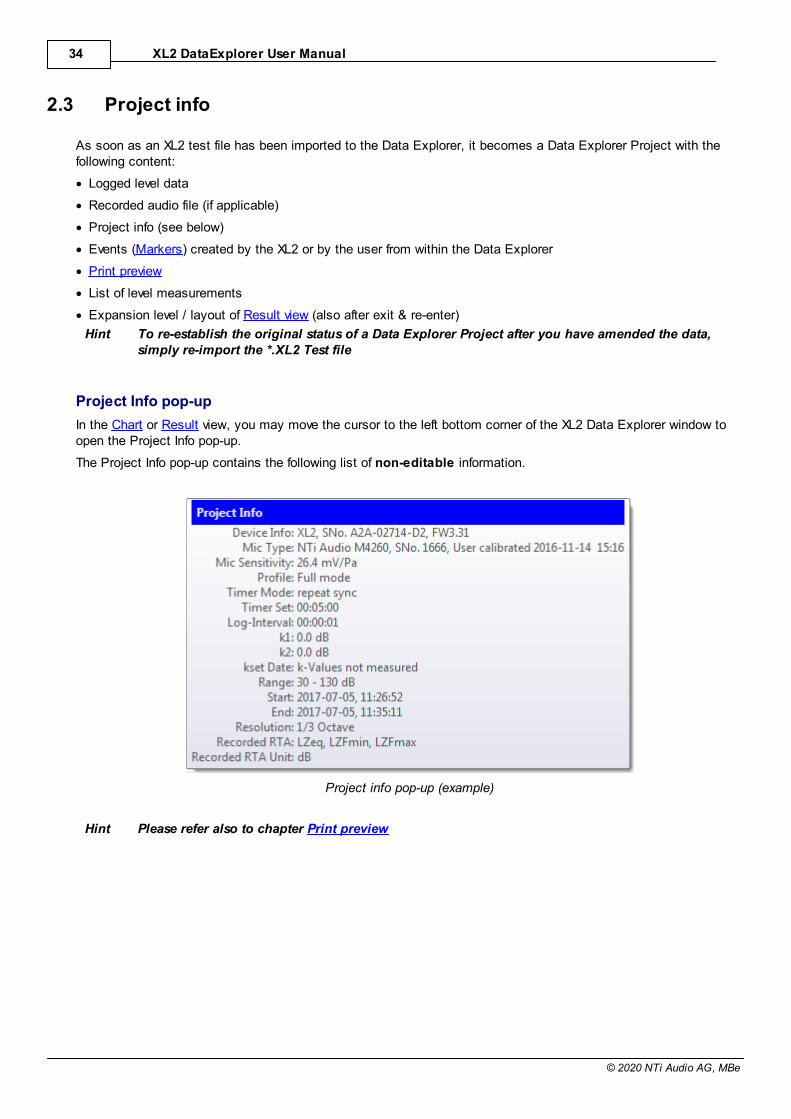
Project Info pop-up
In the Chart or Result view, you may move the cursor to the left bottom corner of the XL2 Data Explorer window toopen the Project Info pop-up.
The Project Info pop-up contains the following list of non-editable information.
Project info pop-up (example)
Hint Please refer also to chapter Print preview

Part
III
XL2 DataExplorer User Manual36
© 2020 NTi Audio AG, MBe
3 Chart view
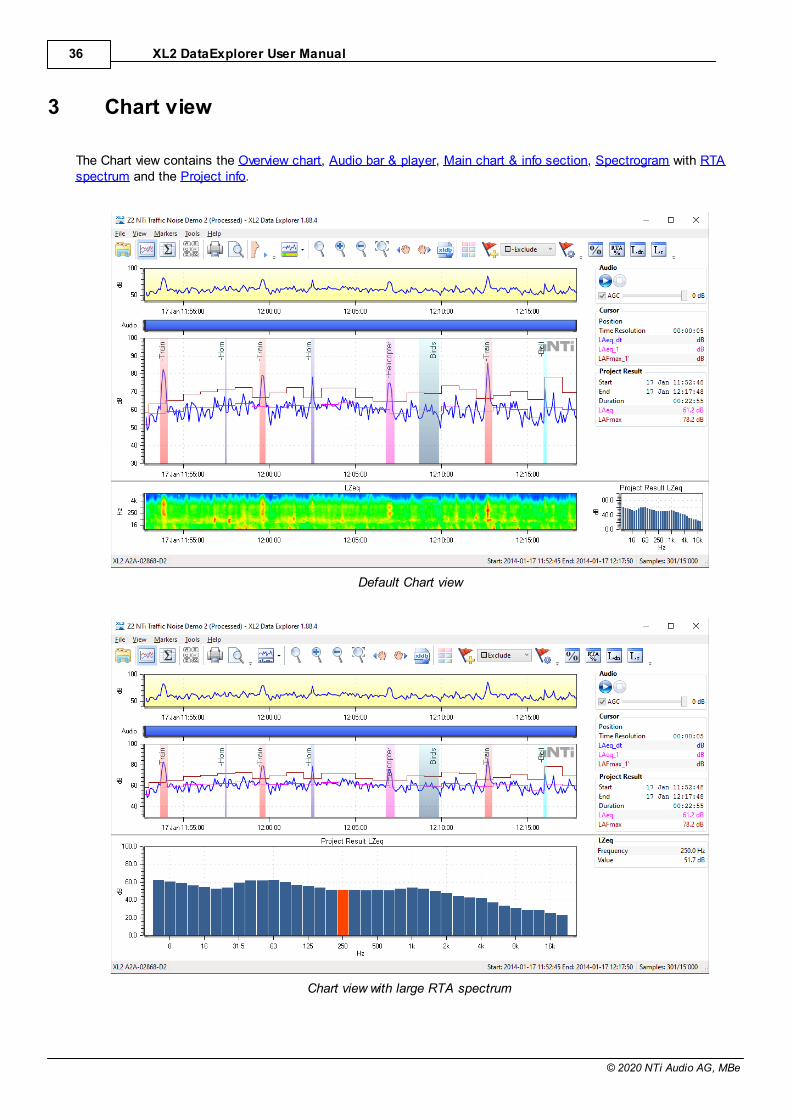
The Chart view contains the Overview chart, Audio bar & player, Main chart & info section, Spectrogram with RTAspectrum and the Project info.
Default Chart view
Chart view with large RTA spectrum
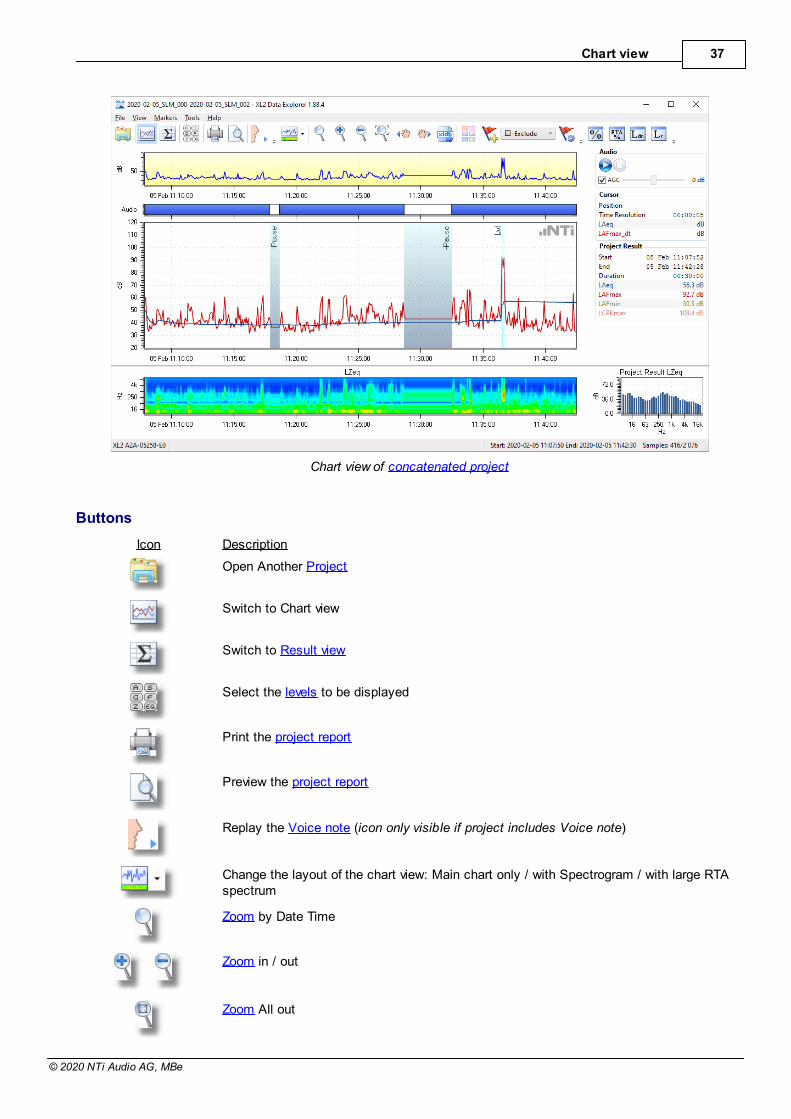
Chart view 37
© 2020 NTi Audio AG, MBe
Chart view of concatenated project
Buttons
Icon Description
Open Another Project
Switch to Chart view
Switch to Result view
Select the levels to be displayed
Print the project report
Preview the project report
Replay the Voice note (icon only visible if project includes Voice note)
Change the layout of the chart view: Main chart only / with Spectrogram / with large RTAspectrum
Zoom by Date Time
Zoom in / out
Zoom All out
XL2 DataExplorer User Manual38
© 2020 NTi Audio AG, MBe
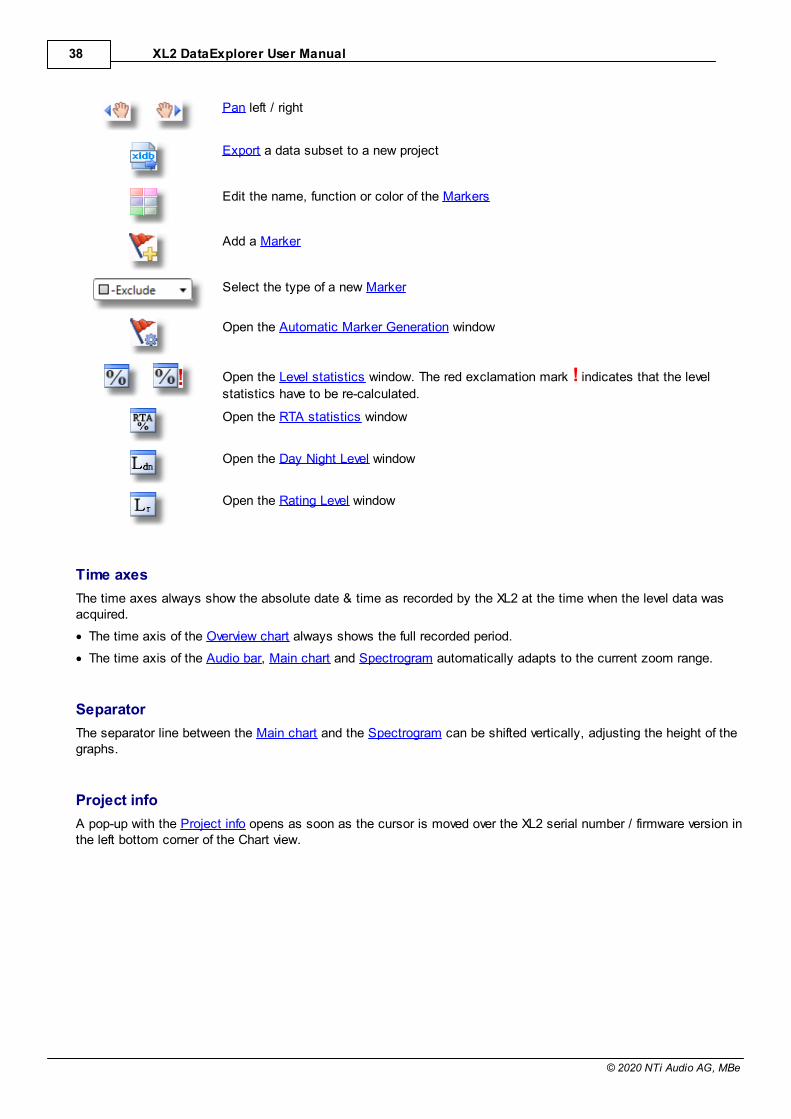
Pan left / right
Export a data subset to a new project
Edit the name, function or color of the Markers
Add a Marker
Select the type of a new Marker
Open the Automatic Marker Generation window
Open the Level statistics window. The red exclamation mark ! indicates that the level
statistics have to be re-calculated.
Open the RTA statistics window
Open the Day Night Level window
Open the Rating Level window
Time axes
The time axes always show the absolute date & time as recorded by the XL2 at the time when the level data wasacquired.
· The time axis of the Overview chart always shows the full recorded period.
· The time axis of the Audio bar, Main chart and Spectrogram automatically adapts to the current zoom range.
Separator
The separator line between the Main chart and the Spectrogram can be shifted vertically, adjusting the height of thegraphs.
Project info
A pop-up with the Project info opens as soon as the cursor is moved over the XL2 serial number / firmware version inthe left bottom corner of the Chart view.
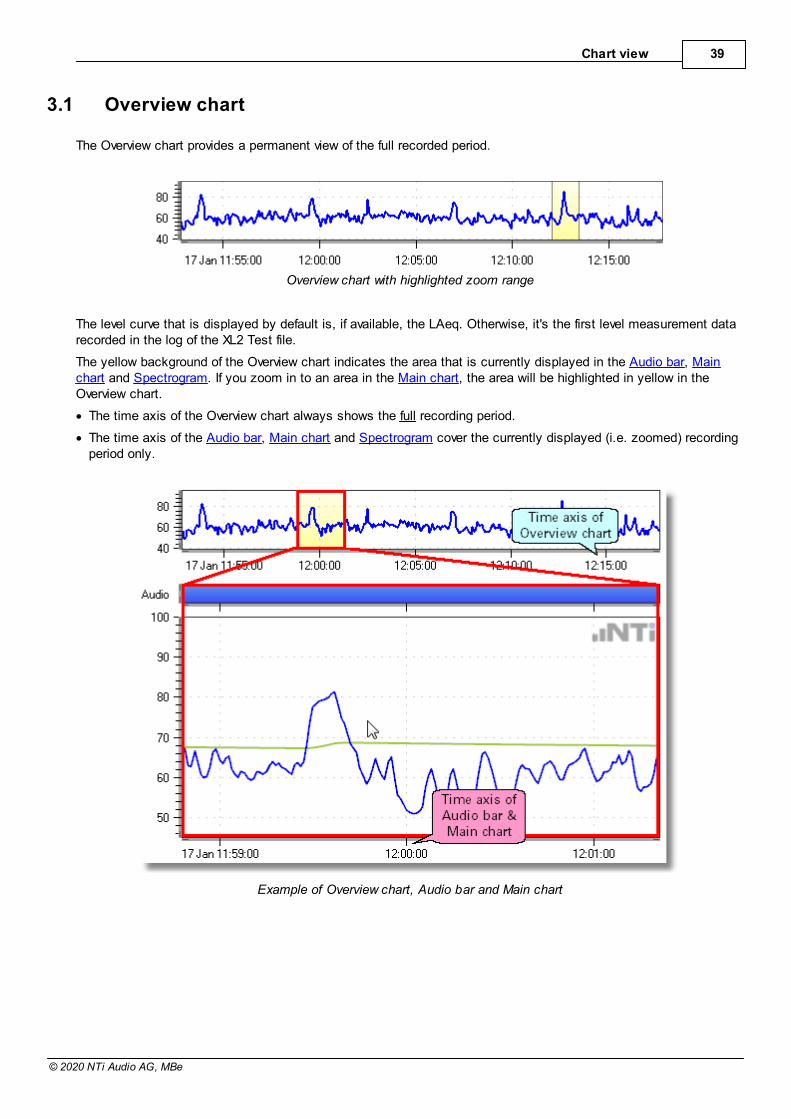
Chart view 39
© 2020 NTi Audio AG, MBe
3.1 Overview chart
The Overview chart provides a permanent view of the full recorded period.
Overview chart with highlighted zoom range
The level curve that is displayed by default is, if available, the LAeq. Otherwise, it's the first level measurement datarecorded in the log of the XL2 Test file.
The yellow background of the Overview chart indicates the area that is currently displayed in the Audio bar, Mainchart and Spectrogram. If you zoom in to an area in the Main chart, the area will be highlighted in yellow in theOverview chart.
· The time axis of the Overview chart always shows the full recording period.
· The time axis of the Audio bar, Main chart and Spectrogram cover the currently displayed (i.e. zoomed) recordingperiod only.
Example of Overview chart, Audio bar and Main chart
XL2 DataExplorer User Manual40
© 2020 NTi Audio AG, MBe
3.2 Audio bar & player
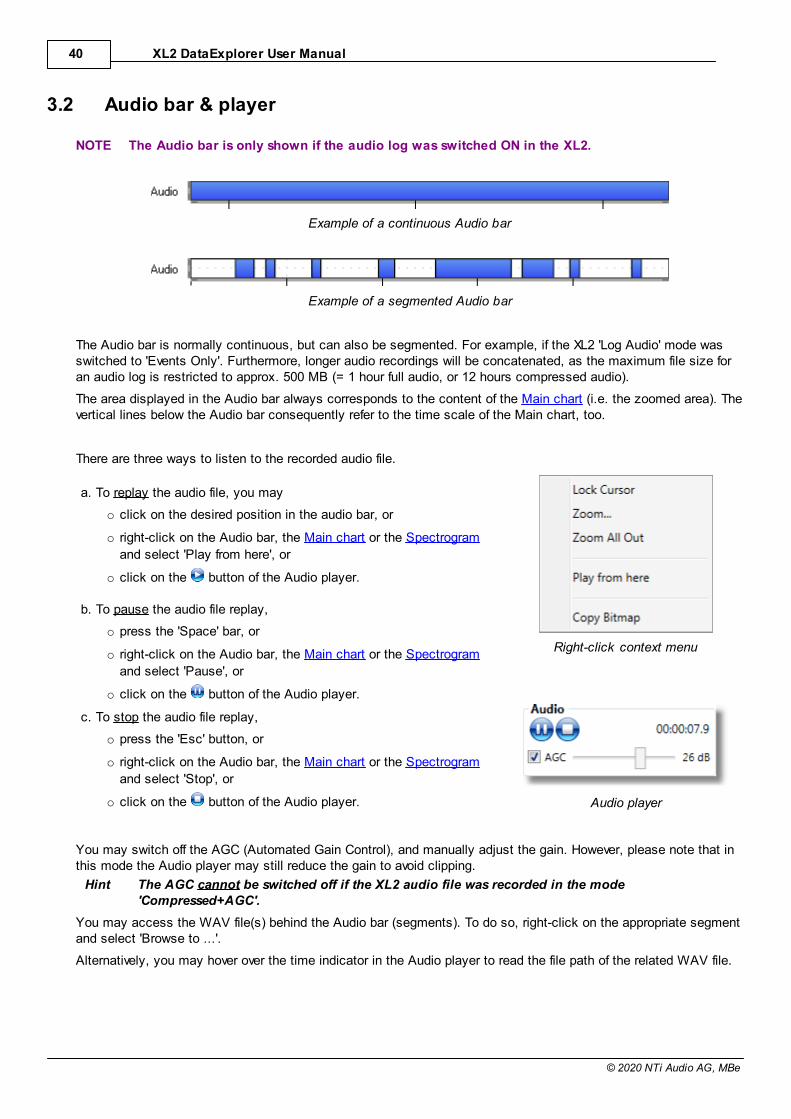
NOTE The Audio bar is only shown if the audio log was switched ON in the XL2.
Example of a continuous Audio bar
Example of a segmented Audio bar
The Audio bar is normally continuous, but can also be segmented. For example, if the XL2 'Log Audio' mode wasswitched to 'Events Only'. Furthermore, longer audio recordings will be concatenated, as the maximum file size foran audio log is restricted to approx. 500 MB (= 1 hour full audio, or 12 hours compressed audio).
The area displayed in the Audio bar always corresponds to the content of the Main chart (i.e. the zoomed area). Thevertical lines below the Audio bar consequently refer to the time scale of the Main chart, too.
There are three ways to listen to the recorded audio file.
a. To replay the audio file, you may
o click on the desired position in the audio bar, or
o right-click on the Audio bar, the Main chart or the Spectrogram
and select 'Play from here', or
o click on the button of the Audio player.
Right-click context menu
Audio player
b. To pause the audio file replay,
o press the 'Space' bar, or
o right-click on the Audio bar, the Main chart or the Spectrogram
and select 'Pause', or
o click on the button of the Audio player.
c. To stop the audio file replay,
o press the 'Esc' button, or
o right-click on the Audio bar, the Main chart or the Spectrogram
and select 'Stop', or
o click on the button of the Audio player.
You may switch off the AGC (Automated Gain Control), and manually adjust the gain. However, please note that inthis mode the Audio player may still reduce the gain to avoid clipping.
Hint The AGC cannot be switched off if the XL2 audio file was recorded in the mode'Compressed+AGC'.
You may access the WAV file(s) behind the Audio bar (segments). To do so, right-click on the appropriate segmentand select 'Browse to ...'.
Alternatively, you may hover over the time indicator in the Audio player to read the file path of the related WAV file.
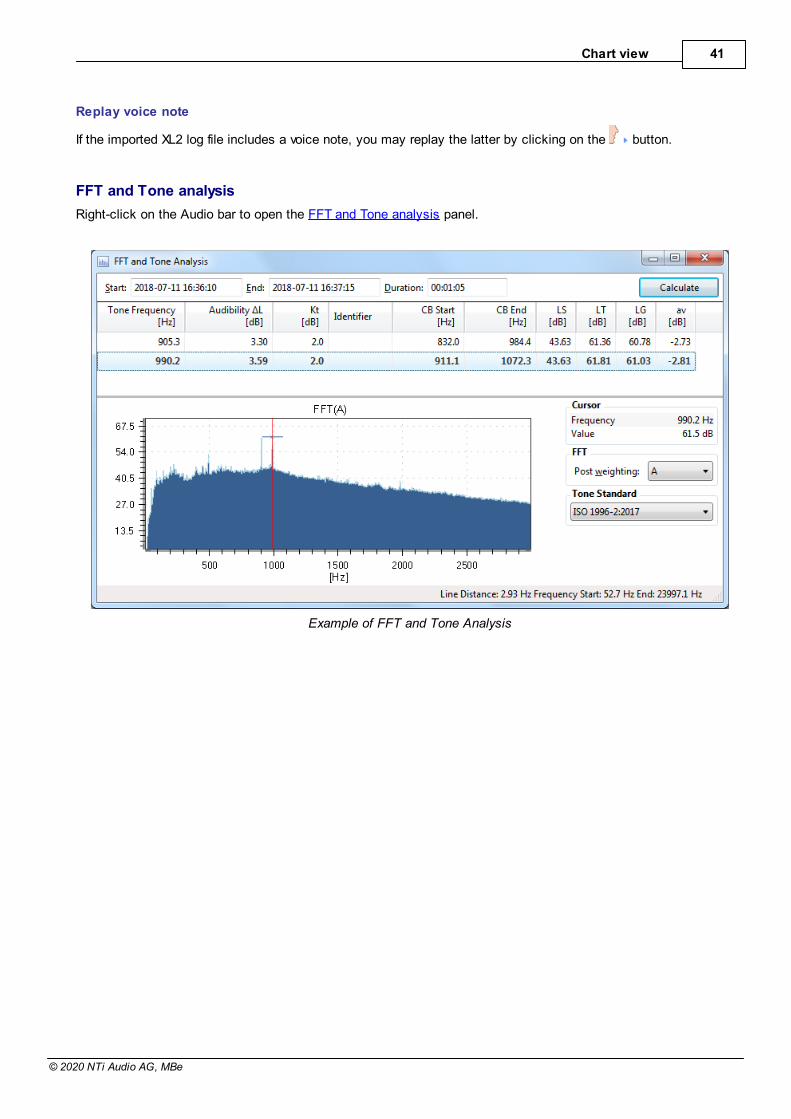
Chart view 41
© 2020 NTi Audio AG, MBe
Replay voice note
If the imported XL2 log file includes a voice note, you may replay the latter by clicking on the button.
FFT and Tone analysis
Right-click on the Audio bar to open the FFT and Tone analysis panel.
Example of FFT and Tone Analysis
XL2 DataExplorer User Manual42
© 2020 NTi Audio AG, MBe
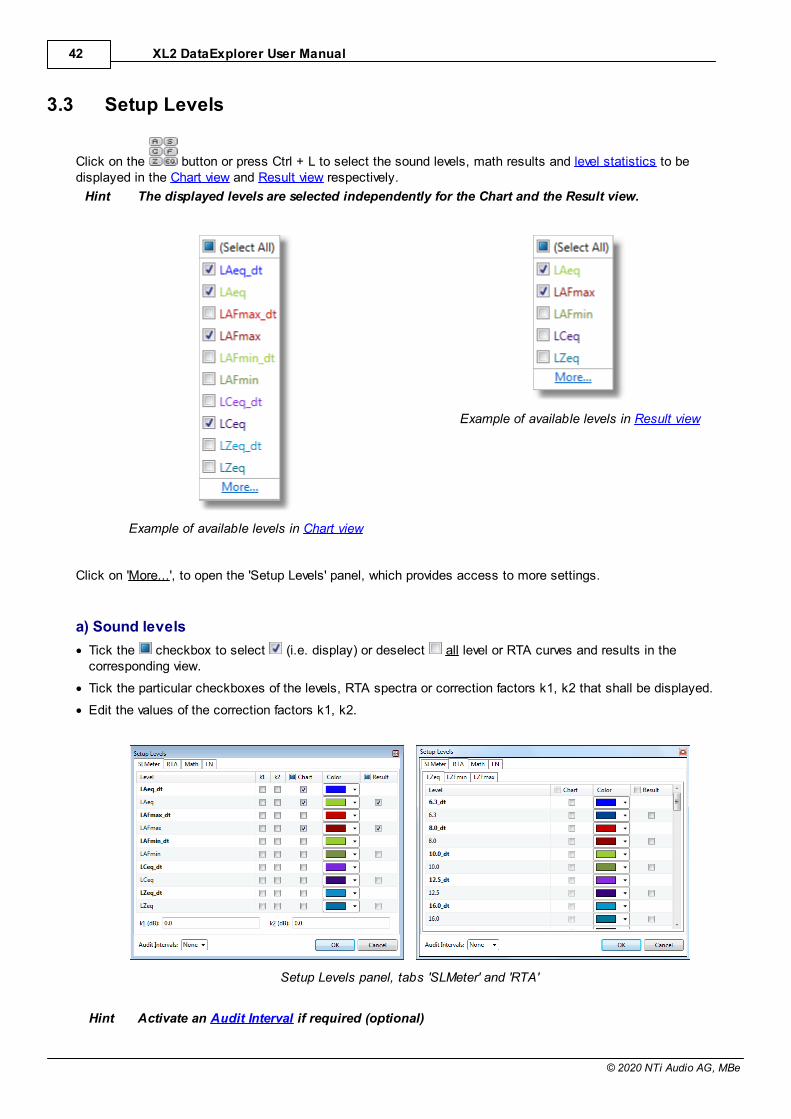
3.3 Setup Levels
Click on the button or press Ctrl + L to select the sound levels, math results and level statistics to bedisplayed in the Chart view and Result view respectively.
Hint The displayed levels are selected independently for the Chart and the Result view.
Example of available levels in Chart view
Example of available levels in Result view
Click on 'More...', to open the 'Setup Levels' panel, which provides access to more settings.
a) Sound levels
· Tick the checkbox to select (i.e. display) or deselect all level or RTA curves and results in thecorresponding view.
· Tick the particular checkboxes of the levels, RTA spectra or correction factors k1, k2 that shall be displayed.
· Edit the values of the correction factors k1, k2.
Setup Levels panel, tabs 'SLMeter' and 'RTA'
Hint Activate an Audit Interval if required (optional)
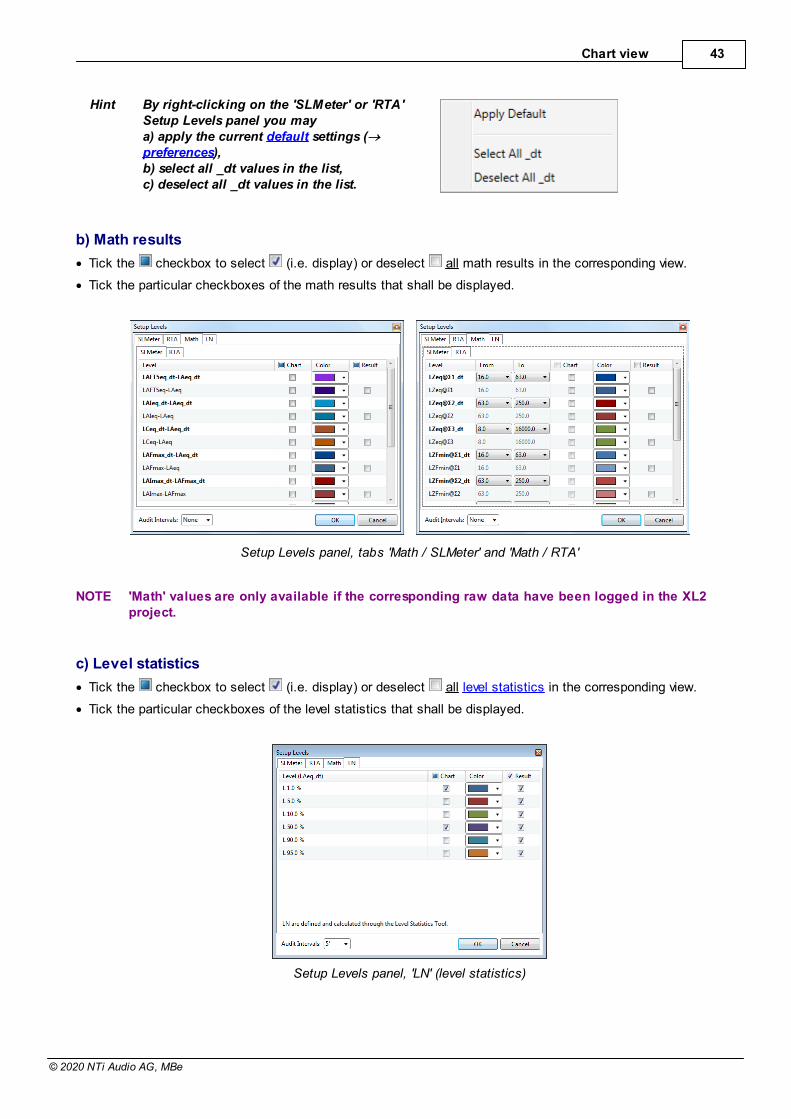
Chart view 43
© 2020 NTi Audio AG, MBe
Hint By right-clicking on the 'SLMeter' or 'RTA'Setup Levels panel you maya) apply the current default settings (®preferences),b) select all _dt values in the list,c) deselect all _dt values in the list.
b) Math results
· Tick the checkbox to select (i.e. display) or deselect all math results in the corresponding view.
· Tick the particular checkboxes of the math results that shall be displayed.
Setup Levels panel, tabs 'Math / SLMeter' and 'Math / RTA'
NOTE 'Math' values are only available if the corresponding raw data have been logged in the XL2project.
c) Level statistics
· Tick the checkbox to select (i.e. display) or deselect all level statistics in the corresponding view.
· Tick the particular checkboxes of the level statistics that shall be displayed.
Setup Levels panel, 'LN' (level statistics)
XL2 DataExplorer User Manual44
© 2020 NTi Audio AG, MBe
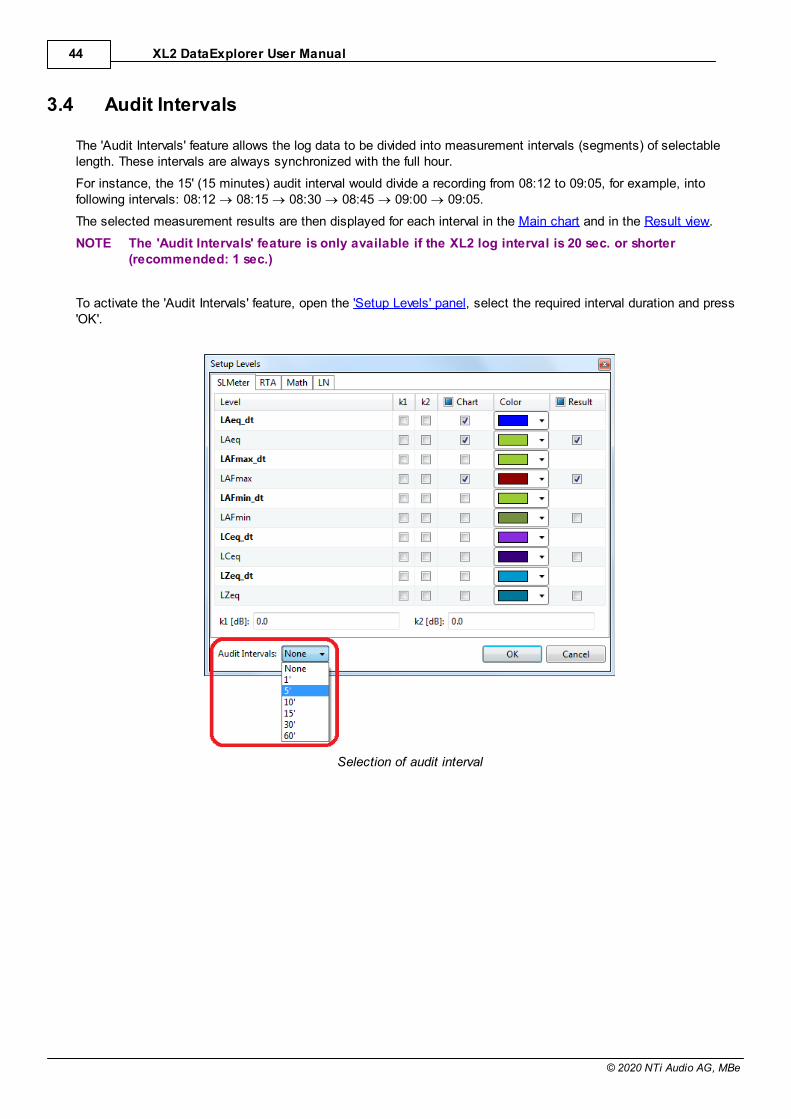
3.4 Audit Intervals
The 'Audit Intervals' feature allows the log data to be divided into measurement intervals (segments) of selectablelength. These intervals are always synchronized with the full hour.
For instance, the 15' (15 minutes) audit interval would divide a recording from 08:12 to 09:05, for example, intofollowing intervals: 08:12 ® 08:15 ® 08:30 ® 08:45 ® 09:00 ® 09:05.
The selected measurement results are then displayed for each interval in the Main chart and in the Result view.
NOTE The 'Audit Intervals' feature is only available if the XL2 log interval is 20 sec. or shorter(recommended: 1 sec.)
To activate the 'Audit Intervals' feature, open the 'Setup Levels' panel, select the required interval duration and press'OK'.
Selection of audit interval
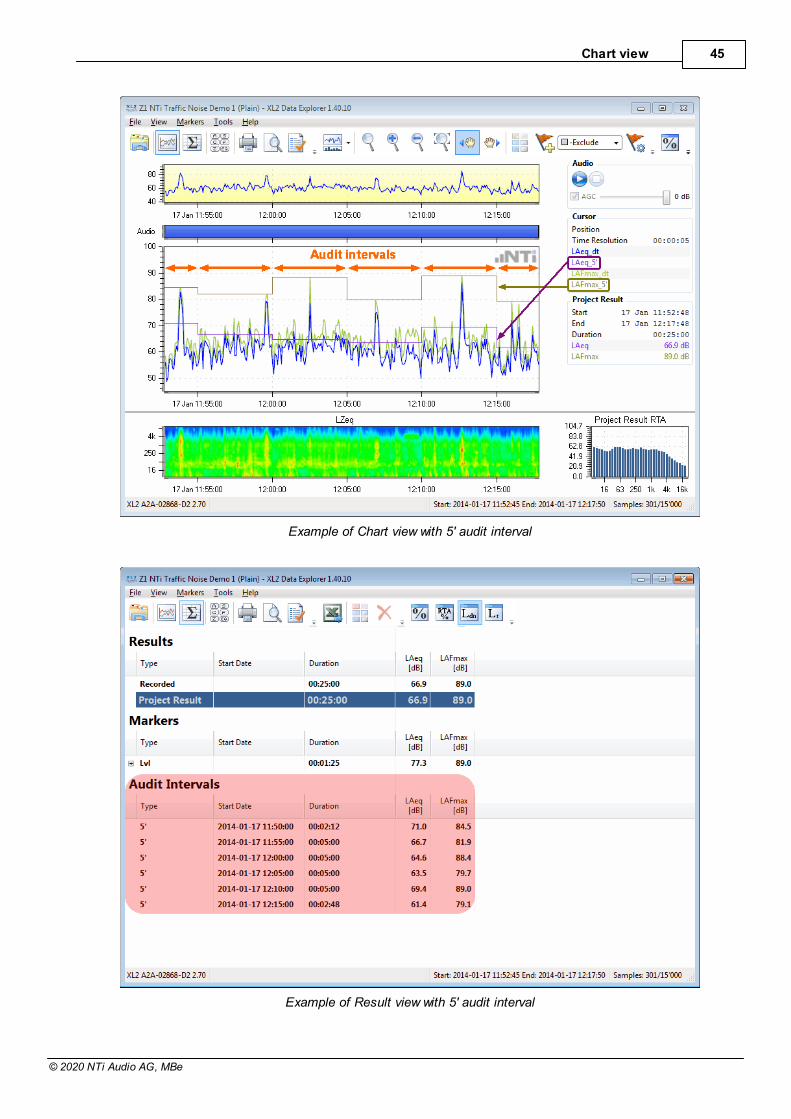
Chart view 45
© 2020 NTi Audio AG, MBe
Example of Chart view with 5' audit interval
Example of Result view with 5' audit interval
XL2 DataExplorer User Manual46
© 2020 NTi Audio AG, MBe
3.5 Main chart, Info section
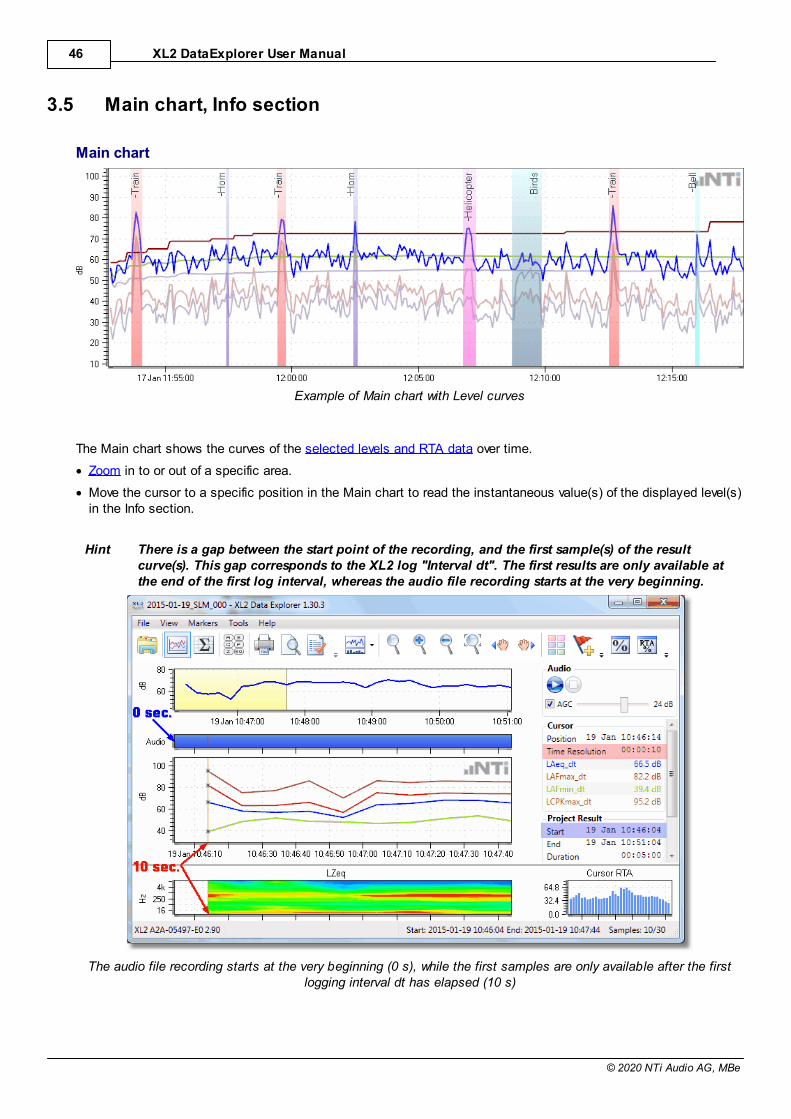
Main chart
Example of Main chart with Level curves
The Main chart shows the curves of the selected levels and RTA data over time.
· Zoom in to or out of a specific area.
· Move the cursor to a specific position in the Main chart to read the instantaneous value(s) of the displayed level(s)in the Info section.
Hint There is a gap between the start point of the recording, and the first sample(s) of the resultcurve(s). This gap corresponds to the XL2 log "Interval dt". The first results are only available atthe end of the first log interval, whereas the audio file recording starts at the very beginning.
The audio file recording starts at the very beginning (0 s), while the first samples are only available after the firstlogging interval dt has elapsed (10 s)
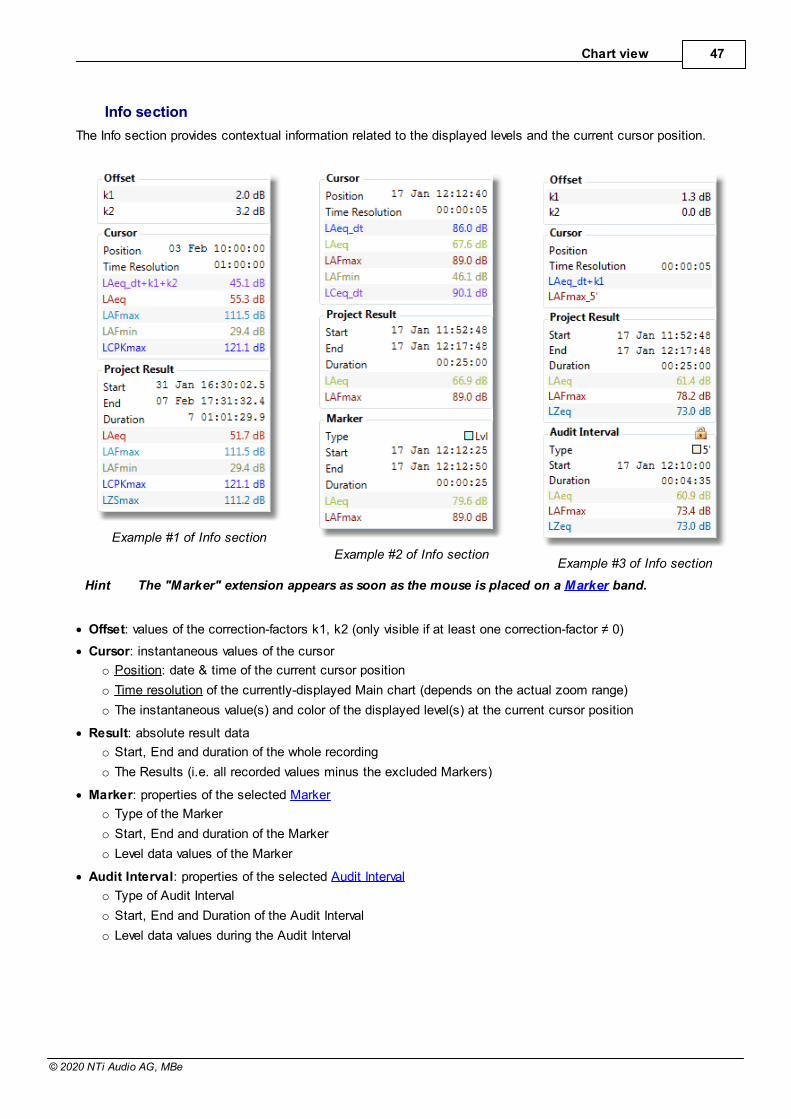
Chart view 47
© 2020 NTi Audio AG, MBe
Info section
The Info section provides contextual information related to the displayed levels and the current cursor position.
Example #1 of Info section
Example #2 of Info sectionExample #3 of Info section
Hint The "Marker" extension appears as soon as the mouse is placed on a Marker band.
· Offset
· Cursor: instantaneous values of the cursor
o Position: date & time of the current cursor position
o Time resolution of the currently-displayed Main chart (depends on the actual zoom range)
o The instantaneous value(s) and color of the displayed level(s) at the current cursor position
· Result: absolute result data
o Start, End and duration of the whole recording
o The Results (i.e. all recorded values minus the excluded Markers)
· Marker: properties of the selected Marker
o Type of the Marker
o Start, End and duration of the Marker
o Level data values of the Marker
· Audit Interval: properties of the selected Audit Interval
o Type of Audit Interval
o Start, End and Duration of the Audit Interval
o Level data values during the Audit Interval

XL2 DataExplorer User Manual48
© 2020 NTi Audio AG, MBe
3.6 Spectrogram, RTA spectrum
The chart view allows to show the Spectrogram or the RTA spectrum via the display modes and .
Right-click on the Spectrogram or the RTA spectrum to select
· RTA Weighting: A, C or Z
· RTA based on Leq, Lmax or Lmin
NOTE The Spectrogram and the RTA spectrum are only available if "Add Spectra" was set to "Leq" orto "Leq, Lmax, Lmin" in the XL2 during the data logging.
Spectrogram
The Spectrogram displays the logged spectra of the XL2 test (i.e. sound level at each frequency over time).
· X-axis: time
· Y-axis: frequency
· Colors: red represents the highest levels, through orange, yellow, green, cyan and blue, to black representing thelowest levels
Example of Spectrogram
Hint Right-click in the Spectrogram and select 'Show Legend' to show the color assignments.
Legend
Hint You may edit the RTA-axis via the Zoom panel and thus define an absolute level « color scheme.This may facilitate the comparison of the spectra from different projects, for example.
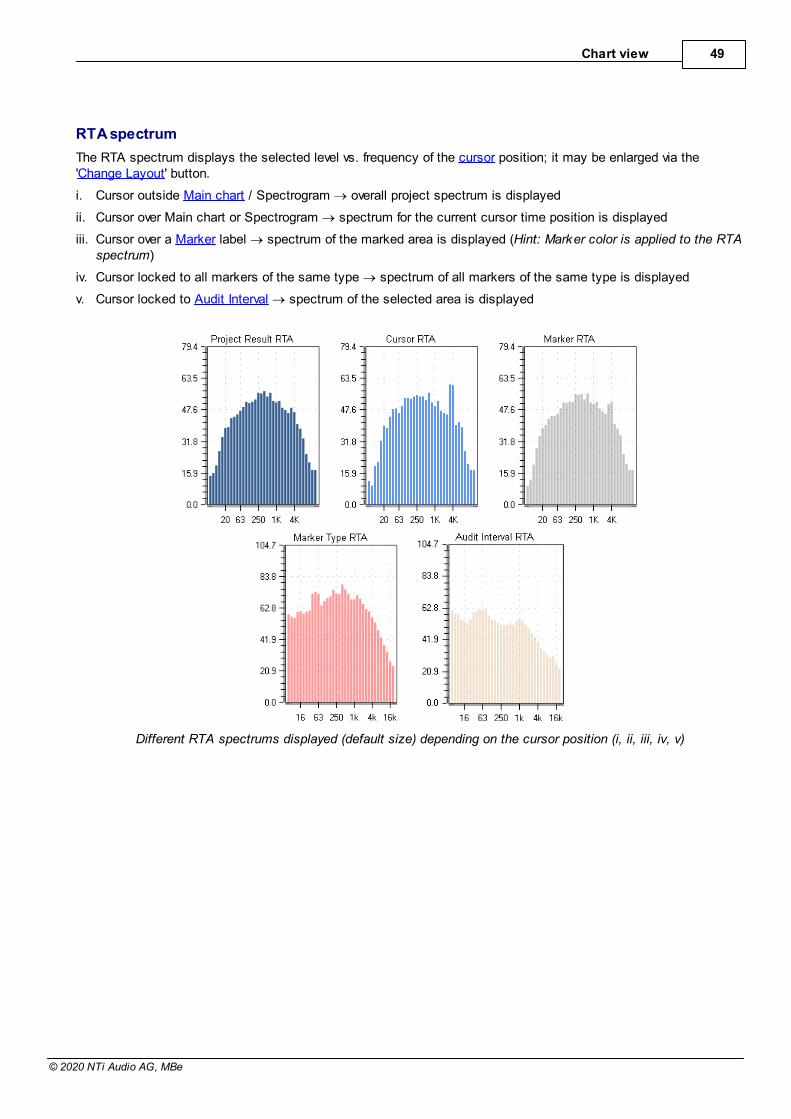
Chart view 49
© 2020 NTi Audio AG, MBe
RTA spectrum
The RTA spectrum displays the selected level vs. frequency of the cursor position; it may be enlarged via the'Change Layout' button.
i. Cursor outside Main chart / Spectrogram ® overall project spectrum is displayed
ii. Cursor over Main chart or Spectrogram ® spectrum for the current cursor time position is displayed
iii. Cursor over a Marker label ® spectrum of the marked area is displayed (Hint: Marker color is applied to the RTAspectrum)
iv. Cursor locked to all markers of the same type ® spectrum of all markers of the same type is displayed
v. Cursor locked to Audit Interval ® spectrum of the selected area is displayed
Different RTA spectrums displayed (default size) depending on the cursor position (i, ii, iii, iv, v)
XL2 DataExplorer User Manual50
© 2020 NTi Audio AG, MBe
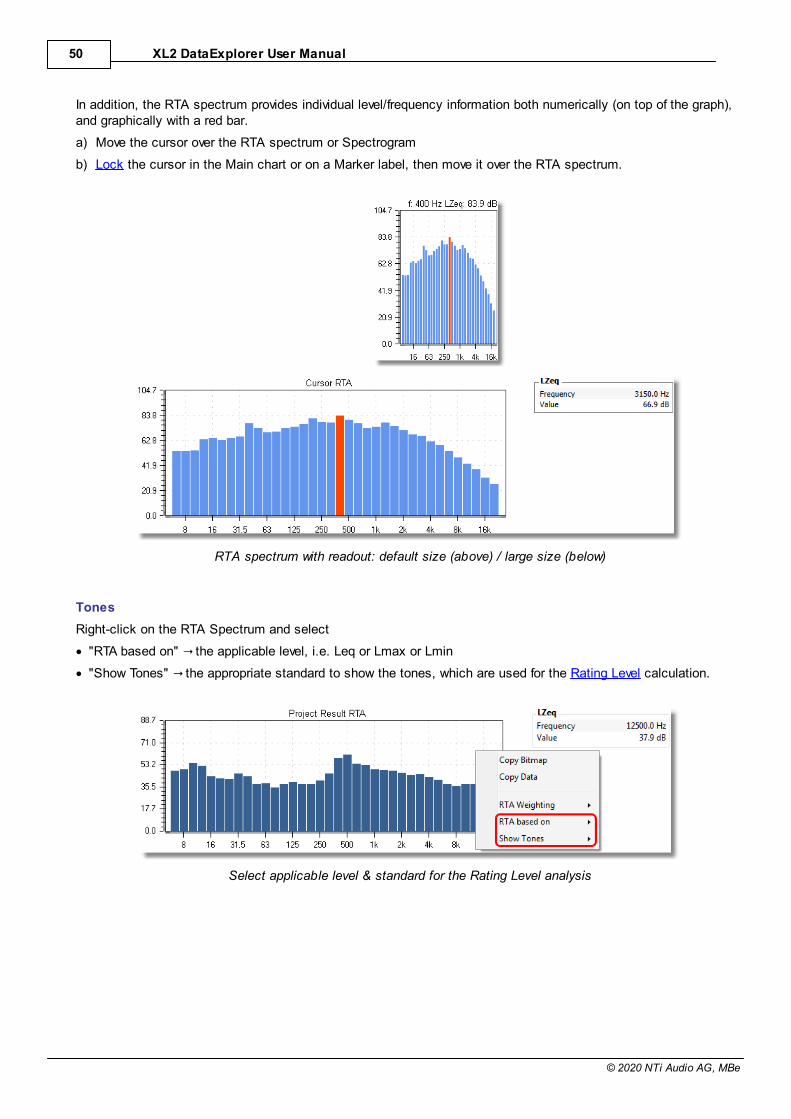
In addition, the RTA spectrum provides individual level/frequency information both numerically (on top of the graph),and graphically with a red bar.
a) Move the cursor over the RTA spectrum or Spectrogram
b) Lock the cursor in the Main chart or on a Marker label, then move it over the RTA spectrum.
RTA spectrum with readout: default size (above) / large size (below)
Tones
Right-click on the RTA Spectrum and select
· "RTA based on" the applicable level, i.e. Leq or Lmax or Lmin
· "Show Tones" the appropriate standard to show the tones, which are used for the Rating Level calculation.
Select applicable level & standard for the Rating Level analysis
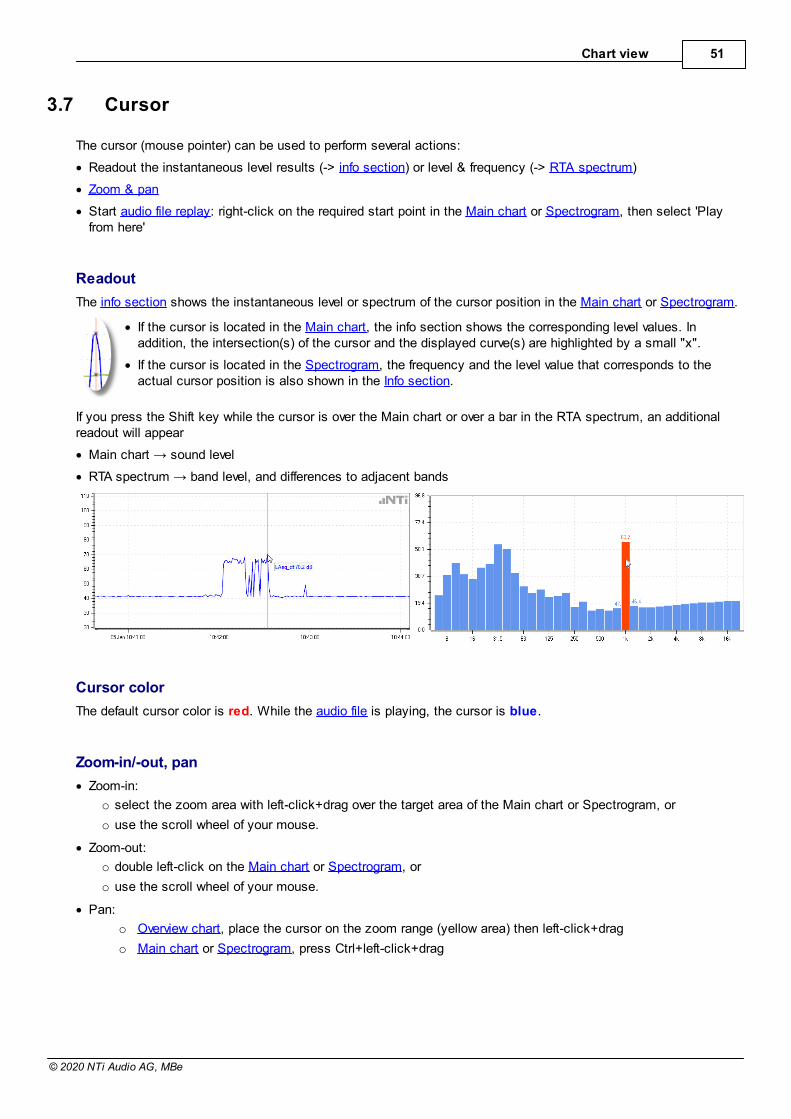
Chart view 51
© 2020 NTi Audio AG, MBe
3.7 Cursor
The cursor (mouse pointer) can be used to perform several actions:
· Readout the instantaneous level results (-> info section) or level & frequency (-> RTA spectrum)
· Zoom & pan
· Start audio file replay: right-click on the required start point in the Main chart or Spectrogram, then select 'Playfrom here'
Readout
The info section shows the instantaneous level or spectrum of the cursor position in the Main chart or Spectrogram.
· If the cursor is located in the Main chart, the info section shows the corresponding level values. Inaddition, the intersection(s) of the cursor and the displayed curve(s) are highlighted by a small "x".
· If the cursor is located in the Spectrogram, the frequency and the level value that corresponds to theactual cursor position is also shown in the Info section.
If you press the Shift key while the cursor is over the Main chart or over a bar in the RTA spectrum, an additionalreadout will appear
·
·
Cursor color
The default cursor color is red. While the audio file is playing, the cursor is blue.
Zoom-in/-out, pan
· Zoom-in:
o select the zoom area with left-click+drag over the target area of the Main chart or Spectrogram, or
o use the scroll wheel of your mouse.
· Zoom-out:
o double left-click on the Main chart or Spectrogram, or
o use the scroll wheel of your mouse.
· Pan:
o Overview chart, place the cursor on the zoom range (yellow area) then left-click+drag
o Main chart or Spectrogram, press Ctrl+left-click+drag
XL2 DataExplorer User Manual52
© 2020 NTi Audio AG, MBe
Lock cursor
The cursor position can be locked by right-clicking in the Main chart or Spectrogram, or over a Marker label, or in anAudit Interval. The RTA spectrum consequently shows the spectrum at the corresponding cursor position, or of themarked area.
Lock cursor ... ® RTA spectrum
a) ... in the Main chart ® of the specific cursor position
b) ... to a single Marker ® of the marked area
c) ... to all Markers of a specific type ® of the combined Marker areas
d) ... in the Spectrogram ® of the specific cursor position
e) ... to an Audit Interval ® of the marked area
Hint A locked cursor is indicated by a in the Info section.When printing a report, the values of the locked cursor appear in the printout below the charts.
To unlock the cursor,
· press Esc
· click on in the Info section
· right-click and select "Lock cursor" again
· lock the cursor at a new position
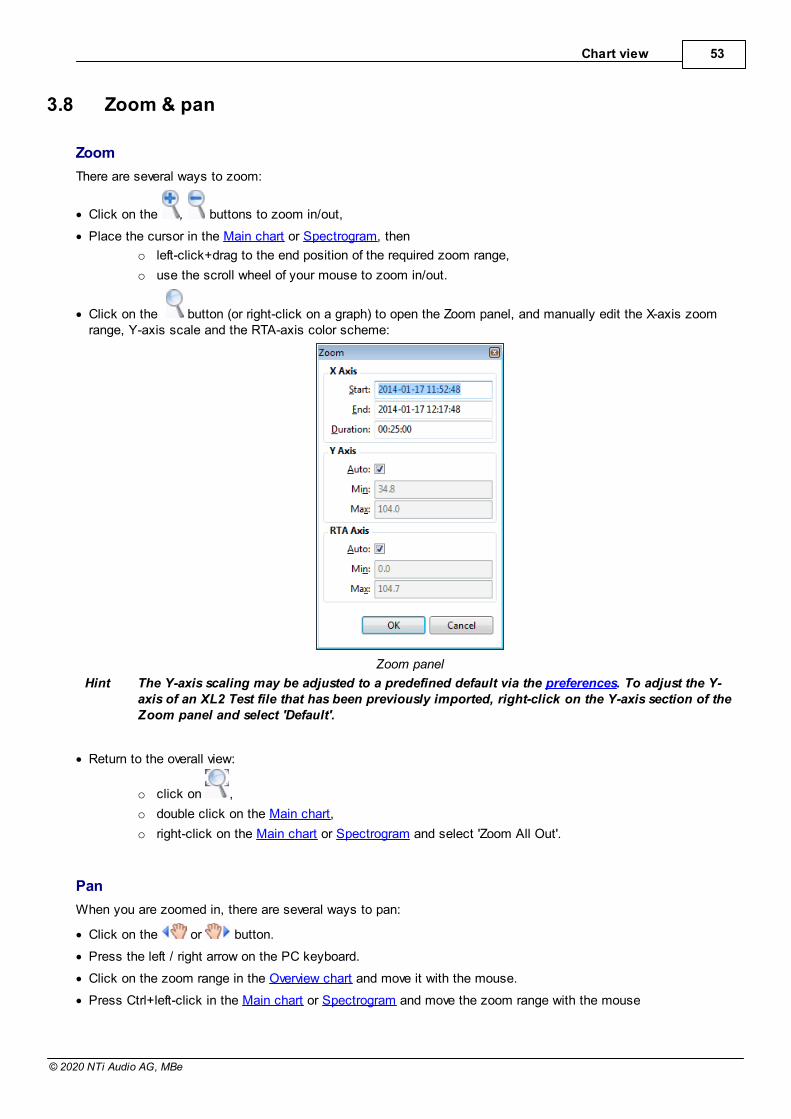
Chart view 53
© 2020 NTi Audio AG, MBe
3.8 Zoom & pan
Zoom
There are several ways to zoom:
· Click on the , buttons to zoom in/out,
· Place the cursor in the Main chart or Spectrogram, then
o left-click+drag to the end position of the required zoom range,
o use the scroll wheel of your mouse to zoom in/out.
· Click on the button (or right-click on a graph) to open the Zoom panel, and manually edit the X-axis zoomrange, Y-axis scale and the RTA-axis color scheme:
Zoom panel
Hint The Y-axis scaling may be adjusted to a predefined default via the preferences. To adjust the Y-axis of an XL2 Test file that has been previously imported, right-click on the Y-axis section of theZoom panel and select 'Default'.
· Return to the overall view:
o click on ,
o double click on the Main chart,
o right-click on the Main chart or Spectrogram and select 'Zoom All Out'.
Pan
When you are zoomed in, there are several ways to pan:
· Click on the or button.
· Press the left / right arrow on the PC keyboard.
· Click on the zoom range in the Overview chart and move it with the mouse.
· Press Ctrl+left-click in the Main chart or Spectrogram and move the zoom range with the mouse
XL2 DataExplorer User Manual54
© 2020 NTi Audio AG, MBe
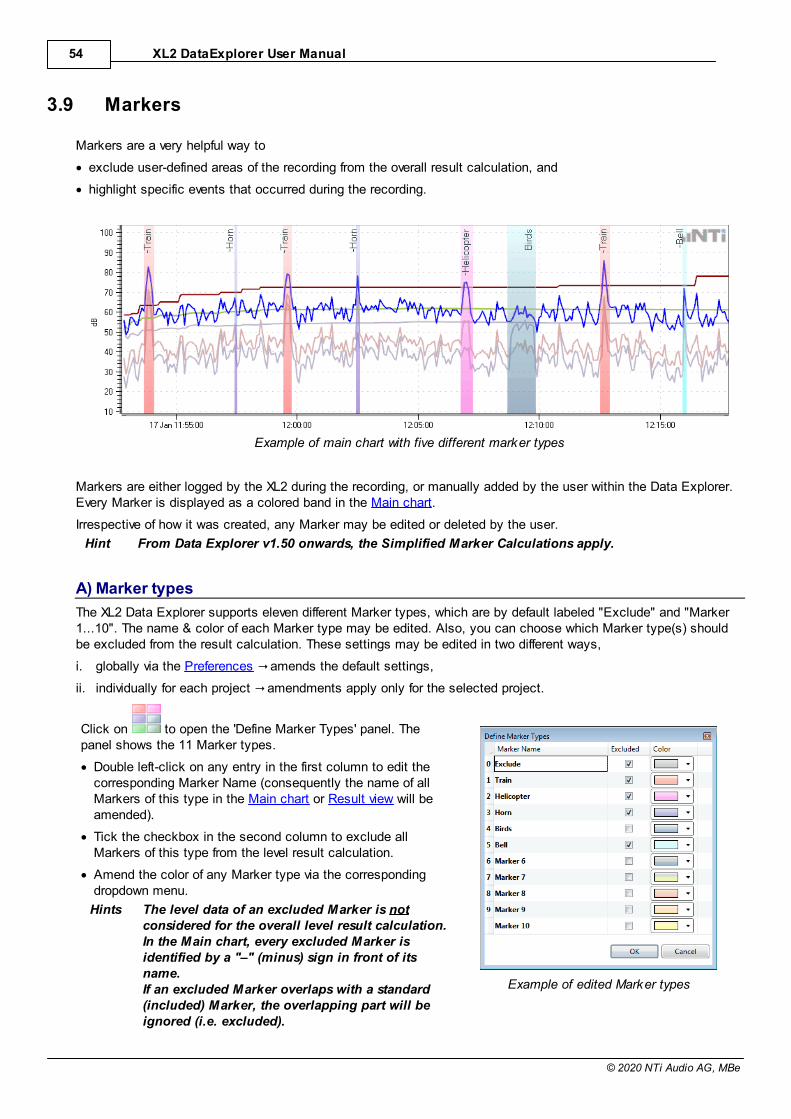
3.9 Markers
Markers are a very helpful way to
· exclude user-defined areas of the recording from the overall result calculation, and
· highlight specific events that occurred during the recording.
Example of main chart with five different marker types
Markers are either logged by the XL2 during the recording, or manually added by the user within the Data Explorer.Every Marker is displayed as a colored band in the Main chart.
Irrespective of how it was created, any Marker may be edited or deleted by the user.
Hint From Data Explorer v1.50 onwards, the Simplified Marker Calculations apply.
A) Marker types
The XL2 Data Explorer supports eleven different Marker types, which are by default labeled "Exclude" and "Marker1...10". The name & color of each Marker type may be edited. Also, you can choose which Marker type(s) shouldbe excluded from the result calculation. These settings may be edited in two different ways,
i. globally via the Preferences amends the default settings,
ii. individually for each project amendments apply only for the selected project.
Click on to open the 'Define Marker Types' panel. Thepanel shows the 11 Marker types.
· Double left-click on any entry in the first column to edit thecorresponding Marker Name (consequently the name of allMarkers of this type in the Main chart or Result view will beamended).
· Tick the checkbox in the second column to exclude allMarkers of this type from the level result calculation.
· Amend the color of any Marker type via the correspondingdropdown menu.
Hints The level data of an excluded Marker is notconsidered for the overall level result calculation.In the Main chart, every excluded Marker isidentified by a "–" (minus) sign in front of itsname.If an excluded Marker overlaps with a standard(included) Marker, the overlapping part will beignored (i.e. excluded).
Example of edited Marker types
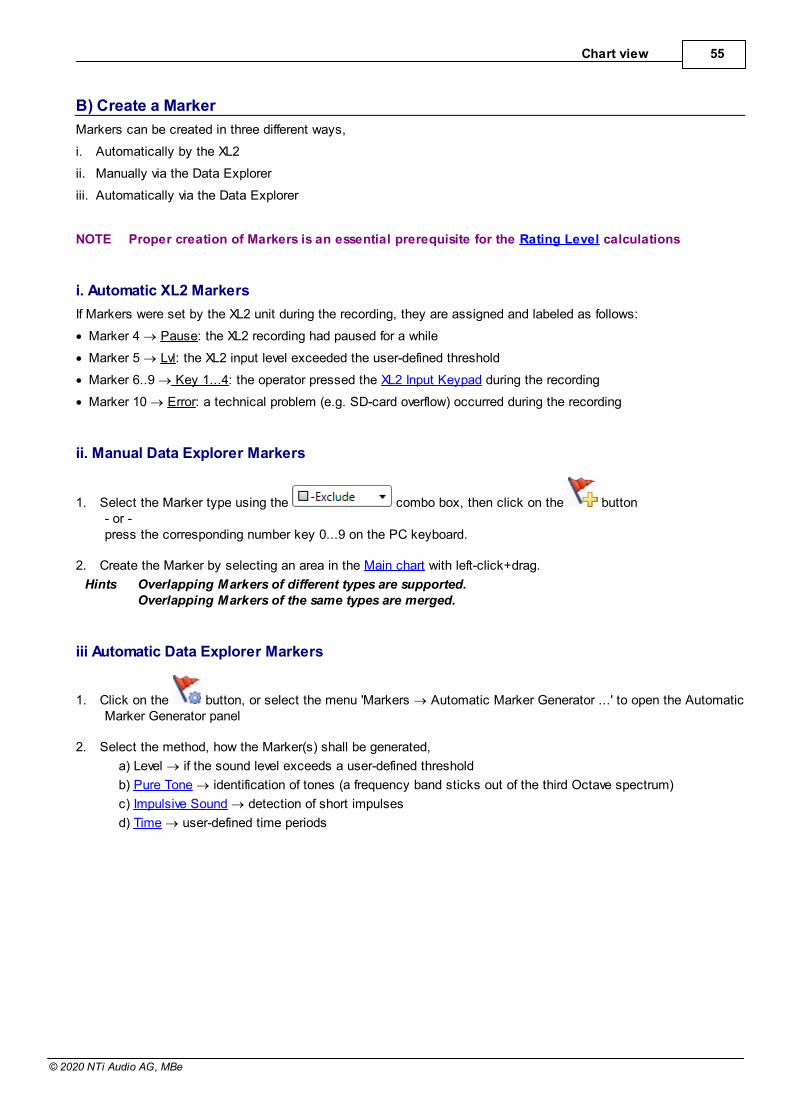
Chart view 55
© 2020 NTi Audio AG, MBe
B) Create a Marker
Markers can be created in three different ways,
i. Automatically by the XL2
ii. Manually via the Data Explorer
iii. Automatically via the Data Explorer
NOTE Proper creation of Markers is an essential prerequisite for the Rating Level calculations
i. Automatic XL2 Markers
If Markers were set by the XL2 unit during the recording, they are assigned and labeled as follows:
· Marker 4 ® Pause: the XL2 recording had paused for a while
· Marker 5 ® Lvl: the XL2 input level exceeded the user-defined threshold
· Marker 6..9 ® Key 1...4: the operator pressed the XL2 Input Keypad during the recording
· Marker 10 ® Error: a technical problem (e.g. SD-card overflow) occurred during the recording
ii. Manual Data Explorer Markers
1. Select the Marker type using the combo box, then click on the button- or -press the corresponding number key 0...9 on the PC keyboard.
2. Create the Marker by selecting an area in the Main chart with left-click+drag.
Hints Overlapping Markers of different types are supported.Overlapping Markers of the same types are merged.
iii Automatic Data Explorer Markers
1. Click on the button, or select the menu 'Markers ® Automatic Marker Generator ...' to open the AutomaticMarker Generator panel
2. Select the method, how the Marker(s) shall be generated,
a) Level ® if the sound level exceeds a user-defined threshold
b) Pure Tone ® identification of tones (a frequency band sticks out of the third Octave spectrum)
c) Impulsive Sound ® detection of short impulses
d) Time ® user-defined time periods
XL2 DataExplorer User Manual56
© 2020 NTi Audio AG, MBe
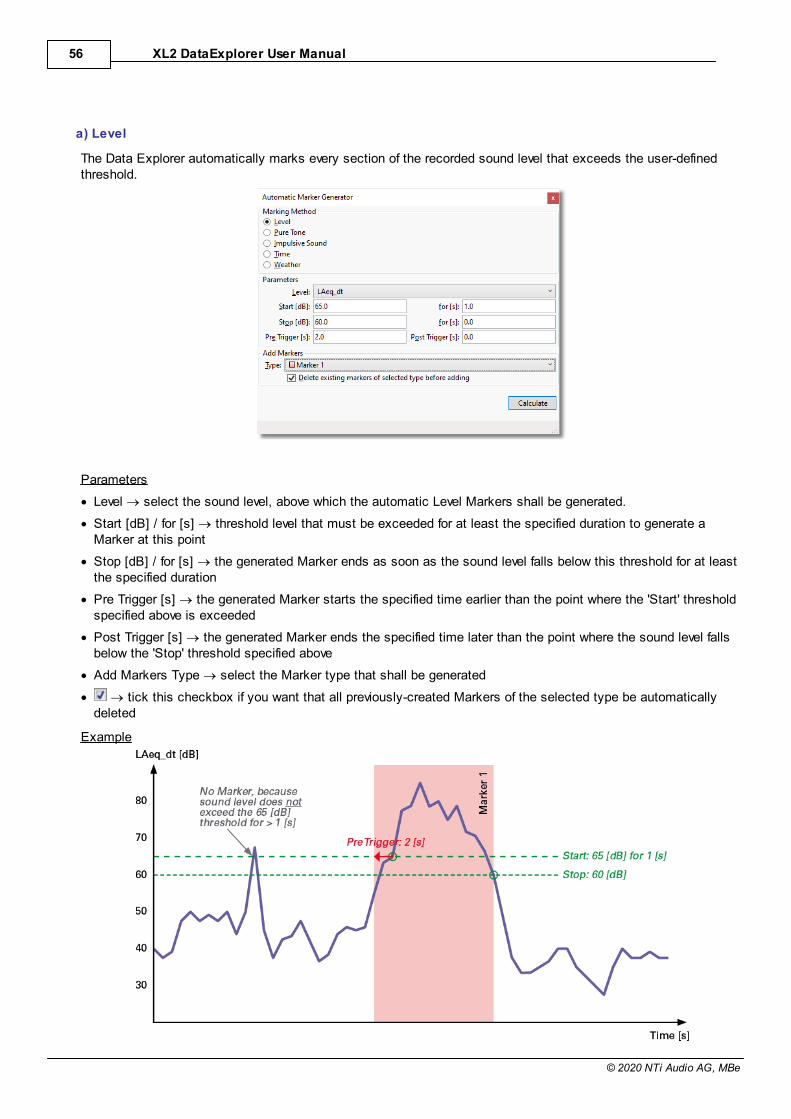
a) Level
The Data Explorer automatically marks every section of the recorded sound level that exceeds the user-definedthreshold.
Parameters
· Level ® select the sound level, above which the automatic Level Markers shall be generated.
· Start [dB] / for [s] ® threshold level that must be exceeded for at least the specified duration to generate aMarker at this point
· Stop [dB] / for [s] ® the generated Marker ends as soon as the sound level falls below this threshold for at leastthe specified duration
· Pre Trigger [s] ® the generated Marker starts the specified time earlier than the point where the 'Start' thresholdspecified above is exceeded
· Post Trigger [s] ® the generated Marker ends the specified time later than the point where the sound level fallsbelow the 'Stop' threshold specified above
· Add Markers Type ® select the Marker type that shall be generated
· ® tick this checkbox if you want that all previously-created Markers of the selected type be automaticallydeleted
Example
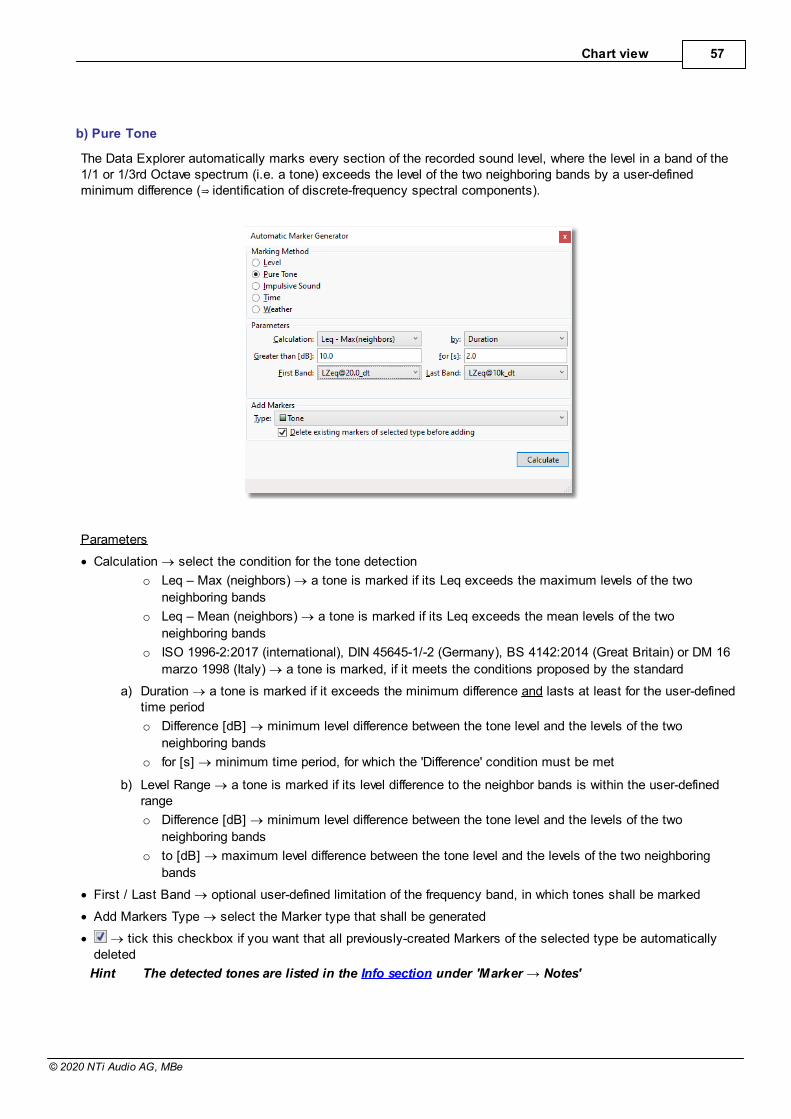
Chart view 57
© 2020 NTi Audio AG, MBe
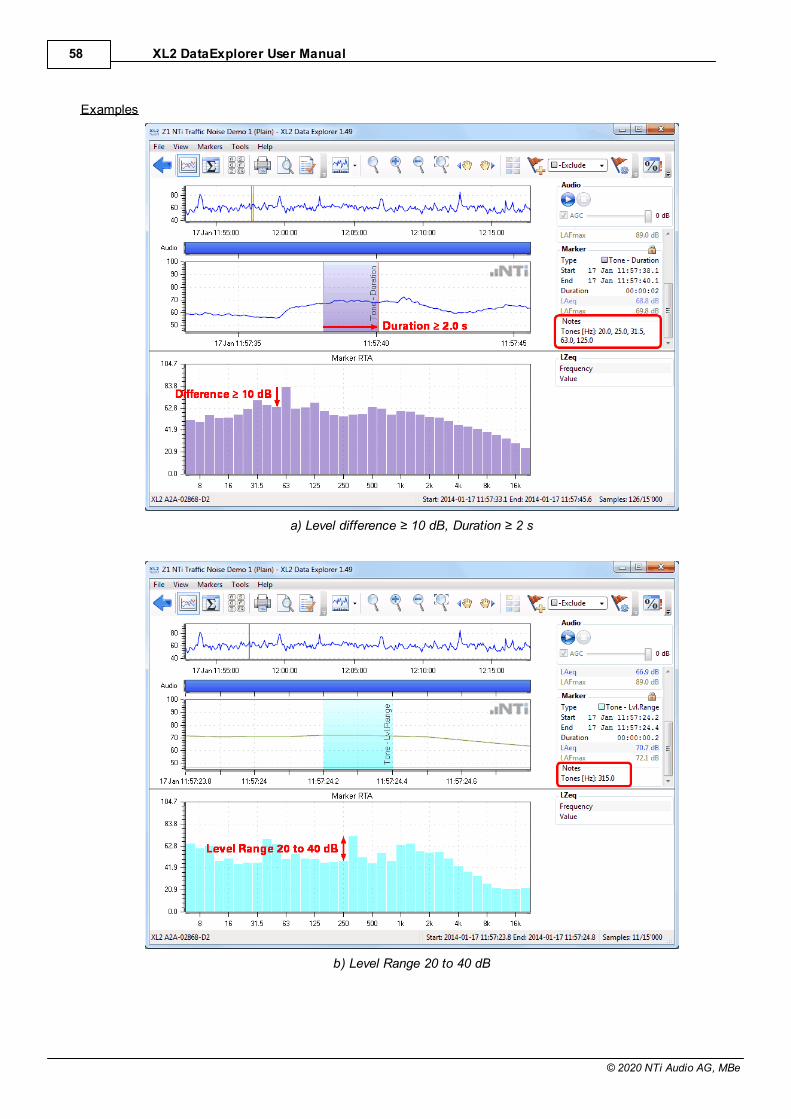
b) Pure Tone
The Data Explorer automatically marks every section of the recorded sound level, where the level in a band of the1/1 or 1/3rd Octave spectrum (i.e. a tone) exceeds the level of the two neighboring bands by a user-defined
Parameters
· Calculation ® select the condition for the tone detection
o Leq – Max (neighbors) ® a tone is marked if its Leq exceeds the maximum levels of the two
neighboring bands
o Leq – Mean (neighbors) ® a tone is marked if its Leq exceeds the mean levels of the two
neighboring bands
o ISO 1996-2:2017 (international), DIN 45645-1/-2 (Germany), BS 4142:2014 (Great Britain) or DM 16
marzo 1998 (Italy) ® a tone is marked, if it meets the conditions proposed by the standard
a) Duration ® a tone is marked if it exceeds the minimum difference and lasts at least for the user-definedtime period
o Difference [dB] ® minimum level difference between the tone level and the levels of the two
neighboring bands
o for [s] ® minimum time period, for which the 'Difference' condition must be met
b) Level Range ® a tone is marked if its level difference to the neighbor bands is within the user-definedrange
o Difference [dB] ® minimum level difference between the tone level and the levels of the two
neighboring bands
o to [dB] ® maximum level difference between the tone level and the levels of the two neighboring
bands
· First / Last Band ® optional user-defined limitation of the frequency band, in which tones shall be marked
· Add Markers Type ® select the Marker type that shall be generated
· ® tick this checkbox if you want that all previously-created Markers of the selected type be automaticallydeleted
Hint The detected tones are listed in the Info section
XL2 DataExplorer User Manual58
© 2020 NTi Audio AG, MBe
Examples
b) Level Range 20 to 40 dB
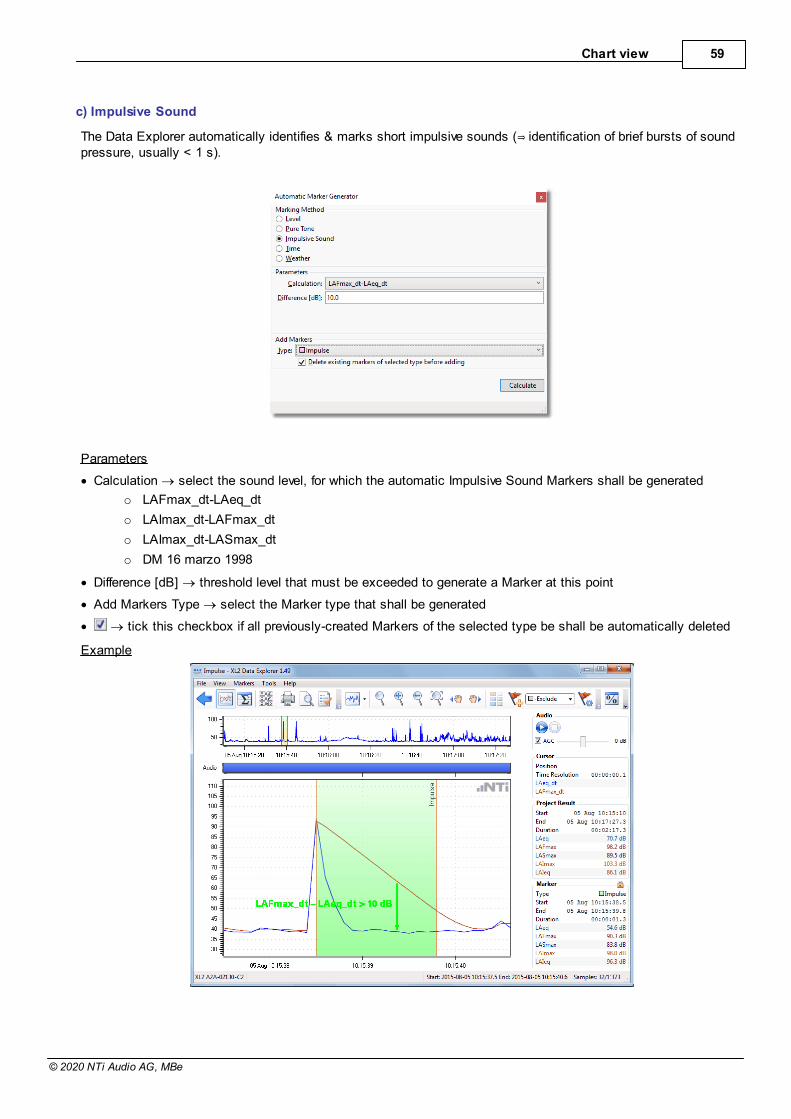
Chart view 59
© 2020 NTi Audio AG, MBe
c) Impulsive Sound
pressure, usually < 1 s).
Parameters
· Calculation ® select the sound level, for which the automatic Impulsive Sound Markers shall be generated
o LAFmax_dt-LAeq_dt
o LAImax_dt-LAFmax_dt
o LAImax_dt-LASmax_dt
o DM 16 marzo 1998
· Difference [dB] ® threshold level that must be exceeded to generate a Marker at this point
· Add Markers Type ® select the Marker type that shall be generated
· ® tick this checkbox if all previously-created Markers of the selected type be shall be automatically deleted
Example
XL2 DataExplorer User Manual60
© 2020 NTi Audio AG, MBe
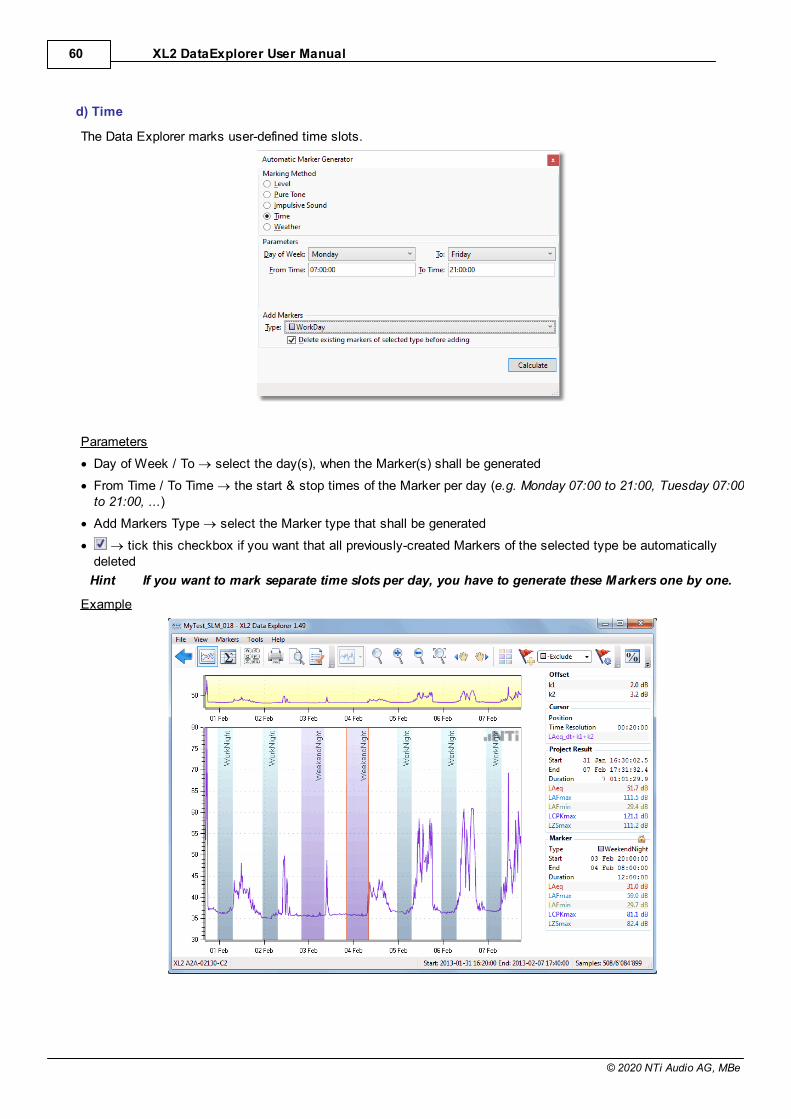
d) Time
The Data Explorer marks user-defined time slots.
Parameters
· Day of Week / To ® select the day(s), when the Marker(s) shall be generated
· From Time / To Time ® the start & stop times of the Marker per day (e.g. Monday 07:00 to 21:00, Tuesday 07:00to 21:00, ...)
· Add Markers Type ® select the Marker type that shall be generated
· ® tick this checkbox if you want that all previously-created Markers of the selected type be automaticallydeleted
Hint If you want to mark separate time slots per day, you have to generate these Markers one by one.
Example
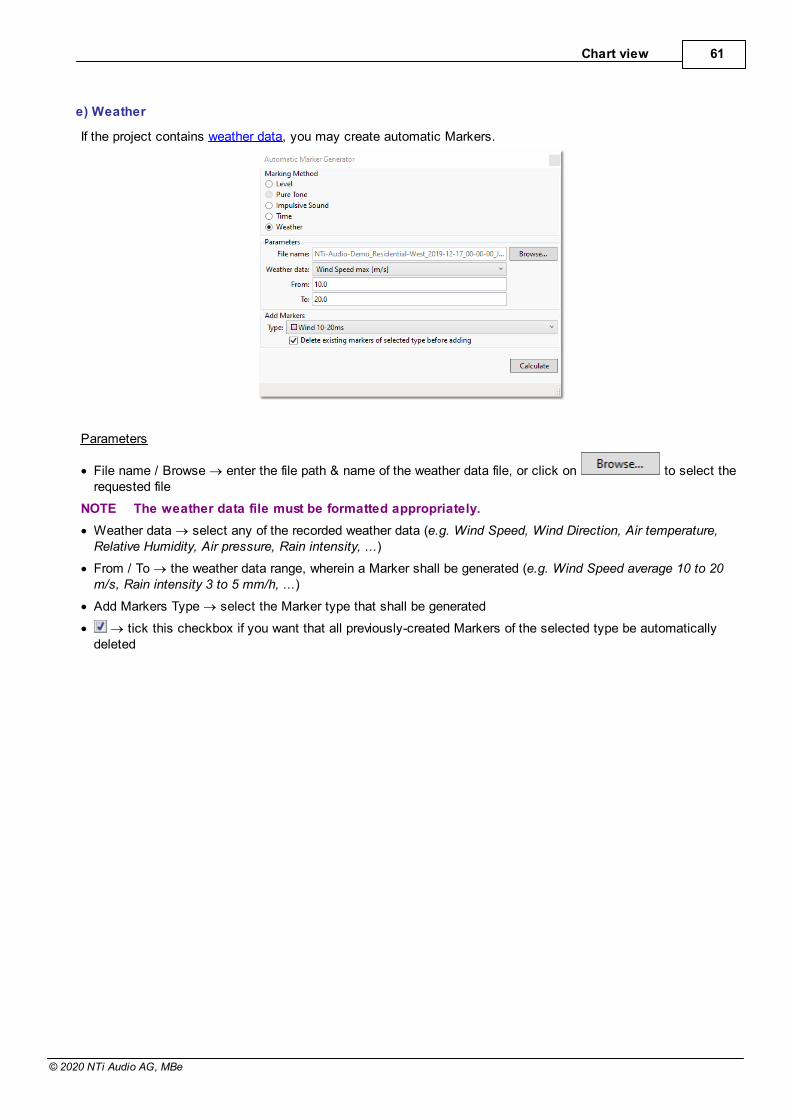
Chart view 61
© 2020 NTi Audio AG, MBe
e) Weather
If the project contains weather data, you may create automatic Markers.
Parameters
· File name / Browse ® enter the file path & name of the weather data file, or click on to select therequested file
NOTE The weather data file must be formatted appropriately.
· Weather data ® select any of the recorded weather data (e.g. Wind Speed, Wind Direction, Air temperature,Relative Humidity, Air pressure, Rain intensity, ...)
· From / To ® the weather data range, wherein a Marker shall be generated (e.g. Wind Speed average 10 to 20m/s, Rain intensity 3 to 5 mm/h, ...)
· Add Markers Type ® select the Marker type that shall be generated
· ® tick this checkbox if you want that all previously-created Markers of the selected type be automaticallydeleted
XL2 DataExplorer User Manual62
© 2020 NTi Audio AG, MBe
C) Edit a Marker
The type, the start/end points or the duration of any Marker can be edited, regardless whether it has been importedfrom an XL2 test, or created in the Data Explorer software.
Right-click on the Marker (or Marker name) in the Main chart and select 'Edit', then
· amend the Marker Type, Start, End or Duration in the Info section, or
· click on the left or right edge of the Marker band and manually adjust it with the cursor, or
· click on the Marker band and pan it with the cursor, or
· edit a note (i.e. comment) to the Marker via the Info section
Click on 'OK' in the Info section to confirm or on 'Cancel' to abandon your changes.
Hint If two or more Markers of the same type are overlapping, they will be merged
D) Export / Import of Markers
You can export the Markers from a project and import them into another project. This feature allows you to compare,for example, the marked incidents between two measurements that have been recorded at the same time.
· Select the menu "Markers ® Export Markers..." or "Markers ® Import Markers... ", respectively.
· Select the memory location of the *.XML file and confirm.
Hints The exported *.XML file contains the Markers of the project, their individual time stamps andMarker types.During import, only the Markers that fit into the recording period are considered.
It is also possible to export the Marker Types from a project, and import this set to another project. This allows youto share the Marker names among different PCs.
· Click on the button to open the 'Define Marker Types' panel.
· Right-click on the panel, select the menu "Export Marker Types..." or "Import Marker Types...", respectively, andconfirm.
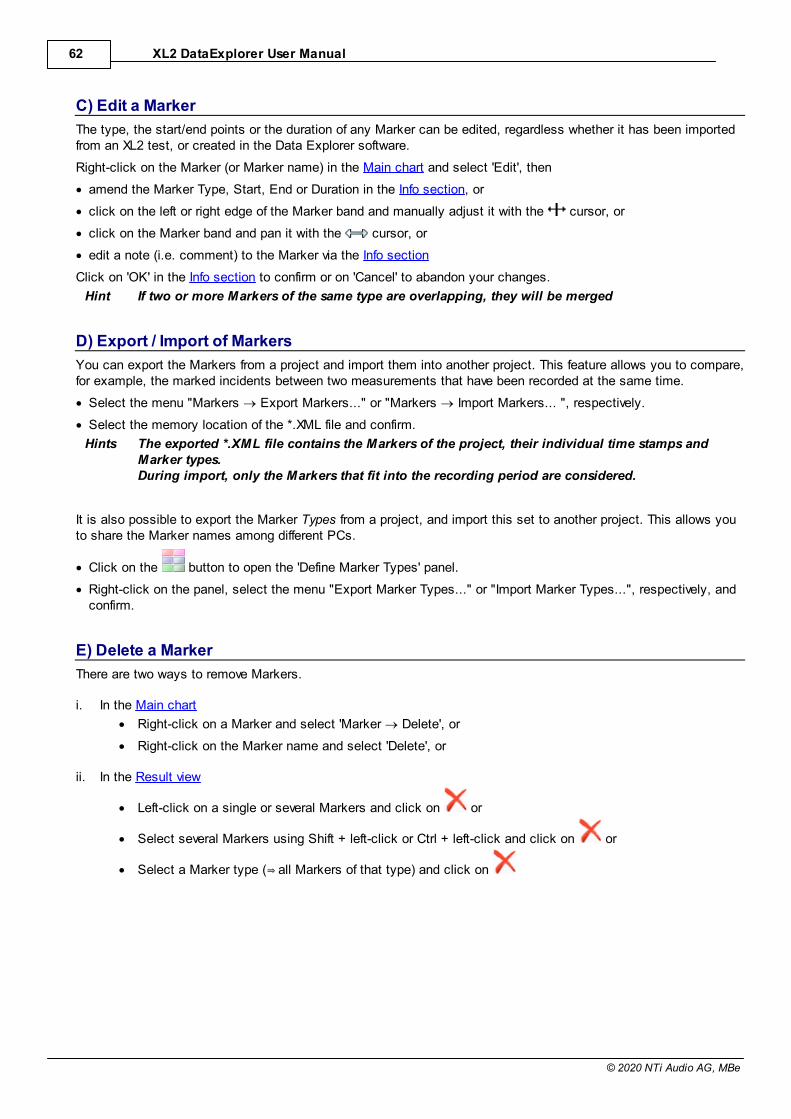
E) Delete a Marker
There are two ways to remove Markers.
i. In the Main chart
· Right-click on a Marker and select 'Marker ® Delete', or
· Right-click on the Marker name and select 'Delete', or
ii. In the Result view
· Left-click on a single or several Markers and click on or
· Select several Markers using Shift + left-click or Ctrl + left-click and click on or
·
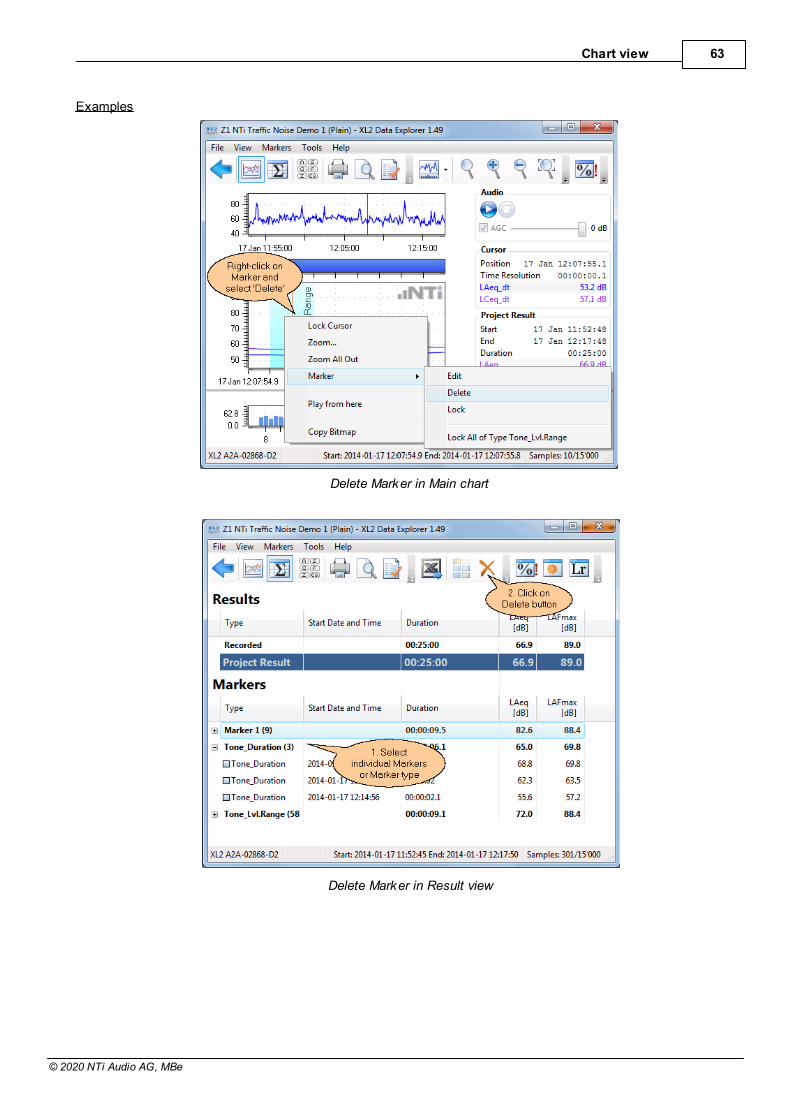
Chart view 63
© 2020 NTi Audio AG, MBe
Examples
Delete Marker in Main chart
Delete Marker in Result view
XL2 DataExplorer User Manual64
© 2020 NTi Audio AG, MBe
E) Marker Spectrum
You may either display the RTA spectrum of a specific Marker, or of all Markers of the same type.
a) RTA spectrum of a specific Marker
i. Right-click on the Marker name and select 'Lock'
ii. Right-click on the Marker area and select 'Marker ® Lock'
b) RTA spectrum of all Markers of the same type
i. Right-click on the Marker name and select 'Lock All of Type [MarkerName]'
ii. Right-click on the Marker area and select 'Marker ® Lock All of Type [MarkerName]'
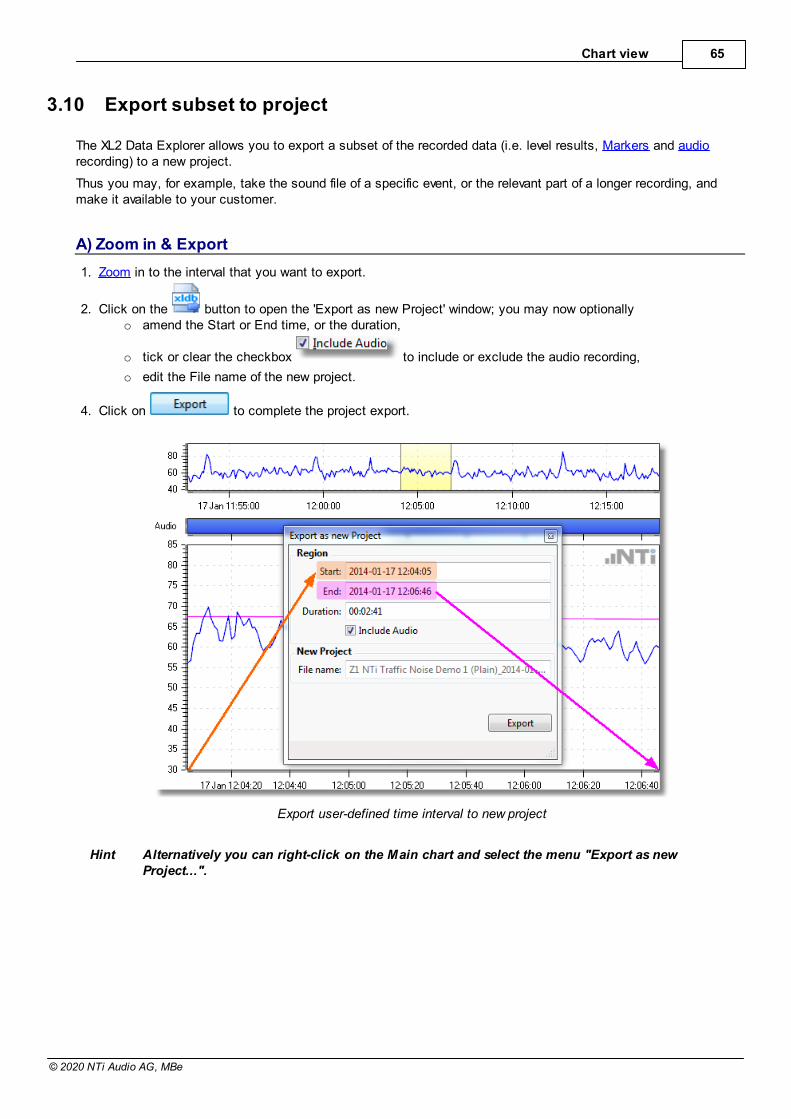
Chart view 65
© 2020 NTi Audio AG, MBe
3.10 Export subset to project
The XL2 Data Explorer allows you to export a subset of the recorded data (i.e. level results, Markers and audiorecording) to a new project.
Thus you may, for example, take the sound file of a specific event, or the relevant part of a longer recording, andmake it available to your customer.
A) Zoom in & Export
1. Zoom in to the interval that you want to export.
2. Click on the button to open the 'Export as new Project' window; you may now optionallyo amend the Start or End time, or the duration,
o tick or clear the checkbox to include or exclude the audio recording,
o edit the File name of the new project.
4. Click on to complete the project export.
Export user-defined time interval to new project
Hint Alternatively you can right-click on the Main chart and select the menu "Export as newProject...".
XL2 DataExplorer User Manual66
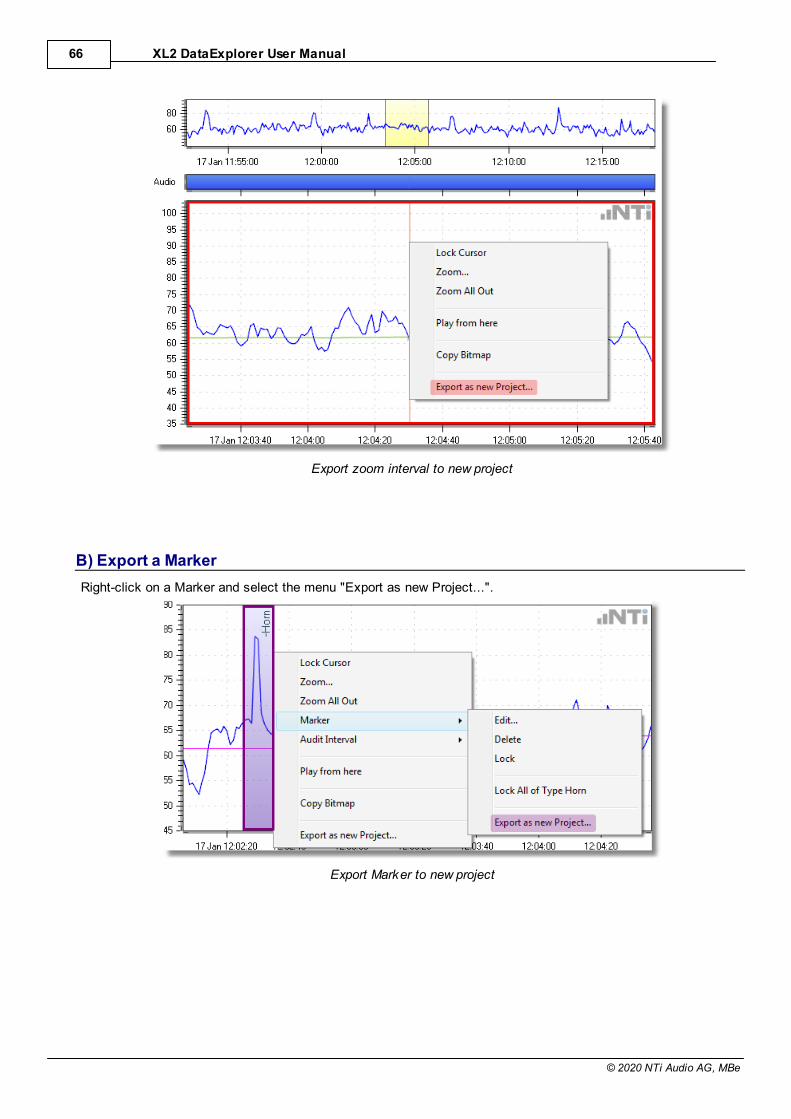
© 2020 NTi Audio AG, MBe
Export zoom interval to new project
B) Export a Marker
Right-click on a Marker and select the menu "Export as new Project...".
Export Marker to new project
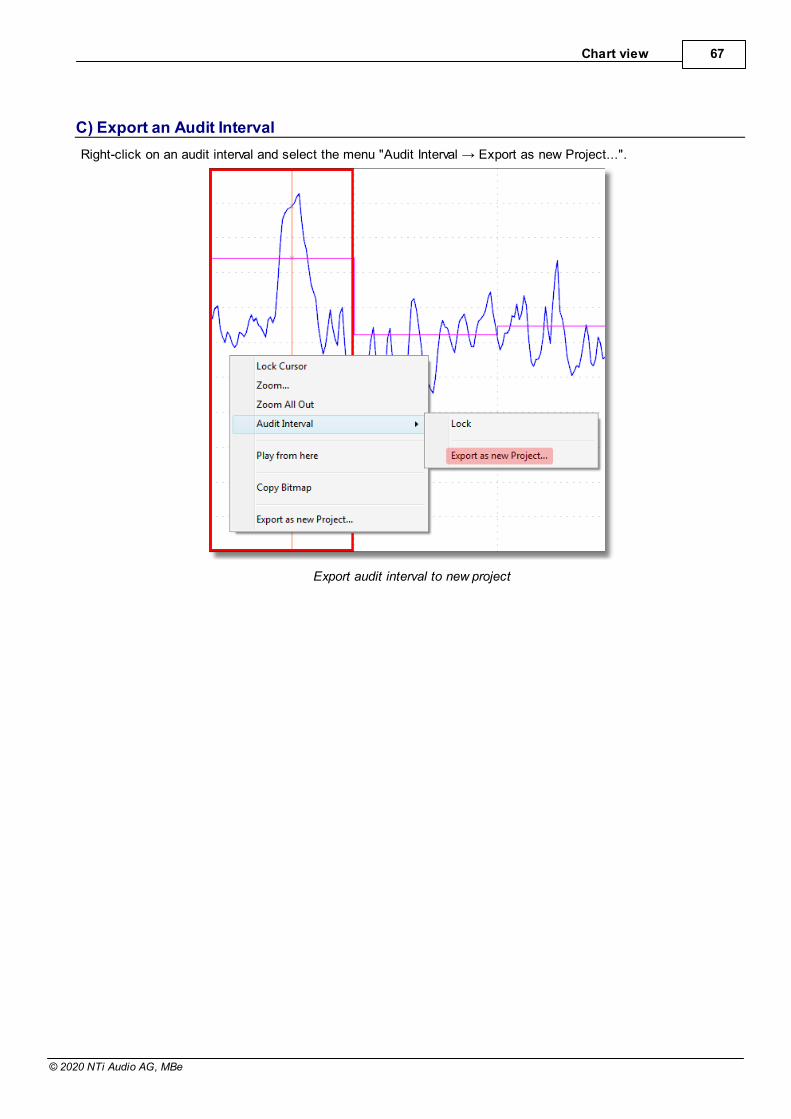
Chart view 67
© 2020 NTi Audio AG, MBe
C) Export an Audit Interval
Export audit interval to new project

Part
IV
Result view 69
© 2020 NTi Audio AG, MBe
4 Result view
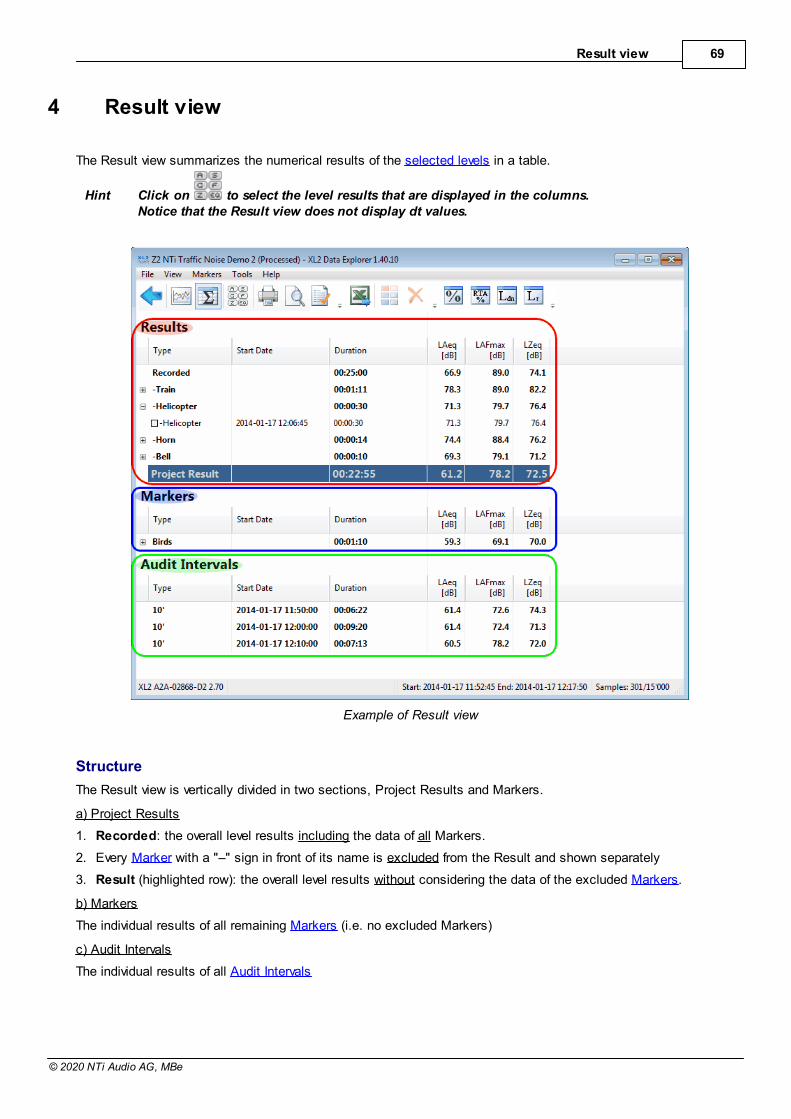
The Result view summarizes the numerical results of the selected levels in a table.
Hint Click on to select the level results that are displayed in the columns.Notice that the Result view does not display dt values.
Example of Result view
Structure
The Result view is vertically divided in two sections, Project Results and Markers.
a) Project Results
1. Recorded: the overall level results including the data of all Markers.
2. Every Marker with a "–" sign in front of its name is excluded from the Result and shown separately
3. Result (highlighted row): the overall level results without considering the data of the excluded Markers.
b) Markers
The individual results of all remaining Markers (i.e. no excluded Markers)
c) Audit Intervals
The individual results of all Audit Intervals
XL2 DataExplorer User Manual70
© 2020 NTi Audio AG, MBe
Features
The following operations are supported in the Result view.
· Select the levels that are displayed.
· Click on or to expand or collapse Markers.
· Right-click to the Result view and select
o 'Expand All' or 'Collapse All' (applies to all Marker categories),
o 'Date and Time Format' to adjust the format of the 'Start' column to your demands.
· Double click on a Marker or an Audit Interval to open the Chart view, with the zoom range at the selected Markerposition / Audit Interval, respectively.
· Delete a selected Marker if necessary.
· Click on to export the formatted table to an MS Excel file.
· Open the Level statistics calculation
· Open the Day Night Level calculation.
Hint All settings are saved in the Project, i.e. the Result view layout will re-open in its last state whenthe project is opened again.
Result view 71
© 2020 NTi Audio AG, MBe
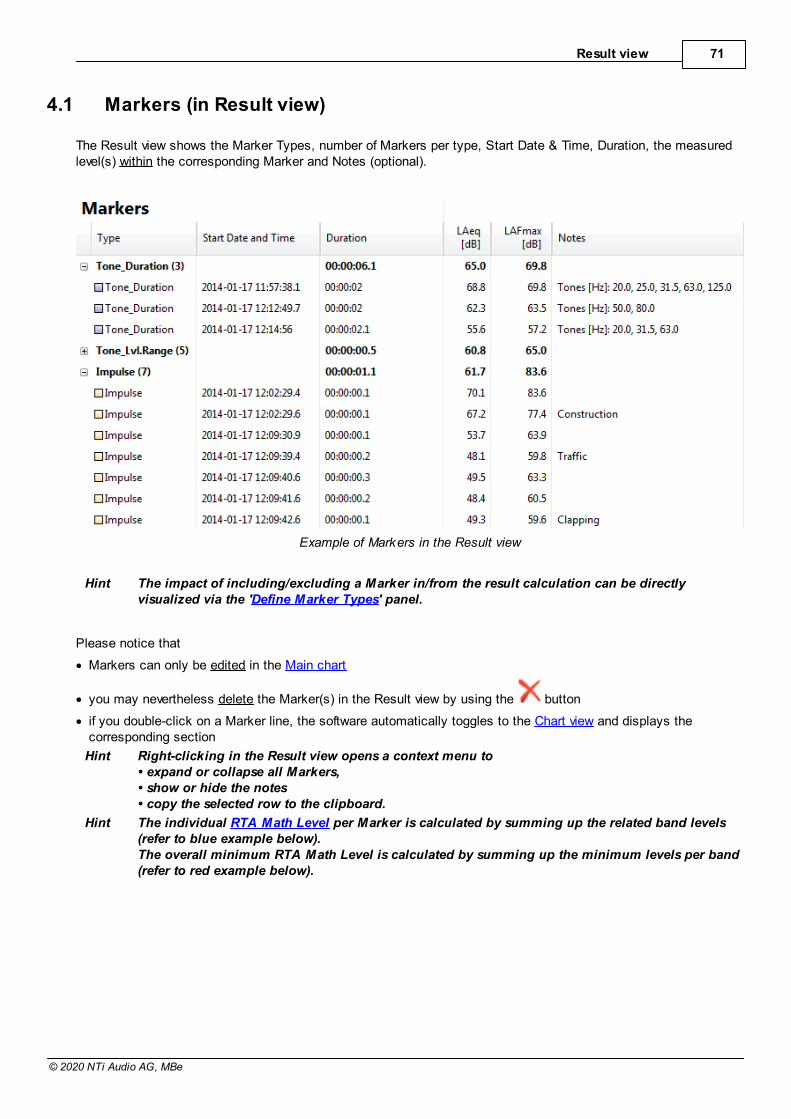
4.1 Markers (in Result view)
The Result view shows the Marker Types, number of Markers per type, Start Date & Time, Duration, the measuredlevel(s) within the corresponding Marker and Notes (optional).
Example of Markers in the Result view
Hint The impact of including/excluding a Marker in/from the result calculation can be directlyvisualized via the 'Define Marker Types' panel.
Please notice that
· Markers can only be edited in the Main chart
· you may nevertheless delete the Marker(s) in the Result view by using the button
· if you double-click on a Marker line, the software automatically toggles to the Chart view and displays thecorresponding section
Hint Right-clicking in the Result view opens a context menu to• expand or collapse all Markers,• show or hide the notes• copy the selected row to the clipboard.
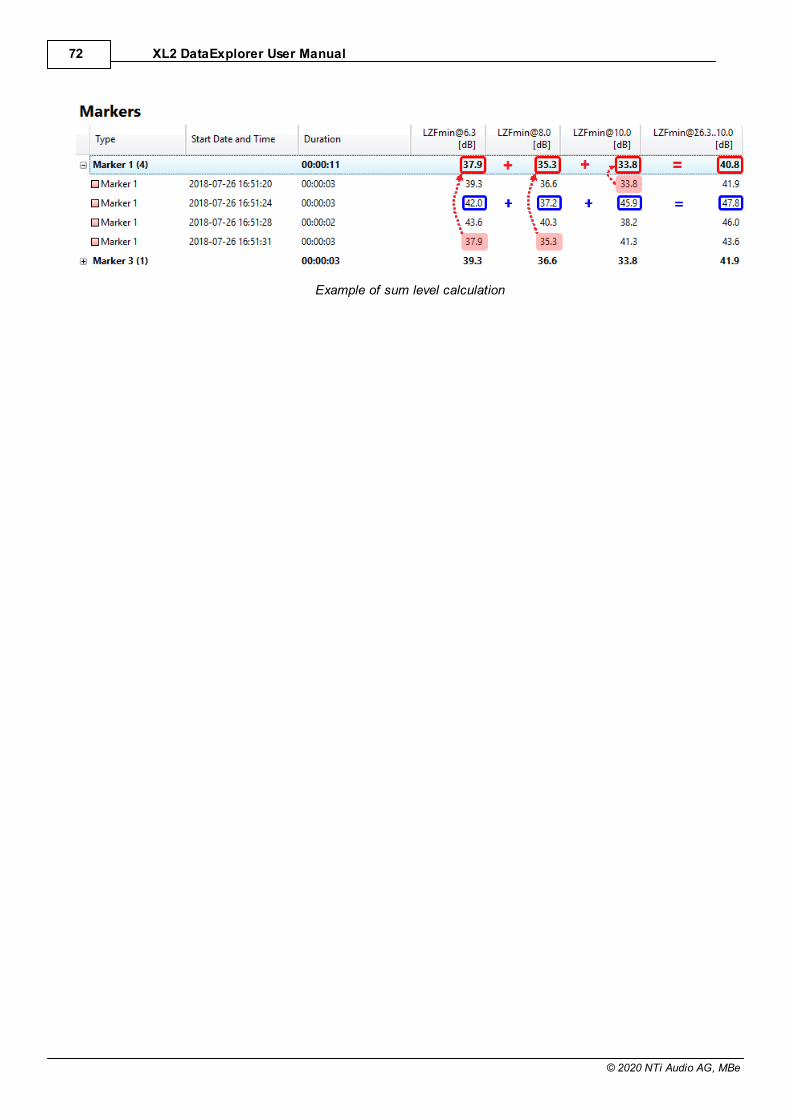
Hint The individual RTA Math Level per Marker is calculated by summing up the related band levels(refer to blue example below).The overall minimum RTA Math Level is calculated by summing up the minimum levels per band(refer to red example below).
XL2 DataExplorer User Manual72
© 2020 NTi Audio AG, MBe
Example of sum level calculation
Result view 73
© 2020 NTi Audio AG, MBe
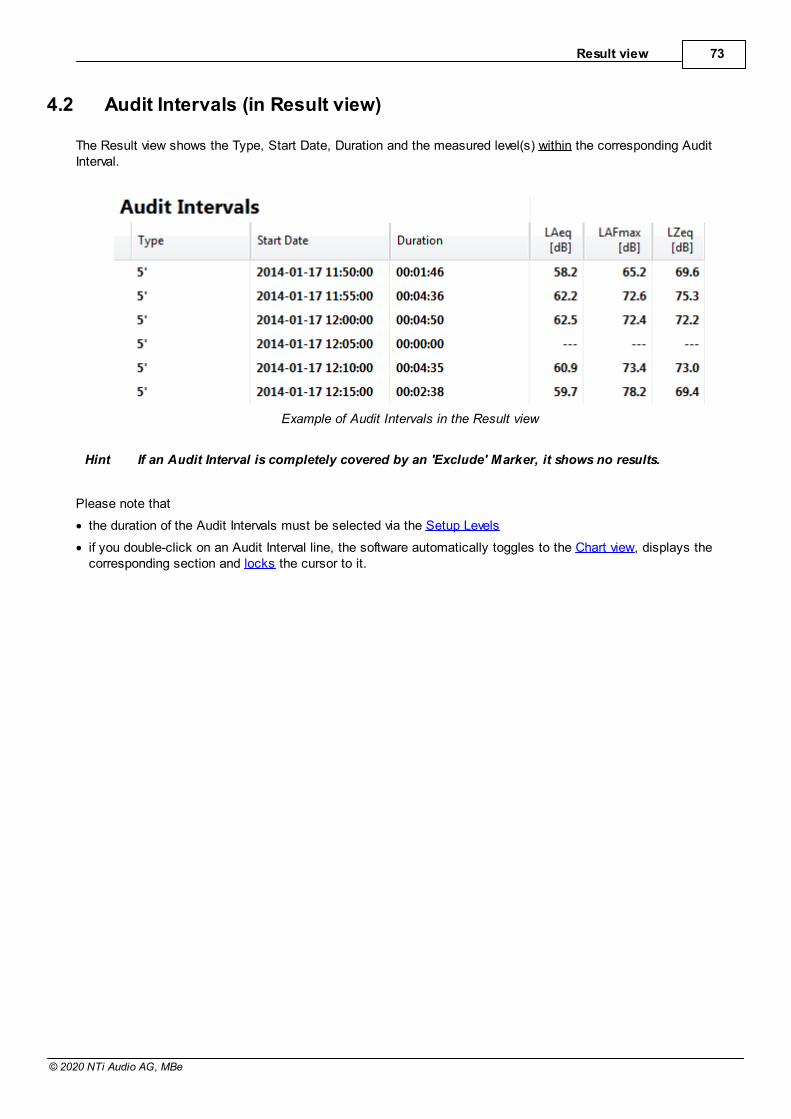
4.2 Audit Intervals (in Result view)
The Result view shows the Type, Start Date, Duration and the measured level(s) within the corresponding AuditInterval.
Example of Audit Intervals in the Result view
Hint If an Audit Interval is completely covered by an 'Exclude' Marker, it shows no results.
Please note that
· the duration of the Audit Intervals must be selected via the Setup Levels
· if you double-click on an Audit Interval line, the software automatically toggles to the Chart view, displays thecorresponding section and locks the cursor to it.

Part
V
Level Calculations 75
© 2020 NTi Audio AG, MBe
5 Level Calculations
The XL2 Data Explorer offers three tools for customized level calculations,
i. the Level statistics, RTA statistics or percentiles are accessible via the and buttons,
ii. the Day Night level window is opened by clicking on the button.
iii. click on the button to definite the Penalties or calculate the Rating Levels.
5.1 StatisticsThe Data Explorer supports the calculation of
· Level statistics
· RTA statistics
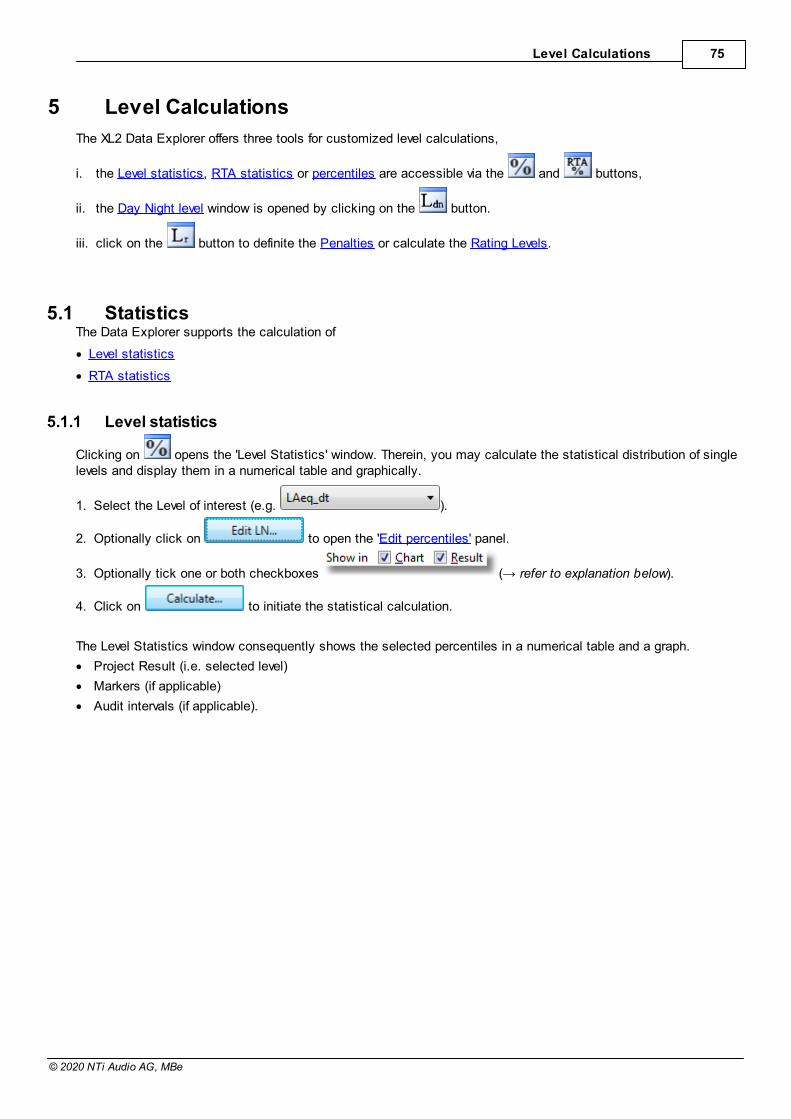
5.1.1 Level statistics
Clicking on opens the 'Level Statistics' window. Therein, you may calculate the statistical distribution of singlelevels and display them in a numerical table and graphically.
1. Select the Level of interest (e.g. ).
2. Optionally click on to open the 'Edit percentiles' panel.
3. Optionally tick one or both checkboxes refer to explanation below).
4. Click on to initiate the statistical calculation.
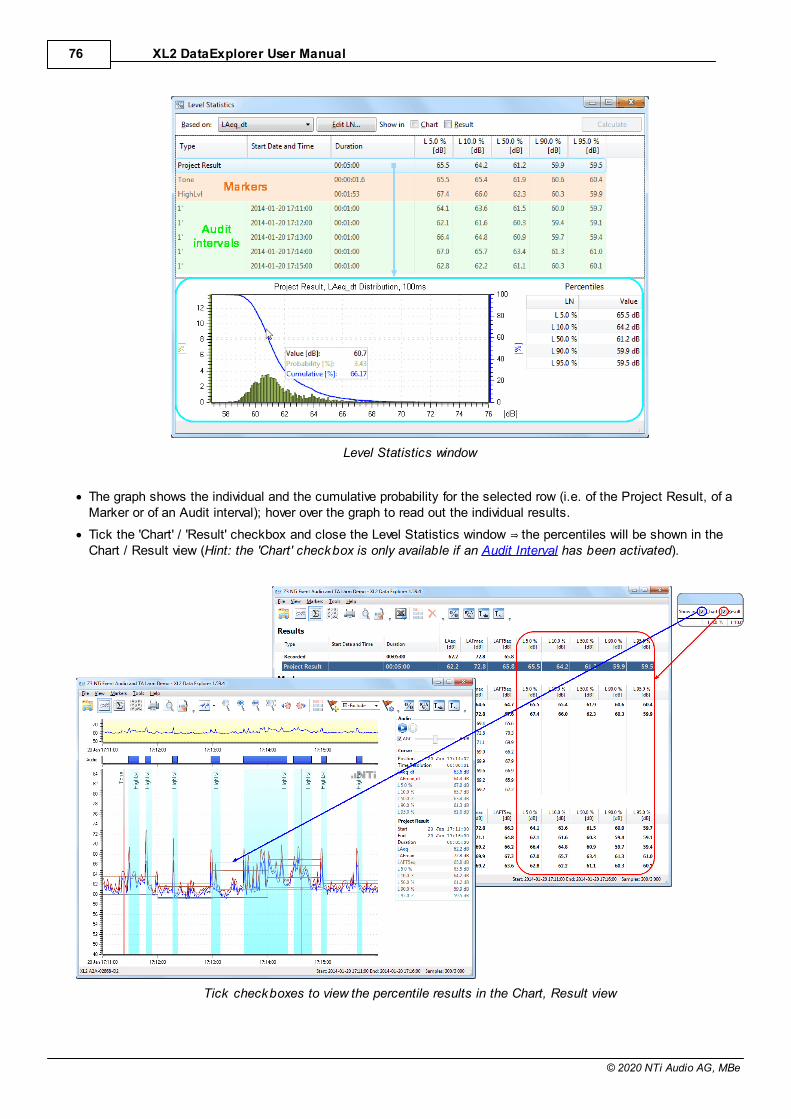
The Level Statistics window consequently shows the selected percentiles in a numerical table and a graph.
· Project Result (i.e. selected level)
· Markers (if applicable)
· Audit intervals (if applicable).
XL2 DataExplorer User Manual76
© 2020 NTi Audio AG, MBe
Level Statistics window
· The graph shows the individual and the cumulative probability for the selected row (i.e. of the Project Result, of aMarker or of an Audit interval); hover over the graph to read out the individual results.
·
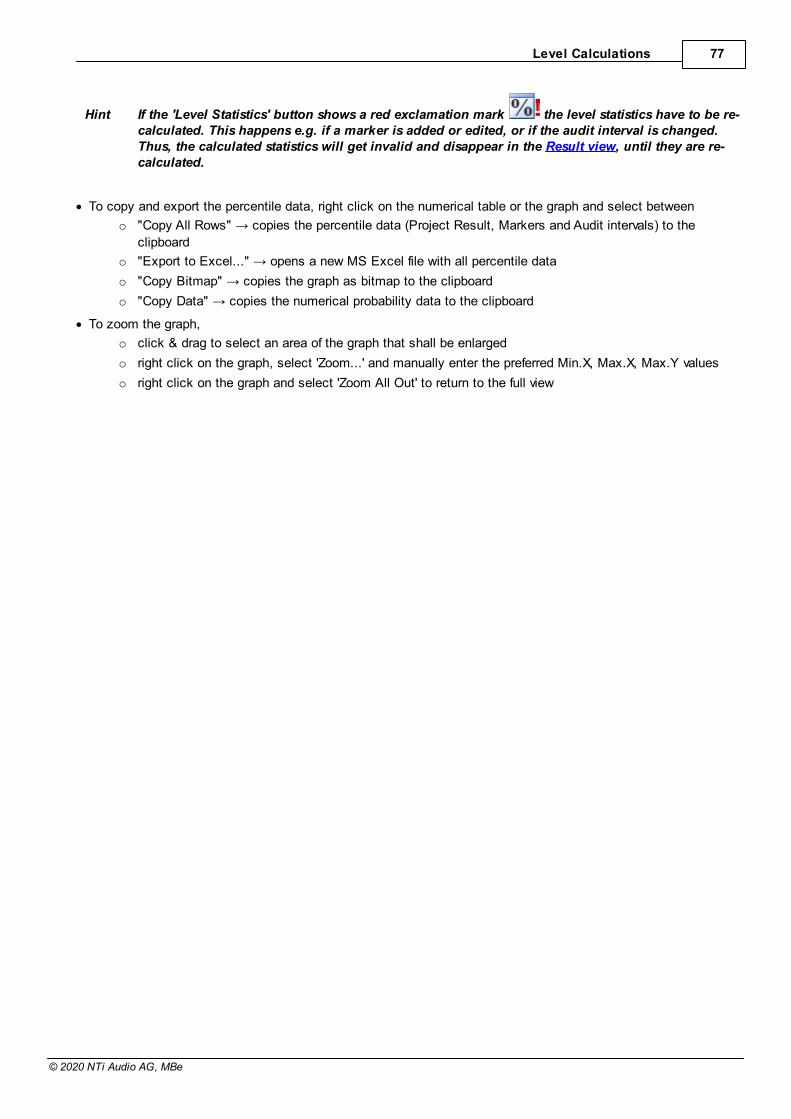
Chart / Result view (Hint: the 'Chart' checkbox is only available if an Audit Interval has been activated).
Tick checkboxes to view the percentile results in the Chart, Result view
Level Calculations 77
© 2020 NTi Audio AG, MBe
Hint If the 'Level Statistics' button shows a red exclamation mark the level statistics have to be re-calculated. This happens e.g. if a marker is added or edited, or if the audit interval is changed.Thus, the calculated statistics will get invalid and disappear in the Result view, until they are re-calculated.
· To copy and export the percentile data, right click on the numerical table or the graph and select between
o
clipboard
o
o
o
· To zoom the graph,
o click & drag to select an area of the graph that shall be enlarged
o right click on the graph, select 'Zoom...' and manually enter the preferred Min.X, Max.X, Max.Y values
o right click on the graph and select 'Zoom All Out' to return to the full view
XL2 DataExplorer User Manual78
© 2020 NTi Audio AG, MBe
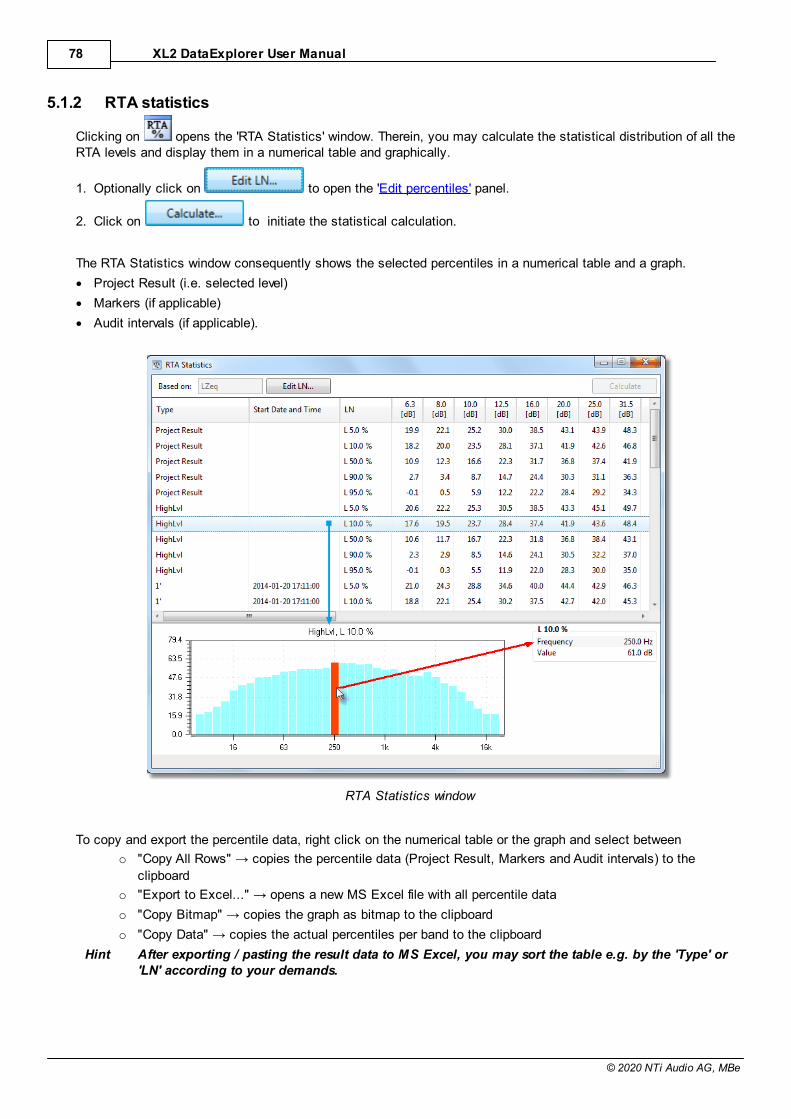
5.1.2 RTA statistics
Clicking on opens the 'RTA Statistics' window. Therein, you may calculate the statistical distribution of all theRTA levels and display them in a numerical table and graphically.
1. Optionally click on to open the 'Edit percentiles' panel.
2. Click on to initiate the statistical calculation.
The RTA Statistics window consequently shows the selected percentiles in a numerical table and a graph.
· Project Result (i.e. selected level)
· Markers (if applicable)
· Audit intervals (if applicable).
RTA Statistics window
To copy and export the percentile data, right click on the numerical table or the graph and select between
o
clipboard
o
o
o
Hint After exporting / pasting the result data to MS Excel, you may sort the table e.g. by the 'Type' or'LN' according to your demands.
Level Calculations 79
© 2020 NTi Audio AG, MBe
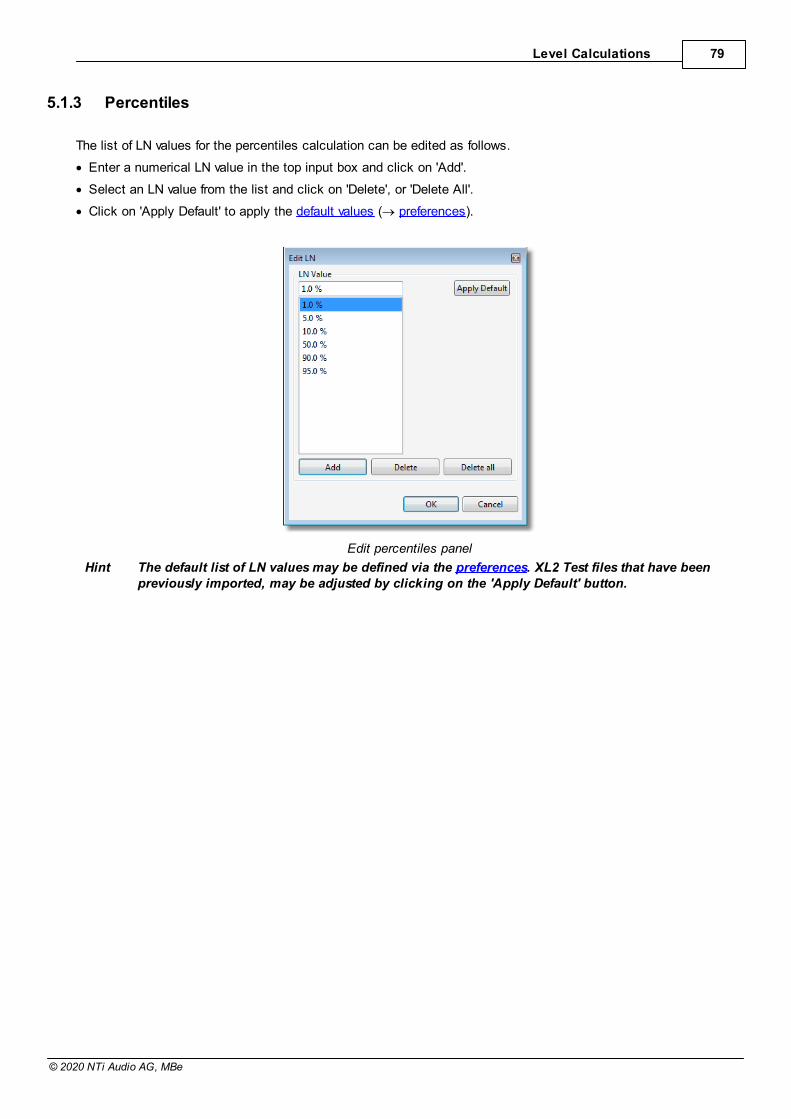
5.1.3 Percentiles
The list of LN values for the percentiles calculation can be edited as follows.
· Enter a numerical LN value in the top input box and click on 'Add'.
· Select an LN value from the list and click on 'Delete', or 'Delete All'.
· Click on 'Apply Default' to apply the default values (® preferences).
Edit percentiles panel
Hint The default list of LN values may be defined via the preferences. XL2 Test files that have beenpreviously imported, may be adjusted by clicking on the 'Apply Default' button.
XL2 DataExplorer User Manual80
© 2020 NTi Audio AG, MBe
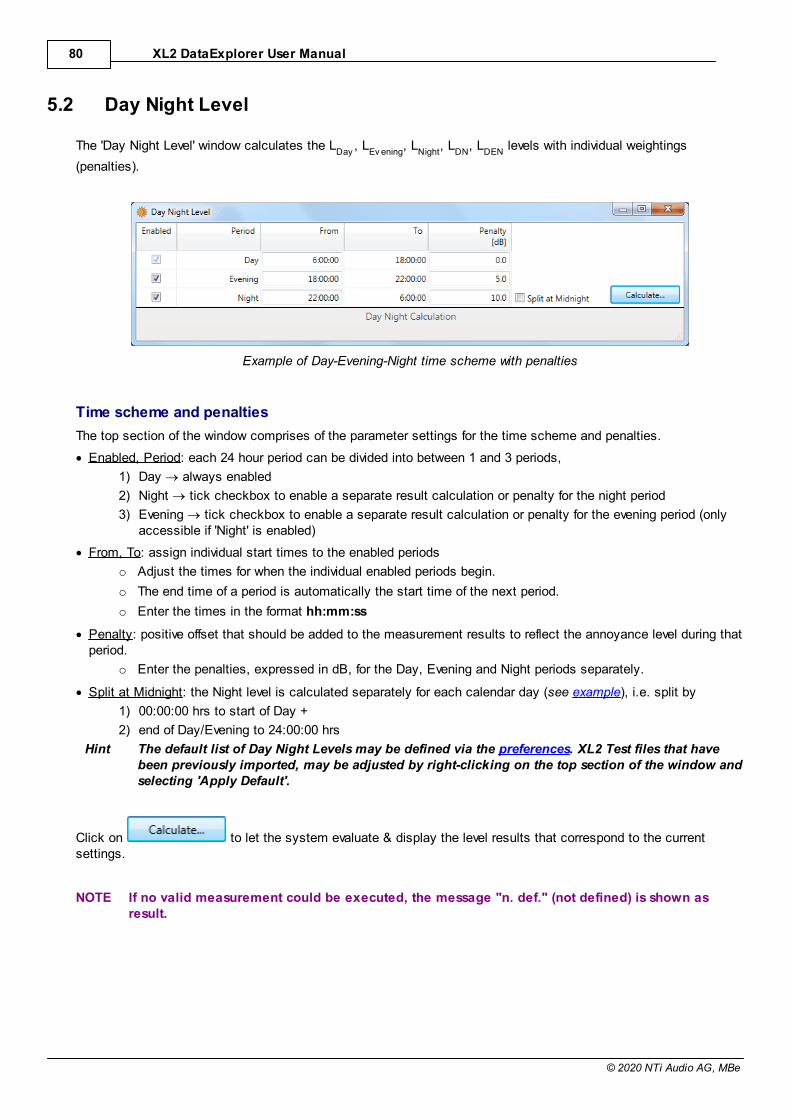
5.2 Day Night Level
The 'Day Night Level' window calculates the LDay
, LEv ening
, LNight
, LDN
, LDEN
levels with individual weightings
(penalties).
Example of Day-Evening-Night time scheme with penalties
Time scheme and penalties
The top section of the window comprises of the parameter settings for the time scheme and penalties.
· Enabled, Period: each 24 hour period can be divided into between 1 and 3 periods,
1) Day ® always enabled
2) Night ® tick checkbox to enable a separate result calculation or penalty for the night period
3) Evening ® tick checkbox to enable a separate result calculation or penalty for the evening period (onlyaccessible if 'Night' is enabled)
· From, To: assign individual start times to the enabled periods
o Adjust the times for when the individual enabled periods begin.
o The end time of a period is automatically the start time of the next period.
o Enter the times in the format hh:mm:ss
· Penalty: positive offset that should be added to the measurement results to reflect the annoyance level during thatperiod.
o Enter the penalties, expressed in dB, for the Day, Evening and Night periods separately.
· Split at Midnight: the Night level is calculated separately for each calendar day (see example), i.e. split by
1) 00:00:00 hrs to start of Day +
2) end of Day/Evening to 24:00:00 hrs
Hint The default list of Day Night Levels may be defined via the preferences. XL2 Test files that havebeen previously imported, may be adjusted by right-clicking on the top section of the window andselecting 'Apply Default'.
Click on to let the system evaluate & display the level results that correspond to the currentsettings.
NOTE If no valid measurement could be executed, the message "n. def." (not defined) is shown asresult.
Level Calculations 81
© 2020 NTi Audio AG, MBe
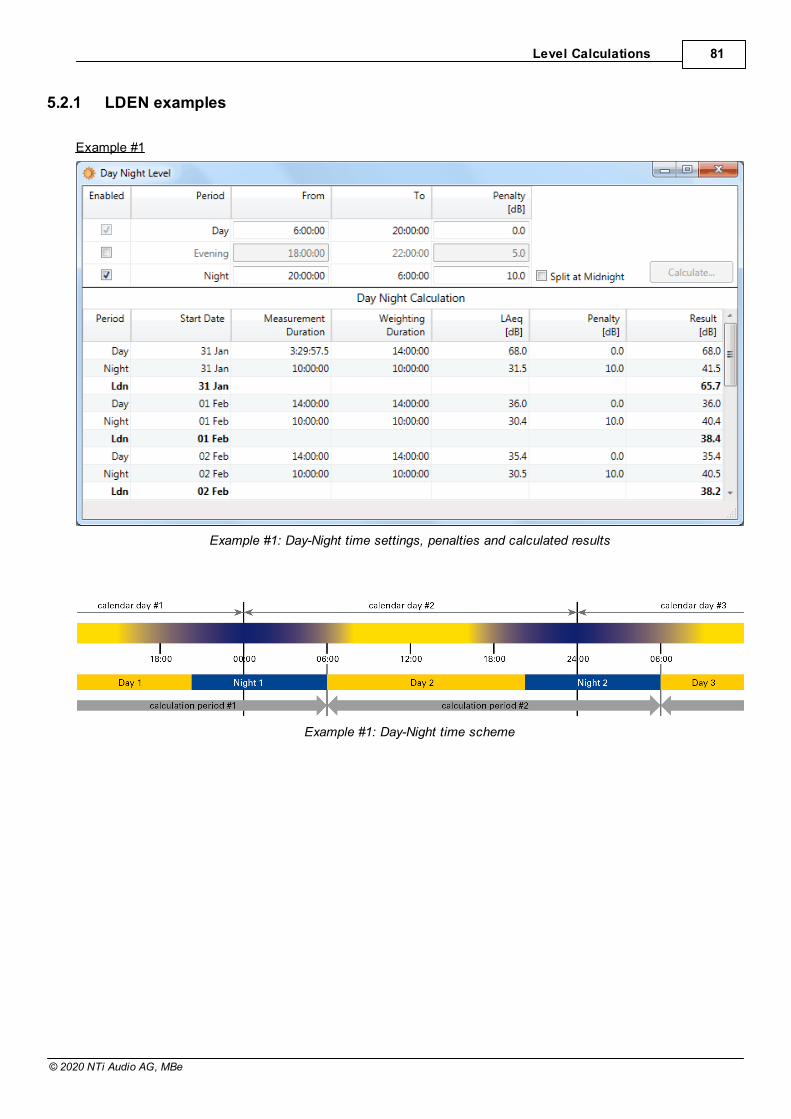
5.2.1 LDEN examples
Example #1
Example #1: Day-Night time settings, penalties and calculated results
Example #1: Day-Night time scheme
XL2 DataExplorer User Manual82
© 2020 NTi Audio AG, MBe
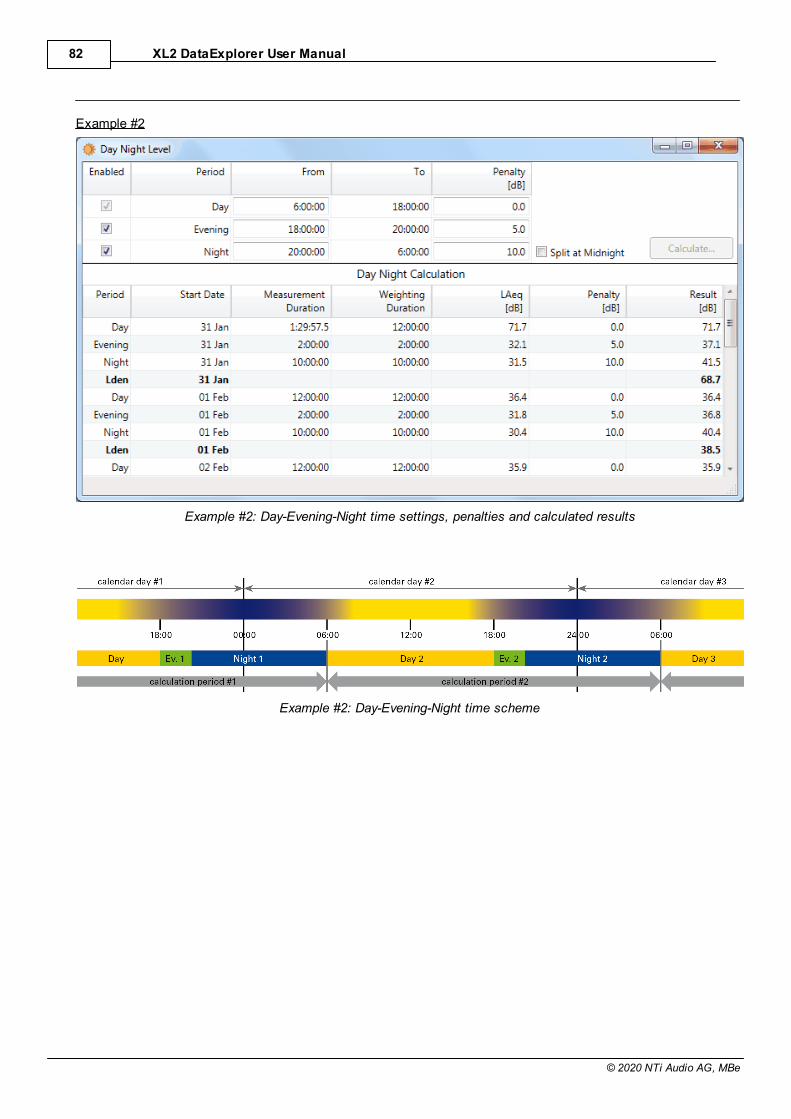
Example #2
Example #2: Day-Evening-Night time settings, penalties and calculated results
Example #2: Day-Evening-Night time scheme
Level Calculations 83
© 2020 NTi Audio AG, MBe
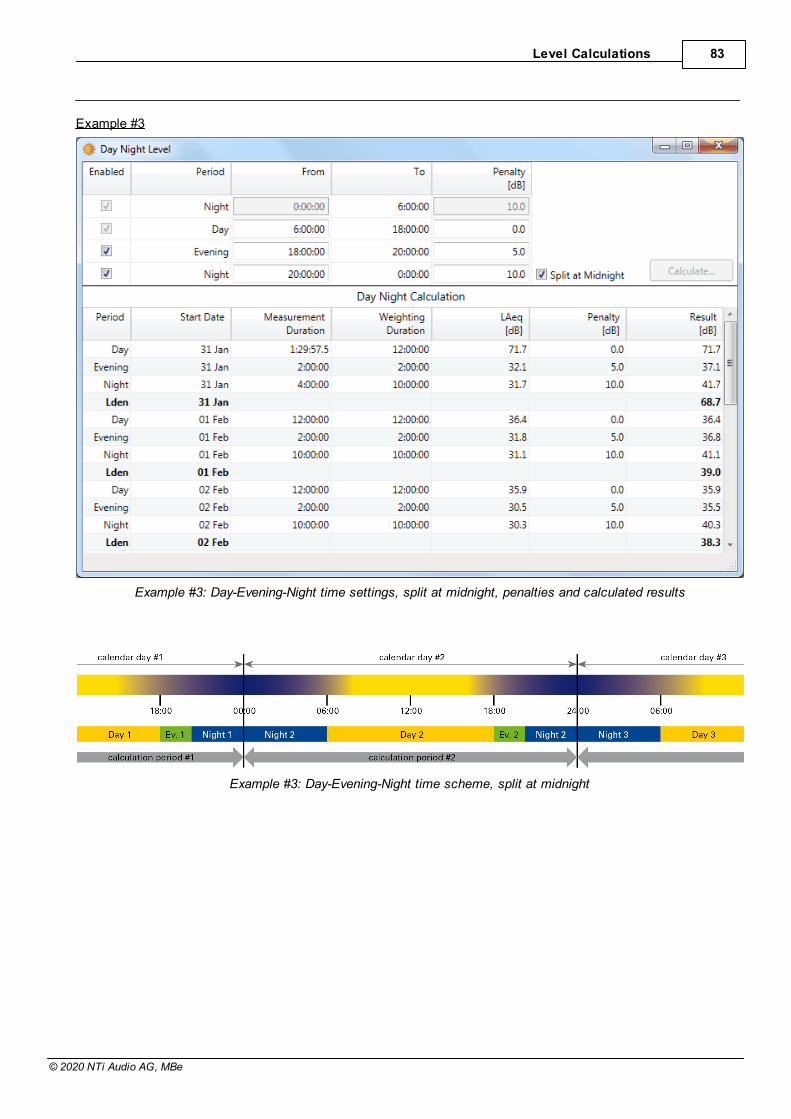
Example #3
Example #3: Day-Evening-Night time settings, split at midnight, penalties and calculated results
Example #3: Day-Evening-Night time scheme, split at midnight
XL2 DataExplorer User Manual84
© 2020 NTi Audio AG, MBe
5.3 Rating Level
The rating level Lr is calculated according to the formula
Lr = LAeq + Ki + Kt + Kr + Ks
whereby
· LAeq: measured sound level
· refer to Impulse analysis)
· refer to Third Octave Tone analysis and FFT and Tone analysis)
· refer to Time of day)
· based on subjective assessment)
In other words, the rating level is calculated by adding 'penalties' (i.e. user-defined offsets) to the LAeq. Penaltiessuch as these can be applied, for example, due to impulsive noise or annoying sound incidents (tones) during aperiod of rest.
Evaluation procedure
In order to calculate the Lr, you have to execute the following steps.
1. Identify & mark impulses
2. Identify & mark tones
3. Identify & mark the time of day (e.g. daytime / nighttime / weekend)
4. Optionally identify & mark special events
5. Assign individual penalties to the aforementioned Markers and calculate the Lr
Level Calculations 85
© 2020 NTi Audio AG, MBe
5.3.1 Impulse analysisHint The following guideline describes an approach how to calculate the penalties for impulses.
Please refer also to chapters British, German and Italian standard for more specific information.
Step 1 - Log the appropriate level data
· Adjust the XL2 logging parameters according to your demands,or to the applicable national standard.
· Run the measurement.
· Import the logged data to the Data Explorer.
Example of XL2 logging setup
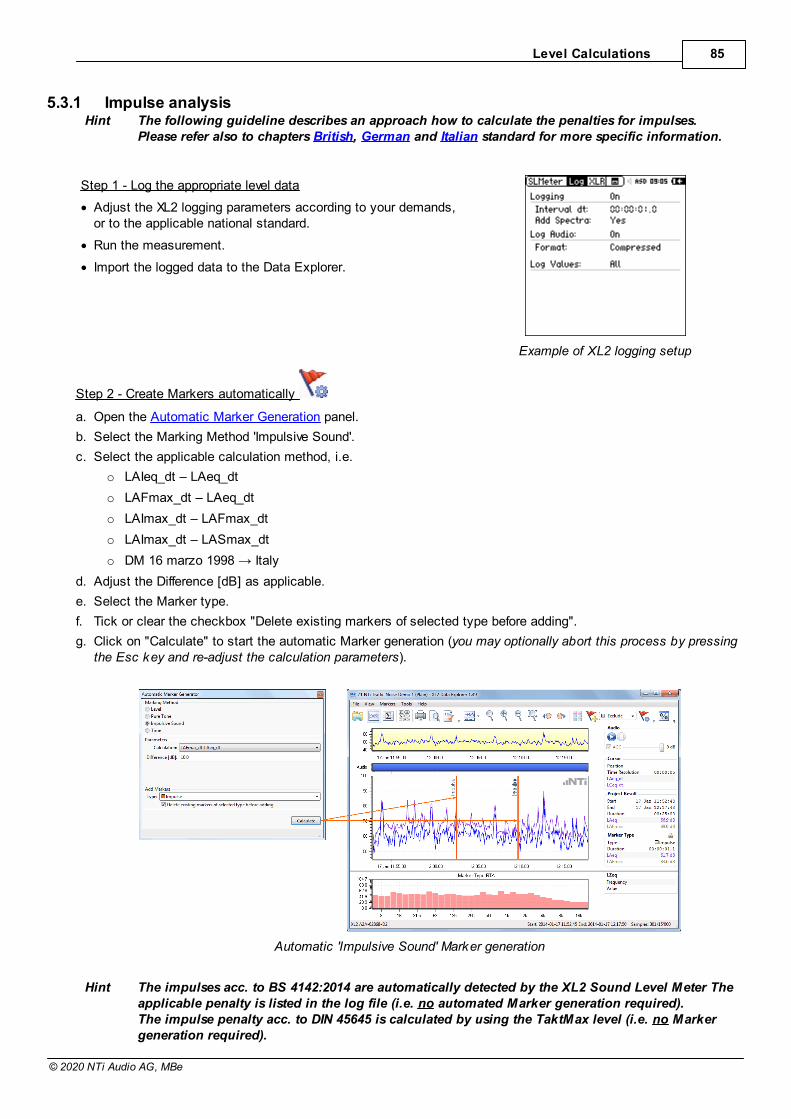
Step 2 - Create Markers automatically
a. Open the Automatic Marker Generation panel.
b. Select the Marking Method 'Impulsive Sound'.
c. Select the applicable calculation method, i.e.
o LAIeq_dt – LAeq_dt
o LAFmax_dt – LAeq_dt
o LAImax_dt – LAFmax_dt
o LAImax_dt – LASmax_dt
o DM 16 marzo 1998
d. Adjust the Difference [dB] as applicable.
e. Select the Marker type.
f. Tick or clear the checkbox "Delete existing markers of selected type before adding".
g. Click on "Calculate" to start the automatic Marker generation (you may optionally abort this process by pressingthe Esc key and re-adjust the calculation parameters).
Automatic 'Impulsive Sound' Marker generation
Hint The impulses acc. to BS 4142:2014 are automatically detected by the XL2 Sound Level Meter Theapplicable penalty is listed in the log file (i.e. no automated Marker generation required).The impulse penalty acc. to DIN 45645 is calculated by using the TaktMax level (i.e. no Markergeneration required).
XL2 DataExplorer User Manual86
© 2020 NTi Audio AG, MBe
Step 3 - Review the Markers
a. Review the automatically generated Markers and amend or delete them if necessary.
b. Optionally add Markers manually.
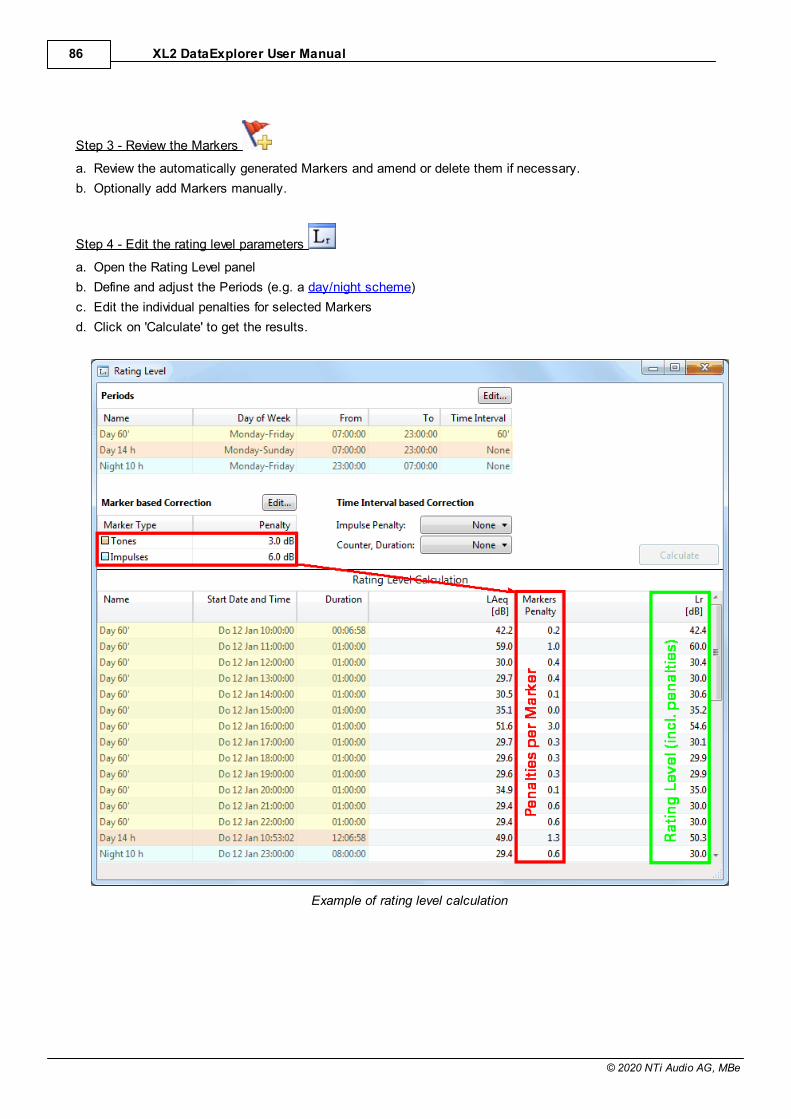
Step 4 - Edit the rating level parameters
a. Open the Rating Level panel
b. Define and adjust the Periods (e.g. a day/night scheme)
c. Edit the individual penalties for selected Markers
d. Click on 'Calculate' to get the results.
Example of rating level calculation
Level Calculations 87
© 2020 NTi Audio AG, MBe
5.3.2 Tone analysis
Basically, there are two approaches to determine penalties to represent the annoyance of tones,
i. the "Survey method" (acc. ISO 1996-2:2017), also called "Third Octave method" (acc. BS 4142:2014)
ii. the "Engineering method" (acc. ISO 1996-2:2017), also called "Reference method" (acc. BS 4142:2014)
Hint The decision, which of the aforementioned methods shall be applied may be specified by localregulations.
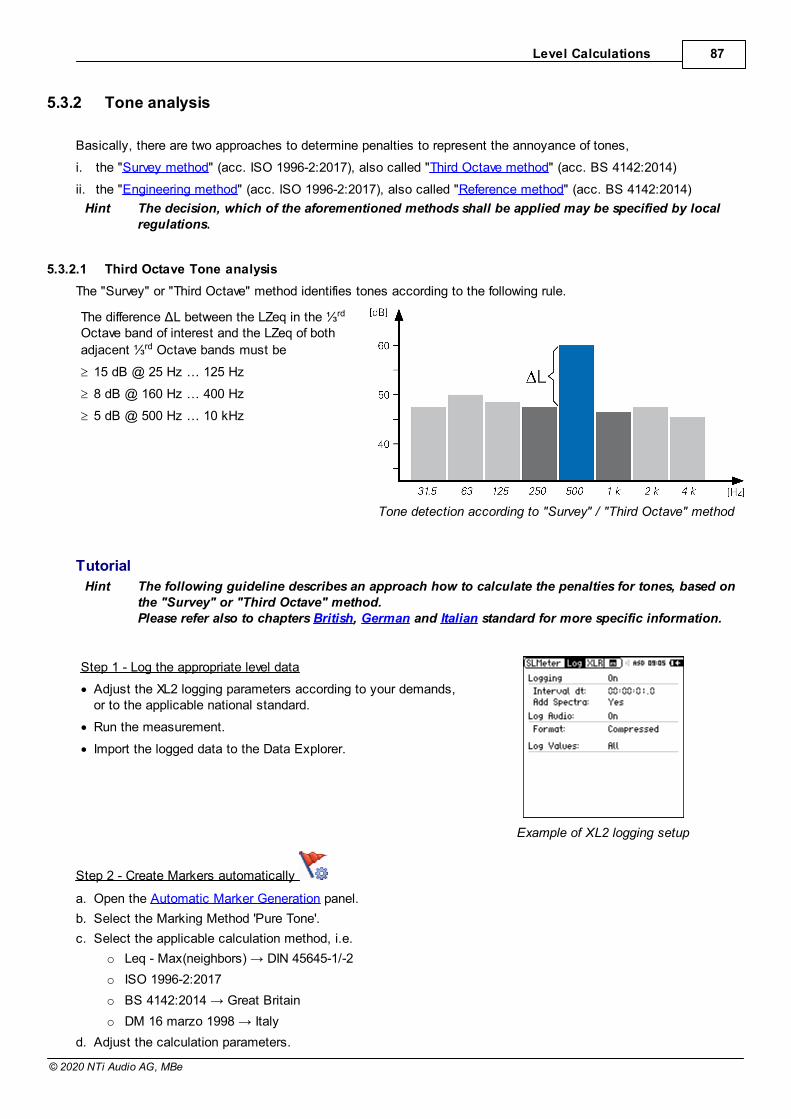
5.3.2.1 Third Octave Tone analysis
The "Survey" or "Third Octave" method identifies tones according to the following rule.
rd
Octave band of interest and the LZeq of bothrd Octave bands must be
³ 15 dB @ 25 Hz … 125 Hz
³ 8 dB @ 160 Hz … 400 Hz
³ 5 dB @ 500 Hz … 10 kHz
Tone detection according to "Survey" / "Third Octave" method
Tutorial
Hint The following guideline describes an approach how to calculate the penalties for tones, based onthe "Survey" or "Third Octave" method.Please refer also to chapters British, German and Italian standard for more specific information.
Step 1 - Log the appropriate level data
· Adjust the XL2 logging parameters according to your demands,or to the applicable national standard.
· Run the measurement.
· Import the logged data to the Data Explorer.
Example of XL2 logging setup
Step 2 - Create Markers automatically
a. Open the Automatic Marker Generation panel.
b. Select the Marking Method 'Pure Tone'.
c. Select the applicable calculation method, i.e.
o DIN 45645-1/-2
o ISO 1996-2:2017
o BS 4142:2014
o DM 16 marzo 1998
d. Adjust the calculation parameters.
XL2 DataExplorer User Manual88
© 2020 NTi Audio AG, MBe
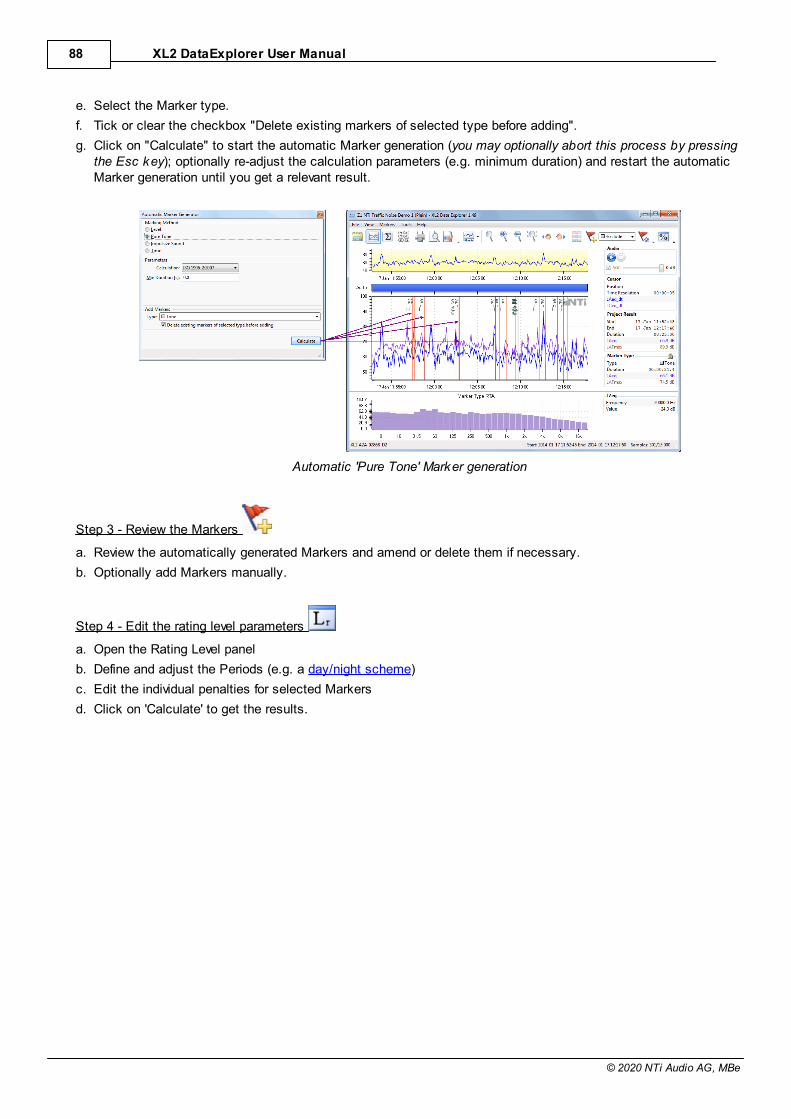
e. Select the Marker type.
f. Tick or clear the checkbox "Delete existing markers of selected type before adding".
g. Click on "Calculate" to start the automatic Marker generation (you may optionally abort this process by pressingthe Esc key); optionally re-adjust the calculation parameters (e.g. minimum duration) and restart the automaticMarker generation until you get a relevant result.
Automatic 'Pure Tone' Marker generation
Step 3 - Review the Markers
a. Review the automatically generated Markers and amend or delete them if necessary.
b. Optionally add Markers manually.
Step 4 - Edit the rating level parameters
a. Open the Rating Level panel
b. Define and adjust the Periods (e.g. a day/night scheme)
c. Edit the individual penalties for selected Markers
d. Click on 'Calculate' to get the results.
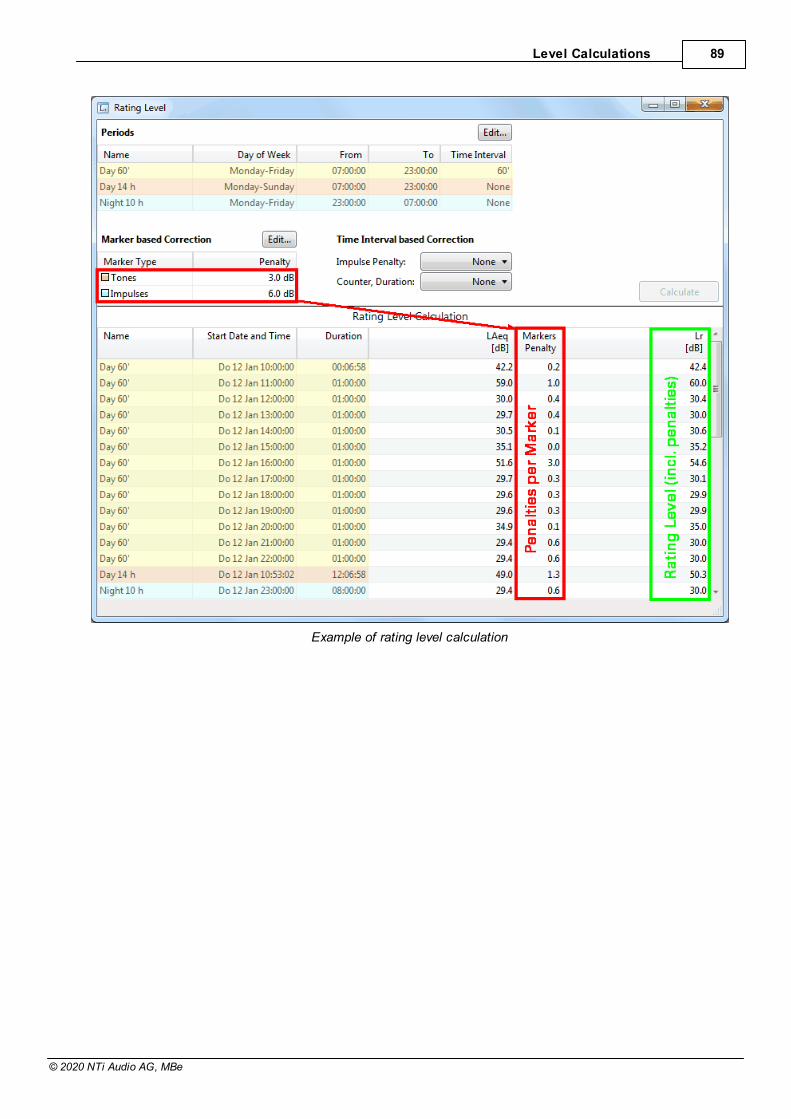
Level Calculations 89
© 2020 NTi Audio AG, MBe
Example of rating level calculation
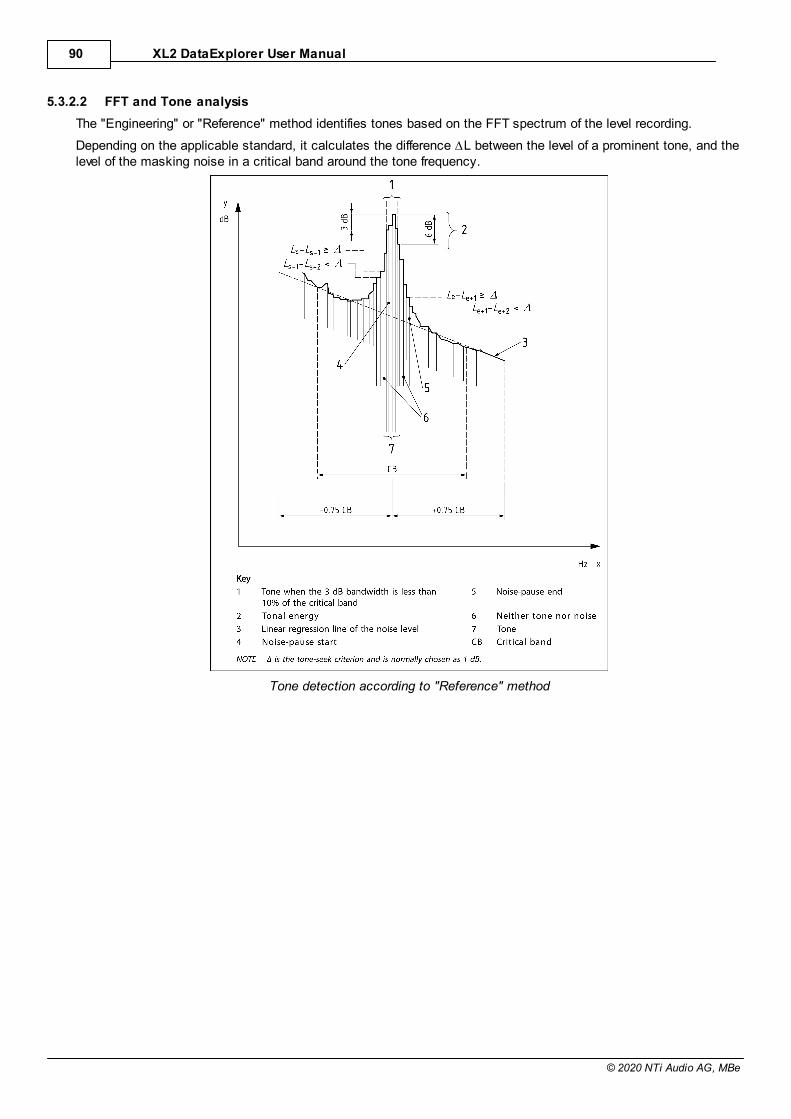
XL2 DataExplorer User Manual90
© 2020 NTi Audio AG, MBe
5.3.2.2 FFT and Tone analysis
The "Engineering" or "Reference" method identifies tones based on the FFT spectrum of the level recording.
Depending on the applicable standard, it calculates the difference ∆L between the level of a prominent tone, and thelevel of the masking noise in a critical band around the tone frequency.
Tone detection according to "Reference" method
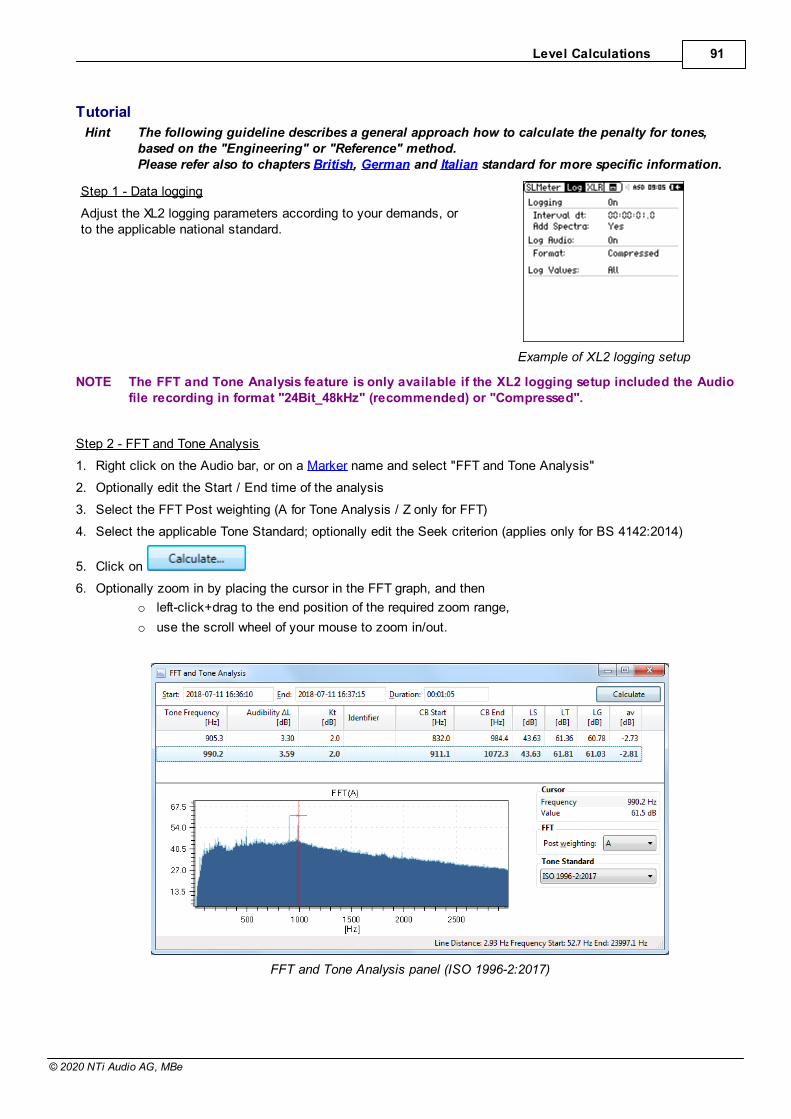
Level Calculations 91
© 2020 NTi Audio AG, MBe
Tutorial
Hint The following guideline describes a general approach how to calculate the penalty for tones,based on the "Engineering" or "Reference" method.Please refer also to chapters British, German and Italian standard for more specific information.
Step 1 - Data logging
Adjust the XL2 logging parameters according to your demands, orto the applicable national standard.
Example of XL2 logging setup
NOTE The FFT and Tone Analysis feature is only available if the XL2 logging setup included the Audiofile recording in format "24Bit_48kHz" (recommended) or "Compressed".
Step 2 - FFT and Tone Analysis
1. Right click on the Audio bar, or on a Marker name and select "FFT and Tone Analysis"
2. Optionally edit the Start / End time of the analysis
3. Select the FFT Post weighting (A for Tone Analysis / Z only for FFT)
4. Select the applicable Tone Standard; optionally edit the Seek criterion (applies only for BS 4142:2014)
5. Click on
6. Optionally zoom in by placing the cursor in the FFT graph, and then
o left-click+drag to the end position of the required zoom range,
o use the scroll wheel of your mouse to zoom in/out.
FFT and Tone Analysis panel (ISO 1996-2:2017)
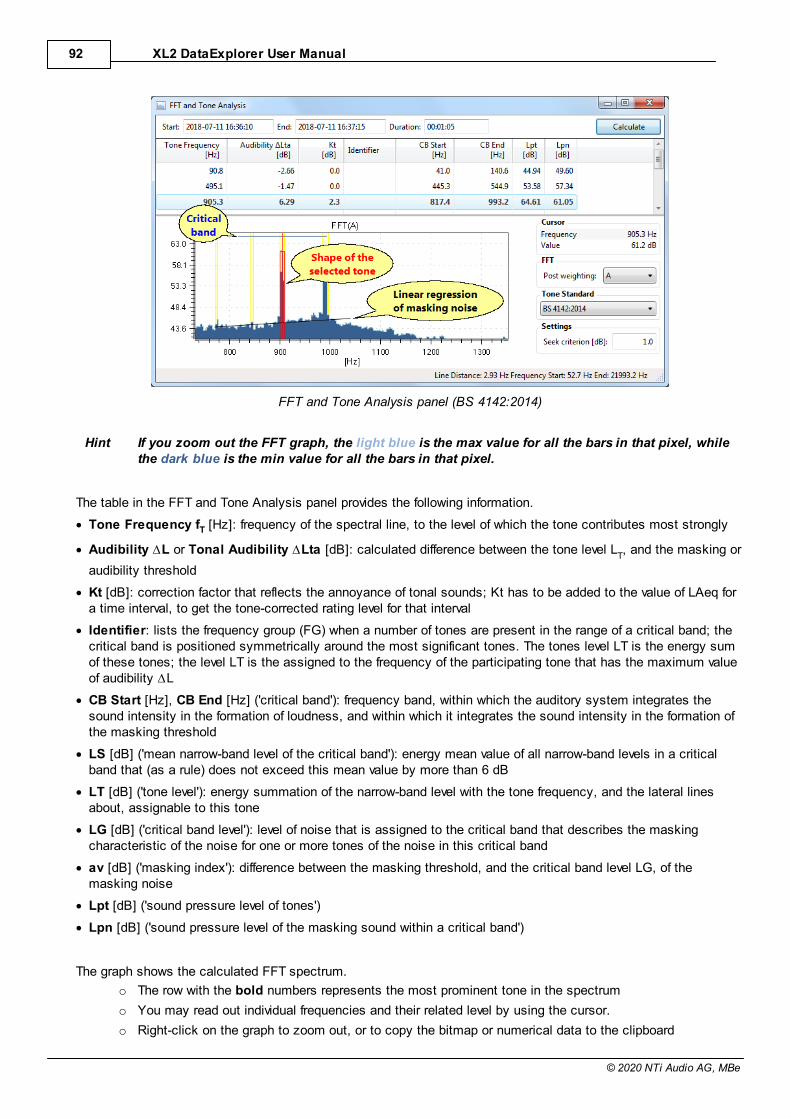
XL2 DataExplorer User Manual92
© 2020 NTi Audio AG, MBe
FFT and Tone Analysis panel (BS 4142:2014)
Hint If you zoom out the FFT graph, the light blue is the max value for all the bars in that pixel, whilethe dark blue is the min value for all the bars in that pixel.
The table in the FFT and Tone Analysis panel provides the following information.
· Tone Frequency fT [Hz]: frequency of the spectral line, to the level of which the tone contributes most strongly
· Audibility ∆L or Tonal Audibility ∆Lta [dB]: calculated difference between the tone level LT, and the masking or
audibility threshold
· Kt [dB]: correction factor that reflects the annoyance of tonal sounds; Kt has to be added to the value of LAeq fora time interval, to get the tone-corrected rating level for that interval
· Identifier: lists the frequency group (FG) when a number of tones are present in the range of a critical band; thecritical band is positioned symmetrically around the most significant tones. The tones level LT is the energy sumof these tones; the level LT is the assigned to the frequency of the participating tone that has the maximum valueof audibility ∆L
· CB Start [Hz], CB End [Hz] ('critical band'): frequency band, within which the auditory system integrates thesound intensity in the formation of loudness, and within which it integrates the sound intensity in the formation ofthe masking threshold
· LS [dB] ('mean narrow-band level of the critical band'): energy mean value of all narrow-band levels in a criticalband that (as a rule) does not exceed this mean value by more than 6 dB
· LT [dB] ('tone level'): energy summation of the narrow-band level with the tone frequency, and the lateral linesabout, assignable to this tone
· LG [dB] ('critical band level'): level of noise that is assigned to the critical band that describes the maskingcharacteristic of the noise for one or more tones of the noise in this critical band
· av [dB] ('masking index'): difference between the masking threshold, and the critical band level LG, of themasking noise
· Lpt [dB] ('sound pressure level of tones')
· Lpn [dB] ('sound pressure level of the masking sound within a critical band')
The graph shows the calculated FFT spectrum.
o The row with the bold numbers represents the most prominent tone in the spectrum
o You may read out individual frequencies and their related level by using the cursor.
o Right-click on the graph to zoom out, or to copy the bitmap or numerical data to the clipboard
Level Calculations 93
© 2020 NTi Audio AG, MBe
Furthermore, if the BS 4142:2014 has been selected, the graph may also show yellow bands = Noise Pause (i.e.local maximum in the FFT spectrum with a probability of containing a tone)
Hint Seek criterion [dB] (only available for BS 4142:2014) = level for the tone detection in the FFTspectrum. For normal and smooth spectra, a tone Seek criterion of 1 dB works without problems;for irregular spectra values up to 3 dB or 4dB can give better results.
Step 3 - Note the penalty
· Manually note the highest penalty Kt [dB] shown in the table and add it to the rating level, or
· Right-click on the table to copy the rows to the clipboard, or to export the numerical data to an MS Excelspreadsheet.
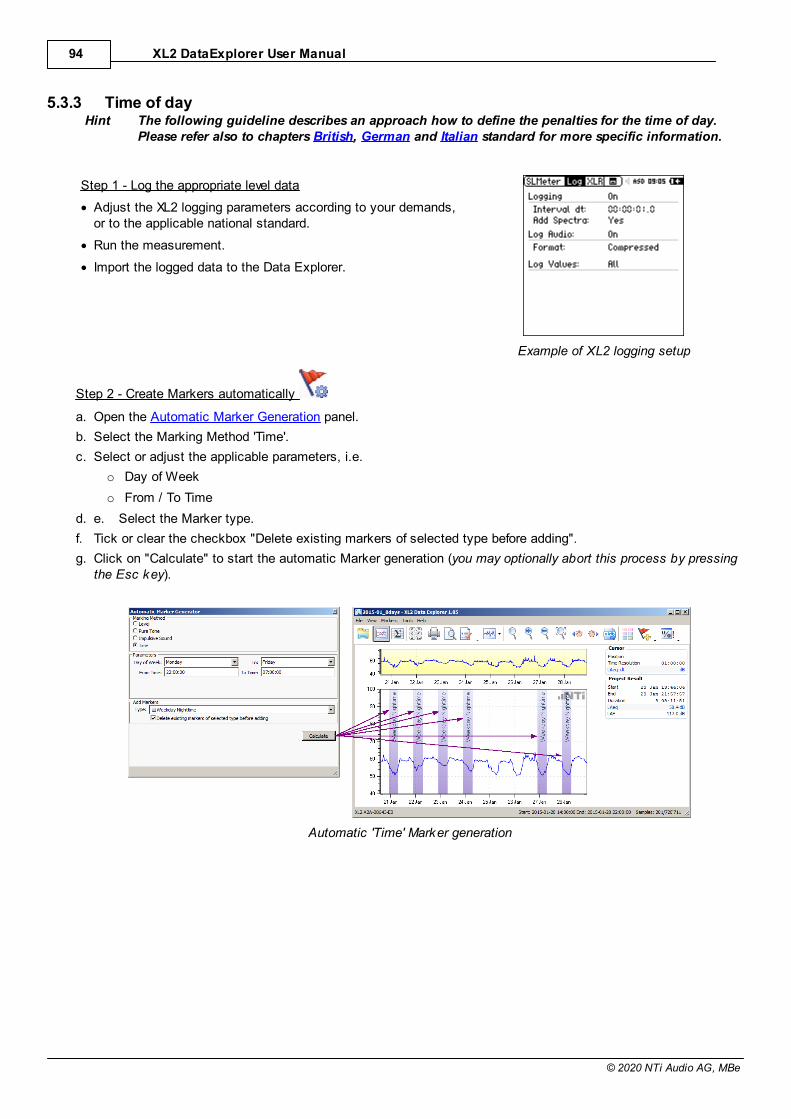
XL2 DataExplorer User Manual94
© 2020 NTi Audio AG, MBe
5.3.3 Time of dayHint The following guideline describes an approach how to define the penalties for the time of day.
Please refer also to chapters British, German and Italian standard for more specific information.
Step 1 - Log the appropriate level data
· Adjust the XL2 logging parameters according to your demands,or to the applicable national standard.
· Run the measurement.
· Import the logged data to the Data Explorer.
Example of XL2 logging setup
Step 2 - Create Markers automatically
a. Open the Automatic Marker Generation panel.
b. Select the Marking Method 'Time'.
c. Select or adjust the applicable parameters, i.e.
o Day of Week
o From / To Time
d. e. Select the Marker type.
f. Tick or clear the checkbox "Delete existing markers of selected type before adding".
g. Click on "Calculate" to start the automatic Marker generation (you may optionally abort this process by pressingthe Esc key).
Automatic 'Time' Marker generation
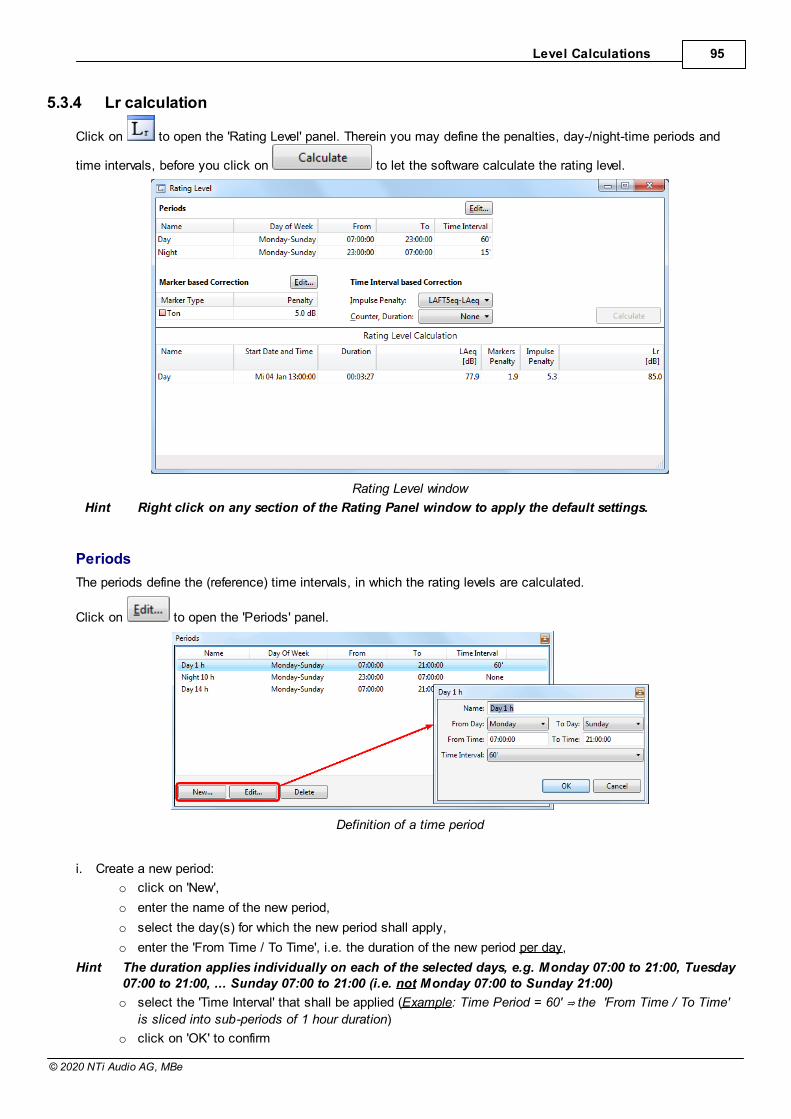
Level Calculations 95
© 2020 NTi Audio AG, MBe
5.3.4 Lr calculation
Click on to open the 'Rating Level' panel. Therein you may define the penalties, day-/night-time periods and
time intervals, before you click on to let the software calculate the rating level.
Rating Level window
Hint Right click on any section of the Rating Panel window to apply the default settings.
Periods
The periods define the (reference) time intervals, in which the rating levels are calculated.
Click on to open the 'Periods' panel.
Definition of a time period
i. Create a new period:
o click on 'New',
o enter the name of the new period,
o select the day(s) for which the new period shall apply,
o enter the 'From Time / To Time', i.e. the duration of the new period per day,
Hint The duration applies individually on each of the selected days, e.g. Monday 07:00 to 21:00, Tuesday07:00 to 21:00, ... Sunday 07:00 to 21:00 (i.e. not Monday 07:00 to Sunday 21:00)
o select the 'Time Interval' that shall be applied (Example
is sliced into sub-periods of 1 hour duration)
o click on 'OK' to confirm
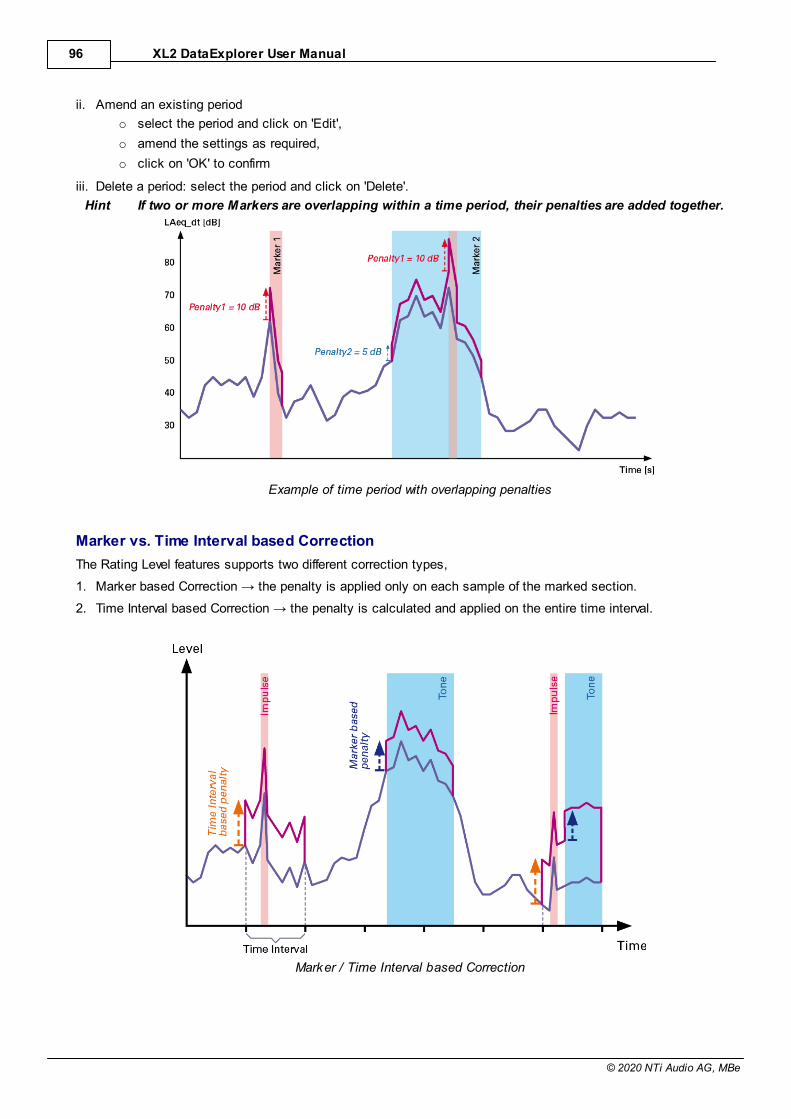
XL2 DataExplorer User Manual96
© 2020 NTi Audio AG, MBe
ii. Amend an existing period
o select the period and click on 'Edit',
o amend the settings as required,
o click on 'OK' to confirm
iii. Delete a period: select the period and click on 'Delete'.
Hint If two or more Markers are overlapping within a time period, their penalties are added together.
Example of time period with overlapping penalties
Marker vs. Time Interval based Correction
The Rating Level features supports two different correction types,
1.
2.
Marker / Time Interval based Correction
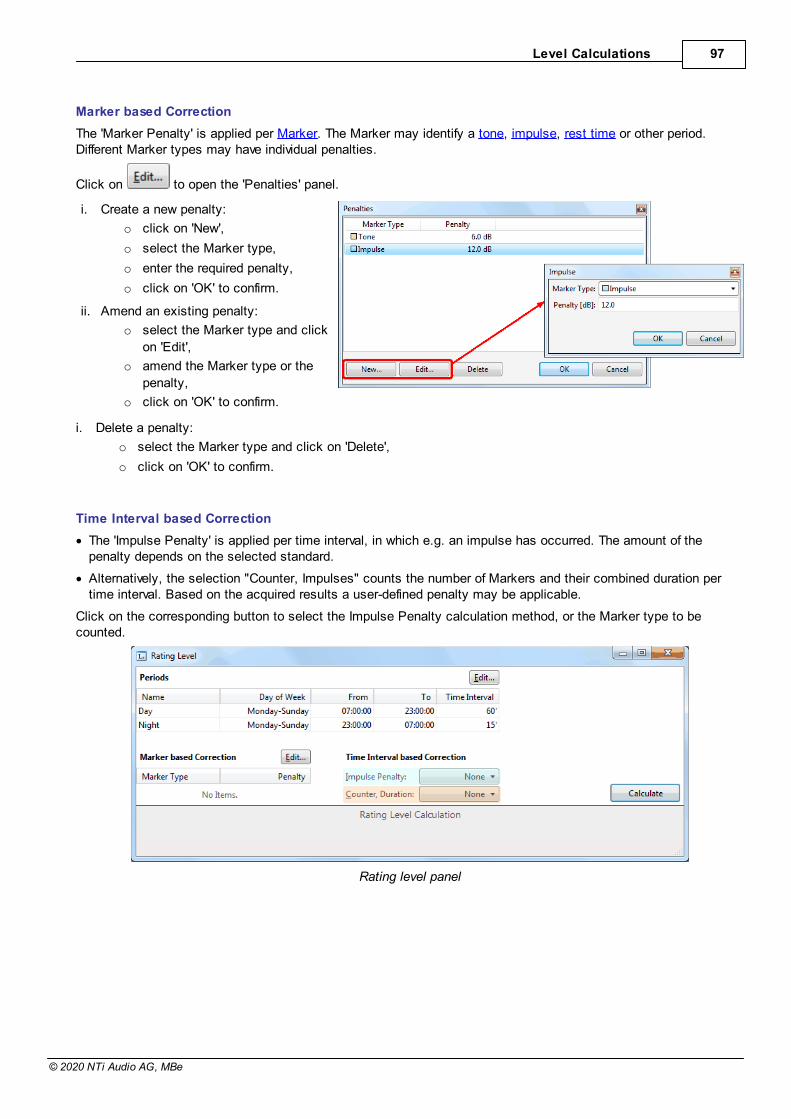
Level Calculations 97
© 2020 NTi Audio AG, MBe
Marker based Correction
The 'Marker Penalty' is applied per Marker. The Marker may identify a tone, impulse, rest time or other period.Different Marker types may have individual penalties.
Click on to open the 'Penalties' panel.
i. Create a new penalty:
o click on 'New',
o select the Marker type,
o enter the required penalty,
o click on 'OK' to confirm.
ii. Amend an existing penalty:
o select the Marker type and click
on 'Edit',
o amend the Marker type or the
penalty,
o click on 'OK' to confirm.
i. Delete a penalty:
o select the Marker type and click on 'Delete',
o click on 'OK' to confirm.
Time Interval based Correction
· The 'Impulse Penalty' is applied per time interval, in which e.g. an impulse has occurred. The amount of thepenalty depends on the selected standard.
· Alternatively, the selection "Counter, Impulses" counts the number of Markers and their combined duration pertime interval. Based on the acquired results a user-defined penalty may be applicable.
Click on the corresponding button to select the Impulse Penalty calculation method, or the Marker type to becounted.
Rating level panel
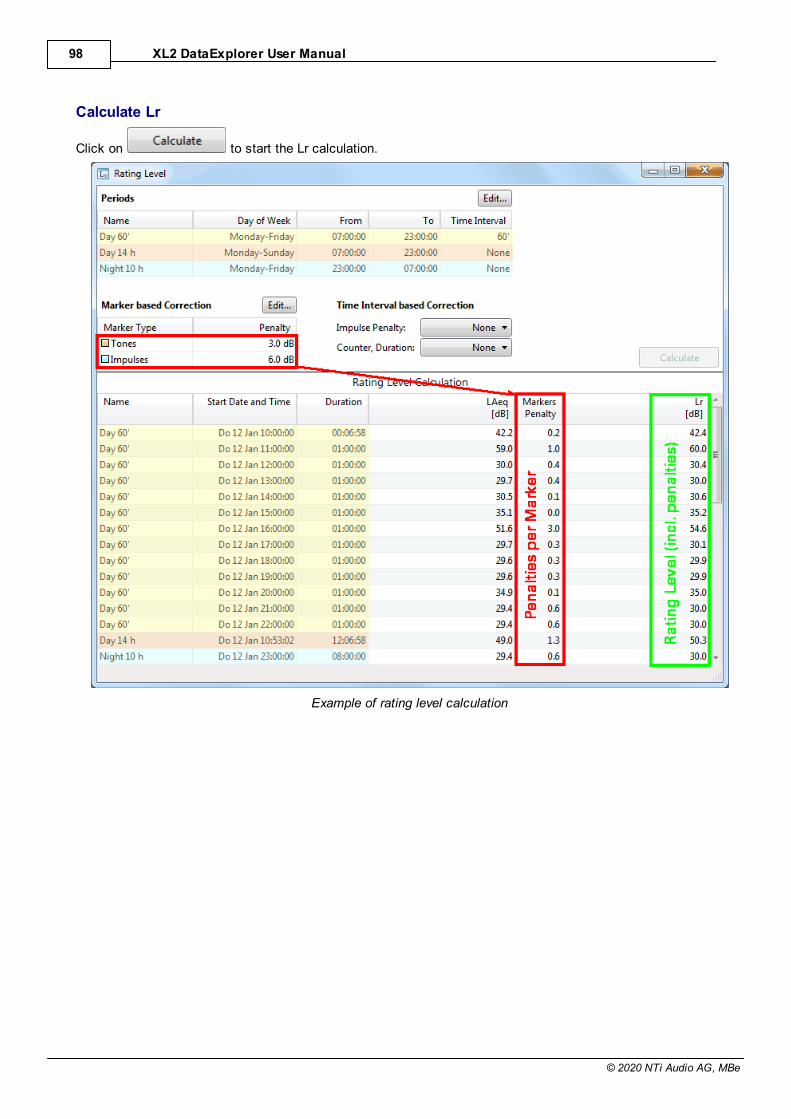
XL2 DataExplorer User Manual98
© 2020 NTi Audio AG, MBe
Calculate Lr
Click on to start the Lr calculation.
Example of rating level calculation
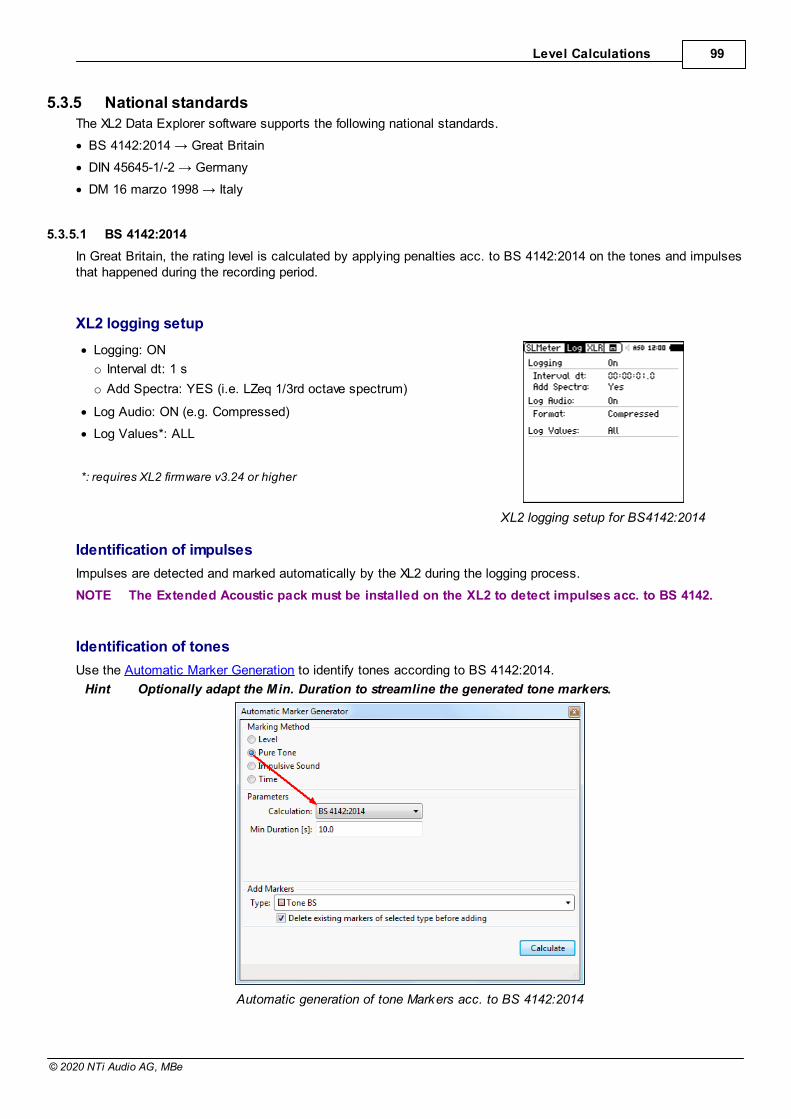
Level Calculations 99
© 2020 NTi Audio AG, MBe
5.3.5 National standardsThe XL2 Data Explorer software supports the following national standards.
· BS 4142:2014
· DIN 45645-1/-2
· DM 16 marzo 1998
5.3.5.1 BS 4142:2014
In Great Britain, the rating level is calculated by applying penalties acc. to BS 4142:2014 on the tones and impulsesthat happened during the recording period.
XL2 logging setup
· Logging: ON
o Interval dt: 1 s
o Add Spectra: YES (i.e. LZeq 1/3rd octave spectrum)
· Log Audio: ON (e.g. Compressed)
· Log Values*: ALL
*: requires XL2 firmware v3.24 or higher
XL2 logging setup for BS4142:2014
Identification of impulses
Impulses are detected and marked automatically by the XL2 during the logging process.
NOTE The Extended Acoustic pack must be installed on the XL2 to detect impulses acc. to BS 4142.
Identification of tones
Use the Automatic Marker Generation to identify tones according to BS 4142:2014.
Hint Optionally adapt the Min. Duration to streamline the generated tone markers.
Automatic generation of tone Markers acc. to BS 4142:2014
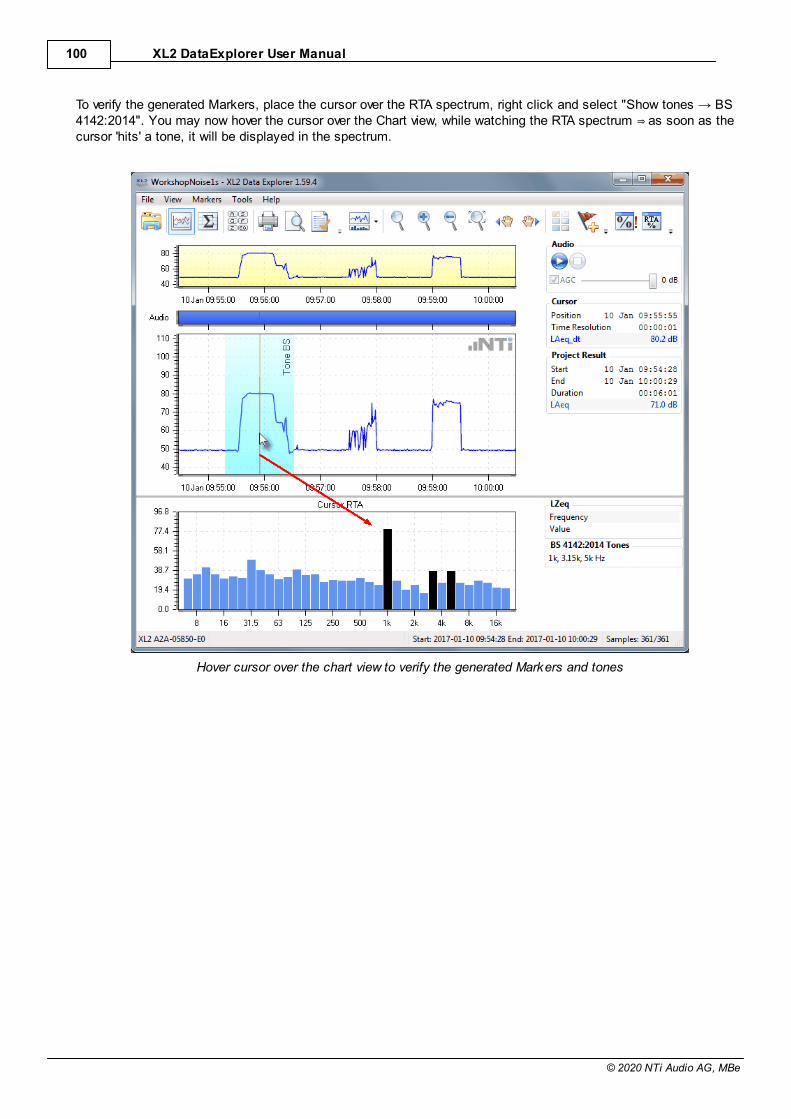
XL2 DataExplorer User Manual100
© 2020 NTi Audio AG, MBe
4142:2014". You may now cursor 'hits' a tone, it will be displayed in the spectrum.
Hover cursor over the chart view to verify the generated Markers and tones
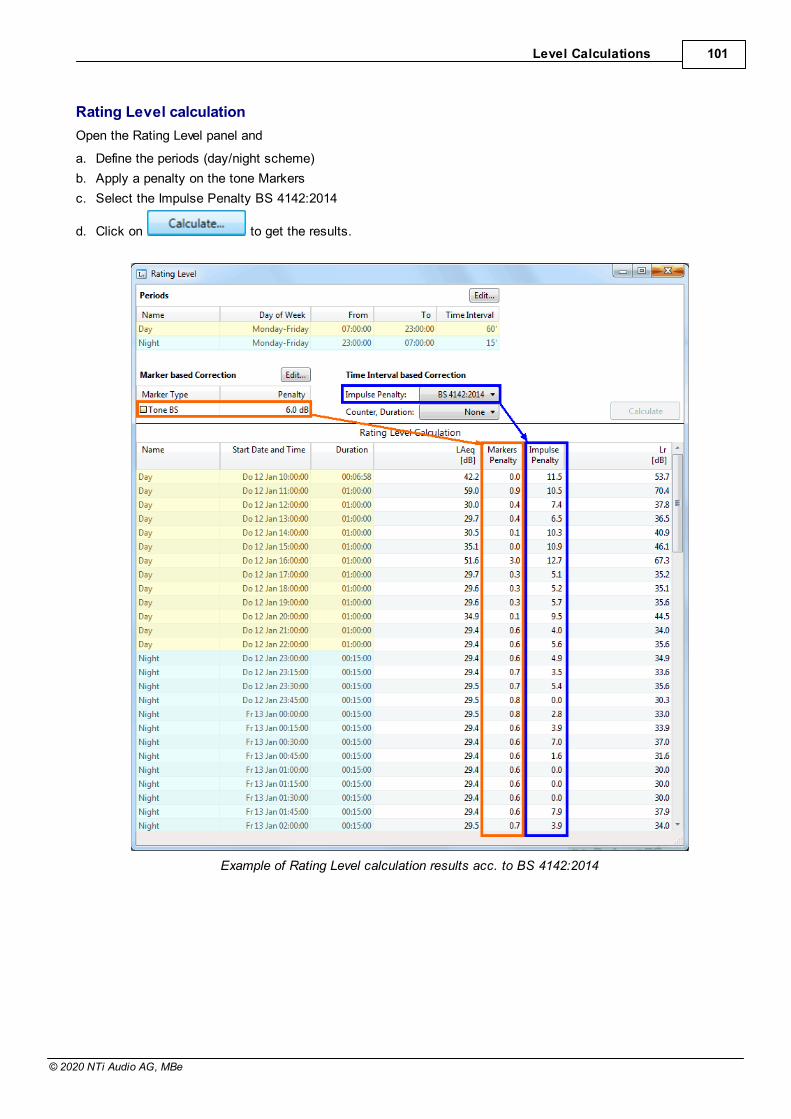
Level Calculations 101
© 2020 NTi Audio AG, MBe
Rating Level calculation
Open the Rating Level panel and
a. Define the periods (day/night scheme)
b. Apply a penalty on the tone Markers
c. Select the Impulse Penalty BS 4142:2014
d. Click on to get the results.
Example of Rating Level calculation results acc. to BS 4142:2014
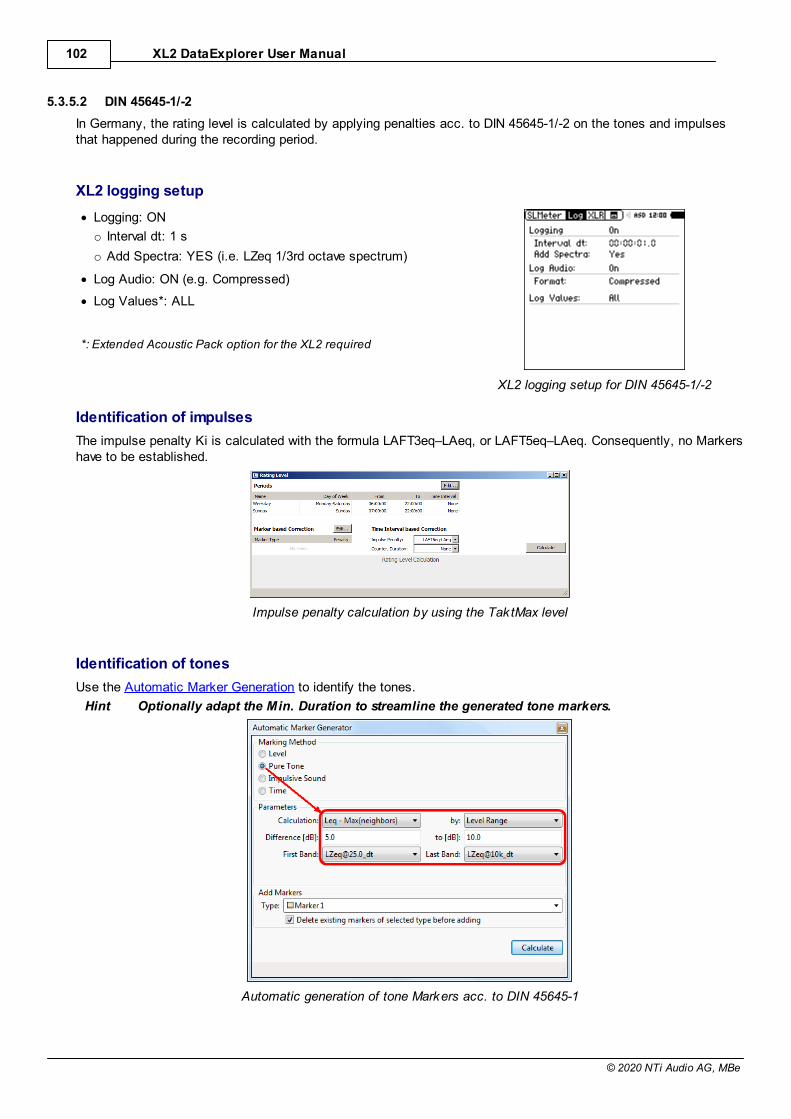
XL2 DataExplorer User Manual102
© 2020 NTi Audio AG, MBe
5.3.5.2 DIN 45645-1/-2
In Germany, the rating level is calculated by applying penalties acc. to DIN 45645-1/-2 on the tones and impulsesthat happened during the recording period.
XL2 logging setup
· Logging: ON
o Interval dt: 1 s
o Add Spectra: YES (i.e. LZeq 1/3rd octave spectrum)
· Log Audio: ON (e.g. Compressed)
· Log Values*: ALL
*: Extended Acoustic Pack option for the XL2 required
XL2 logging setup for DIN 45645-1/-2
Identification of impulses
The impulse penalty Ki is calculated with the formula LAFT3eq–LAeq, or LAFT5eq–LAeq. Consequently, no Markershave to be established.
Impulse penalty calculation by using the TaktMax level
Identification of tones
Use the Automatic Marker Generation to identify the tones.
Hint Optionally adapt the Min. Duration to streamline the generated tone markers.
Automatic generation of tone Markers acc. to DIN 45645-1
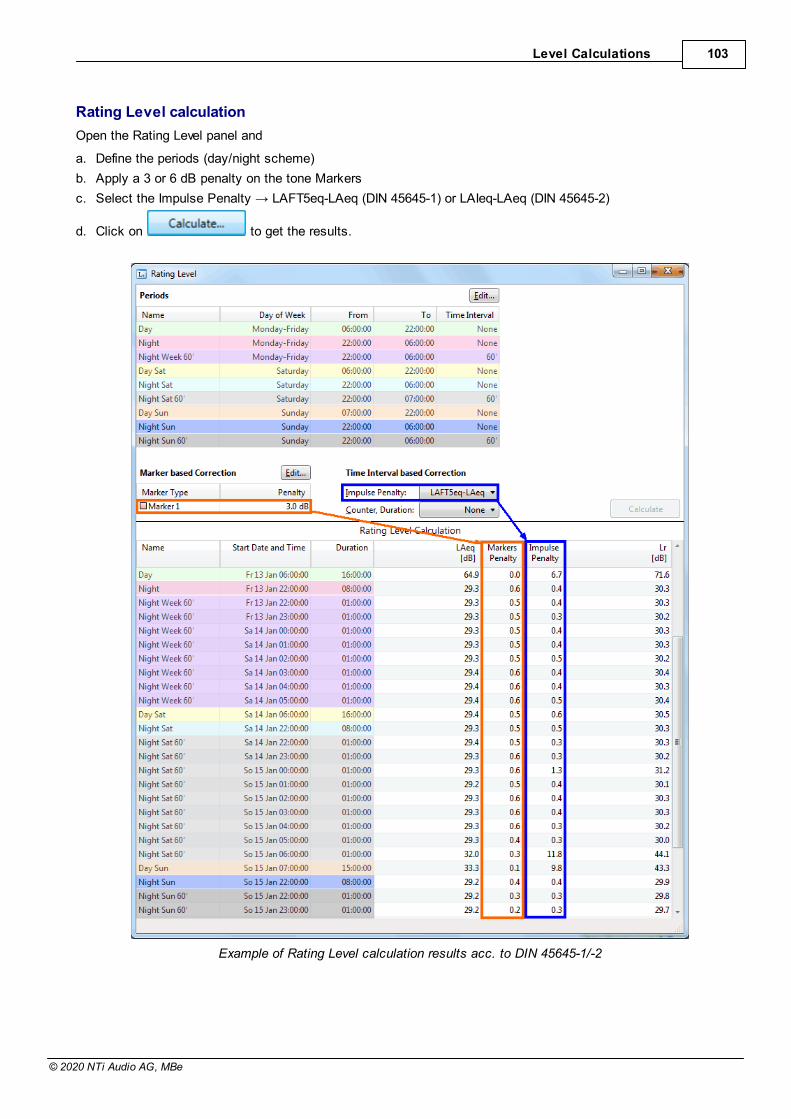
Level Calculations 103
© 2020 NTi Audio AG, MBe
Rating Level calculation
Open the Rating Level panel and
a. Define the periods (day/night scheme)
b. Apply a 3 or 6 dB penalty on the tone Markers
c.
d. Click on to get the results.
Example of Rating Level calculation results acc. to DIN 45645-1/-2
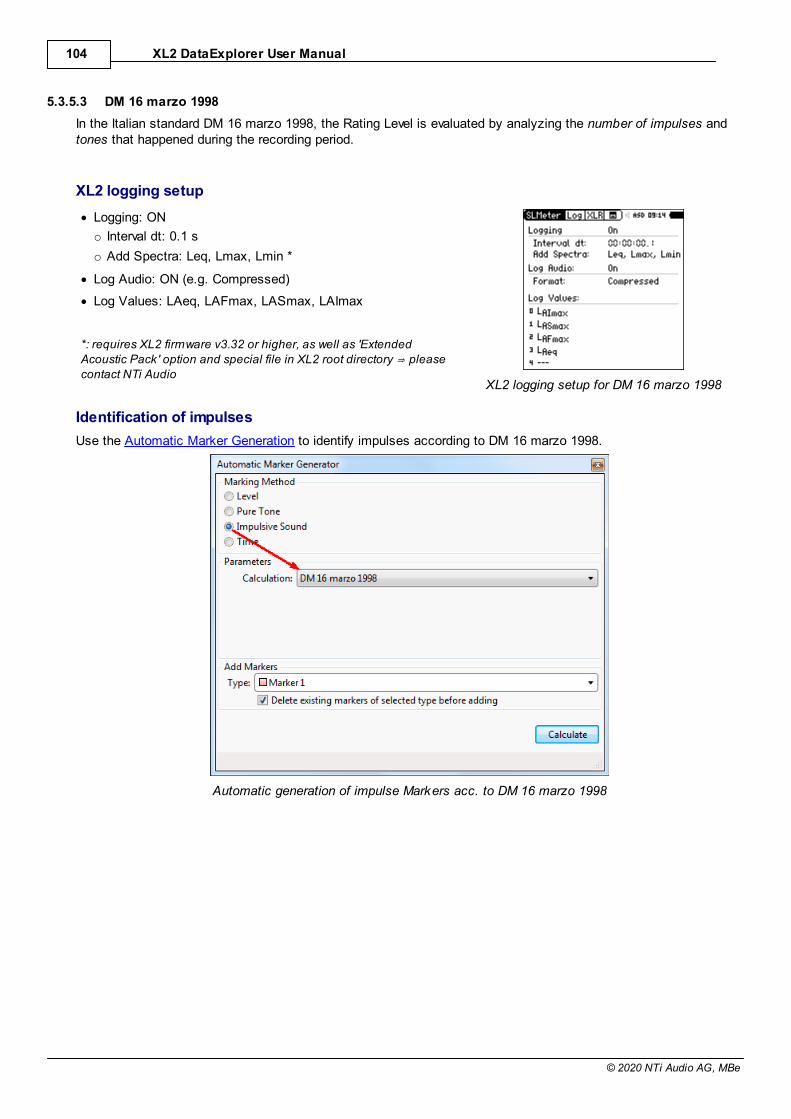
XL2 DataExplorer User Manual104
© 2020 NTi Audio AG, MBe
5.3.5.3 DM 16 marzo 1998
In the Italian standard DM 16 marzo 1998, the Rating Level is evaluated by analyzing the number of impulses andtones that happened during the recording period.
XL2 logging setup
· Logging: ON
o Interval dt: 0.1 s
o Add Spectra: Leq, Lmax, Lmin *
· Log Audio: ON (e.g. Compressed)
· Log Values: LAeq, LAFmax, LASmax, LAImax
*: requires XL2 firmware v3.32 or higher, as well as 'Extended
contact NTi AudioXL2 logging setup for DM 16 marzo 1998
Identification of impulses
Use the Automatic Marker Generation to identify impulses according to DM 16 marzo 1998.
Automatic generation of impulse Markers acc. to DM 16 marzo 1998
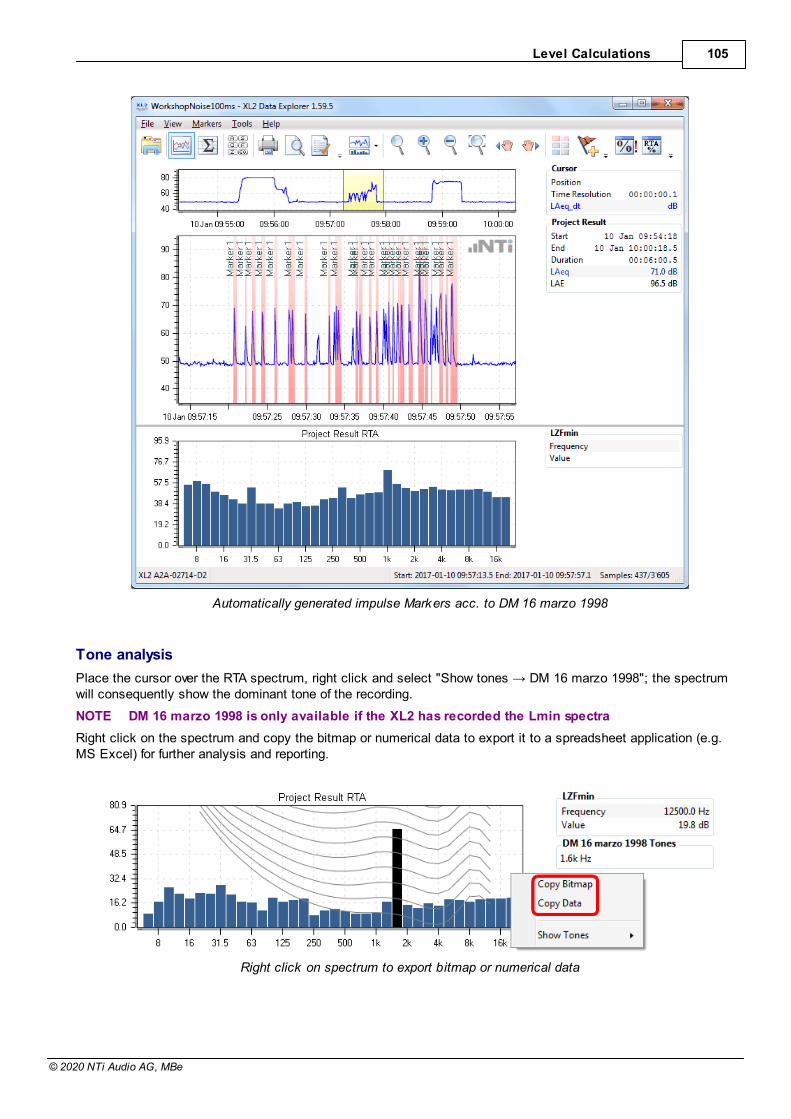
Level Calculations 105
© 2020 NTi Audio AG, MBe
Automatically generated impulse Markers acc. to DM 16 marzo 1998
Tone analysis
will consequently show the dominant tone of the recording.
NOTE DM 16 marzo 1998 is only available if the XL2 has recorded the Lmin spectra
Right click on the spectrum and copy the bitmap or numerical data to export it to a spreadsheet application (e.g.MS Excel) for further analysis and reporting.
Right click on spectrum to export bitmap or numerical data
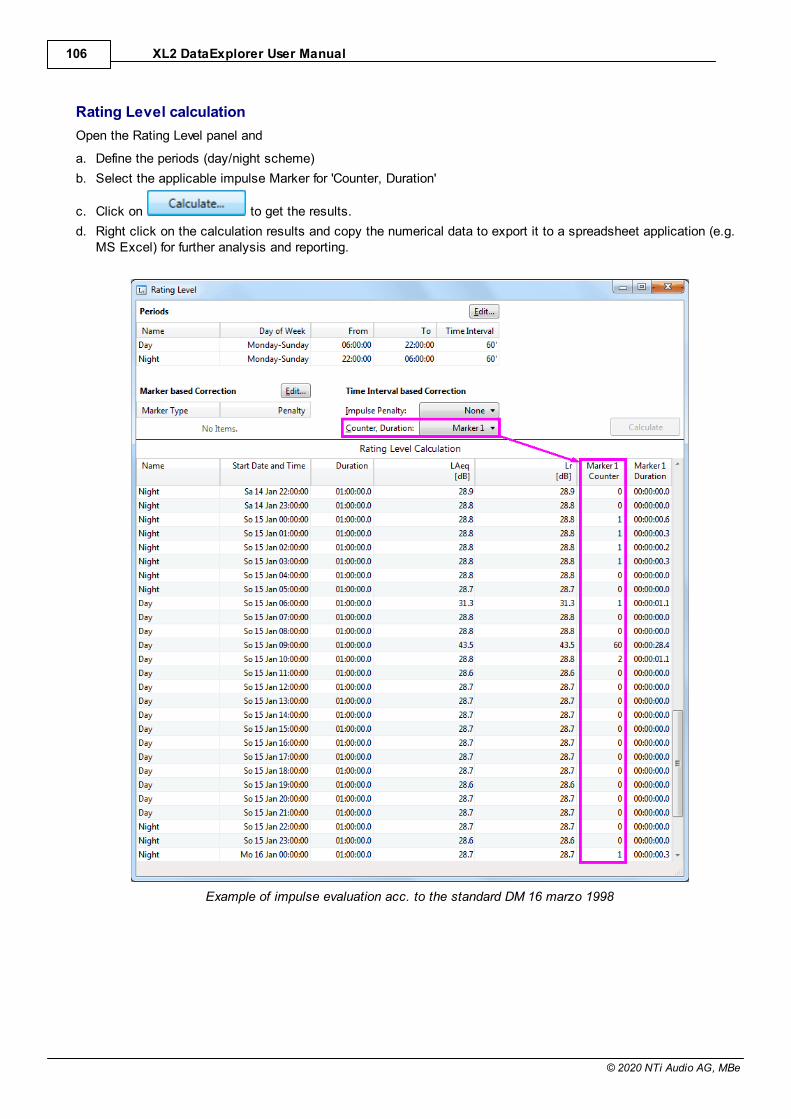
XL2 DataExplorer User Manual106
© 2020 NTi Audio AG, MBe
Rating Level calculation
Open the Rating Level panel and
a. Define the periods (day/night scheme)
b. Select the applicable impulse Marker for 'Counter, Duration'
c. Click on to get the results.
d. Right click on the calculation results and copy the numerical data to export it to a spreadsheet application (e.g.MS Excel) for further analysis and reporting.
Example of impulse evaluation acc. to the standard DM 16 marzo 1998

Part
VI
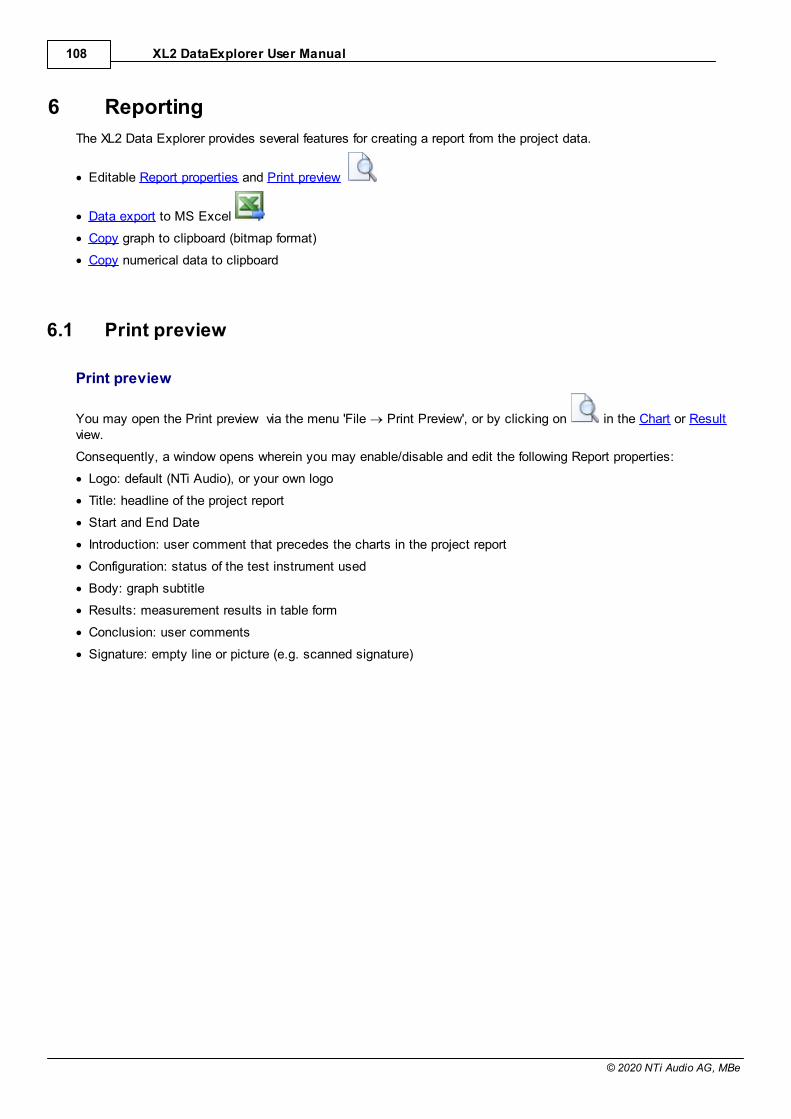
XL2 DataExplorer User Manual108
© 2020 NTi Audio AG, MBe
6 Reporting
The XL2 Data Explorer provides several features for creating a report from the project data.
· Editable Report properties and Print preview
· Data export to MS Excel
· Copy graph to clipboard (bitmap format)
· Copy numerical data to clipboard
6.1 Print preview
Print preview
You may open the Print preview via the menu 'File ® Print Preview', or by clicking on in the Chart or Resultview.
Consequently, a window opens wherein you may enable/disable and edit the following Report properties:
· Logo: default (NTi Audio), or your own logo
· Title: headline of the project report
· Start and End Date
· Introduction: user comment that precedes the charts in the project report
· Configuration: status of the test instrument used
· Body: graph subtitle
· Results: measurement results in table form
· Conclusion: user comments
· Signature: empty line or picture (e.g. scanned signature)
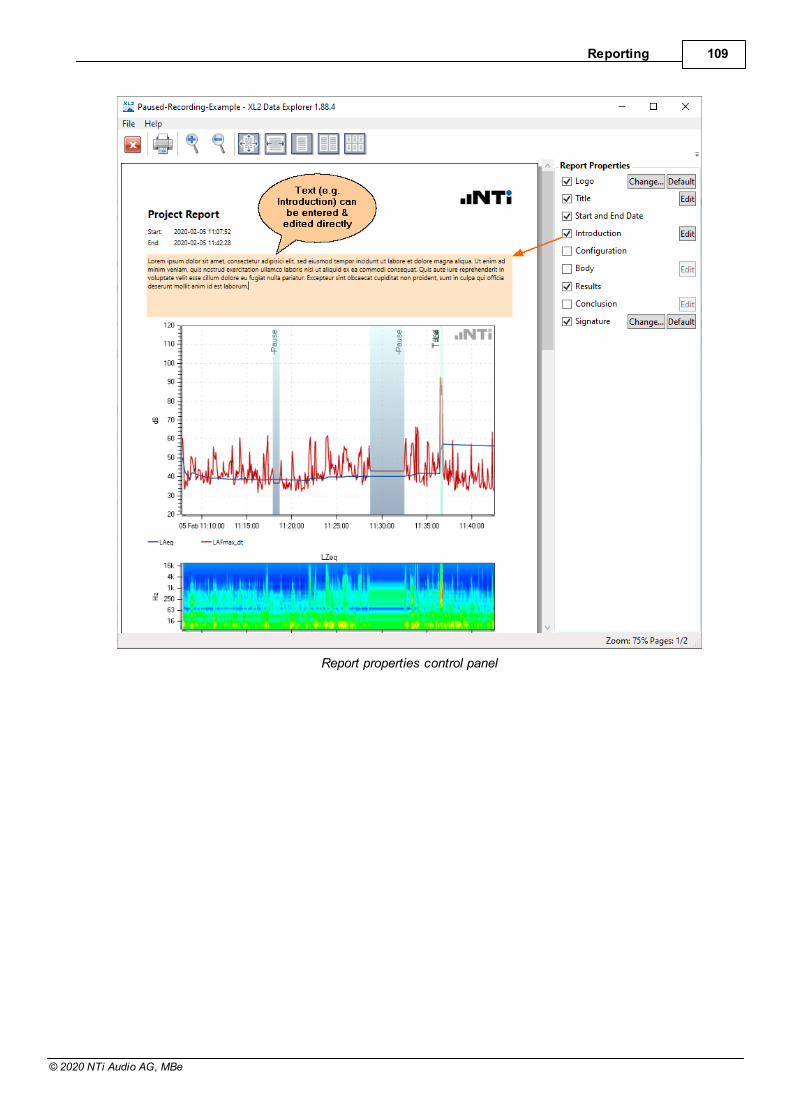
Reporting 109
© 2020 NTi Audio AG, MBe
Report properties control panel
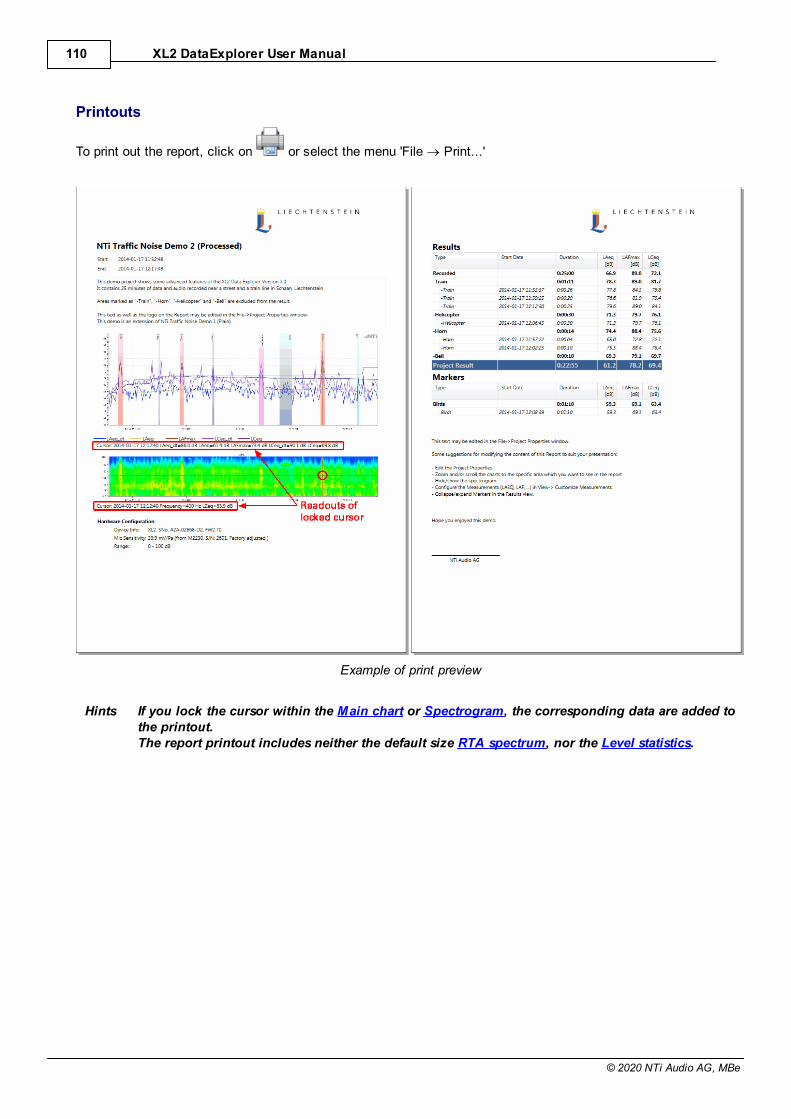
XL2 DataExplorer User Manual110
© 2020 NTi Audio AG, MBe
Printouts
To print out the report, click on or select the menu 'File ® Print...'
Example of print preview
Hints If you lock the cursor within the Main chart or Spectrogram, the corresponding data are added tothe printout.The report printout includes neither the default size RTA spectrum, nor the Level statistics.
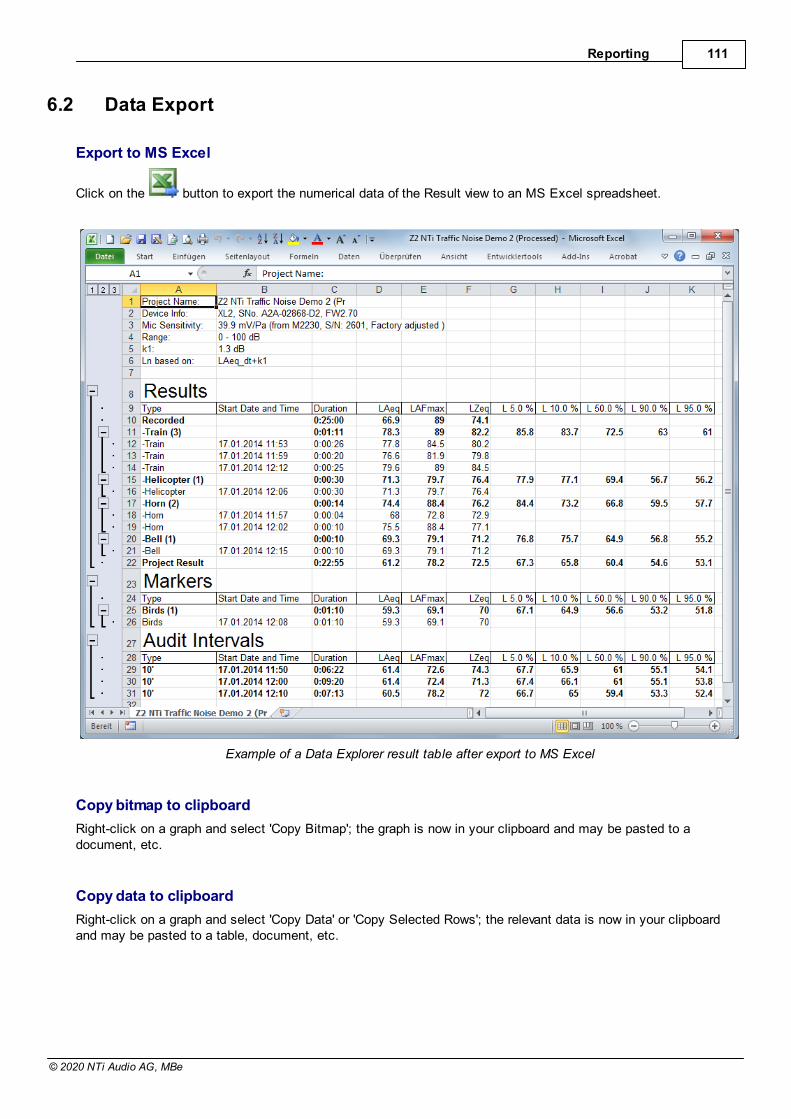
Reporting 111
© 2020 NTi Audio AG, MBe
6.2 Data Export
Export to MS Excel
Click on the button to export the numerical data of the Result view to an MS Excel spreadsheet.
Example of a Data Explorer result table after export to MS Excel
Copy bitmap to clipboard
Right-click on a graph and select 'Copy Bitmap'; the graph is now in your clipboard and may be pasted to adocument, etc.
Copy data to clipboard
Right-click on a graph and select 'Copy Data' or 'Copy Selected Rows'; the relevant data is now in your clipboardand may be pasted to a table, document, etc.
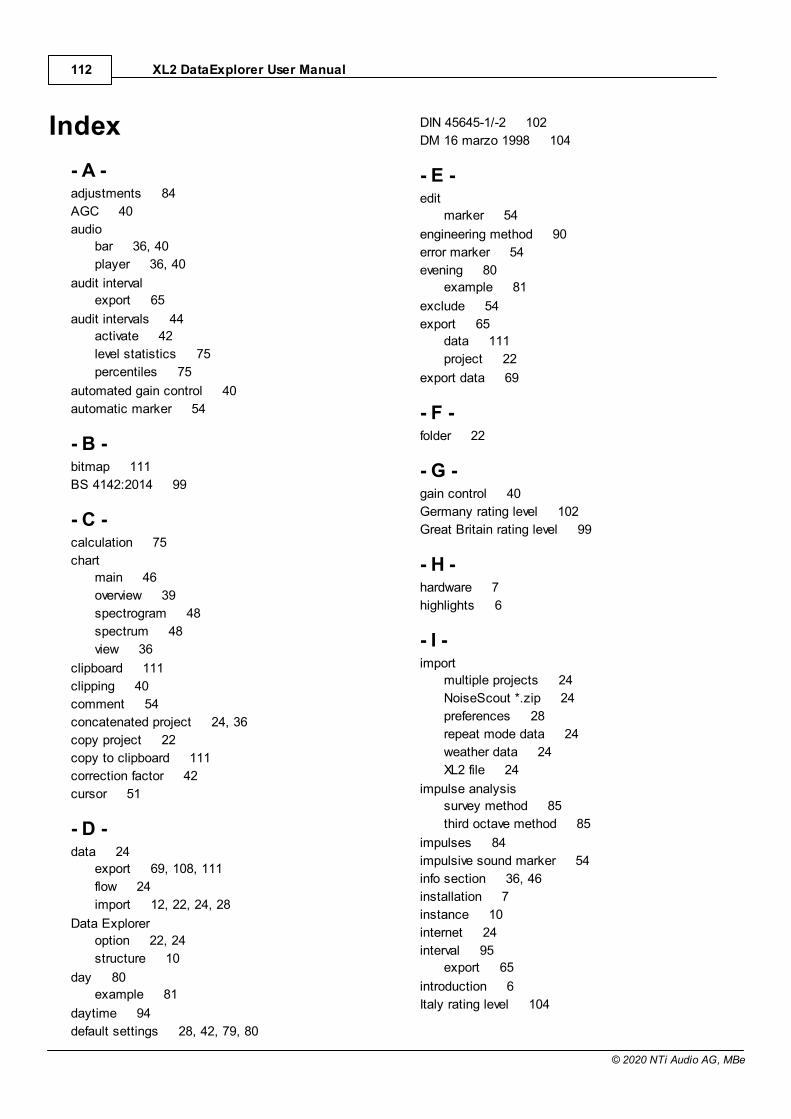
XL2 DataExplorer User Manual112
© 2020 NTi Audio AG, MBe
Index
- A -adjustments 84
AGC 40
audio
bar 36, 40
player 36, 40
audit interval
export 65
audit intervals 44
activate 42
level statistics 75
percentiles 75
automated gain control 40
automatic marker 54
- B -bitmap 111
BS 4142:2014 99
- C -calculation 75
chart
main 46
overview 39
spectrogram 48
spectrum 48
view 36
clipboard 111
clipping 40
comment 54
concatenated project 24, 36
copy project 22
copy to clipboard 111
correction factor 42
cursor 51
- D -data 24
export 69, 108, 111
flow 24
import 12, 22, 24, 28
Data Explorer
option 22, 24
structure 10
day 80
example 81
daytime 94
default settings 28, 42, 79, 80
DIN 45645-1/-2 102
DM 16 marzo 1998 104
- E -edit
marker 54
engineering method 90
error marker 54
evening 80
example 81
exclude 54
export 65
data 111
project 22
export data 69
- F -folder 22
- G -gain control 40
Germany rating level 102
Great Britain rating level 99
- H -hardware 7
highlights 6
- I -import
multiple projects 24
NoiseScout *.zip 24
preferences 28
repeat mode data 24
weather data 24
XL2 file 24
impulse analysis
survey method 85
third octave method 85
impulses 84
impulsive sound marker 54
info section 36, 46
installation 7
instance 10
internet 24
interval 95
export 65
introduction 6
Italy rating level 104
Index 113
© 2020 NTi Audio AG, MBe
- K -k1, k2 42
key marker 54
- L -LDEN 80
example 81
legacy data 24
legend 48
level
display 46
marker 54
overview 39
results 69
setup 42
setup default 28
spectrum 48
statistics 75
level marker 54
license 24
license agreement 19
lock cursor 51
- M -main chart 36, 46
marker
automatic 54
data 69
export 65
result view 71
spectrum 54
measurement results 46
midnight 80
MS Excel 111
multiple instances 10
- N -night 80
example 81
nighttime 94
NoiseScout 24
notes 54
NTi Audio 6, 19
- O -option 22, 24
overview chart 36, 39
- P -pan 53
pause 54
penalties 84
penalty 80
impulse 85
tone 87, 90
percentiles 75, 78, 79
default 28
period 95
post trigger 54
pre trigger 54
probability 75
project 22
concatenate 24, 36
content 34
copy 22
export 65
import 24
info 34, 36
restore 22
save 22
pure tone 54
pure tone marker 54
- R -rating level
calculation 95
definition 84
Germany 102
Great Britain 99
Italy 104
read-only mode 10
readout 51
reference method 90
repeat mode
data import 24
replay
sound file 40
voice note 22, 40
replay sound file 51
Replay Voice Note 41
report 108
restore project 22
result view 69
RTA
levels default 28
RTA spectrum 48
XL2 DataExplorer User Manual114
© 2020 NTi Audio AG, MBe
- S -save project 10, 22
separator 36
setup levels 42
default 28
share project 22, 24
shift zoom range 53
software
installation 7
structure 10
sound file 40
special events 84
spectrogram 36, 48
spectrum 36, 48, 54
standard
Great Britain 99
Italy 104
statistics
level 75
RTA 78
step-by-step 12
structure 10
support 6
survey method 85, 87
- T -table export 111
TaktMax 28
third octave method 84, 85, 87
threshold 54
time
marker 54
of marker 54
time axis 36
time of day 84, 94
tonality 54
tone analysis 87
engineering method 90
FFT 90
reference method 90
survey method 87
third octave method 87
tone marker 54
tones 84
trial mode 24
trigger 54
tutorial
basics 12
- U -undo amendments 22
- V -view 10
chart 36
project 22
result 69
voice note 22, 40
- W -weather data
import 24
marker 54
weekday 94
- X -X-axis zoom 53
XL2
marker 54
XL2 Data Explorer
option 22, 24
structure 10
XL2 setup 12
- Y -Y-axis scale 53
default 28
- Z -zoom 51, 53

Notes
115
© 2020 NTi Audio AG, MBe