WORKING PAPERS IN ECONOMICS No 357 Farmers' · PDF fileFarmers' Preferences for Crop Variety...
22
1 WORKING PAPERS IN ECONOMICS No 357 Farmers' Preferences for Crop Variety Traits: Lessons for On-Farm Conservation and Technology Adoption Sinafikeh Asrat, Mahmud Yesuf, Fredrik Carlsson, Edilegnaw Wale April 2009 ISSN 1403-2473 (print) ISSN 1403-2465 (online) SCHOOL OF BUSINESS, ECONOMICS AND LAW, UNIVERSITY OF GOTHENBURG Department of Economics Visiting adress Vasagatan 1, Postal adress P.O.Box 640, SE 405 30 Göteborg, Sweden Phone + 46 (0)31 786 0000
Transcript of WORKING PAPERS IN ECONOMICS No 357 Farmers' · PDF fileFarmers' Preferences for Crop Variety...
1
WORKING PAPERS IN ECONOMICS
No 357
Farmers' Preferences for Crop Variety Traits: Lessons for On-Farm
Conservation and Technology Adoption
Sinafikeh Asrat,
Mahmud Yesuf,
Fredrik Carlsson,
Edilegnaw Wale
April 2009
ISSN 1403-2473 (print)
ISSN 1403-2465 (online)
SCHOOL OF BUSINESS, ECONOMICS AND LAW, UNIVERSITY OF GOTHENBURG Department of Economics
Visiting adress Vasagatan 1, Postal adress P.O.Box 640, SE 405 30 Göteborg, Sweden Phone + 46 (0)31 786 0000
2
Farmers' Preferences for Crop Variety Traits: Lessons for On-Farm Conservation and Technology Adoption
Sinafikeh Asrata, Mahmud Yesufb, Fredrik Carlssonc, Edilegnaw Waled
Abstract Although in-situ conservation is increasingly considered an efficient way of conserving plant genetic resources, little is known about the incentives and constraints that govern conservation decisions among small farm holders in developing countries. Using a choice experiment approach, we investigate Ethiopian farmers’ crop variety preferences, estimate the mean willingness to pay for each crop variety attribute, and identify household specific and institutional factors that govern the preferences. We find that environmental adaptability and yield stability are important attributes for farmers’ choice of crop varieties. Farmers are willing to forgo some income or output in order to obtain a more stable and environmentally adaptable crop variety. Among other things, household resource endowments (particularly land holdings and livestock assets), years of farming experience, and contact with extension services are the major factors causing household heterogeneity of crop variety preferences. Based on our experimental results, we derive important policy implications for on-farm conservation, breeding priority setting, and improved variety adoption in Ethiopia.
Key words: biodiversity, choice experiment, crop variety, random parameter logit. JEL classifications: Q18, Q51, Q57.
Acknowledgments: We acknowledge financial support from the Environment for Development initiative at the University of Gothenburg and Sida (Swedish International Development and Cooperation Agency), and financial support to administer the survey from the Genetic Resources Policy Initiative (GRPI) - Ethiopia project. a International Food Policy Research Institute (IFPRI), Addis Ababa, Ethiopia. email: [email protected]. b Environment for Development Centers in Ethiopia and Kenya, e-mail: [email protected] c Department of Economics, University of Gothenburg, Box 640, SE-40530 Göteborg, Sweden. Tel: + 46 31 7864174, e-mail: [email protected] d Bioversity International, Nairobi, Kenya, e-mail: [email protected].
3
1. Introduction
Farmers, plant breeders, gene bank managers, and crop scientists draw on diverse crop genetic
resources to innovate, support, and benefit society at large (Smale, 2006). Biodiversity is an
important component of ecological systems (e.g., Heal, 2000; Tilman and Downing, 1994;
Tilman et al., 1996), and loss of it can have adverse effects on the functioning of these systems,
including impairment of their capability to produce (e.g., Loreau and Hector, 2001; Naeem et al.,
1994). Crop genetic resources are natural assets that are renewable but also vulnerable to losses
due to natural or man-made interventions (including disruptions caused by droughts, floods, or
wars) and to the gradual process of social and economic change. Loss of diversity threatens the
livelihoods of millions of smallholders with local seeds as their major source of planting material,
since it weakens the possibility to combine complementary planting materials that are adaptable
to moisture, temperature, and soil type variability. It also reduces the available pool of genetic
materials for breeding to enhance productivity and ensure environmental stability. A number of
economic studies have also noted the role of crop genetic diversities as a means of boosting
agricultural productivity (Tilman and Downing, 1994; Tilman et al., 1996; Di Falco and Chavas,
2006; Smale et al., 1998).
The main challenge faced by policy makers in developing countries is how to best
conserve crop genetic diversity while fulfilling the growing demand for food production and
ecological services. In the literature, maintaining diverse plant varieties on farmers’ fields, in-situ
conservation, is increasingly considered an effective means of conserving plant genetic resources
(Benin et al., 2003). However, Benin et al. (2003) observed that on-farm conservation of crop
diversity poses obvious policy challenges in terms of the design of appropriate incentive
mechanisms and possible trade-offs between conservation and productivity. Smale et al. (2003)
noted one fundamental problem that affects the design of policies meant to encourage on-farm

4
conservation: Crop genetic diversity is an impure public good, meaning that it has both private
and public economic attributes. This leads to sub-optimal in-situ conservation of crop genetic
diversity.
Even if in-situ conservation could be an effective means of conserving crop genetic
resources, the degree of success is highly dependent on individual farmers’ decisions. Thus, it is
important to understand the farm-level incentives and constraints for in-situ conservation. This
study contributes to the literature by providing insights on farmers’ crop variety attribute
preferences using a choice experiment approach in a typical developing country setting: Ethiopia.
It also identifies the household contextual factors that govern these decisions. There are several
reasons for using a survey-based approach instead of relying on actual behavior. The most
important is that due to high transaction costs and limited information, there is no well-
functioning market for varieties (seeds) in Ethiopia. Consequently, farmers often rely on past
harvests or borrowing from neighbors. However, even if a market for crop variety did exist, it
would be difficult to identify the effects of each characteristic of a crop variety separately from
the market data since there might be correlations between characteristics.
The rest of the paper is organized as follows. Section 2 gives a background to the current
state of crop biodiversity and crop production in Ethiopia, with special reference to the two major
cereals in the country, teff and sorghum. Section 3 describes the details of the choice experiment
design and administration of the survey. Section 4 presents the econometric approach, and
Section 5 discusses the empirical results. Finally, Section 6 concludes the paper.
2. Crop biodiversity and agricultural production in Ethiopia
Like in many other developing countries, agriculture is the mainstay of the Ethiopian economy,
accounting for 85% of all employment, 40% of GDP, and 90% of export earnings. However, the

5
real agricultural GDP and per capita cereal production have been declining over the last 40 years
with a cereal yield that has been stagnant at only 1.2 metric tons per hectare (World Bank, 2005).
Despite huge investments and extension programs to promote improved seeds, the use of
improved seeds is very low – only 3-5 % of Ethiopia’s cultivated agricultural area is covered with
improved seeds – leaving a great proportion of the farm households to depend on traditional
varieties (World Bank, 2005). The low rate of adoption of improved varieties is often attributed
to a number of socio- economic, natural, and institutional factors (Bezabih, 2003; Degnet et al.,
2003; Legesse, 2003; Chilot et al., 1996; Mulugeta and Crawford, 1995; Kidane and Abler, 1994;
Yohannes et al., 1990).
Given its agro-ecological diversity and high altitudes, Ethiopia is both the center of origin
and a center of diversity for many crops, including sorghum, teff (Eragrostis abyssinica), coffee
(Arabica), and ensete (Ensete ventricosum). Sorghum and teff are the two major cereals grown in
the country, with teff being the most dominant, occupying 22% of all cultivable land. As a source
of staple food for many parts of the country, teff is primarily grown to prepare injera (Ethiopian
bread), porridge, and some native alcoholic drinks. The straw is mainly used for animal feed.
Sorghum, the major crop next to teff and grown all over the country, contributes about 15-20% of
Ethiopia’s total cereal production (Edilegnaw, 2004, 2008). Sorghum is used for many purposes,
e.g., food, animal feed, fuel, house construction, and fences, and consists of over 20 different
species of which some come from East African and some from the Western, Central and
Southern regions. Ethiopia holds ex situ 4% of the world’s sorghum genetic stock (FAO, 1998
and Hawkes et al., 2000). The crop exists in tremendous variety throughout the areas of sorghum
production in Ethiopia (Gebrekidan, 1979; de Wet and Harlan, 1971).
The National Biodiversity Strategy and Action Plan (NBSAP) report of Ethiopia
recognizes that agricultural intensification is potentially the major cause of loss of agricultural

6
biodiversity in the world and in particular in Ethiopia (FDRE, 2005). The report argues that
replacing traditional crop varieties with high-yielding varieties that are dependent on high levels
of agricultural inputs can result in genetic erosion of resilient native varieties. It is, thus, both a
challenge and an opportunity for Ethiopia to design conservation policies that enable its
agriculture-based economy to make the best use of its crop diversity (Edilegnaw, 2004). As said
earlier, a loss of diversity implies a big threat to the livelihoods of millions of smallholders with
local seeds as their major source of planting material, since it weakens the possibility to combine
complementary planting materials that are adaptable to moisture, temperature, and soil type
variability. It also reduces the pool of genetic material available for breeding to enhance
productivity and ensure environmental stability. Thus, understanding the preferences and driving
forces behind crop variety choices is important in order to design effective on-farm crop genetics
conservation policies for small farmers who rely on local varieties, as in Ethiopia.
3. Survey design and study sites
In this study, we employed a choice experiment approach to evaluate farmers’ preferences for the
various attributes of crop varieties. As discussed in the introduction, we cannot rely on actual
behavior since there is currently no well-functioning market in Ethiopia. In a choice experiment,
individuals are given a hypothetical setting, whereafter they are asked to, usually repeatedly,
choose their preferred alternative from several alternatives in a choice set. Each alternative is
described by a number of attributes that take on different levels.1 In our case, the farm households
were confronted with choice sets with three different alternative crop varieties. The most
important crop variety attributes and their levels were identified in consultation with experts
(crop breeders and researchers with hands-on experience of and practical knowledge about the
1 For detailed reviews on the CE method, see for example Alpizar et al. (2003) and Louviere et al. (2000).

7
relevant variety attributes), by reviewing previous studies and historical data, and by identifying
the most important seed selection criteria put forward by a focus group of surveyed households
(explained further at the end of this section). The crop variety attributes and levels used in the
choice experiment include yield levels, yield stability, environmental adaptability, and selling
unit price for each crop variety. The experiment was conducted with the two major cereals grown
in Ethiopia: sorghum and teff. A full description of the attributes and the levels of each attribute
are presented in Table 1.
Table 1. Attributes and attribute levels used in the choice experiment
Sorghum
Attributes Definition Attribute Levels
Producer’s price The amount of money the farmer earns by selling 100 kg of harvested sorghum of a particular sorghum variety.
(i) 110 birr2, (ii) 150 birr, (iii) 200 birr
Productivity Average production harvested per hectare from planting a particular sorghum variety.
(i) 1400 kg, (ii) 1900 kg (ii) 2500 kg
Environmental adaptability
Whether the variety is resistant/ tolerant to drought and frost.
(i) The variety is adaptable (resistant), (ii) the variety is not adaptable (nonresistant)
Yield stability Whether the variety gives stable yield year-after-year, despite occurrences of crop disease and pest problems.
(i) The variety gives stable yield year-after-year, (ii) the variety gives variable yield year-after-year.
Teff Producer’s price The amount of money the farmer earns by
selling 100 kg of harvested teff of a particular teff variety.
(i) 210 birr, (ii) 270 birr, (iii) 330 birr
Productivity Average production harvested per hectare from planting a particular teff variety.
(i) 800 kg, (i) 1500 kg (ii) 2000 kg
Environmental adaptability
Whether the variety is resistant/ tolerant to drought and frost.
(i) The variety is adaptable (resistant), (ii) the variety is not adaptable (nonresistant)
Yield stability Whether the variety gives stable yield year-after-year, despite occurrences of crop disease and pest problems.
(i) The variety gives stable yield year-after-year, (ii) the variety gives variable yield year-after-year.
At a first glance, there seems to be a strong correlation between market price and productivity
attributes, making the tradeoffs between these two attributes difficult. This is true where output
markets are well functioning and production and consumption decisions are separable. However,
2 Birr is Ethiopia’s currency. 1 USD equals approximately 9.7 Birr (October, 2008).
8
this is not the case in our sites and many of the developing country settings where production
decisions are mainly subsistence oriented and production and consumption decisions are non-
separable. Under these circumstances, productivity attributes become important considerations
for all farm households (net buyers, net sellers, and the self-reliant). On the other hand, the price
attribute is relevant only for farm households with better access to output markets and who are
net sellers. Thus, as we will later confirm in the empirical section, we expect that price and
productivity attributes play a distinct role in governing farm households’ preferences for different
crop varieties and in designing appropriate incentive-based policies in our sites.
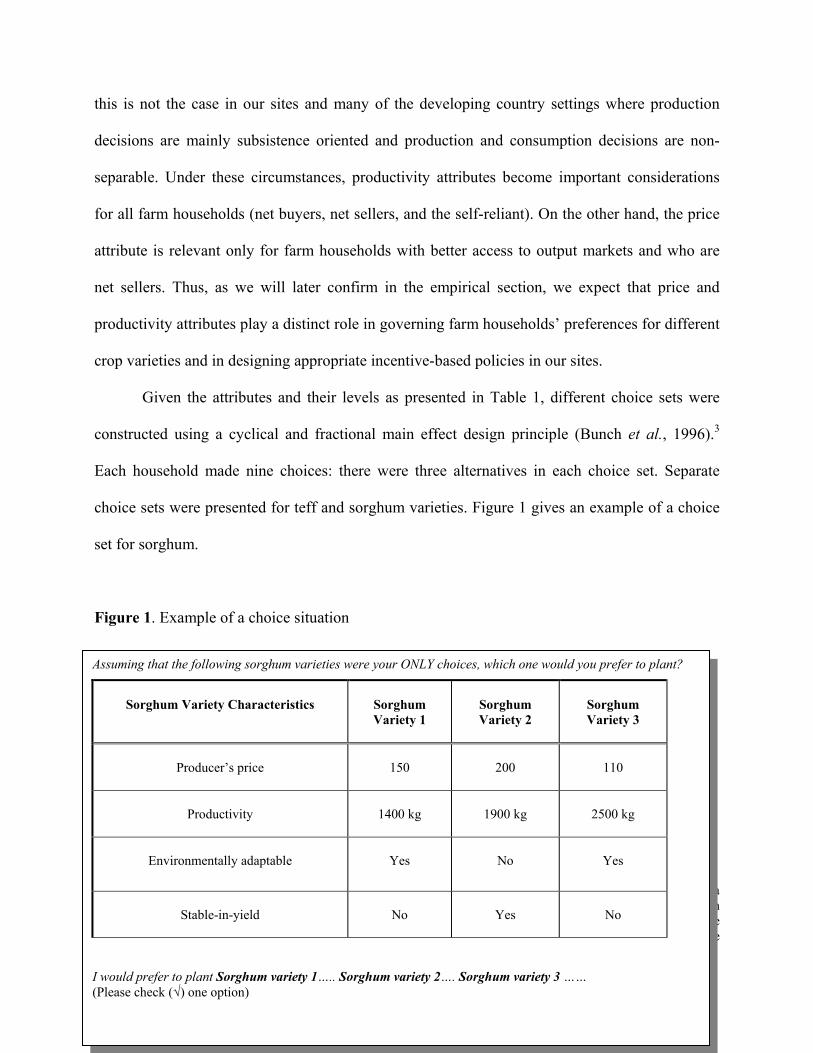
Given the attributes and their levels as presented in Table 1, different choice sets were
constructed using a cyclical and fractional main effect design principle (Bunch et al., 1996).3
Each household made nine choices: there were three alternatives in each choice set. Separate
choice sets were presented for teff and sorghum varieties. Figure 1 gives an example of a choice
set for sorghum.
Figure 1. Example of a choice situation
3 A cyclical design is a straightforward extension of the orthogonal approach. First, each of the alternatives from a fractional factorial design is allocated to different choice sets. Attributes of the additional alternatives are then constructed by cyclically adding alternatives into the choice set based on the attribute levels. That is, the attribute level in the new alternative is the next higher attribute level to the one applied in the previous alternative. If the highest level is attained, the attribute level is set to its lowest level.
Assuming that the following sorghum varieties were your ONLY choices, which one would you prefer to plant?
Sorghum Variety Characteristics
Sorghum
Variety 1
Sorghum
Variety 2
Sorghum
Variety 3
Producer’s price
150
200
110
Productivity
1400 kg
1900 kg
2500 kg
Environmentally adaptable
Yes
No
Yes
Stable-in-yield
No
Yes
No
I would prefer to plant Sorghum variety 1….. Sorghum variety 2…. Sorghum variety 3 ……
(Please check (√) one option)

9
The experiment was carried out in two Peasant Associations (PAs) in the northeastern part of the
country (the North Wollo Zone of the Amhara Regional State) in June and July of 2007.
Stratified multi-stage sampling was adopted to identify zones, districts, PAs, villages, and farm
households. All sampled households are located in two PAs of the Guba Lafto district in the
North Wollo Zone of the Amhara Regional State in Ethiopia. The PAs villages are located in
temperate agro-ecology and have an average annual rainfall of 630 - 970 mm per year and a mean
temperature of 15 - 20 0C. In addition, they have experienced recurrent drought over the past
decades. Teff, sorghum, and maize are among the most important food crops in both study sites.
To check the relevance of the choice experiment questions about local conditions,
farmers’ expectations, and level of understanding, the questionnaires were pre-tested on a focus
group of 16 farmers (8 from each PA). The pre-test results were discussed with the enumerators
and necessary changes were made according to farmer responses. Overall, a total of 131 farmers
were selected, out of which 66 were randomly selected and presented with choice sets for the
sorghum variety and the remaining 65 were assigned the teff variety. Enumerators used the local
language and choice cards to present the various choice sets. Overall, 1,179 choices were elicited
from the surveyed households. To complement the experimental data, a separate survey was
employed to collect data on socio-economic characteristics; see Table 2 for descriptive statistics.

10
Table 2. Descriptive statistics of sampled farm households.
Variable Description Mean Std. Dev.
Household characteristics Male = 1 if the household head is male 0.90 0.299 Household size Number of household members who share the same food
stock 5.38 2.04
Experience Farming experience of the household head in years 25.38 11.64 Off-farm work = 1 if at least one member works off-farm 0.32 0.468 No. dependents Number of dependents with no labor or money
contribution in the household 1.15 1.45
Agric. output surplus =1 if the household is a net-seller of agricultural outputs 0.27 0.444 Drought frequency The number of times the household faced drought
problems during the last ten years 2.45 1.709
Farm and livestock characteristics Land shortage major problem
= 1 if the household head considers land shortage to be the primary problem
0.64 0.479
Total land size (ha) Total land size operated by the household in hectares 0.75 0.52 Livestock value Total value of livestock (including poultry and bee hives)
currently owned by the household, in Birr 5016.5 4745.5
Access to infrastructure and extension services Average distance to household services4
Average walking distance (in minutes) to basic infrastructure and services.
48.24 27.07
Participate in extension programs
= 1 if the household has been participating in the agricultural extension program
0.70 0.457
Experience in extension programs
Years of participation in agricultural extension program 4.14 5.226
4. The Econometrics Approach
Since respondent preferences are observed in terms of their choices, we employ the random
utility framework to analyze the responses to the different choice sets (McFadden, 1974).
Assuming a linear indirect utility function, the utility for alternative i in choice situation t for
farmer h is given by:
ithitith priceAV ελ ++= itβ' , (1)
where itA is the attribute vector except prices, β is the corresponding parameter vector including
an alternative specific constant, itprice is the price attribute for alternative i, λ is the marginal
4 Services include electricity, piped water, telephone, primary school, secondary school, all weather roads, and irrigation. Respondents were asked to specify the walking distance (in minutes) to each type of service, and an average walking distance to services was then calculated for each respondent.

11
utility of money, and ithε is an error term. The probability that individual h will choose
alternative i can be expressed as:
{ }ijpriceapriceAPP jithjtjtithititith ≠∀++>++= ;'' ελβελβ . (2)
From this specification, the mean marginal willingness to pay (MWTP) for a certain attribute is
given by the ratio of the attribute coefficient to the marginal utility of income (Hanemann, 1984).
In the analysis, we employ a random parameter logit model where the non-monetary attributes
are random normally distributed. We can then write utility as:
ithithhithitithithitith AApriceApriceV εββλεβλ +++=++= '~
'' . (3)
Thus, each individual’s coefficient vector β is the sum of the population mean β and individual
deviation hβ~
. The stochastic part of utility, ithithh A εβ +~
, is correlated over alternatives, which
means that the model does not exhibit the IIA (independent of irrelevant alternatives) property.
Let tastes, β , vary in the population with a distribution with density )|( θβf , where θ is a
vector of the true parameters of the taste distribution. If the s'ε are IID type I extreme value, we
have a random parameter logit (RPL) model. We assume that the randomly distributed
parameters are constant across the choice situations for each individual. This reflects an
underlying assumption of a stable preference structure for all individuals over the choice
experiment (Train, 1998). Since the choice experiment is relatively small and simple, this seems
to be a realistic assumption.
First, we estimate one model for each crop with only the attributes of the experiment.
Then we estimate two models where a number of socio-economic characteristics interact with the

12
attributes. The models are estimated with simulated maximum likelihood using Halton draws
with 500 replications.5 Although the experiment was generic, we include two alternative specific
constants, since we want to test whether any factors other than the attributes themselves affect the
choices.
5. Results and Discussions
The results of the RPL models (without and with socio-economic characteristics) are presented in
Tables 3 and 5, respectively. We begin by commenting on the results of the models without
socio-economic characteristics.
Table 3. Results of random parameter logit estimates for choice of crop variety; standard errors in parentheses. Sorghum Teff
Variable Coefficient Standard error Coefficient Standard error Mean parameters Alternative 1 0.306*** 0.174 0.549*** 0.165 Alternative 2 1.418*** 0.304 1.25*** 0.304 Producer’s price 1.973*** 0.241 1.065*** 0.169 Productivity 0.308*** 0.034 0.293*** 0.038 Environmental adaptability 5.068*** 0.932 4.489** 0.604 Yield stability 4.429*** 0.908 2.610** 1.12 Standard deviation parameters Productivity 0.126*** 0.034 0.189** 0.038 Environmental adaptability 3.226*** 1.1621 2.239** 0.345 Yield stability 2.987*** 0.670 2.438** 0.472 Number of respondents 66 65 Number of choices 594 585
2ρ 0.574 0.545
***, **, and * denote significance at 1%, 5%, and 10%, respectively.
All the attribute parameters are highly significant and have the expected signs. Thus, farmers care
not only about the productivity of the crop varieties, but also about environmental adaptability
and yield stability. The estimated standard deviations are also significant and sizeable, indicating
5 See Train (2003) for details on simulated maximum likelihood and Halton draws.
13
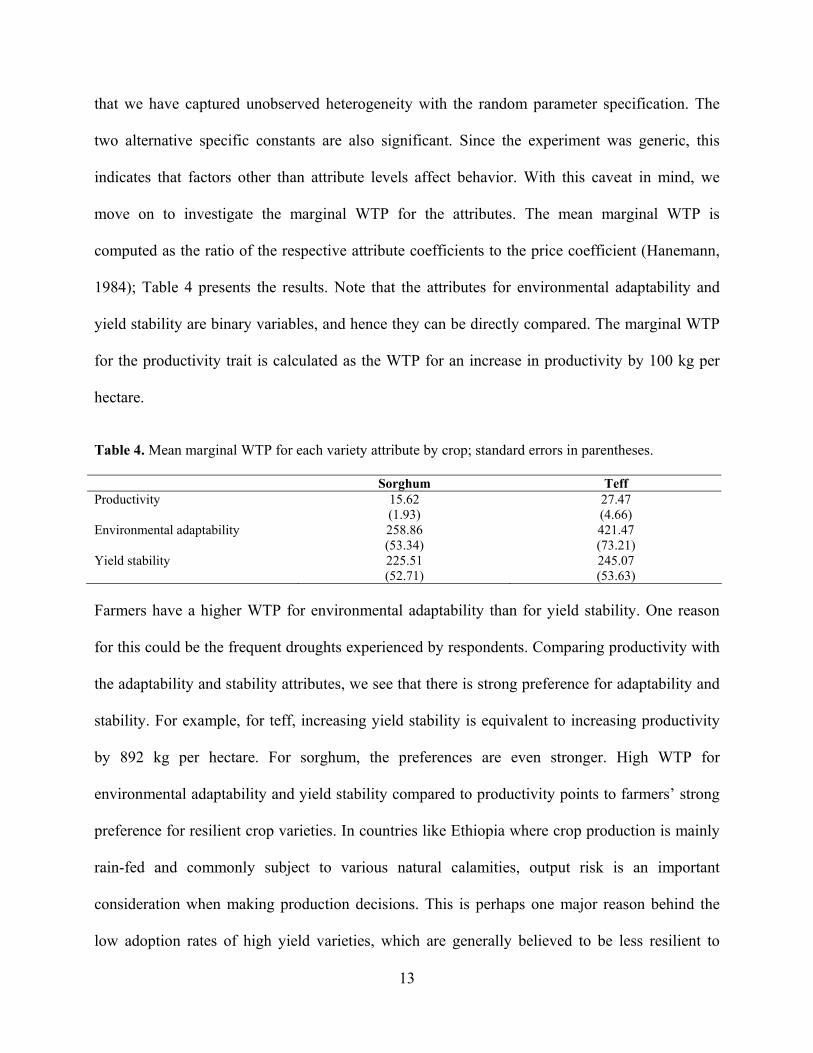
that we have captured unobserved heterogeneity with the random parameter specification. The
two alternative specific constants are also significant. Since the experiment was generic, this
indicates that factors other than attribute levels affect behavior. With this caveat in mind, we
move on to investigate the marginal WTP for the attributes. The mean marginal WTP is
computed as the ratio of the respective attribute coefficients to the price coefficient (Hanemann,
1984); Table 4 presents the results. Note that the attributes for environmental adaptability and
yield stability are binary variables, and hence they can be directly compared. The marginal WTP
for the productivity trait is calculated as the WTP for an increase in productivity by 100 kg per
hectare.
Table 4. Mean marginal WTP for each variety attribute by crop; standard errors in parentheses. Sorghum Teff
Productivity 15.62 (1.93)
27.47 (4.66)
Environmental adaptability 258.86 (53.34)
421.47 (73.21)
Yield stability 225.51 (52.71)
245.07 (53.63)
Farmers have a higher WTP for environmental adaptability than for yield stability. One reason
for this could be the frequent droughts experienced by respondents. Comparing productivity with
the adaptability and stability attributes, we see that there is strong preference for adaptability and
stability. For example, for teff, increasing yield stability is equivalent to increasing productivity
by 892 kg per hectare. For sorghum, the preferences are even stronger. High WTP for
environmental adaptability and yield stability compared to productivity points to farmers’ strong
preference for resilient crop varieties. In countries like Ethiopia where crop production is mainly
rain-fed and commonly subject to various natural calamities, output risk is an important
consideration when making production decisions. This is perhaps one major reason behind the
low adoption rates of high yield varieties, which are generally believed to be less resilient to

14
environmental hardships. This result has important implication for targeting in-situ conservation
of crop genetic resources. It demonstrates how important the environmental adaptability and yield
stability attributes are in motivating farmers to participate in any in-situ conservation effort.
It is likely that there are large heterogeneities of preferences across farm households. Any in-situ
conservation effort should take these heterogeneities into consideration. To account for observed
heterogeneity of preferences across farm households, we also estimate models where a set of
socio-economic characteristics are interacted with the attributes. Due to possible multicollinearity
problems, it is not possible to include all interactions between the explanatory variables collected
in our survey and the four crop variety attributes. Table 5 presents the results of the RPL model
interacted with socio-economic variables.

15
Table 5. Results of random parameter logit model with socio-economic characteristics for choice of crop variety; standard errors in parentheses. Sorghum Teff
Coefficient Standard error Coefficient Standard error Mean parameters Constant 1.700*** 0.333 1.379*** 0.344 Producer’s price 0.020*** 0.003 0.012*** 0.002 Productivity -0.014 0.080 0.160 0.207 Environmental adaptability 1.691 2.457 -10.252* 5.411 Yield stability 4.113 2.562 7.787 6.124 Productivity × Male 0.132 0.086 -0.156 0.189 Productivity × Experience 0.005 0.003 0.003 0.003 Productivity × Off-farm work 0.120* 0.073 -0.029 0.079 Productivity × Total land size -0.087 0.072 0.276*** 0.095 Productivity × Livestock value 0.002 0.009 -0.004 0.006 Productivity × Drought frequency -0.009 0.017 0.088*** 0.030 Productivity × Expr Agric Extension 0.012 0.008 0.010 0.006 Productivity × Household size 0.021 0.017 -0.026 0.019 Productivity × Agric output Surplus -0.014 0.065 0.039 0.079
Env. adaptability × Male 1.702 1.644 6.119 4.276
Env. adaptability × Experience 0.125* 0.067 0.096* 0.052
Env. adaptability × Off-farm work -0.779 1.203 -0.895 2.451
Env. adaptability × Total land size -3.323** 1.331 1.877 2.902
Env. adaptability × Livestock value 0.033 0.162 -0.553*** 0.178
Env. adaptability × Drought frequency -0.089 0.303 0.722 0.735
Env. adaptability × Exper Agric Extension -0.055 0.118 0.461 0.344
Env. adaptability × Household size 0.418 0.317 1.440** 0.657
Env. adaptability × Agric output surplus -0.753 1.226 0.933 2.100
Yield stability × Male 0.008 1.733 -3.095 5.034
Yield stability × Experience -0.043 0.067 -0.031 0.057
Yield stability × Off-farm work 0.143 1.259 1.304 2.511
Yield stability × Total land size -0.601 1.448 -1.136 2.846
Yield stability × Livestock value 0.213 0.180 -0.396** 0.163
Yield stability × Drought frequency -0.103 0.321 -1.059 0.739
Yield stability × Exper Agric Extension -0.327** 0.144 0.448 0.348
Yield stability × Household size 0.470 0.343 0.938 0.673
Yield stability × Agric output surplus 0.011 1.298 0.474 2.200
Standard deviation parameters Productivity 0.117*** 0.0354 0.190*** 0.038 Environmental adaptability 1.932*** 0.541 2.950*** 0.980 Yield stability 2.429*** 0.551 3.826*** 1.264 Number of respondents 66 65 Number of choices 513 531
2ρ 0.613 0.600
Notes: ***, **, and * denote significance at 1%, 5%, and 10%, respectively.
.
16
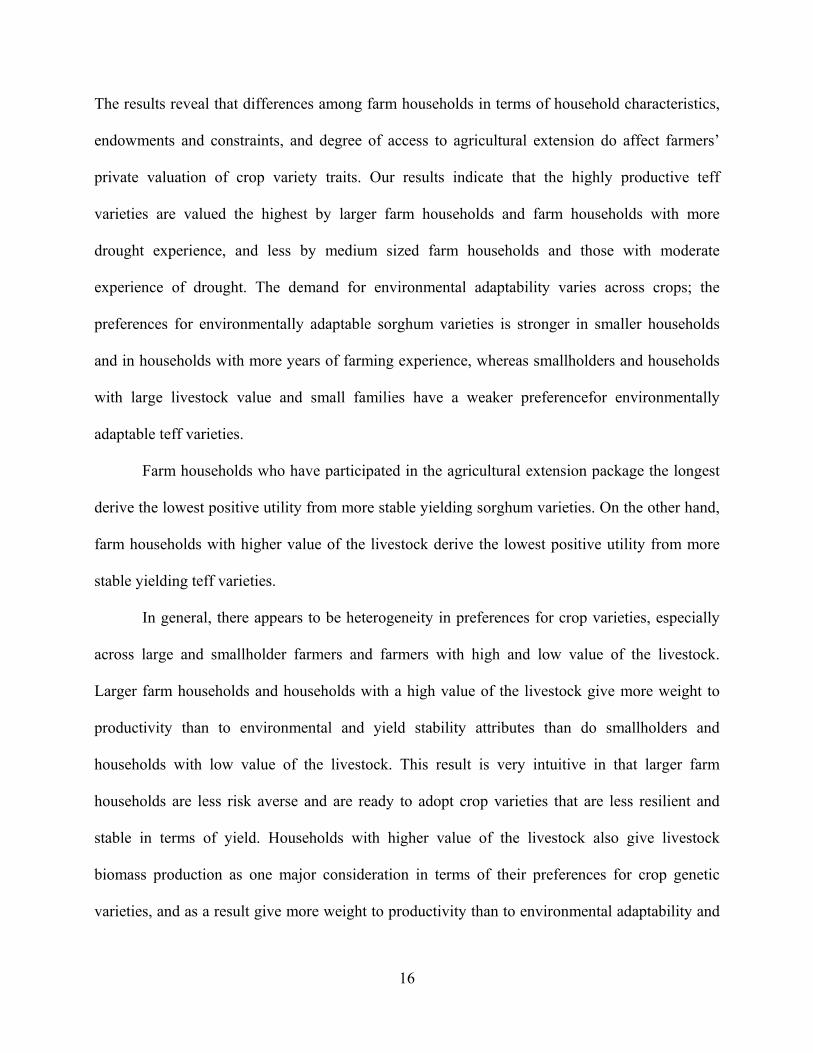
The results reveal that differences among farm households in terms of household characteristics,
endowments and constraints, and degree of access to agricultural extension do affect farmers’
private valuation of crop variety traits. Our results indicate that the highly productive teff
varieties are valued the highest by larger farm households and farm households with more
drought experience, and less by medium sized farm households and those with moderate
experience of drought. The demand for environmental adaptability varies across crops; the
preferences for environmentally adaptable sorghum varieties is stronger in smaller households
and in households with more years of farming experience, whereas smallholders and households
with large livestock value and small families have a weaker preferencefor environmentally
adaptable teff varieties.
Farm households who have participated in the agricultural extension package the longest
derive the lowest positive utility from more stable yielding sorghum varieties. On the other hand,
farm households with higher value of the livestock derive the lowest positive utility from more
stable yielding teff varieties.
In general, there appears to be heterogeneity in preferences for crop varieties, especially
across large and smallholder farmers and farmers with high and low value of the livestock.
Larger farm households and households with a high value of the livestock give more weight to
productivity than to environmental and yield stability attributes than do smallholders and
households with low value of the livestock. This result is very intuitive in that larger farm
households are less risk averse and are ready to adopt crop varieties that are less resilient and
stable in terms of yield. Households with higher value of the livestock also give livestock
biomass production as one major consideration in terms of their preferences for crop genetic
varieties, and as a result give more weight to productivity than to environmental adaptability and

17
yield stability. Their livestock assets also give the leverage to make riskier production decisions
in terms of choice of crop varieties.
6. Conclusions and Implications
Given the growing concern for food insecurity and adverse effects of long-term climate changes,
crop biodiversity is an important asset both for increasing agricultural productivity and
minimizing the downside risk of adverse climate change. However, due to lack of appropriate in-
situ conservation strategies, crop biodiversity is subject to irreversible losses. Design of
appropriate in-situ conservation strategies requires an understanding of farmer incentives and
constraints when they make their choice of crop varieties. This study employed a choice
experiment approach to (1) investigate farmer preferences for crop variety attributes and to (2)
identify the most important socio-economic driving forces behind these preferences. Farmers
reveal strong preferences for environmental adaptability (resistance to drought and frost
occurrences). Yield stability (resulting from resistance to disease and pest problems) is also more
important than increased productivity. These findings may explain the low adoption rates of high
yield variety seeds in Ethiopia over the last several decades. The fact that farmers attach sizeable
weights to both environmental adaptability and marketability traits of sorghum and teff points to
the need for supplying a crop genetic variety with additional attributes in terms of resilience to
harsh environmental conditions rather than a crop genetic variety that targets enhanced
agricultural productivity but that is risky in terms of other environmental attributes.
We also find that there are differences among farm households in terms of household
characteristics, resource endowments, and level of access to agricultural extension that affect
farmers’ private valuations of crop variety traits. There are significant differences between
18
smaller and larger farm holders, and between households with low and high value of the
livestock.
These results have important implications for on-farm conservation, contextual variety
development, breeding priority setting, and targeted diffusion of improved varieties in Ethiopia.
First, the farm households who now attach the highest values to attributes already embedded in
traditional varieties managed by peasants on-farm would maintain the varieties de facto. To
minimize conservation costs and enhance compliance, these farmers have to be targeted in future
on-farm conservation activities. For instance, de facto conservation of environmentally adaptable
sorghum varieties by more experienced farmers with small land areas implies that there is no
need to design external incentives for these varieties in order to encourage their maintainers.
Second, understanding farmers’ variety trait preferences also informs decision makers about the
variety attributes that have to be considered in on-farm conservation. For instance, more
experienced farmers and small farm holders with smaller livestock assets are affected the most
when they have to forego teff and/or sorghum varieties with better yield stability and
environmental adaptability. They are, therefore, less likely to cooperate with on-farm
conservation activities that deny them varieties with these attributes unless they get equivalent
compensation. The third important policy implication relates to the area of variety adoption. For
agricultural technologies to be successful, their attributes should address farmer concerns.
Clearly, understanding farmers’ variety trait preferences is an input to this end. For instance,
according to the results, to target the variety demands of income shock-vulnerable and segmented
farmers, the variety attributes environmental adaptability and yield stability should be prioritized,
while productivity traits seem less important. The fourth policy implication is in the area of
breeding priority setting. Given that farmers’ variety attribute preferences determine both the
propensity to use improved varieties and the chance of using them successfully, breeding should

19
satisfy the demands of different farm household types classified according to resource
endowments, preferences, and constraints. To this end, analyzing farmers’ variety attribute
preferences will help target farmer demands in the making of a technology. For instance, we
found that farmers attach the highest private value to the environmental adaptability trait
followed by the yield stability attribute of both sorghum and teff. If it cannot address all desired
traits for capacity reasons, breeding should, therefore, primarily target these attributes in both
sorghum and teff varieties. Moreover, as breeding attempts to improve the cross-cutting attribute
(environmental adaptability) in the studied crops, we found that farmers in Wollo would be better
off if this improvement comes first in teff varieties and then in sorghum varieties.

20
References
Alpizar, F., Carlsson, F., Martinsson, P. 2003. Using Choice Experiments for Non-Market
Valuation. Economic Issues 8 (1): 83-109.
Benin,S. M. Smale, B. Gebremedhin, J. Pender, and S. Ehuil. 2003. Determinants of Cereal Crop
diversity on Farms in the Ethiopian Highlands. Enivironment and production technology
Division Discussion Paper 105. International Food Policy Research Insititute (IFPRI)
Washnigton DC.
Bezabih, E. 2003. Determinants of Multiple Technology Adoption: Defining Adopters and
Empirical Analysis. Ethiopian Journal of Agricultural Economics, Vol. 5, Nos. 1-2, pp. 1–
22.
Bunch, D., Louviere J.J., and Andersson, D. 1996. A Comparison of Experimental Design
Strategies for Choice-Based Conjoint Analysis with Generic-Attribute Multinomial Logit
Models. Working paper, Graduate School of Management, Davis, California, USA:
University of California, Davis.
Chilot, Y., B.I. Shapiro and D. Mulat .1996Factors Influencing Adoption Of New Wheat
Technologies in Wolmera and Addis Alem Areas of Ethiopia. Ethiopian Journal of
Agricultural Economics, Vol. 1, pp. 63–84.
Degnet, A., K. Belay and W. Aregay .2003. ‘Adoption of High-Yielding Maize Varieties in
Jimma Zone: Evidence from Farm Level Data’, Ethiopian Journal of Agricultural
Economics, Vol. 5, Nos. 1–2, pp. 41–62.
Di Falco, S. and Jean-Paul Chavas. 2006. Crop Genetic Diversity, Farm Productivity and the
Management of Environmental Risk in Rainfed Agriculture. European Review of
Agricultural Economics 33: 289-314.
Edilegnaw, W. 2004. The Economics of On-farm Conservation of Crop Diversity in Ethiopia:
Incentives Attribute Preferences and Opportunity Costs of Maintaining Local Varieties of
Crops. Ph.D. Dissertation, Bonn, Germany: University of Bonn.
Edilegnaw, W. 2008. Computing Opportunity Costs of Growing Local Varieties for On-farm
Conservation: The Case of Sorghum in Ethiopia. Ecological Economics, vol. 64 (3): 603-
610.
FAO. 1998. The state of the world’s genetic resources for food and agriculture. Rome, Italy:
FAO.

21
FDRE. 2005. National Biodiversity Strategy and Action Plan. Addis Ababa, Ethiopia: Institute of
Biodiversity Conservation.
Gebrekidan, B. 1979. Sorghum Genetic Resources in Africa. Ethiopian Journal of Agricultural
Sciences 1 (2): 108-125.
Hanneman, M. 1984. The discrete/continuous model of consumer demand. Econometrica 52:
541–561.
Hawkes, J. G., N. Maxted and B. V. Ford-Lloyd. 2000. The Ex Situ Conservation of Plant
Genetic Resources. New York, USA: Kluwer Academic Publishers.
Heal, G. (2000). Nature and the Marketplace: Capturing the Value of Ecosystem Services. New
York: Island Press.
Kidane, A. and D.G. Abler .1994. Production Technologies in Ethiopian Agriculture.
Agricultural Economics, Vol. 10, pp. 179–91.
Legesse, D. 2003. Empirical Analysis of Duration of Herbicide Adoption in Tef-based Farming
System of West Shewa Zone. Ethiopian Journal of Agricultural Economics, Vol. 5, Nos.
1–2, pp. 1–22.
Loreau, M. and A. Hector. 2001. Partitioning Selection and Complementarity in Biodiversity
Experiments. Nature 412: 72-76.
Louviere, J. J., D.A. Hensher, J.D. Swait and W.L. Adamowicz. 2000. Stated Choice Methods:
Analysis and Applications. Cambridge, UK: Cambridge University Press.
McFadden, D.L. 1974. The measurement of urban travel demand. Journal of Public Economics
3: 303-328.
Mulugeta, M. and E.W. Crawford .1995. Econometric Analysis of Wheat Production Technology
Adoption in the Southeastern Highlands of Ethiopia. American Journal of Agricultural
Economics, Vol. 75, No. 5, August.
Naeem, S., L.J. Thompson, S.P. Lawler, J.H. Lawton and R.M. Woodfin. 1994. Declining
Biodiversity Can Affect the Functioning of Ecosystems. Nature 368: 734-737.
Smale, M. 2006. Valuing Crop Biodiversity On-farm Genetic Resources and Economic Change.
Wallingford, UK: CAB International.
Smale, M., J. Hartell, P.W. Heisey and B. Senauer. 1998. The Contribution of Genetic Resources
and Diversity to Wheat Production in the Punjab of Pakistan. American Journal of
Agricultural Economics 80: 482-493.
22
Smale, M., E. Meng, E., J.P. Brennan and R. Hu. 2003. Determinants of Spatial Diversity in
Modern Wheat: Examples from Australia and China. Agricultural Economics 28: 13-26.
Tilman, D. and J.A. Downing. 1994. Biodiversity and Stability in Grasslands. Nature 367: 363–
365.
Tilman, D., D. Wedin and J. Knops. 1996. Productivity and Sustainability Influenced by
Biodiversity in Grassland Ecosystems. Nature 379: 718–720.
Train, K. (1998) Recreation demand models with taste differences over people. Land Economics
74: 230-239.
de Wet, J. M. J. and J. R. Harlan. 1971. The Origin and Domestication of Sorghum Bicolor.
Economic Botany 25: 128-135.
World Bank .2005. Ethiopia – Well-Being and Poverty in Ethiopia: The Role of Agriculture and
Agency Report No. 29468-ET. Washington, D.C.: World Bank.
Yohannes, K., K. Gunjal and G. Coffin .1990. Adoption of New Technologies in Ethiopian
Agriculture: The Case of Tegulet-Bulga District, Shewa Province. Agricultural Economics,
Vol. 4, pp. 27–43.