
Working Paper No. 689 December 20
43
Is it riskier to meet 100 people outdoors or 14 people indoors? Comparing public and expert perceptions of COVID-19 risk Shane Timmons a,b* , Cameron A. Belton a , Deirdre A. Robertson a,b , Martina Barjaková a , Ciarán Lavin a , Hannah Julienne a and Pete Lunn a,c *Corresponding Author: [email protected] ESRI working papers represent un-refereed work-in-progress by researchers who are solely responsible for the content and any views expressed therein. Any comments on these papers will be welcome and should be sent to the author(s) by email. Papers may be downloaded for personal use only. Working Paper No. 689 December 2020 a Economic and Social Research Institute, Dublin, Ireland b School of Psychology, Trinity College Dublin, Ireland c Department of Economics, Trinity College Dublin, Ireland Abstract: How do people perceive and integrate multiple contextual risk factors for COVID-19 infection? We elicited risk perceptions from a nationally representative sample of the public (N = 800) using three psychologically-distinct tasks. Responses were compared to a sample of medical experts who completed the same tasks. The public underestimated the risk associated with environmental factors (such as whether a gathering takes place indoors or outdoors) and the implications when multiple risk factors are present. Our results are consistent with a heuristic simply to ‘avoid people’ and with a coarse (e.g. ‘safe or unsafe’) classification of social settings. A further task, completed only by the general public sample, generated novel evidence that when the risk of infection competes against a risk in another domain (e.g. a different medical risk), people perceive a lower likelihood of contracting the virus. The results have implications for public health communications and psychological theory. Acknowledgments:We thank the Behavioural Change Subgroup of the National Public Health Emergency Team (NPHET) for support, and various of its members for useful guidance and comments. We are also grateful to Helen Russell and Kieran Mohr for helpful comments on an initial draft of this manuscript.
Transcript of Working Paper No. 689 December 20

Is it riskier to meet 100 people outdoors or 14 people indoors? Comparing public and expert perceptions of COVID-19 risk
Shane Timmonsa,b*, Cameron A. Beltona, Deirdre A. Robertsona,b, Martina Barjakováa, Ciarán Lavina,
Hannah Juliennea and Pete Lunna,c
*Corresponding Author: [email protected]
ESRI working papers represent un-refereed work-in-progress by researchers who are solely responsible for the content and any views expressed therein. Any comments on these papers will be welcome and should be sent to the author(s) by email. Papers may be downloaded for personal use only.
Working Paper No. 689
December 2020
a Economic and Social Research Institute, Dublin, Ireland b School of Psychology, Trinity College Dublin, Irelandc Department of Economics, Trinity College Dublin, Ireland
Abstract: How do people perceive and integrate multiple contextual risk factors for COVID-19 infection? We elicited risk perceptions from a nationally representative sample of the public (N = 800) using three psychologically-distinct tasks. Responses were compared to a sample of medical experts who completed the same tasks. The public underestimated the risk associated with environmental factors (such as whether a gathering takes place indoors or outdoors) and the implications when multiple risk factors are present. Our results are consistent with a heuristic simply to ‘avoid people’ and with a coarse (e.g. ‘safe or unsafe’) classification of social settings. A further task, completed only by the general public sample, generated novel evidence that when the risk of infection competes against a risk in another domain (e.g. a different medical risk), people perceive a lower likelihood of contracting the virus. The results have implications for public health communications and psychological theory.
Acknowledgments:We thank the Behavioural Change Subgroup of the National Public Health Emergency Team (NPHET) for support, and various of its members for useful guidance and comments. We are also grateful to Helen Russell and Kieran Mohr for helpful comments on an initial draft of this manuscript.

2
Since the coronavirus pandemic began, humankind’s main defence against COVID-19 has
been our behaviour. When deciding what behaviours we are happy to undertake, we rely on
our perception of risk (Brewer et al., 2007; Fischoff, Bostrom & Jacobs Quadrel, 1993;
Slovic, 1987). Thus, the spread of infection partly depends on how accurately we can
integrate multiple risk factors into everyday decisions.
Researchers have investigated how perceived risk of COVID-19 infection relates to
compliance with public health advice (e.g. Dryhurst et al., 2020; Lohiniva et al., 2020; Wise
et al., 2020). These studies focus on general perceptions of risk, i.e. the overall risk of
contracting the virus. However, risk of infection varies by context and, therefore, it matters
how well people differentiate between high- and low-risk situations. For instance, Sarah
might decide to attend a birthday dinner if it takes place outdoors on a restaurant terrace, but
not if it takes place in her friend’s dining room, even if more people would be at the
restaurant dinner. Stephen might share the same overall perceived likelihood of infection as
Sarah, but worry more about the number of people present than the location, and so decide
the opposite.
Multiple aspects of social settings affect transmission risk. As well as the number of people
and location, these include the duration of the encounter and mitigation behaviours (e.g.
maintaining social distance, wearing a mask; van Doremalen et al., 2020; Qian et al., 2020;
Setti et al., 2020). All these factors must be integrated to assess risk accurately. Systematic
underestimation of specific factors or failure to combine multiple factors appropriately
implies systematic misperception of infection risk, with consequences for spread of the
disease. Consequently, we set out to measure the accuracy of risk perceptions across social
contexts.

3
The contribution of the study is threefold. First, by measuring the accuracy of risk
perceptions and illuminating underlying heuristics, we provide empirical evidence to support
efforts to reduce transmission. Second, we devised a range of experimental tasks which
demonstrate how techniques of psychological science can be used to inform interventions
during the pandemic. Third, our findings are of interest beyond the response to COVID-19.
The pandemic offers a highly unusual opportunity to measure how well the public can absorb
complex risk information; all citizens are affected and attention paid to the relevant public
information is unprecedented in the modern media age.
The lack of veridical benchmarks for infection risk presents an obvious challenge. To address
this, we compared risk assessments generated by a representative sample of the public to
those of a sample of medical professionals with expertise in public health, microbiology and
virology. The expert sample included members of the Expert Advisory Group to Ireland’s
National Public Health Emergency Team (NPHET). Medical expert opinion is a useful proxy
for accurate evaluation, as experts tend not to rely on simplified heuristics when evaluating
risk in an expertise-relevant context (Fleming, Townsend, van Hilten, Spence & Ferguson,
2012). By contrast, the general public are likely to use heuristics when thinking about
COVID-19, given the novelty of the situation, complexity of risk factors, and inherent
uncertainty of infection (Lipshitz & Strauss, 1997; Tversky & Kahneman, 1974).
In addition to obtaining comparison benchmarks, a further challenge was to measure risk
perceptions via tasks that reflect real-world settings. We deployed three psychologically-
distinct tasks: (i) an open-ended question to determine the cognitive availability of different
risk factors; (ii) a quantitative rating task to measure how factors are integrated; and (iii) a

4
ranking task to identify how factors are prioritised. Our logic was that where consistencies
can be observed across these different tasks, these are likely to reflect cognitive tendencies
that generalise also to everyday contexts. Lastly, since real-world situations will sometimes
require balancing COVID-19 risks again other potential risks (e.g. financial or social risks), a
final task used vignettes to test whether the presence of such alternative risks affects the
perceived risk of infection. We introduce each task in the following subsections.
Open-Ended Question
Reponses to open-ended questions provide important information about participant attitudes,
beliefs and knowledge without imposition from researchers (Geer, 1988). They are often
avoided due to resource constraints, as responses are relatively difficult to score and analyse
(Reja, Manfreda, Hlebec & Vehovar, 2003). We nevertheless elicited perceived risk factors
before participants were presented with any cues. By recording both the factors people listed
and the order in which they listed them, we assessed the cognitive availability of different
factors (Folkes, 1988; Schwarz et al., 1991). The approach is supported by ‘query theory’;
factors reported first and most often are likely to be more heavily relied on when evaluating
risk (e.g. Weber et al., 2007). Hence, our first research questions were:
RQ1a: What risk factors for COVID-19 infection in social settings are most
cognitively available to the public?
RQ1b: Do the public and experts differ?
Rating Task

5
The second task sought to determine the weight people give to specific risk factors when
multiple factors are present and must be integrated. Most social interactions entail multiple
risk factors, but people’s ability to make judgements involving multiple attributes is limited,
meaning they may focus on certain risk factors and ignore others (e.g. Weber & Borcherding,
1993). For example, an individual may focus on the number of people present and whether
they maintain social distance, but ignore the duration of the gathering or whether it takes
place indoors or outdoors. Furthermore, risk factors may be multiplicative. Few people are
able to process anything beyond second order interactions accurately (Halford, Baker,
McCredden & Bain, 2005) and when dealing with “synergistic risks” (i.e. risk factors that
interact) people underestimate the risk arising from their combination, particularly if risks are
unfamiliar (Dawson, Johnson & Luke, 2013). In the present context, for example, people may
underestimate the additional risk of meeting multiple people indoors, relative to meeting just
a few people indoors or multiple people outdoors.
We presented participants with short descriptions of social situations that varied according to
risk factors prominent in public health advice. We refer to these as “scenarios”. The task was
to rate each scenario for risk of COVID-19 infection. In the controlled presentation of
multiple factors and exposure to multiple scenarios, the task was similar to a conjoint
experiment (Hainmueller, Hangartner & Yamamoto, 2015). This allowed us to assess the
relative weighting people assigned to different COVID-19 risk factors and how they
processed interactions. Hence, our second set of research questions was:
RQ2a: How do people weight specific risk factors for COVID-19 infection when
multiple factors must be integrated?
RQ2b: Are there differences between how the public and experts weight risk factors?
6
RQ2c: Are there differences between how the public and experts process interactions
between risk factors?
Ranking Task
Our third task asked participants to rank the riskiness of individual factors. Ranking tasks are
deployed to elicit preferences because they require differentiation of options and thereby
force stronger trade-offs than rating tasks (Krosnick, 1999). Although rankings do not
quantify differences, they can shed light on which risk factors people place more importance
on in isolation, when other contextual information is limited. The ranking task also allowed
us to introduce non-COVID risks for comparison, such as driving without a seatbelt. Our
third set of research questions was:
RQ3a: How are individual risk factors prioritised in the absence of other contextual
information?
RQ3b: How are COVID-19 risks prioritised against non-COVID risks?
RQ3c: Do the public and experts differ?
Risk Vignettes
In addition to comparing public and expert perceptions of risk factors, we tested whether
perceived risk of COVID-19 infection is altered by other risks. While the pandemic
continues, everyday situations pit the potential for infection against other needs, such as
going to work, attending medical appointments for other issues, or visiting friends and
family. The affective response to different kinds of risk can bias perceptions in specific

7
directions (i.e. the affect heuristic; Slovic, Finucane, Peters & MacGregor, 2007). For
example, if the anticipated thrill of a sky dive elicits a stronger affective response than the
worry of injury, a prospective sky-diver is likely to take the risk (Finucane, Alhakami, Slovic
& Johnson, 2000). However, we could find no literature examining whether perceptions of
risk in one domain are biased by the presence of risk in another. A potential extension of the
affect heuristic is to hypothesise that an affective response induced by an alternative everyday
risk may lead people to downplay the perceived risk of infection from COVID-19, perhaps
especially since the latter is relatively novel. For example, working in a busy factory, Paul
might perceive his risk of contracting COVID-19 at work to be lower if his income is vital for
meeting his mortgage repayments than if his income is less important. One can distinguish
between whether Paul judges it to be more reasonable to take the risk of infection when
facing a serious financial risk, from whether the second risk alters his perception of the
likelihood of infection. Hence, the task determined whether people perceive the risk of
COVID-19 infection independently of the presence of everyday risks. Our final research
question was:
RQ4: Does the presence of an alternative risk diminish the perceived risk of infection
from COVID-19?

8
Method and Results
The experiment proceeded over multiple stages and was programmed in Gorilla Experiment
Builder (Anwyl-Irvine, Massonnié, Flitton, Kirkham & Evershed, 2020). Participants in the
‘Public’ sample completed four stages: the Open-Ended Question followed by Risk Ratings,
Risk Rankings and Risk Vignettes tasks. The tasks were presented to participants sequentially
before finishing with a section on background characteristics and an unrelated experiment to
measure bias in survey estimates of compliance (reported in Timmons, McGinnity, Belton,
Barjaková & Lunn, 2020). The ‘Expert’ sample completed only the first three stages, with
some small modifications. We report the design and results for each stage separately. Full
instructions and materials for all stages are available in the Supplementary Material. We
report how we determined our sample size, all data exclusions, all manipulations and all
measures. The preregistration, data and analysis code are available at https://osf.io/ptv2y/.
The study was conducted in line with institutional ethics policy.
Participants
The Public sample consisted of 800 adults (421 men, 376 women, 2 other, aged 18 to 86
years) recruited from a market research agency’s online panel to take part based on a socio-
demographic quota. Timmons, Barjaková, Robertson, Belton and Lunn (2020) provide details
on how recruitment from this panel compares to a probability sample. Participants were paid
€6 for undertaking the 20-minute online study. To determine the sample size, we identified
the Risk Vignettes as the task that would require the greatest number of participants to be
sufficiently powered. Each vignette in the task required just one response per participant,
whereas we elicited multiple responses per participant for the Risk Ratings and the aims of
the Open Text and Risk Ranking tasks were primarily descriptive. There were three versions

9
of each vignette and the sample size was set to ensure a minimum of 250 responses per
version.
The ‘Expert’ sample consisted of 56 professionals with medical expertise in an area relevant
for assessing risk of COVID-19 infection: infectious diseases, clinical microbiology, virology
and public health. We recruited as many relevant experts as possible over the timeframe of
the experiment, from the Expert Advisory Group of NPHET, relevant university research labs
in Ireland, the Irish Society of Clinical Microbiologists and the Infectious Diseases Society of
Ireland. Two Experts had 10 years’ or less experience, with the remainder split between 11 to
20 years’ (n = 20), 21 to 30 years’ (n = 16) and more than 30 years’ experience (n = 18). To
ensure anonymity, we did not collect socio-demographic details other than area of expertise
and years of experience. They completed the study voluntarily. All participants completed the
study in mid-June 2020.
Stage 1: Open-Ended Question
Participants were first asked to write three things they think about when deciding whether an
activity might be risky or safe, considering the possibility of contracting the virus. The
instructions specified that we were interested only in the risk of becoming infected and not in
how bad it might be to contract the virus or to pass it on to someone else.
Results
Responses (n = 2,568) were coded independently by two of the authors (M. Barjaková and C.
Lavin), using a framework with 22 possible categories that was developed from a pilot study
(N = 40) and pre-registered. Agreement on the full 22-category coding structure was
“substantial” according to Landis and Koch (1977) criteria (81.7% agreement; κ = .80, p <

10
.001). We extracted five broader categories: the number of people, location (i.e. indoors or
outdoors, or whether the area is well ventilated), duration, social distancing and mask-
wearing. We also extracted an additional category for references to hand hygiene as a sixth
factor, given its coverage in public health advice. Agreement for these six categories was
“almost perfect” (96.5-99.7%; all κs > 0.81, all ps < .001). Disagreements were solved
through discussion, with input from a third author (S. Timmons) in two cases.
Figure 1. Responses to the open-ended question about COVID-19 risk factors in social
settings by the Public and Expert samples.
Some participants (13.9%) did not write any factors related to the risk of contracting
COVID-19 – for example, instead referring to the risk of subsequently passing it to a family
member – and were removed from the analyses. Frequencies are shown in Figure 1. Over half
of the Public sample wrote about the number of other people and whether social distancing
could be maintained, and almost one third mentioned whether the activity took place indoors
or outdoors. A similar pattern with higher proportions is observed for the Expert sample,
0
10
20
30
40
50
60
70
Public Expert Public Expert Public Expert Public Expert Public Expert Public Expert
Number ofPeople
Location Duration Distancing Masks Hand Hygiene
% Participants
First Second Third+

11
although substantially more referenced location. Tests of proportions using a Bonferroni-
corrected alpha of .008 for six comparisons show that, compared to the Public sample,
Experts were more likely to mention location (30.9% vs. 63%; z = 4.90, p < .001) and
duration (6.7% vs. 22.2%; z = 4.16, p < .001) as factors they consider when evaluating their
risk of contracting COVID-19. Effect sizes are large: Experts were more than twice as likely
to mention location and more than three times as likely to mention the amount of time spent
in one place. The equivalent analysis only for factors mentioned first shows that Experts were
also almost three times more likely to mention location first (8.6% vs. 24.4%; z = 3.82, p <
.001), although there was no difference for duration (0% of both groups). No other
comparisons were statistically significant.
Stage 2: Risk Ratings
Next participants were presented with a series of descriptions of social situations or
“scenarios”, each defined by four factors: how many people were present, whether it took
place indoors or outdoors, how long it lasted and whether maintaining 2 metre distance from
others was easy or difficult. These were chosen because it is well-established that they are
factors that influence the spread of the virus and they had been covered widely in public
health communications prior to the study. Participants’ task was to rate the riskiness of each
scenario on a scale from “Not At All Risky” to “Extremely Risky” (adapted from the
Domain-Specific Risk-Taking (DOSPERT) Scale; Blais & Weber, 2006). The scale was un-
numbered but contained 51 (0 – 50) possible responses.
Each participant responded to 14 scenarios selected from a larger set of 24, which were
constructed by orthogonally manipulating the above four factors based on the following
levels: number of other people (5, 14, 100); location (outdoors, indoors); duration (15-30

12
minutes, 2-4 hours); and distancing (easy, difficult). The levels were informed by policy
decisions, although there are further possible nuances to each (e.g., indoors could be divided
into indoor situations that are well-ventilated versus not; Liu et al., 2020). To ensure all
participants saw a range of low- and high-risk combinations, we constrained the selection of
the 14 trials for each participant such that at least two were high-risk on three or more factors
(i.e. 100 people, indoors, 2-4 hours, difficult to distance) and at least two were low-risk on
three or more factors (i.e. 5 people, outdoors, 15-30 minutes, easy to distance). Other
scenarios were selected at random and the order was randomised.
Scenarios were presented to participants with four per page. The first page included two
further scenarios as controls (Figure 2). One described a scenario with an extremely high
possibility of infection (close contact with a confirmed case for a prolonged period of time
and no access to PPE) and the other described a scenario with an extremely low possibility of
infection (a video call). These scenarios were presented on the first page to calibrate
participants to the levels of risk that would likely fall at either end of the response scale. They
also served as comprehension/attention checks.
After completing four pages (14 trial scenarios, 2 controls), participants were presented with
an additional four scenarios. These final four scenarios incorporated a fifth factor of interest:
mask-wearing (Chu et al., 2020). We tested for it separately because the recommendation to
wear masks came much later than other public health advice and was less consistent. At the
time of the study, masks were advised as a voluntary precaution on public transport or inside
shops (before subsequently becoming mandatory). These final four scenarios were chosen
from ones participants had rated previously, with information on mask-wearing added. For
this additional factor, we varied between-participants whether only they wore a mask in the

13
scenario, or whether everyone did. The manipulation was designed to check whether the
public had absorbed the message that masks primarily protect others rather than the wearer.

14
Figure 2. Example first page on the risk ratings task.

15
Up to this point, the Experts completed the same task as the Public sample. However, the
Experts were shown the mask scenarios twice, once when only they wore a mask and once
when everyone wore a mask, with the order randomised. This was done to increase the
accuracy of the benchmark estimates, given the smaller Expert sample.
To familiarise participants with assessing scenarios with multidimensional risks, before
completing the above task, participants undertook practice trials involving everyday risk. For
instance, one practice scenario involved not wearing a seatbelt while in a car, with
information shown regarding the speed and journey duration. Other practice scenarios
involved physical activity and gambling.
After completing all scenarios, participants in the Public sample were asked to rate on the
same risk scale the highest level of risk of contracting COVID-19 they judged to be
acceptable to take and to rate their confidence in their ability to judge such risk on a Likert
scale from 1 (Not at all confident) to 7 (Extremely confident).
Results
Fifty-eight participants were removed from the Public sample following procedures outlined
in the pre-registration (mis-rating control activities, responding in the fastest 5% on every
page, not varying their responses). Findings are not sensitive to these decisions.
Figure 3 presents the distribution of responses to the 14 scenarios (i.e. excluding controls and
the mask scenarios). Both the Public and Expert samples used the full length of the scale,
although the Public had a greater tendency to give maximum responses. Taking each

16
participant’s average risk rating, Experts perceived risk to be lower on average (MPublic =
30.39, SD = 9.64; MExpert = 22.86, SD = 8.55; t (796) = 5.68, p < .001; d = 0.83).
Figure 3. Distributions of responses to the 14 trials by the Public and Experts.
Individual standard deviations varied between 9.05 and 24.89 with a skewed distribution (M
= 14.30, SD = 2.58). To avoid participants with larger standard deviations having undue
influence on models, we standardise responses at the participant level and use OLS regression
clustered standard errors. Results are closely similar with both approaches.
Model 1 (F (5, 741) = 995.82, p < .001) in Table 1 shows the main effects of the four risk
factors for the Public sample. Judgements were sensitive to the levels of each of the four
factors, with scenarios where there were 100 other people (compared to 5) and scenarios
where it was difficult to keep 2 metres from others (compared to easy) showing the largest
and equivalent effect sizes. There is no change in coefficients when socio-demographic
0
2
4
6
8
10
12
% Responses
Not At All Risky Extremely Risky
Public Expert

17
controls for gender, age, educational attainment, living area (urban/rural) and employment
status are added. Model 2 (F (5, 55) = 130.68, p < .001) shows a similar pattern for the
Expert sample, however the Expert weighting of location (i.e. whether the scenario was
described as taking place indoors or outdoors) was just as large as their risk judgements for
meeting 100 others and meeting where it is difficult to socially distance.
Comparing Public weightings to Expert ones, the 95% confidence intervals show that Experts
gave greater weighting to location and duration. For readers interested in p-values, we test for
differences using Z-tests of the coefficients (Clogg, Petkova & Haritou, 1995). The final
column in Table 1 shows that, compared to the Expert sample, the Public underweighted
location (p < .001) and duration (p = .010), while there was no evidence for a difference on
coefficients for number of people (p14 = .482, p100 = .525) or distancing (p = .543).
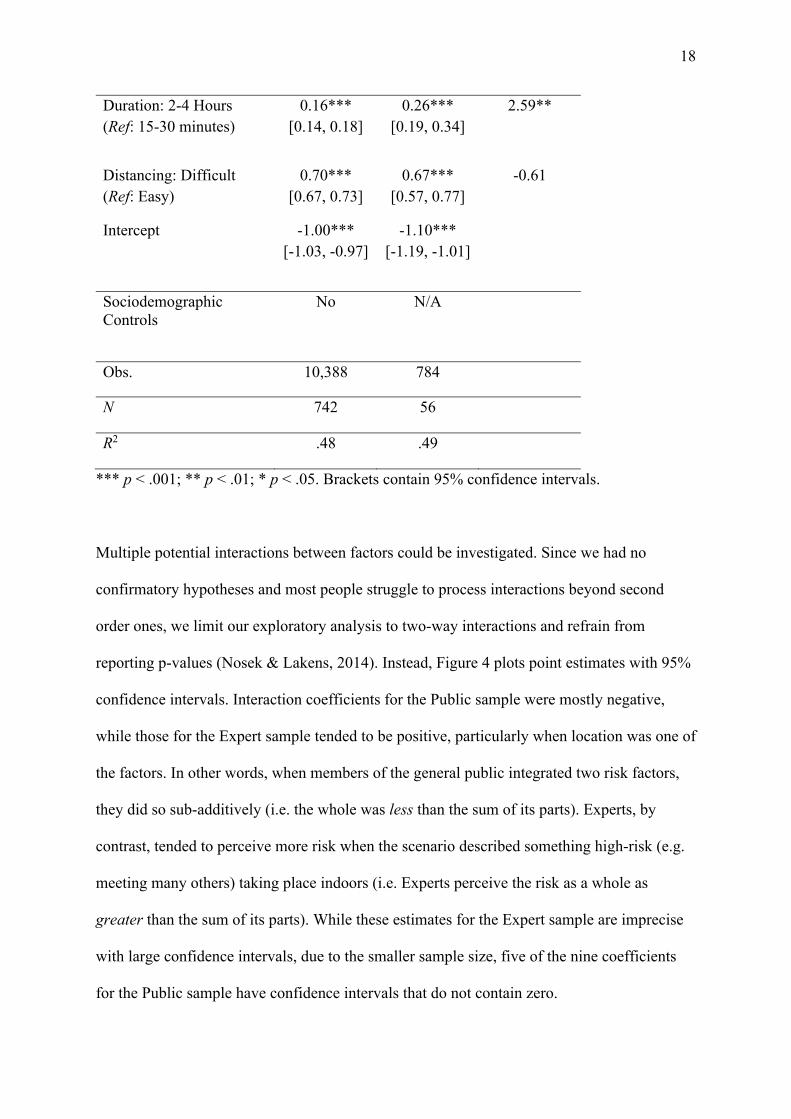
Table 1.
Regression Models Predicting (Standardised) Risk Ratings by the Public and Experts
Model 1 (Public)
Model 2 (Expert)
Public vs. Expert Z-test
Number of People: (Ref: 5 others)
14 others 0.30*** [0.28, 0.33]
0.27*** [0.19, 0.35]
-0.71
100 others 0.66*** [0.63, 0.70]
0.71*** [0.60, 0.82]
0.80
Location: Indoors (Ref: Outdoors)
0.48*** [0.45, 0.51]
0.68*** [0.58, 0.77]
3.93***
18
Duration: 2-4 Hours (Ref: 15-30 minutes)
0.16*** [0.14, 0.18]
0.26*** [0.19, 0.34]
2.59**
Distancing: Difficult (Ref: Easy)
0.70*** [0.67, 0.73]
0.67*** [0.57, 0.77]
-0.61
Intercept -1.00*** [-1.03, -0.97]
-1.10*** [-1.19, -1.01]
Sociodemographic Controls
No N/A
Obs. 10,388 784
N 742 56
R2 .48 .49
*** p < .001; ** p < .01; * p < .05. Brackets contain 95% confidence intervals.
Multiple potential interactions between factors could be investigated. Since we had no
confirmatory hypotheses and most people struggle to process interactions beyond second
order ones, we limit our exploratory analysis to two-way interactions and refrain from
reporting p-values (Nosek & Lakens, 2014). Instead, Figure 4 plots point estimates with 95%
confidence intervals. Interaction coefficients for the Public sample were mostly negative,
while those for the Expert sample tended to be positive, particularly when location was one of
the factors. In other words, when members of the general public integrated two risk factors,
they did so sub-additively (i.e. the whole was less than the sum of its parts). Experts, by
contrast, tended to perceive more risk when the scenario described something high-risk (e.g.
meeting many others) taking place indoors (i.e. Experts perceive the risk as a whole as
greater than the sum of its parts). While these estimates for the Expert sample are imprecise
with large confidence intervals, due to the smaller sample size, five of the nine coefficients
for the Public sample have confidence intervals that do not contain zero.

19
Figure 4. Plot of coefficients for two-way interactions on the risk ratings. Error bars indicate
the 95% confidence intervals.
‐0.4
‐0.3
‐0.2
‐0.1 0
0.1
0.2
0.3
0.4
1 4 OTHERS X 2‐4 HOURS
100 OTHERS X 2 ‐4 HOURS
14 OTHERS X DISTANCING DIFF ICULT
100 OTHERS X DISTANCING DIFF ICULT
14 OTHERS X INDOORS
100 OTHERS X INDOORS
INDOORS X 2 ‐4 HOURS
INDOORS X DISTANCING DIFF ICULT
2 ‐4 HOURS X DISTANCING DIFF ICULT
14 OTHERS X 2‐4 HOURS
100 OTHERS X 2 ‐4 HOURS
14 OTHERS X DISTANCING DIFF ICULT
100 OTHERS X DISTANCING DIFF ICULT
14 OTHERS X INDOORS
100 OTHERS X INDOORS
INDOORS X 2 ‐4 HOURS
INDOORS X DISTANCING DIFF ICULT
2 ‐4 HOURS X DISTANCING DIFF ICULT
PUBLIC
EXPERT
COEFFICIENT

20
Mask-Wearing. The Public sample decreased assessments of risk by 3.03 points (SD =
11.67) when the described scenario stated that only they wore a mask and by 8.44 (SD =
12.32) when everyone wore one. Expert perceptions of risk decreased by 4.26 (SD = 9.50)
and 9.51 (SD = 9.73), respectively. We test for differences in this reduction using a regression
model of change in risk (standardised at the participant level with clustered standard errors)
predicted by participant group, mask condition and their interaction. The model (F (3, 979) =
49.32, p < .001, R2 = .06) shows that all participants’ perceptions of risk reduced more when
everyone wore a mask compared to just themselves (ß = -0.39, 95% CI [-0.48, -0.31], p <
.001). There was no evidence for a difference between Experts and the Public overall (ß = -
0.13, 95% CI [-0.28, 0.02], p = .100), nor for an interaction (ß = 0.01, 95% CI [-0.12, 0.14], p
= .872), implying that the Public had absorbed the message that masks have more of a
protective effect on others than on the wearer.
Models 3a-4b in Table 2 regress the change in risk perception on the four manipulated risk
factors. We report separate models by participant group and mask condition. Negative
coefficients imply that mask wearing negated the risk due to the specific factor. The Public
judged that wearing masks reduced risk from all factors except duration. Expert results were
broadly similar, except with respect to ease of distancing. The Public reduced their rating of
risk when the scenario described that only they wore a mask and distancing was difficult. The
reduction was non-significant when everyone was described as wearing a mask. Experts, on
the other hand, only judged risk to reduce significantly when distancing was difficult if
everyone wore a mask. Full models, which interact the risk factors with participant group and
mask condition, support this pattern. Experts’ perceptions of risk reduced less than the Public
when everyone wore a mask but distancing was easy (ß = 0.16, 95% CI [0.02, 0.30], p =

21
.024) but their perception of risk reduced more than the Public when everyone wore a mask
and distancing was hard (ß = -0.31, 95% CI [-0.50, -0.13], p = .001).
Table 2.
Regression Models of the Change in Risk Due to Mask-Wearing
Model 3a (Public – Only
You)
Model 3b (Public -
Everyone)
Model 4a (Expert – Only
You)
Model 4b (Expert – Everyone)
Number of People (Ref: 5 others)
14 others -0.16** [-0.25, -0.07]
-0.23*** [-0.34, -0.13]
-0.27* [-0.52, -0.03]
-0.20 [-0.41, 0.01]
100 others -0.15** [-0.15, -0.06]
-0.30*** [-0.41, -0.18]
-0.24* [-0.46, -0.01]
-0.29* [-0.53, -0.05]
Indoors (Ref: Outdoors)
-0.27*** [-0.35 -0.18]
-0.22*** [-0.31 -0.13]
-0.17 [-0.37, 0.04]
-0.22* [-0.41, 0.03]
2-4 Hours (Ref: 15-30 minutes)
-0.05 [-0.13, 0.02]
-0.04 [-0.12, 0.05]
-0.07 [-0.25, 0.11]
-0.14 [-0.35, 0.06]
Difficult to Distance (Ref: Easy)
-0.19*** [-0.27, -0.11]
-0.07 [-0.16, 0.01]
-0.13 [-0.33, 0.07]
-0.32** [-0.49, -0.14]
Intercept 0.15** [0.04, 0.25]
-0.26*** [-0.37, -0.15]
0.02 [-0.27, 0.30]
-0.21 [-0.44, 0.01]
Obs. 1,520 1,448 224 224 N 380 362 56 56 R2 .06 .04 .05 .11
When asked about the level of risk that was acceptable to take, the Public reported having
low tolerance for risk, on average 12.75 out of 50 (SD = 12.15, Mdn = 9), with a strong skew.
They also reported being highly confident in their ability to judge risk (M = 5.65, SD = 1.13,

22
Mdn = 6), with 95.69% responding at the mid-point or above on the 1 to 7 scale. Findings
reported in this section are the same when risk tolerance and confidence are added to the
models as controls.
Stage 3: Risk Rankings
Participants ranked eight factors – the five COVID-19 risk factors from Stage 2 and the three
non-COVID factors used for the practice trials (gambling, driving without a seatbelt and risky
sporting activities) – in order of how risky each one would be for them, using the interface
shown in Figure 5. Each participant saw the activities presented in a randomised order. This
task required participants to prioritise specific risk factors over others when information
about the context was limited to just one factor. Non-COVID risks were included in this task
to provide insight for policymakers into how the public thought about specific COVID-19
risks compared to everyday risks.
Figure 5. Example ranking task.

23
Results
The fastest 5% of participants, who spent less than 32 seconds on the task (n = 37), were
excluded from the following analyses (although this does not alter the findings). Figure 6
charts the mean rank assigned to each factor by the Public and Expert samples, with the X-
axis ordered by weightings assigned by the Public in Stage 2. The chart shows consistency
among Experts between the Rating Task in Stage 2 and this task: maintaining social distance,
meeting a large group of people and meeting indoors had the largest coefficients in Stage 2
and were ranked as most risky in Stage 3. The Public rankings, however, differed from the
weightings estimated in the Rating Task. Although the number of other people and
maintaining distance were the most heavily weighted risk factors in Stage 2, in the ranking
task meeting indoors and meeting for a long time were judged to be more important than
distancing, (Wilcoxon Signed Rank, ZDuration = 5.97, p < .001; ZLocation = 4.28, p < .001).
Comparing judgements of COVID-19 risks to non-COVID ones, the Public ranked not
wearing a seatbelt similarly to meeting with a large group, and they ranked gambling and
risky sporting activities as less risky than the other COVID-19 risks (except for going where
not many others wear a mask). By contrast, Experts ranked not wearing a seatbelt and
engaging in a risky sporting activity as riskier than COVID-19 risks.

24
Figure 5. Average rankings assigned to risks in the ranking task by the Public and Experts.
Error bars indicate the standard error.
Stage 4: Risk Vignettes
Participants in the Public sample saw a series of six vignettes, presented in random order. The
experts did not complete this task. Three described a situation in which an individual must
decide between engaging in a potentially risky COVID-19 behaviour (e.g. using busy public
transport, working in a crowded factory) or facing an alternative risk (financial, medical or
psychosocial). Three further vignettes described factors of interest for policy (whether cases
were increasing or decreasing, familiarity with others, whether government and public health
officials agreed about restrictions) and are reported separately. Participants were asked two
questions about each vignette. First, they were asked to judge the riskiness of the COVID-19
behaviour, again considering only the possibility of infection. Second, they were asked how
reasonable it would be for the individual to engage in the behaviour. They gave both
1
2
3
4
5
6
7
8
Meeting alarge group
Not keeping2m distance
Meetingothers indoors
Meeting for along time
Going whereno one wears a
mask
Not wearing aseatbelt
Gambling billmoney
Risky sportingactivity
COVID Non‐COVID
Least R
isky
Most Risky
Public Expert

25
responses on the same scale used in Stage 2, from Not At All Risky (or Reasonable) to
Extremely Risky (or Reasonable).
For each of the vignettes we report here, we created three isomorphs to vary the level of the
alternative risk (i.e. low, moderate, high), as shown in Table 3. The alternative risks (not
meeting mortgage repayments, missing an important medical appointment, being unable to
have social contact for a prolonged period of time) were informed by a pre-test in which a
small sample of participants (n = 22) judged them to be equally worrying. The design was 3
(risk: financial, medical, psychosocial) x 3 (risk level: low, moderate, high) between-
participants. Participants read one vignette from each type of risk and one vignette from each
risk level. The pairing between risk type and risk level was counterbalanced across the
sample.
Table 3.
Risk Trade-Off Vignettes
Financial Medical Psychosocial
Introduction Paul does maintenance on machines and basic IT systems. He’s been offered a day’s work helping a factory to re-open. Paul knows the factory. There will be 40-50 people working fairly close together on the factory floor. The building is quite old and it’s all indoors.
Mary has a doctor’s appointment tomorrow. She’s had increasing abdominal pain for several weeks, but has put off going during lockdown. Mary can’t afford a taxi and the bus takes 45 minutes each way. Given the time of the appointment, she thinks the bus may be quite busy. With how long each journey will take, she’ll probably need to use the
Jim and Tony have been best friends for years, but live far apart and haven’t seen each other since February. Jim is going to visit Tony at home, and both are looking forward to it.

26
public toilets near the bus stop.
Low Risk Paul has kept some work going from home during lockdown. He’s paying his bills and feels like he’s coping financially. The extra money from this job would be a boost to his regular income.
Mary’s doctor has offered an online video consultation and thinks Mary’s complaint is probably minor. The doctor can always arrange for someone to collect Mary to bring her to the surgery if it’s needed.
Neither has been particularly lonely, as they have both seen family. They have good internet connections and have spoken using video calls, but it’s just not the same. But Jim’s car won’t start. He could get a bus to the station and take a train, but the station has become busy again and he’s worried the train could be busy too, especially when he comes back later on. Jim could wait a day or so to fix the car instead.
Moderate
Risk
Paul’s income is down. He has some savings and got the Government welfare payment. He’s managing to pay his bills but things are quite tight. The extra money would help.
Mary’s doctor has offered a consultation over a video call, but given the nature of Mary’s complaint it would be better to see her in person, just in case.
Jim has been a bit lonely, as he has no family or friends who could visit. His internet is not great, so he’s only managed a few short video calls with other friends. He’s really looking forward to seeing Tony in person. But Jim’s car won’t start. He could get a bus to the station and take a train, but the station has become busy again and he’s worried the train could be busy too, especially when he comes back later on. Jim could wait a day or so to fix the car instead.
High Risk Paul’s income is down and he has no savings. The Government welfare payment has not been enough to cover the bills and he’s worrying about the next mortgage payment. Some extra money would really help.
Mary’s doctor can’t do an online consultation, and has said it’s important to see her in person given the nature of Mary’s complaint. It could be something serious.
Jim has been really lonely during lockdown, as he has no family or friends who could visit. His mobile phone coverage is quite poor and he’s only received the occasional text message. But Jim’s car won’t start. He could get a bus to the station and take a

27
train, but the station has become busy again and he’s worried the train could be busy too, especially when he comes back later on. He’s not sure how long it will take to fix his car and it could be a long time before he has any other social contact.
Results
The fastest 5% of participants read the vignettes and responded to the first question within 7.5
seconds and are excluded from the following analyses. Again, their inclusion does not
qualitatively alter results. The average response time otherwise was 36.5s (Mdn = 31.2s).
Figures 7a and 7b present average risk perceptions and reasonableness judgements to each
vignette. Note that a one-way ANOVA showed no evidence that the Low Risk versions of
each vignette elicited different perceptions of risk, F (2, 739) = 0.70, p = .498, η2 < .01.
We analyse each risk type (financial, medical, psychosocial) separately, meaning each
participant has one score per question for each vignette and the primary comparison is
between-groups for each risk level (low, medium, high). We report OLS regressions to test
for differences between versions but results are closely similar if transformed or ordinal
response variables are used. All models include socio-demographic controls for gender, age,
education, socio-economic grade, employment status and living area. Results are similar if a
control for being in a high-risk group is added and if responses are standardised using each
participant’s mean and standard deviation from Stage 2. We pre-registered directional
hypotheses but do not adjust the alpha because we run two separate models on each vignette.

28
Figure 7a. Average risk assigned to each vignette (on scale range from 0 to 50). Error bars indicate the standard error. The y-axis is scaled to
demonstrate 1 standard deviation (14 points), to give an indication of effect size.
27
29
31
33
35
37
39
41
Financial Medical Psychosocial
Risk of Infection
(1SD
)
Low Moderate High

29
Figure 7b. Average judgement that the risk was reasonable to take for each vignette. Error bars indicate the standard error. The y-axis is scaled
to demonstrate 1.5 standard deviations (1 SD = 13), to give an indication of effect size.
Table 4.
Regression Models of Risk Perception and Reasonability Judgements to Each Vignette Type
Model 5a Risk
Perception
Model 5b Reasonability
Judgement
Model 6a Risk
Perception
Model 6b Reasonability
Judgement
Model 7a Risk
Perception
Model 7b Reasonability
Judgement
12
17
22
27
32
Financial Medical Psychosocial
Reasonable to
Take Risk
(1.5SD
)
Low Moderate High

30
Vignette Condition (Ref: Low Risk)
Financial Medical Psychosocial
Moderate Risk -0.53 [-2.43, 1.37]
1.57 [-0.89, 4.04]
-3.85*** [-5.89, -1.81]
10.41*** [7.85, 12.97]
-0.89 [-2.92, 1.14]
5.86*** [3.42, 8.31]
High Risk -0.41 [-2.31, -1.50]
4.94*** [2.47, 7.42]
-3.90*** [-5.95, -1.85]
12.55*** [9.98, 15.12]
-3.52** [-5.54, -1.50]
8.51*** [6.08, 10.93]
Intercept 35.38*** [32.81, 37.95]
22.86*** [19.52, 26.20]
37.36*** [34.61, 40.12]
23.84*** [20.38, 27.30]
35.65*** [32.91, 38.40]
13.94*** [10.65, 17.24]
N 760 760 761 761 762 762
R2 .04 .08 .06 .19 .07 .10
***p < .001; **p < .01; *p < .05

31
There was no evidence that facing a moderate or severe financial risk altered perceived risk
of infection compared to a low financial risk (Model 5a, F (2, 757) = 0.51, p = .600), nor was
there a difference between moderate and severe risk (equal coefficients test, F (1, 757) =
0.01, p = .942). However, Model 5b (F (2, 757) = 9.83, p < .001) shows that participants
reported that taking such a risk was more reasonable when the financial risk was severe
compared to low (p < .001) and moderate (F (1, 757) = 6.82, p = .009). The difference
between low and moderate risk was in the predicted direction but significant only at the 10%
level (p = .072).
Regarding the medical vignette, participants judged the risk of contracting COVID-19 from
travelling on public transport to be lower when the alternative medical risk was moderate or
high compared to when it was low (p < .001, p = .001, respectively). There was no difference
between moderate and high medical risk (F (1, 758) = 0.01, p = .907). Participants also
judged that it was more reasonable to take the risk of contracting COVID-19 when there was
moderate (p < .001) or severe (p < .001) medical risk scenarios, but there was no difference
between moderate and severe risk (F (1, 758) = 2.08, p = .151).
Responding to the psychosocial vignette, participants judged the risk of contracting COVID-
19 from travelling on public transport to be lower when the psychosocial risk (of loneliness)
was high compared to when it was low (p = .002) or moderate (F (1, 759) = 7.41, p = .007),
but there was no difference between low and moderate risk (p = .671). However, participants
judged that it was more reasonable to take the risk when the loneliness risk was high
compared to low (p < .001) and moderate (F (1, 759) = 5.60, p = .018) and when it was
moderate compared to low (p < .001).

32
Deviations from Pre-Registration
We deviated from the pre-registered analysis plan in the following ways. First, the possibility
to collect data from the Expert sample arose after the research questions for the Public sample
were pre-registered. An additional pre-registration was uploaded for the Expert sample.
Second, in the Risk Ratings task, we standardised ratings at the participant level to account
for large differences in individual standard deviations, rather than using mixed-effects models
or transforming the response scale to an ordinal scale. We also opted not to exclude
participants who classified themselves as high-risk. This decision was made prior to any
analysis – we had not anticipated the proportion of participants who would fall into this
category (26.6%), which on reflection is in line with population estimates released after the
study (Clark et al., 2020). The participants closely match Census estimates on all
demographic questions. We also pre-registered checks for socio-demographic differences but
do not report them in this paper as these were primarily to inform potential targeting of health
communications for policy. A summary is available in Supplementary Material. Finally, on
the Risk Vignettes task, we retained the raw response scale rather than transforming to
ordinal scales for ease of interpretation; again this choice doesn’t affect the results.

33
Discussion
This study set out to elicit lay perceptions of COVID-19 risk factors, benchmarked against
perceptions of medical experts. Results from the multi-stage experiment show that the public
had absorbed information about some main risk factors well. Public and expert samples
broadly agreed on the risks involved in meeting in large groups, not maintaining social
distance and not wearing a mask. However, experts perceived substantially greater risk of
infection associated with being indoors, spending long periods with others and the presence
of multiple simultaneous risk factors. Table 5 summarises our research questions and
findings. Looking across the tasks, the results are suggestive of a heuristic approach
underlying public evaluations of risk. We outline this here, followed by a short note on the
study’s limitations.
Table 5.
Research Questions and Main Findings
Research Question Finding
1a What risk factors for COVID-19
infection in social settings are most
cognitively available to the public?
Meeting with large groups of people and not maintaining
social distancing were the two most cognitively available
risk factors for the public. Less than one-third mentioned
location, and few people mentioned duration of
interactions or mask-wearing.
1b Do the public and experts differ?
Experts and the public showed similar awareness of risks,
although experts were significantly more likely to think
about whether they meet others indoors or outdoors and, to
a lesser extent, the duration of a social gathering.
2a How do the public weight specific
risk factors for COVID-19 infection
The public weighted the number of other people and the
ability to maintain social distance most heavily when

34
when multiple ones must be
integrated?
evaluating risk, followed by the location and lastly the
duration.
2b Are there differences between how
the public and experts weight risk
factors?
Experts judged location and duration to be more important
than the public did. They judged location to be as
important as the number of people and distancing.
2c Are there differences between how
the public and experts process
interactions between risk factors?
The public tended to combine risks sub-additively,
whereas experts combined risks multiplicatively when a
high risk factor occurred indoors.
The public judged masks to reduce risk significantly more
when distancing is maintained, whereas experts judged
masks to diminish risk more so when distancing is not
maintained.
3a How are individual risk factors
prioritised in the absence of other
contextual information?
The public judged meeting with a large group of people to
be the most important risk factor, followed by duration,
location, distancing and mask-wearing.
3b How are COVID-19 risks
prioritised against non-COVID
risks?
The public judged COVID-19 infection to be riskier than
some other everyday risks (such as gambling and risky
sporting activities). They judged meeting with a large
group of other people to be as risky as driving without a
seatbelt.
3c Do public and experts differ?
Experts didn’t differentiate between most of the COVID-
19 risk factors, except for mask-wearing (which they
judged as the least important) and judged COVID-19
infection to be less risky than other everyday risks.
4 Does the presence of an alternative
risk diminish the perceived risk of
infection from COVID-19?
Facing a moderate medical risk and high psychosocial risk
decreased the perceived risk of infection of COVID-19,
but there was no evidence for an effect of financial risk.

35
The difference between the responses of the public and experts was not consistent across
tasks, although there were some commonalities. Experts were more likely to mention location
and duration in their open text responses and to weight both (especially location) more
heavily in the Risk Rating task. In these two tasks, differences between experts and the public
did not arise regarding the number of people, the importance of maintaining social distance,
or wearing a mask. However, in the Risk Ranking task, when risks had to be considered in
isolation, the public placed greater weight on location and duration as risk factors than
distancing. This pattern is consistent with public reliance on an ‘avoid people’ heuristic when
multiple situation attributes need to be integrated. That is, the number of close interactions
with others is cognitively available and dominates complex judgements when multiple factors
must be taken into account. Yet, when compared in isolation, important environmental
factors are given more weight. Hence, when contextual information is limited or uncertain –
such as judging whether it is safe to go to a gathering where this an unknown number of
people or where ability to maintain social distance is unclear – the public prioritise the
gathering’s location and how long they plan to be there. Otherwise, however, it may be easier
to rely on the simple heuristic to avoid people This finding is potentially important, given
that real-world judgements tend to be multi-dimensional and there is growing evidence that
the efficacy of distancing depends on the environment (Jones et al., 2000).
The Ratings Task also revealed that, relative to experts, the public neglects the synergistic
nature of risk. Interaction coefficients implied a sub-additive combination of factors similar
to risk perceptions in other domains (Dawson et al., 2013). Conversely, equivalent
interactions for experts had positive signs, particularly when the scenario described a high-
risk encounter (e.g. meeting a large group of people) taking place indoors. Moreover, experts

36
and the public thought differently about the interaction between mitigation behaviours. The
public judged masks to reduce risk significantly more when social distancing was maintained,
while experts judged masks to reduce risk significantly more when distancing was not
maintained (i.e. when risk was higher). These findings may indicate a less granular
perception of risk, perhaps including a degree of binary categorisation by the public, whereby
social settings are primarily classed as ‘safe’ or ‘not safe’, with only limited further
differentiation. Future studies could consider testing the effects of teaching the public how to
integrate information in the same way experts do (e.g. Attari, DeKay, Davidson & de Bruin,
2010; Fleming et al., 2012).
The Risk Vignettes, completed only by the public sample, showed that factors independent of
COVID-19 risk can decrease the perceived possibility of infection. Financial, medical and
psychosocial risk all increased how reasonable participants judged COVID-19 risks to be to
take, but high psychosocial risk and even moderate medical risk led participants to judge that
the possibility of infection itself was lower than when the alternative risk was quite low. The
findings therefore suggest that facing alternative risks is likely to make people more
vulnerable during the pandemic. The findings also have implications for psychological
understanding of risk, as they provide novel evidence that the affect heuristic extends to
situations in which two sources of dread compete (e.g. Finucane et al., 2000), with the
perceived level of one source of risk diminishing. Why financial risk did not “compete” with
COVID-19 risk in the same way as medical and psychosocial risk is unclear from our
findings, but one possibility for future research would be to test whether the relatedness of
competing risk domains matters.
Limitations

37
The findings from each stage have implications for public health interventions and
psychological understanding of risk, but there are caveats worth noting. First, while we were
interested exclusively in the perceived risk of becoming infected, there are multiple
downstream components to COVID-19 risk to consider when generalising the findings to
everyday activity. These include the likelihood of removing the virus if it is picked-up (e.g.
through hand hygiene), the risk of spreading the virus to others, the severity of symptoms and
the likelihood of mortality. Second, our focus was on infection through immediate social
interaction and ignored infection through other means. This included infection via face-
touching after touching a fomite, which can be mitigated by simply observing good hand
hygiene. Among the expert medical community, there is growing evidence that infection is
driven primarily by aerosol transmission rather than by droplets or fomites, although this
evidence, public advice and public perceptions may change over time (Goldman, 2020;
Mondelli, Colaneri, Seminari, Baldanti & Bruno, 2020). Third, this study was commissioned
by policymakers to identify gaps in public comprehension of COVID-19 during the summer
of 2020 in Ireland. While there is no reason to believe that the heuristics identified from the
analyses are specific to this context, there is no guarantee that the findings extend to other
nations and times. Public health communications in Ireland have not departed notably from
international norms and have been based heavily on WHO advice. Nevertheless, the method
we used offers a way to conduct diagnostic studies elsewhere, or to test further for an ‘avoid
others’ heuristic or sub-additivity in multi-factor COVID-19 risk judgements.
Conclusion
This study provides evidence that the public struggle to integrate environmental risks factors
when evaluating the risk of becoming infected with COVID-19 in social settings. In
particular, relative to medical experts, the public underestimate the benefits of interacting

38
outdoors rather than indoors and focus more on how many people they come close to. This
difficulty, coupled with the novel finding that perceived risk can be diminished by
independent factors (such as other psychological needs), implies that people are likely to
unknowingly place themselves in environments with higher risk of infection, thereby
potentially contributing to the spread of the virus. Controlled diagnostic experiments can help
to inform public health communications by identifying departures from medical advice and
highlighting the heuristics people rely on when evaluating risk, as well as advancing our
understanding of the psychology of large-scale risks (Lunn et al., 2020).

39
References
Anwyl-Irvine, A. L., Massonnié, J., Flitton, A., Kirkham, N., & Evershed, J. K. (2020). Gorilla in
our midst: An online behavioral experiment builder. Behavior research methods, 52(1), 388-
407. https://doi.org/10.3758/s13428-019-01237-x
Attari, S. Z., DeKay, M. L., Davidson, C. I., & De Bruin, W. B. (2010). Public perceptions of energy
consumption and savings. Proceedings of the National Academy of sciences, 107(37), 16054-
16059. https://doi.org/10.1073/pnas.1001509107
Blais, A. R., & Weber, E. U. (2006). A domain-specific risk-taking (DOSPERT) scale for adult
populations. Judgment and Decision making, 1(1).
Brewer, N. T., Chapman, G. B., Gibbons, F. X., Gerrard, M., McCaul, K. D., & Weinstein, N. D.
(2007). Meta-analysis of the relationship between risk perception and health behavior: the
example of vaccination. Health psychology, 26(2), 136. https://doi.org/10.1037/0278-
6133.26.2.136
Chu, D. K., Akl, E. A., Duda, S., Solo, K., Yaacoub, S., Schünemann, H. J., ... & Hajizadeh, A.
(2020). Physical distancing, face masks, and eye protection to prevent person-to-person
transmission of SARS-CoV-2 and COVID-19: a systematic review and meta-analysis. The
Lancet. https://doi.org/10.1016/S0140-6736(20)31142-9
Clark, A., Jit, M., Warren-Gash, C., Guthrie, B., Wang, H. H., Mercer, S. W., ... & Checchi, F.
(2020). Global, regional, and national estimates of the population at increased risk of severe
COVID-19 due to underlying health conditions in 2020: a modelling study. The Lancet
Global Health, 8(8), e1003-e1017. https://doi.org/10.1016/S2214-109X(20)30264-3
Clogg, C. C., Petkova, E., & Haritou, A. (1995). Statistical methods for comparing regression
coefficients between models. American Journal of Sociology, 100(5), 1261-1293.
https://doi.org/10.1086/230638

40
Dawson, I. G., Johnson, J. E., & Luke, M. A. (2013). Helping individuals to understand synergistic
risks: An assessment of message contents depicting mechanistic and probabilistic
concepts. Risk analysis, 33(5), 851-865. https://doi.org/10.1111/j.1539-6924.2012.01878.x
Dryhurst, S., Schneider, C. R., Kerr, J., Freeman, A. L., Recchia, G., Van Der Bles, A. M., ... & van
der Linden, S. (2020). Risk perceptions of COVID-19 around the world. Journal of Risk
Research, 1-13. https://doi.org/10.1080/13669877.2020.1758193
Finucane, M. L., Alhakami, A., Slovic, P., & Johnson, S. M. (2000). The affect heuristic in
judgments of risks and benefits. Journal of behavioral decision making, 13(1), 1-17.
https://doi.org/10.1002/(SICI)1099-0771(200001/03)13:1<1::AID-BDM333>3.0.CO;2-S
Fischhoff, B., Bostrom, A., & Quadrel, M. J. (1993). Risk perception and communication. Annual
review of public health, 14(1), 183-203.
https://doi.org/10.1146/annurev.pu.14.050193.001151
Fleming, P., Townsend, E., Van Hilten, J. A., Spence, A., & Ferguson, E. (2012). Expert relevance
and the use of context-driven heuristic processes in risk perception. Journal of Risk
Research, 15(7), 857-873. https://doi.org/10.1080/13669877.2012.666759
Folkes, V. S. (1988). The availability heuristic and perceived risk. Journal of Consumer
research, 15(1), 13-23. https://doi.org/10.1086/209141
Geer, J. G. (1988). What do open-ended questions measure?. Public Opinion Quarterly, 52(3), 365-
367. https://doi.org/10.1086/269113
Goldman, E. (2020). Exaggerated risk of transmission of COVID-19 by fomites. The Lancet
Infectious Diseases, 20(8), 892-893. https://doi.org/10.1016/S1473-3099(20)30561-2
Hainmueller, J., Hangartner, D., & Yamamoto, T. (2015). Validating vignette and conjoint survey
experiments against real-world behavior. Proceedings of the National Academy of
Sciences, 112(8), 2395-2400. https://doi.org/10.1073/pnas.1416587112

41
Halford, G. S., Baker, R., McCredden, J. E., & Bain, J. D. (2005). How many variables can humans
process?. Psychological Science, 16(1), 70-76. https://doi.org/10.1111/j.0956-
7976.2005.00782.x
Jones, N. R., Qureshi, Z. U., Temple, R. J., Larwood, J. P., Greenhalgh, T., & Bourouiba, L. (2020).
Two metres or one: what is the evidence for physical distancing in covid-19?. BMJ, 370.
https://doi.org/10.1136/bmj.m3223
Krosnick, J. A. (1999). Survey research. Annual review of psychology, 50(1), 537-567.
https://doi.org/10.1146/annurev.psych.50.1.537
Landis, J. R., & Koch, G. G. (1977). The measurement of observer agreement for categorical
data. biometrics, 159-174. https://doi.org/10.2307/2529310
Lipshitz, R., & Strauss, O. (1997). Coping with uncertainty: A naturalistic decision-making
analysis. Organizational behavior and human decision processes, 69(2), 149-163.
https://doi.org/10.1006/obhd.1997.2679
Liu, Y., Ning, Z., Chen, Y., Guo, M., Liu, Y., Gali, N. K., ... & Liu, X. (2020). Aerodynamic
analysis of SARS-CoV-2 in two Wuhan hospitals. Nature, 582(7813), 557-560.
https://doi.org/10.1038/s41586-020-2271-3
Lohiniva, A. L., Sane, J., Sibenberg, K., Puumalainen, T., & Salminen, M. (2020). Understanding
coronavirus disease (COVID-19) risk perceptions among the public to enhance risk
communication efforts: a practical approach for outbreaks, Finland, February
2020. Eurosurveillance, 25(13), 2000317. https://doi.org/10.2807/1560-
7917.es.2020.25.13.2000317
Lunn, P. D., Belton, C. A., Lavin, C., McGowan, F. P., Timmons, S., & Robertson, D. A. (2020).
Using Behavioral Science to help fight the Coronavirus. Journal of Behavioral Public
Administration, 3(1). https://doi.org/10.30636/jbpa.31.147

42
Mondelli, M. U., Colaneri, M., Seminari, E. M., Baldanti, F., & Bruno, R. (2020). Low risk of
SARS-CoV-2 transmission by fomites in real-life conditions. The Lancet Infectious Diseases.
https://doi.org/10.1016/S1473-3099(20)30678-2
Nosek, B. A., & Lakens, D. (2014). A method to increase the credibility of published results. Social
Psychology, 45(3), 137-141. http://dx.doi.org/10.1027/a000001
Qian, G., Yang, N., Ma, A. H. Y., Wang, L., Li, G., Chen, X., & Chen, X. (2020). COVID-19
transmission within a family cluster by presymptomatic carriers in China. Clinical Infectious
Diseases, 71(15), 861-862. https://doi.org/10.1093/cid/ciaa316
Reja, U., Manfreda, K. L., Hlebec, V., & Vehovar, V. (2003). Open-ended vs. close-ended questions
in web questionnaires. Developments in applied statistics, 19(1), 159-177.
Schwarz, N., Bless, H., Strack, F., Klumpp, G., Rittenauer-Schatka, H., & Simons, A. (1991). Ease
of retrieval as information: another look at the availability heuristic. Journal of Personality
and Social psychology, 61(2), 195. https://doi.org/10.1037/0022-3514.61.2.195
Setti, L., Passarini, F., De Gennaro, G., Barbieri, P., Perrone, M. G., Borelli, M., ... & Miani, A.
(2020). Airborne transmission route of COVID-19: why 2 meters/6 feet of inter-personal
distance could not Be enough. Int. J. Environ. Res. Public Health, 17(8), 2932.
https://doi.org/10.3390/ijerph17082932
Slovic, P. (1987). Perception of risk. Science, 236(4799), 280-285.
https://doi.org/10.1126/science.3563507
Slovic, P., Finucane, M. L., Peters, E., & MacGregor, D. G. (2007). The affect heuristic. European
journal of operational research, 177(3), 1333-1352.
https://doi.org/10.1016/j.ejor.2005.04.006
Timmons, S., Barjaková, M., Robertson, D., Belton, C., & Lunn, P. (2020). Public understanding and
perceptions of the COVID-19 test-and-trace system. Econ Social Res Inst (ESRI) Res Ser.
https://doi.org/10.26504/sustat96

43
Timmons, S., McGinnity, F., Belton, C. A., Barjaková, M., & Lunn, P. (2020). It depends on how
you ask: measuring bias in population surveys of compliance with COVID-19 public health
guidance. J Epidemiol Community Health. https://doi.org/10.1136/jech-2020-215256
Tversky, A., & Kahneman, D. (1974). Judgment under uncertainty: Heuristics and
biases. Science, 185(4157), 1124-1131. https://doi.org/10.1126/science.185.4157.1124
Van Doremalen, N., Bushmaker, T., Morris, D. H., Holbrook, M. G., Gamble, A., Williamson, B. N.,
... & Lloyd-Smith, J. O. (2020). Aerosol and surface stability of SARS-CoV-2 as compared
with SARS-CoV-1. New England Journal of Medicine, 382(16), 1564-1567.
https://doi.org/10.1056/NEJMc2004973
Weber, E. U., Johnson, E. J., Milch, K. F., Chang, H., Brodscholl, J. C., & Goldstein, D. G. (2007).
Asymmetric discounting in intertemporal choice: A query-theory account. Psychological
science, 18(6), 516-523. https://doi.org/10.1111/j.1467-9280.2007.01932.x
Weber, M., & Borcherding, K. (1993). Behavioral influences on weight judgments in multiattribute
decision making. European Journal of Operational Research, 67(1), 1-12.
https://doi.org/10.1016/0377-2217(93)90318-H
Wise, T., Zbozinek, T. D., Michelini, G., & Hagan, C. C. (2020). Changes in risk perception and
protective behavior during the first week of the COVID-19 pandemic in the United States.
PsyArxiv. https://doi.org/10.31234/osf.io/dz428