Working Paper for “Carriage Capacity of the Straits of ... · PDF fileWorking Paper for...
14
1 Working Paper for “Carriage Capacity of the Straits of Malacca and Singapore” SimPlus Pte. Ltd., Singapore Commissioned by the Maritime and Port Authority of Singapore Abstract The Straits of Malacca and Singapore (SoMS) is one of the most important strategic maritime passages of the world. Against the backdrop of projected increase in maritime trade, and the corresponding increase in maritime traffic in this region, this paper describes ongoing work to systematically determine the current level of traffic and assess the carriage capacity of the SoMS. Computer simulation was the approach chosen for this assessment and capacity is evaluated on the basis of efficiency and safety of navigation within the SoMS. I. INTRODUCTION I.1 Background According to the [Review of Maritime Transport 2008] published by the United Nations Conference on Trade and Development (UNCTAD), global seaborne trade will increase by 44 percent in 2020 and double by 2031. This would consequently lead to an increase in the volume of maritime traffic through the Straits of Malacca and Singapore (SoMS). A clear and accurate picture of the carriage capacity of the SoMS would allow MPA and other relevant authorities in the littoral states to understand how increases in the volume of maritime traffic could possibly affect navigational efficiency and safety in the SOMS, and allow them to identify strategies to enhance the carriage capacity and address issues of navigational safety, if any. Towards this end, MPA has commissioned SimPlus to undertake a study of the carriage capacity of the SoMS. I.2 Overview of the SoMS The SoMS, which are bordered by Malaysia, Indonesia and Singapore, measure about 250 nautical miles between One Fathom Bank off Port Klang in the west and Horsburgh Lighthouse in the east. The Traffic Separation Scheme (TSS), for safer navigation in the SoMS, was brought into force on 1 May 1981. In 1998, the International Maritime Organization (IMO) adopted the Mandatory Ship Reporting System in the Straits of Malacca and Singapore, known as “STRAITREP”, as proposed by Indonesia, Malaysia and Singapore. It aims to enhance the safety of navigation, protect the marine environment, facilitate the movement of vessels and, search and rescue (SAR) and oil pollution response operations. The entire TSS is divided into 9 sectors with Sectors 1 to 6 lying in the Malacca Strait and Sectors 7 to 9 in the Singapore Strait. Singapore Vessel Traffic Service (VTS) is the authority for STRAITREP in Sectors 7 to 9, while Klang VTS and Johor VTS are the authorities for Sectors 1 to 5 and Sector 6 respectively.
Transcript of Working Paper for “Carriage Capacity of the Straits of ... · PDF fileWorking Paper for...
1
Working Paper for “Carriage Capacity of the Straits of Malacca and Singapore”
SimPlus Pte. Ltd., Singapore
Commissioned by the Maritime and Port Authority of Singapore
Abstract
The Straits of Malacca and Singapore (SoMS) is one of the most important strategic maritime
passages of the world. Against the backdrop of projected increase in maritime trade, and the corresponding increase in maritime traffic in this region, this paper describes ongoing work to
systematically determine the current level of traffic and assess the carriage capacity of the SoMS. Computer simulation was the approach chosen for this assessment and capacity is evaluated on
the basis of efficiency and safety of navigation within the SoMS.
I. INTRODUCTION
I.1 Background
According to the [Review of Maritime Transport 2008] published by the United Nations Conference on Trade and Development (UNCTAD), global seaborne trade will increase by 44
percent in 2020 and double by 2031. This would consequently lead to an increase in the volume of maritime traffic through the Straits of Malacca and Singapore (SoMS).
A clear and accurate picture of the carriage capacity of the SoMS would allow MPA and other
relevant authorities in the littoral states to understand how increases in the volume of maritime
traffic could possibly affect navigational efficiency and safety in the SOMS, and allow them to identify strategies to enhance the carriage capacity and address issues of navigational safety, if
any. Towards this end, MPA has commissioned SimPlus to undertake a study of the carriage capacity of the SoMS.
I.2 Overview of the SoMS
The SoMS, which are bordered by Malaysia, Indonesia and Singapore, measure about 250 nautical miles between One Fathom Bank off Port Klang in the west and Horsburgh Lighthouse in
the east.
The Traffic Separation Scheme (TSS), for safer navigation in the SoMS, was brought into
force on 1 May 1981. In 1998, the International Maritime Organization (IMO) adopted the Mandatory Ship Reporting System in the Straits of Malacca and Singapore, known as
“STRAITREP”, as proposed by Indonesia, Malaysia and Singapore. It aims to enhance the safety of navigation, protect the marine environment, facilitate the movement of vessels and, search
and rescue (SAR) and oil pollution response operations. The entire TSS is divided into 9 sectors
with Sectors 1 to 6 lying in the Malacca Strait and Sectors 7 to 9 in the Singapore Strait. Singapore Vessel Traffic Service (VTS) is the authority for STRAITREP in Sectors 7 to 9, while
Klang VTS and Johor VTS are the authorities for Sectors 1 to 5 and Sector 6 respectively.

2
Along the TSS through which international shipping traverses the SoMS, the overall
narrowest point lies within the Singapore Strait in Sector 8, south of St. John’s Island. This point measures about 530m westbound, 1617m eastbound and 2150m overall. In the Malacca Strait,
the narrowest point in the westbound lane is off One Fathom Bank in Sectors 1 and is 3582m wide. The narrowest point eastbound as well as overall for the Malacca Strait is near Tanjung Piai
in Sector 6 and measures 2959m and 8056m respectively. Table 1 below summarises the narrow
points in the TSS from Sectors 1-9.
Table 1: Summary of narrow points in the TSS
Sectors 7-9 (Singapore Strait)
Sectors 1-6 (Malacca Strait)
Overall 2150m
(near St John’s Island, Singapore, Sector 8)
8056m
(off Port of Tanjung Pelepas, Malaysia, Sector 6)
Eastbound 1617m (near St John’s Island,
Singapore, Sector 8)
2959m (off Port of Tanjung Pelepas,
Malaysia, Sector 6)
Westbound 530m (near St John’s Island,
Singapore, Sector 8)
3582m (near One Fathom Bank,
Malaysia, Sector 1)
The SoMS form the shortest sea-link between the Indian and Pacific Oceans. The importance
of the SoMS as an international waterway has been well-established. It represents the longest strait in the world used for international navigation and supports the bulk of the maritime trade
between Europe and Pacific Asia. The SoMS are especially important for vessels transporting oil
between the Middle East and the East Asian economic giants of Japan and China because they constitute the shortest and most cost-effective sea route between the two destinations. It is
estimated that more than one third of world trade and half its oil is transported through the SoMS. The SoMS therefore are of vital importance both to European-Asian trade and to the
energy needs of East Asia. It is clear that the rapid economic development of China and India will further enhance the importance of the SoMS. As a result, the number of ships and the tonnage of
goods passing through the SoMS will increase.
I.3 Objectives
Given the increase in maritime traffic through the SoMS, the study sets out to systematically
examine the current situation in the SoMS and conduct a comprehensive assessment of its
capacity. Outlined below are the key objectives of the study:
a) Evaluate the carriage capacity of the SoMS (Sectors 1 to 9 of the TSS), taking into account the historical volume and pattern of maritime traffic in the area as well as existing
navigational routes and rules employed in the area;
b) Identify the narrow/choke points and possible congestion areas in the SoMS in terms of carriage capacity; and
c) Examine possible measures that could enhance the carriage capacity while at the same time maintaining navigational safety in the SoMS.

3
This working report presents the preliminary results for items a) and b). Work on c) is under
way and its results will be reported in due course.
Section II of this report summarises the literature review. Section III describes the simulation model developed for this study. Section IV presents the experiments conducted and key results
available at this stage while Section V identifies issues to be studied in the latter phase of this
study.
II. LITERATURE REVIEW
The complexity of a marine traffic system, which stems from the large number of vessel types, complicated operational regulations, and autonomous control of vessel positions by the
ship masters that introduces vast and irregular intersections of navigation routes, makes it
difficult to assess the capacity of a sea space system [H. Fan and J-M Cao, 2000]. The capacity of sea-space depends heavily on the prevailing traffic pattern, namely the mix of vessel types and
sizes, speeds of various vessel types, as well as their dwell times at port facilities such as berths and anchorages. Capacity therefore is only meaningful for a given set of operating conditions.
Approaches to assessing capacity typically fall within three categories, namely (i) queuing theory, (ii) network analysis, and (iii) computer simulation. In queuing theory, vessel arrivals are modelled as a Markov process where the time taken by a vessel to pass through a facility is determined by the service level (i.e. service time required to process the vessel) and the rate of
arrival of vessels entering the system. The capacity of a waterway is determined by defining the threshold for average service time. Queuing theory does not take into account the impact of
different vessel mix or the dynamics between vessels. The result is a rough estimate that can be
used as a guideline for long term capacity planning.
Conceptually, the network approach acknowledges the need to incorporate the influences introduced by different traffic patterns and considers a sea space system as a directional network
consisting of links and nodes, where a node represents a specific location in the sea space such
as a pilot boarding ground, a berth, or an anchorage, and a link is the fairway (or part of it) connecting any two nodes.
In such a network model [H. Fan and J-M Cao, 2000], each element (a node or a link) has its
own capacity, which is defined as the maximum number of vessels that can be served by the
element within a specific time interval. The capacity of the network is then determined by that of the weakest element and the traffic demand on it. The capacity of an element can be found from
the requirements on the minimum spatial separation set for different vessel types and the physical properties of the element. Although such an approach takes into account the dynamic
nature of traffic patterns, the interactions, i.e. collision avoidance actions, between vessels are not modelled. Moreover, the network approach tends to assess the waterway capacity using the
traffic pattern of the “peak day” with maximum number of vessel calls, which may not be
representative for certain elements.
Computer simulation is the most popular way to model complex systems and has been widely used in assessing the capacities of land and air traffic systems. There is general consensus that
amongst the three approaches of assessing capacity, computer simulation is more robust and
rigorous, yielding more realistic results. Nevertheless, applications in the maritime traffic system have relatively lagged behind, though the recent past has seen a significant increase in adopting
simulation for capacity analysis and navigation risk assessment.
Existing maritime simulation programs can be divided into two different categories, i.e. single vessel simulation and multi-vessel system. The former type of model focuses on simulating the
4
precise path within a channel taken by a vessel given a set of external influences such as
currents, waves and wind. They are mainly used for channel design or navigation training.
The second type of simulation simulates the movements of multiple vessels along a given navigation network. Such programs focus on the global layout of the waterway rather than the
precise channel dimensions, and are mainly used to determine the capacity and safety of
waterway designs. Without considering the hydrodynamic influences, as such details cannot be accurately projected for future scenarios, a maritime traffic simulation model moves individual
vessels from their source to their destination within a navigation network, abiding by the International Regulations for Avoiding Collisions at Sea or The Rules of the Road (COLREGS) to
take collision avoidance manoeuvres when necessary. The main difference among existing models [J. Marriage, 2006; Ilhan Or et al, 2003; I.W. Dand and R.D. Colwill, 2003; Merrick J. et
al, 2003] is the level of detail in which the vessel movements are modelled, e.g. fixed or flexible
path along a channel, independent vessel behaviour, number of collision avoidance actions, and speed variations etc.
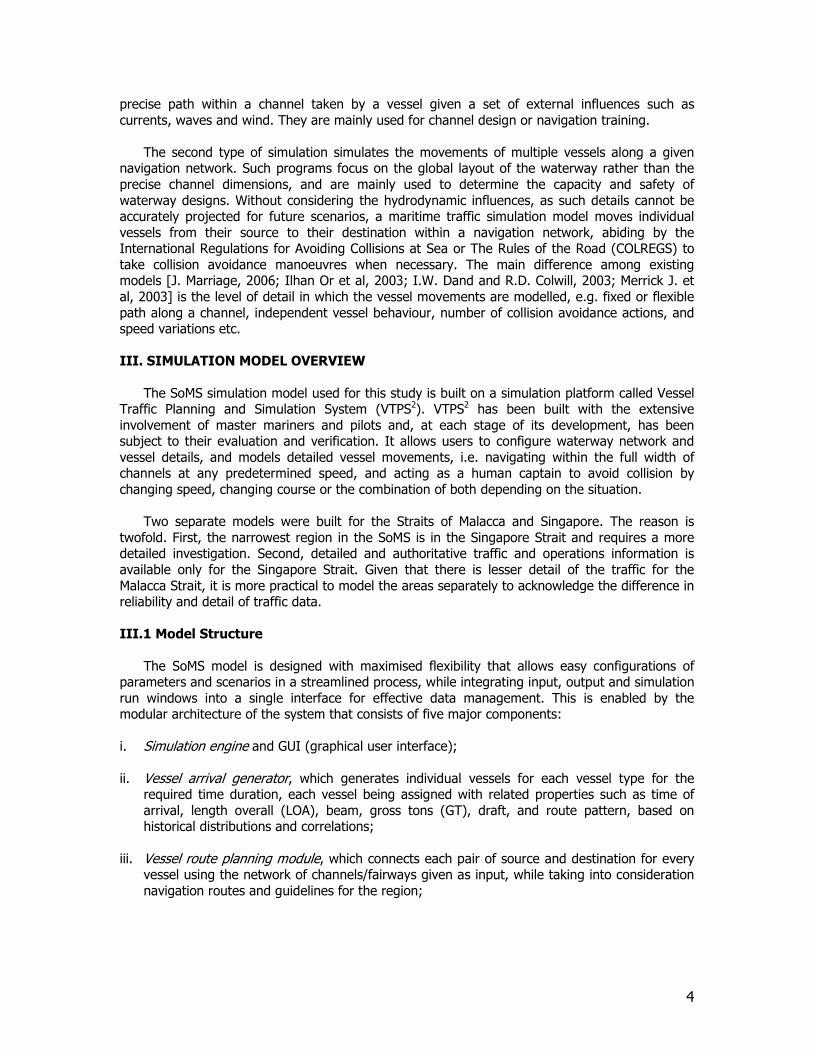
III. SIMULATION MODEL OVERVIEW
The SoMS simulation model used for this study is built on a simulation platform called Vessel Traffic Planning and Simulation System (VTPS2). VTPS2 has been built with the extensive
involvement of master mariners and pilots and, at each stage of its development, has been subject to their evaluation and verification. It allows users to configure waterway network and
vessel details, and models detailed vessel movements, i.e. navigating within the full width of channels at any predetermined speed, and acting as a human captain to avoid collision by
changing speed, changing course or the combination of both depending on the situation.
Two separate models were built for the Straits of Malacca and Singapore. The reason is
twofold. First, the narrowest region in the SoMS is in the Singapore Strait and requires a more detailed investigation. Second, detailed and authoritative traffic and operations information is
available only for the Singapore Strait. Given that there is lesser detail of the traffic for the
Malacca Strait, it is more practical to model the areas separately to acknowledge the difference in reliability and detail of traffic data. III.1 Model Structure
The SoMS model is designed with maximised flexibility that allows easy configurations of parameters and scenarios in a streamlined process, while integrating input, output and simulation
run windows into a single interface for effective data management. This is enabled by the modular architecture of the system that consists of five major components:
i. Simulation engine and GUI (graphical user interface);
ii. Vessel arrival generator, which generates individual vessels for each vessel type for the required time duration, each vessel being assigned with related properties such as time of
arrival, length overall (LOA), beam, gross tons (GT), draft, and route pattern, based on historical distributions and correlations;
iii. Vessel route planning module, which connects each pair of source and destination for every vessel using the network of channels/fairways given as input, while taking into consideration
navigation routes and guidelines for the region;

5
iv. Vessel navigation module, which navigates each vessel from its source to its destination, in
compliance with the COLREGS that set out the “rules of the road” upon which the safe navigation and conduct of vessels is built; and
v. Collision avoidance module, which manoeuvres a vessel to avoid potential collisions by
slowing down, overtaking, changing course or a suitable combination of the above actions.
III.2 Model Details
Vessel Traffic
Vessels using the SoMS can be classified as either transiting vessels or vessels calling at a
port for facilities such as berths, yards and anchorages. For the Singapore Strait, detailed
information on the transiting vessels and calling vessels were obtained from MPA. However, for the Malacca Strait, the numbers had to be estimated based on available information and certain
assumptions made. 2007 was chosen as the representative base year for traffic data analysis.
Singapore Strait For the Singapore Strait, MPA provided data for 2007 on the number of vessels above 300
gross tons (GT) that called at the port of Singapore and the number of vessels that transited through the Singapore Strait. This information was based on the vessels that reported to the
Singapore VTS, and was analysed to form representative distributions for the key attributes such as vessel arrival times, sizes and routing etc. Information for vessels below 300 GT was not
available. It was assumed that these smaller vessels would have no impact on the waterway
capacity as they are small and swift.
The numbers of vessels transiting and calling at port for year 2007 are summarised in Table 2 below. They give rise to a total of 257,000 movements in the Singapore Strait. Note that these
numbers do not include the intra-port movements, as they do not have any impact on the TSS,
which is the focus here.
Table 2: Summary of Vessel Arrivals and Transits for the Port of Singapore
Transits 41,000
Arrivals 108,000
Departures 108,000
Total 257,000
Ten types of vessels were identified as the main users of the Singapore Strait, namely (in
alphabetic order) barges, bulk carriers, chemical tankers (including LPG and LNG), coasters, containerships, ferries, freighters, passenger vessels, tankers and VLCC.
Seasonality of vessel traffic was captured on a monthly basis. It was found that different
types of vessels experienced different patterns of seasonality. Analyses on vessel inter-arrival times were conducted for individual types, with curve fitting. The results showed exponential
distributions best fit the inter-arrival times, implying a Poisson arrival of vessels. To incorporate
the seasonality, a non-stationary Poisson process was appropriate to model the vessel arrivals. Malacca Strait
A survey was conducted on available information of vessel traffic in the Malacca Strait for the
year 2007. Information from the Malaysian Marine Department showed that about 70,000 vessels

6
reported to Klang VTS although no further details were provided about transit and port-calling
traffic etc. Several other unofficial sources found online cited vastly differing numbers for 2007 traffic.
In the absence of complete data, approximation was made based on known traffic for the
Singapore Strait and available information for the Malacca Strait from various maritime sources
and online research papers and articles. Based on these, the following available information was used to estimate traffic levels in the Malacca Strait:
1) 86,000 movements at western boundary of Singapore Strait (based on ship reports to
Singapore VTS) 2) 70,000 vessels reported to Klang VTS [Malaysia Marine Department] (assumed to be the
movements at the western end of the Malacca Strait)
3) 17,000 vessel calls at Port Klang [Port Klang website] 4) About 77% of all Sector 1 to 6 traffic is to Port Klang [Traffic split, online sources]
5) Items 3) and 4) above indicate that total arrivals in Sectors 1-6 is 22,000.
Based on the above numbers, and assuming that eastbound and westbound transit traffic is
equal, the following can be deduced:
1) 28,000 eastbound and 28,000 westbound movements 2) 16,000 port calls from the east and 6,000 from the west
3) 14,000 departures to the east and 8,000 to the west
Cross strait ferry traffic was estimated as 26,000 per year based on information pieced
together from various online sources [Ferry traffic split, online sources].
For intra Malacca Strait traffic it has been assumed that
- traffic between service points in Malaysia travels out of the TSS
- traffic between service points in Indonesia travels out of the TSS - cross traffic (non ferry) between service points in Malaysia and Indonesia is negligible.
Based on the above, Malacca Strait traffic was approximated as shown in Table 3 below. The
total number of movements, including transit and calling traffic is estimated to be 126,000.
Table 3: Summary of Vessel Arrivals and Transits for the Malacca Strait
Transits 56,000
Arrivals 35,000
Departures 35,000
Total 126,000
Vessel Characteristics
The physical attributes of vessels relevant to the objectives of the study include LOA, beam,
GT and draft. An LOA distribution was developed for each vessel type based on the Singapore
Strait and Singapore Port historical data, and used as a reference for generating the other three attributes, where each attribute was described as a function of LOA based on historical data
using curve fitting.

7
Vessel speeds for different types of vessels in the Singapore Strait are sampled from MPA’s
radar records. As no speed information is available for vessels in the Malacca Strait, same speed distributions are applied.
Similarly, for lack of a better option, it is assumed that the vessel mix and attributes of vessels in the Malacca Strait are the same as that for the Singapore Strait.
Waterway Layout
The waterway layout specifies the boundaries of travel for the vessels. There is a clear separation of westbound and eastbound lanes in the TSS, with the eastbound route allowing
deeper draft vessels to travel through. The TSS layout and corresponding usage rules are available for Singapore Strait as well as Malacca Strait from voyage planning guides [Singapore
Port Information; Passage Planning Guide]. Figure 1 below shows the TSS for Sectors 1 to 9
along the SoMS.
Figure 1: Traffic Separation Scheme (TSS) in SoMS
The figure clearly shows that the width of the TSS is not uniform along its entire stretch. As
has been described in Section I.2 under Introduction, there are some particularly narrow areas along the SoMS, especially in the Singapore Strait. These actual TSS dimensions were
incorporated in the simulation model and rules of usage specified. Based on the width of waterways they are traversing and their own physical attributes, vessels decide whether they can
travel in parallel lanes alongside other vessels.
Navigation Routes
Vessels using the SoMS are either transit vessels which do not call at any port or other facility
along the SoMS or calling/departing vessels which stop at some facility along the Straits.
8
Although this study deals with simulation of traffic in the Straits, it is important to understand at
which points along the TSS the traffic in the Straits originates and terminates, so as to correctly model the movement patterns and density of traffic along different sections of the TSS. For the
Singapore Strait, this was obtained from historical movement of vessels between the Strait and port waters. For Malacca Strait, certain assumptions were made in this regard, based on the
location of key ports along the TSS and their corresponding traffic as obtained from online
sources described above.
Navigation Guidelines and Avoidance Actions
All vessels in the SoMS model comply with the COLREGS, with each vessel navigating as an independent agent which reacts appropriately to the situation around it. To adequately emulate
realistic vessel behaviour in the model, each vessel is given a safety domain and the undesirable
overlap of safety domains would require vessels to take avoidance manoeuvres and could otherwise lead to a potential accident. The dimensions of the safety domain were approximated
based on a study of radar pictures from Singapore VTS data.
As the avoidance manoeuvres must be taken well before the overlapping of domains, a
monitoring range is assigned to each vessel and when another vessel enters the range, a monitoring mode is triggered to continuously monitor the safety domains of the vessels in the
monitoring range. If an overlap of domains is predicted (called an interaction), an avoidance action, i.e. slowing, steering and/or changing course is taken, in adherence with the COLREGS.
III.3 Capacity Definition
The capacity of a waterway network depends on its physical characteristics, navigation guidelines, the composition and characteristics (e.g. LOA, beam, speed etc.) of vessels using it,
as well as the required safety distance between successive vessels. Thus, the capacity is only meaningful for a given set of operating conditions and will change if there is a change in any of
the above influencing variables.
In this study, capacity is defined as the maximum efficient and safe volume of traffic
(number of vessels per unit time, e.g. per year or per month) that can be sustained in the given configuration of navigational network. “Efficient” means that the travel time between any pair of
origin and destination should be within a predetermined range, whereas “safe” means that the
risk of travelling in the waterway is below a predetermined threshold.
It is therefore critical to benchmark the average travel time of vessels using the Straits and the associated navigation risk, using current level of traffic volume. With the benchmarks in
place, the carriage capacity of the Straits can be assessed by comparing the increases in travel time and risk against the increase in traffic volume.
Travel Time
In this study, the travel times of transiting vessels (including eastbound transit and westbound transit) are the key capacity indicator. For each transiting vessel, its travel time in the
TSS, between Tanjung Piai (01 15.54’N 103 30.60’E) and Horsburgh Lighthouse (01 19.81’N 104
24.34’E), is collected from the model for the Singapore Strait, and the travel time between Batu Mandi (02 52.2’N 100 41.1’ E) and Tanjung Piai (01 15.54’N 103 30.60’E) for the Malacca Strait.
Navigation Risk

9
In quantitative risk analyses, the term risk is defined as the product of the risk probability
and its associated consequence. By the nature of the simulation model, the scope of this assessment focuses on the probability, as it is difficult, if not impossible, to quantify the
consequences of a predicted risk in maritime transport that can consist of material damage to the ship, its surroundings and the environment, as well as indirect damage such as loss of future
income or even injuries and deaths. When reference is made to risk in this report, it therefore
refers to the probability of a risk occurring.
Risks that are of most interest in maritime transport have been identified in the Permanent International Association of Navigation Congresses (PIANC) Bulletin 95 as 1) collisions, 2)
groundings, 3) strandings, 4) impact and 5) strikings. In the SoMS model, collision risk is the main focus for two reasons. Firstly, the water depth of most of the SoMS is deep enough to allow
the majority of vessels to navigate through without grounding/stranding risks. Secondly,
immovable or floating objects such as buoys and vessels at anchor are not considered in the study which indicates no impact/striking risks. This study on navigation risk therefore focuses on
the most important factor which is ship-ship collisions.
The collision risk level is estimated by the number of interactions. The risk level in year 2007
is used as a benchmark for determining the relative safety of any projected future traffic situation. To use the model in a quantitative way, an empirical relationship has to be established
between the simulated number of avoidance manoeuvres and the 2007 historical collision count. However, the incident records in well run ports are likely to contain statistically small samples of
incidents that make such a relationship statistically insignificant. As a result, such a relationship should be used with due care.
IV. EXPERIMENTS AND PRELIMINARY RESULTS
IV.1 Model Validation
The SoMS model inputs and logic were verified by MPA marine experts. In addition, to ensure
that the simulation model is a realistic representation of the vessel movements, travel time in the Singapore Strait is used as the key indicator for comparisons against the historical data. Two-
sample t-tests were conducted to confirm that the differences in mean travel times were not significant. Table 4 below shows the comparison of travel times for the different major vessel
types modelled. Actual historical travel times were not available for the Malacca Strait and hence
a similar comparison could not be conducted.
Table 4: Travel time validation
Vessel Type Direction
Travel Time in minutes
(Historical)
Travel Time in minutes
(Simulation) Difference
Bulk Carrier To West 436 453 3.96%
Bulk Carrier To East 485 464 -4.20%
Chemical (and LPG/LNG) To West 398 387 -2.69%
Chemical (and LPG/LNG) To East 396 394 -0.48%
Container To West 345 330 -4.29%
Container To East 341 345 1.05%
Freighter To West 456 452 -0.95%
Freighter To East 494 465 -5.72%
Tanker To West 445 453 1.63%

10
Tanker To East 487 466 -4.35%
VLCC To West 431 462 7.32%
VLCC To East 484 468 -3.43%
IV.2 Preliminary Results
Assessing the capacity of SoMS implies assessing the maximum traffic that can efficiently and
safely be sustained. For this purpose, the traffic level fed into the simulation model is increased
and the results of the model evaluated. Since details of traffic cannot be projected accurately into the long term future, it was assumed that while the total volume of traffic goes up, the traffic
composition, vessel mix and route patterns remain the same as that today, both for the Singapore Strait and the Malacca Strait. Thus all traffic was proportionally increased in quantum
from the benchmark 2007 level and the capacity indicators are also presented in terms of
increase relative to the benchmark level.
Singapore Strait
The impact of increasing traffic on the efficiency indicator, or the time it takes for vessels to transit the Singapore Strait, is shown in Figure 2 below. As the traffic level goes up, there is a
corresponding increase in the travel time. When traffic is doubled from the base year 2007, the
travel time is increased by 13%. This means that for a typical east to west (and vice versa) transit journey by a vessel taking 7 hours to transit through the Singapore Strait, the travelling
time would increase to near 8 hours.
0%
2%
4%
6%
8%
10%
12%
14%
257,000 (Base) (+25%) (+50%) (+75%) (+100%)
Vessel Traffic Level (#Movements)
Increase in Vessel Travel Time
Figure 2: Efficiency indicator for the Singapore Strait
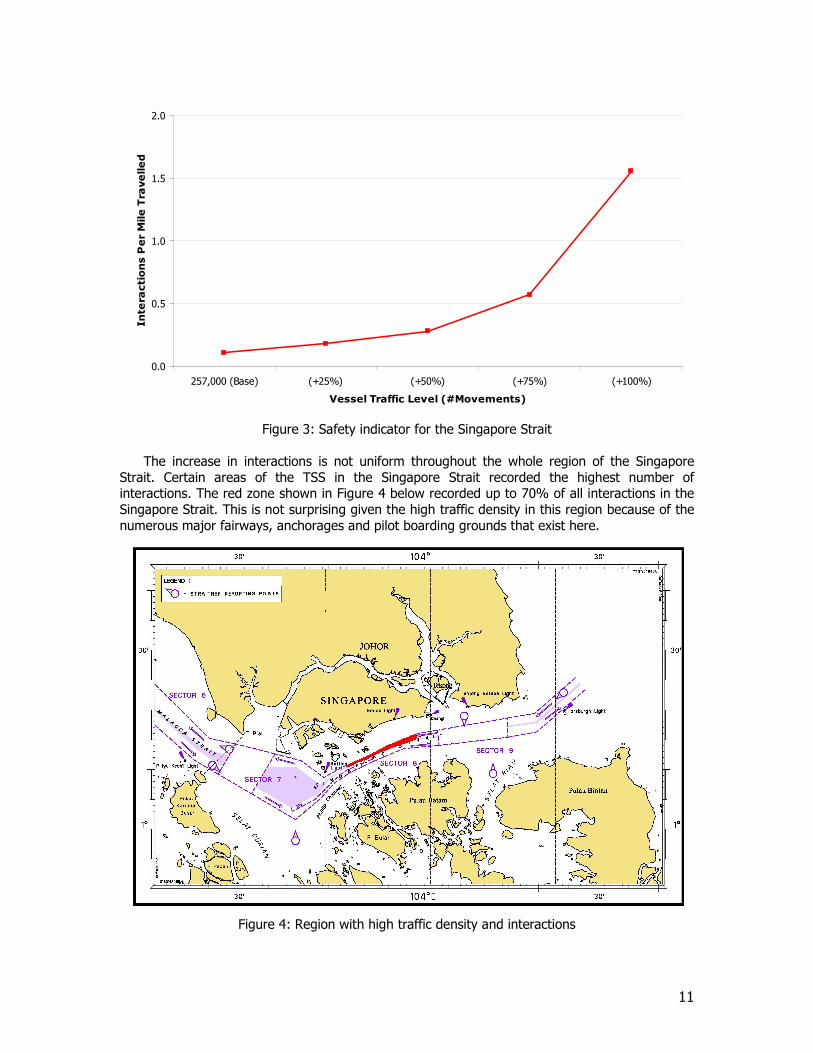
Figure 3 below illustrates the impact of an increase in traffic on navigational safety in the
Singapore Strait, which is quantified by the number of interactions per vessel per nautical mile
travelled. At 257,000 vessel movements in the base year, each vessel would have 1 interaction every 10 nautical miles. When traffic is doubled, the number increased to 15 every 10 nautical
miles.
11
0.0
0.5
1.0
1.5
2.0
257,000 (Base) (+25%) (+50%) (+75%) (+100%)
Vessel Traffic Level (#Movements)
Interactions Per Mile Travelled
Figure 3: Safety indicator for the Singapore Strait
The increase in interactions is not uniform throughout the whole region of the Singapore
Strait. Certain areas of the TSS in the Singapore Strait recorded the highest number of interactions. The red zone shown in Figure 4 below recorded up to 70% of all interactions in the
Singapore Strait. This is not surprising given the high traffic density in this region because of the
numerous major fairways, anchorages and pilot boarding grounds that exist here.
Figure 4: Region with high traffic density and interactions
12
It can be seen from both the efficiency and safety indicator charts that there is a gradual
increase in the vessel travel time and number of interactions per mile travelled as traffic volume is increased by up to 75% of the base year level, beyond which the increase becomes more
pronounced. This assumes that there are no advances in technology, no improvements to the existing processes and that operations remain unchanged as of 2007.
Malacca Strait
Based on available information and assumptions on traffic in the Malacca Strait and using the same methodology, a preliminary assessment of the capacity in the Malacca Strait was also
conducted.
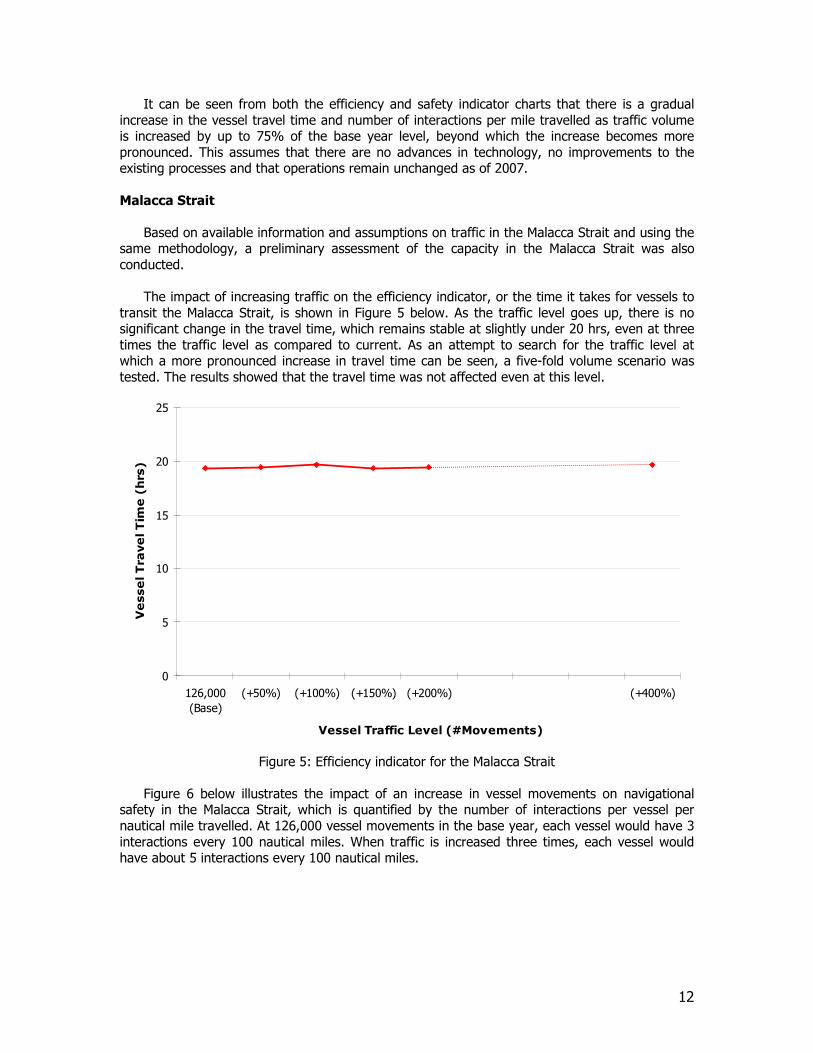
The impact of increasing traffic on the efficiency indicator, or the time it takes for vessels to
transit the Malacca Strait, is shown in Figure 5 below. As the traffic level goes up, there is no significant change in the travel time, which remains stable at slightly under 20 hrs, even at three
times the traffic level as compared to current. As an attempt to search for the traffic level at which a more pronounced increase in travel time can be seen, a five-fold volume scenario was
tested. The results showed that the travel time was not affected even at this level.
0
5
10
15
20
25
126,000
(Base)
(+50%) (+100%) (+150%) (+200%) (+400%)
Vessel Traffic Level (#Movements)
Vessel Travel Time (hrs)
Figure 5: Efficiency indicator for the Malacca Strait
Figure 6 below illustrates the impact of an increase in vessel movements on navigational safety in the Malacca Strait, which is quantified by the number of interactions per vessel per
nautical mile travelled. At 126,000 vessel movements in the base year, each vessel would have 3
interactions every 100 nautical miles. When traffic is increased three times, each vessel would have about 5 interactions every 100 nautical miles.

13
0.00
0.02
0.04
0.06
0.08
0.10
126,000
(Base)
(+50%) (+100%) (+150%) (+200%) (+400%)
Vessel Traffic Level (#Movements)
Interactions Per Mile Travelled
Figure 6: Safety indicator for the Malacca Strait
As seen above, the efficiency indicator holds steady for the Malacca Strait while the safety indicator shows a slow increase all the way to five times the current traffic level. This leads to the
assessment that the Malacca Strait can sustain traffic up to five times the current level, assuming that the traffic numbers and patterns used here for the Malacca Strait are reasonably close to
reality and that all technology, processes and operations remain the same as that of today.
V. FUTURE WORK
The growth of vessel traffic in the SoMS will depend on many factors, including economic
conditions, global trade, shipping trends and technological advances. Over time, the capacity of the SoMS can be increased even further with improved traffic management measures and
technological advances. Work is underway in the second phase of the study to examine possible measures that could enhance the carriage capacity of the Singapore Strait while at the same time
maintaining navigational safety. Separately, if in future, traffic volume and pattern details for the
Malacca Strait could be obtained to a level of detail similar to that used for the Singapore Strait, the model can be adjusted to incorporate these, and new results generated, which in turn would
be more reliable, given the higher confidence in the inputs.
References
Review of Maritime Transport 2008: United Nations Conference on Trade and Development
(UNCTAD), available online at http://www.unctad.org/Templates/WebFlyer.asp?intItemID=4659&lang=1
Fan, Henry S.L. and Cao, Jia-Ming (2000). Sea space capacity and operation strategy analysis
system, Transportation Planning and Technology, Vol. 24, pp. 49-63. Marriage, Jim (2006). Marine Risk Assessment for Port of Melbourne, Technical Report, available
online at http://www.channelproject.com/global/docs/SEES_Technical_Appendix_16.pdf.
14
Or, I., Ozbas, B. and Yilmaz, T. (2003). Simulation of marine traffic in Istanbul Strait, Simulation Modelling Practice and Theory, Vol 11, pp. 597–608.
Dand, I. W. and Colwill, R. D. (2003). Simulation of traffic flows using dynamic ship modelling, in Proceedings of International Conference on Marine Simulation and Ship Maneuverability,
Kanazawa, Japan.
Merrick, J.R.W., van Dorp, J.R., Blackford, J.P., Shaw, G.L., Harrald, J. and Mazzuchi, T.A.
(2003). A traffic density analysis of proposed ferry service expansion in San Francisco Bay using a maritime simulation model, Reliability Engineering and System Safety, Vol 81, pp. 119-132. Malaysia Marine Department, statistics are available online at
http://www.marine.gov.my/service/statistik/BKP/report_all_kapal_07.pdf
Port Klang official website, http://www.pka.gov.my/KlangSta.asp
Traffic split, online sources: TED Case Study on MALACCA: The Impact of Transportation on
Wildlife in the Malacca Straits, available online at http://www1.american.edu/ted/malacca.htm.
Source attributed to Marine Dept. Malaysia, Public Port Corporation Belawan Indonesia and Port of Singapore Authority. Ferry traffic split, online sources:
- http://wikitravel.org/en/Dumai - http://www.m-sia.com/indomal/price.html
- Maritime Traffic Pattern along Indonesian Coastal ports in southern portion of Malacca
Straits, available online at http://www.nmc.com.sg/2006.08.03.pdf
Singapore Port Information: Edition 2008/2009. Published by the Hydrographic Department of Maritime and Port Authority of Singapore.
Passage Planning Guide: Malacca & Singapore Straits (2nd Edition 2008). Published by Witherby Seamanship International Ltd.