Working Paper #9004: Financial Burden of Health Care ...provider of health care in Turkey, provided...
24
Financial Burden of Health Care Expenditures in Turkey: 2002-2003 Seher Nur Sulku and Didem Minbay Bernard Agency for Healthcare Research and Quality Working Paper No. 09004 November 2009 Suggested citation: Sulku S, Bernard D. Financial Burden of Health Care Expenditures in Turkey: 2002-2003. Agency for Healthcare Research and Quality Working Paper No. 09004, November 2009, http://gold.ahrq.gov. AHRQ Working Papers provide preliminary analysis of substantive, technical, and methodological issues. The papers have not undergone external peer review. They are distributed to share valuable experience and research. Comments are welcome and should be directed to the authors. The views expressed are those of the authors and no official endorsement by the Agency for Healthcare Research and Quality or the Department of Health and Human Services is intended or should be inferred.
Transcript of Working Paper #9004: Financial Burden of Health Care ...provider of health care in Turkey, provided...

Financial Burden of Health Care Expenditures in Turkey: 2002-2003
Seher Nur Sulku and Didem Minbay Bernard
Agency for Healthcare Research and Quality Working Paper No. 09004
November 2009
Suggested citation: Sulku S, Bernard D. Financial Burden of Health Care Expenditures in Turkey:2002-2003. Agency for Healthcare Research and Quality Working Paper No. 09004, November2009, http://gold.ahrq.gov.
AHRQ Working Papers provide preliminary analysis of substantive, technical, and methodologicalissues. The papers have not undergone external peer review. They are distributed to sharevaluable experience and research. Comments are welcome and should be directed to theauthors. The views expressed are those of the authors and no official endorsement by theAgency for Healthcare Research and Quality or the Department of Health and Human Services isintended or should be inferred.
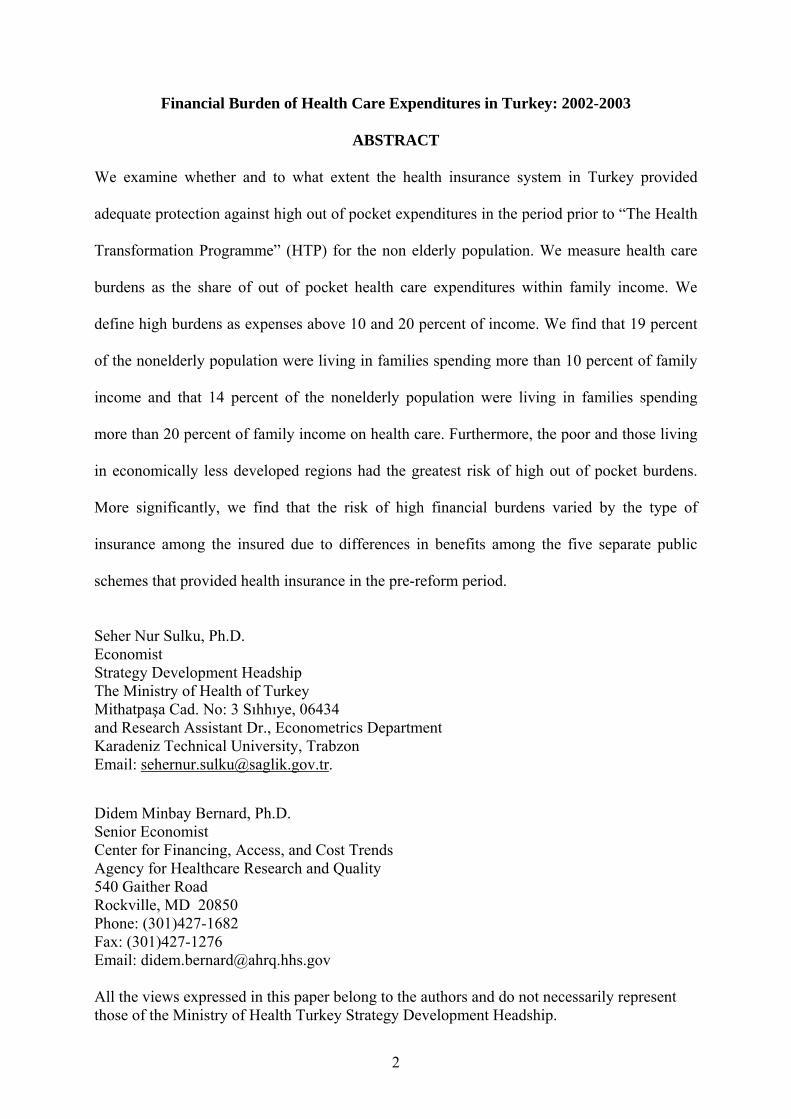
Financial Burden of Health Care Expenditures in Turkey: 2002-2003
ABSTRACT
We examine whether and to what extent the health insurance system in Turkey provided
adequate protection against high out of pocket expenditures in the period prior to “The Health
Transformation Programme” (HTP) for the non elderly population. We measure health care
burdens as the share of out of pocket health care expenditures within family income. We
define high burdens as expenses above 10 and 20 percent of income. We find that 19 percent
of the nonelderly population were living in families spending more than 10 percent of family
income and that 14 percent of the nonelderly population were living in families spending
more than 20 percent of family income on health care. Furthermore, the poor and those living
in economically less developed regions had the greatest risk of high out of pocket burdens.
More significantly, we find that the risk of high financial burdens varied by the type of
insurance among the insured due to differences in benefits among the five separate public
schemes that provided health insurance in the pre-reform period.
Seher Nur Sulku, Ph.D. Economist Strategy Development Headship The Ministry of Health of Turkey Mithatpaşa Cad. No: 3 Sıhhıye, 06434 and Research Assistant Dr., Econometrics Department Karadeniz Technical University, Trabzon Email: [email protected].
Didem Minbay Bernard, Ph.D. Senior Economist Center for Financing, Access, and Cost Trends Agency for Healthcare Research and Quality 540 Gaither Road Rockville, MD 20850 Phone: (301)427-1682 Fax: (301)427-1276 Email: [email protected]
All the views expressed in this paper belong to the authors and do not necessarily represent those of the Ministry of Health Turkey Strategy Development Headship.
2

Introduction
The World Health Organization (WHO) European Region Committee has approved a new
health policy framework in September 1998. Turkey, as a member of WHO, has accepted this
new health policy and initiated a series of reforms to align its health care system with the
health regulations of the European Union and the OECD countries [1, 2]. The “Health
Transformation Program” (HTP) was launched in 2003.
WHO states one of the major aims of health policy as providing financial protection
especially for the poor and disadvantaged groups from high health care expenditures. One of
the main goals of the HTP is to provide financial protection. The Universal Health Insurance
(UHI) system was implemented in October, 2008. Prior to the UHI, health insurance was
provided by five different public schemes each with separate provider networks. UHI will
provide health services under one scheme.
Financial burdens of health care expenditures during the period prior to HTP reforms has not
been examined. Therefore, there are no benchmarks to evaluate the performance of the
reforms in terms of providing adequate financial protection. This paper fills an important gap
by examining the distribution of health care expenditure burdens for the period prior to the
UHI which was implemented in 2008. We examine the risk of high financial burden due to
out of pocket health spending for the non elderly population by insurance status. Furthermore,
we examine the distribution of out of pocket expenditures by service type, access to care and
self-reported health status. Our study provides a benchmark against which policymakers can
evaluate the health care reform in terms of providing financial protection.
3

Background
Turkey’s per capita gross domestic product (GDP) was $5,045 in 2005. Total health care
expenditures were $27.6 million in 2005 and health expenses accounted for 5.7% percent of
the GDP [3]. Turkey’s population was 72 million in 2005. The age composition of Turkey is
much younger than that of other OECD countries: In Turkey, children 0 to 14 years constitute
28.4% of the population while individuals aged 65 and above constitute only 5.9%. In other
OECD countries, on average children 0 to 14 years constitute 17.4% and those aged 65 and
above constitute 15% of the population.
Prior to HTP reforms
Health care delivery system. Prior to the HTP reforms provision of health care was complex
and fragmented. There were three main public providers: the Ministry of Health (MoH), the
Social Insurance Organization (SSK), and universities. The Ministry of Health, the largest
provider of health care in Turkey, provided primary health care, secondary, and tertiary care
through its own primary health care facilities and hospitals. It was the only provider of
preventive services. In 2002, MoH managed 654 hospitals that accounted for 57% of
hospitals and approximately 50 percent of total hospital beds.
SSK provided health care services through its 120 hospitals and other health facilities.
University hospitals (56 hospitals) were the main provider of tertiary care, though their share
in the overall delivery system was small. With 241 hospitals, the private sector accounted for
20% of all hospitals. However, the private sector accounted for only 6.7% of total hospital
beds [4]. The private sector had a major role in providing outpatient care through its
outpatient clinics. Doctors were allowed to work part time both in a public facility and in their
private clinics [5].
4

Health care financing. Before the HTP reforms, health care financing was also complex and
fragmented. There were three different social security schemes: SSK, Government Employees
Retirement Fund (GERF), and the Social Insurance Agency of Merchants, Artisans and the
Self-employed (Bag-Kur). These security funds provided both pension and health insurance.
SSK covered private sector employees and blue-collar public sector employees, Bag-Kur
covered self-employed people and GERF covered retired civil servants. In addition, health
spending of active civil servants was financed from the general government budget.
Moreover, the Green Card scheme, which provided free health services for the poor was
directly funded by the government budget.1 Apart from these five schemes, the Social
Solidarity Fund, which was financed through the government budget, covered the health
expenses of the low income uninsured who were ineligible for Green Card.
Differences in benefits between the public insurance schemes. The five separate schemes had
varying benefit levels. GERF had the most generous benefits package, providing all outpatient
and inpatient care, medical and non-medical services. GERF provided access to all facilities:
state facilities, universities, and the private sector facilities [2]. Active civil servants were
allowed to use public facilities and could also be referred to the private facilities. The SSK
covered all inpatient and outpatient expenditures, but did not provide nor pay for preventive
care services. The SSK provided services directly through its own facilities. However,
members could be referred to the MoH, university, and less frequently, private hospitals. The
SSK purchased the significant percentage of drugs from manufacturers and but also
manufactured generic drugs; and its members obtained pharmaceuticals through SSK
hospitals and dispensaries.
1 For the distribution of population by insurance scheme please see Section 3 Results ‘Burdens by Insurance Status’.
5

Bag-Kur did not operate its own health facilities. Bag-Kur provided inpatient services,
outpatient services and pharmaceuticals through contracted health organizations such as
the Ministry of Health and SSK facilities, university hospitals, private hospitals,
nongovernmental organizations and pharmacies for [7]. The Green Card scheme covered
inpatient care only at the Ministry of Health hospitals and alllowed referrals to university
hospitals. However, the Green Card holders were reimbursed by the Solidarity Fund for
outpatient expenses if the Fund had enough sources.
Prior to the health care reform, only GERF and Bag-Kur members had access to private
facilities for dental care. Furthermore, only GERF members had direct access to university
hospitals, while SSK members had to be referred from other public hospitals. Bag-Kur
members were required to pay for expenses incurred at university and private hospitals out of
pocket, and then were reimbursed from Bag-Kur subject to quantity and price constraints. For
services that were not provided by contracted hospitals, patients were referred to private
centers. SSK members had access to only contracted centers [8].
Insurance premiums: GERF did not collect any premiums for health insurance. It financed its
health care services through the GERF budget. GERF budget was composed of pension
contributions: active civil servants’ contributions as employees (16% of salary) and the
government’s contribution as employer (20% of salary). Moreover, the difference between
GERF funds and expenses were subsidized from the government’s general budget.
Active civil servants’ health care expenses were not covered by GERF and their expenses
were financed through allocations from the government budget. The SSK was mainly funded
6

through premiums based on payroll wages.2 SSK actives had to pay 5% of payroll wage as
employee contribution and employers paid 6 % of payroll wage.
Insurance premiums were a significant burden especially for Bag-Kur active members, since
there was no other contribution from other sources. Bag-Kur premiums were 20% of Bag-Kur
active member’s average income. Bag-Kur retirees paid for health insurance through a 10%
deduction from their pension.
Co-payment for outpatient services were the same for GERF, SSK and Bag-Kur. For
outpatient pharmaceuticals, prosthesis and other healing devices co-payment rates were 20%
and 10% for active members and pensioners, respectively.3 Furthermore, SSK members and
their dependents had copays per outpatient visit.4 However, copay rates were reduced for
consultation and surgery at SSK facilities.
Crucial HTP Reforms
Under the HTP reforms, the SSK health facilities were transferred to the MoH thereby
separating the financing (SSK) and the provision of health care services (MoH). The SSK
members gained access to all MoH hospitals. Performance based supplementary payment
system was initiated in the MoH health facilities. Health information systems were improved.
Moreover, Green Card scheme started to cover outpatient health expenses. Both Green Card
holders and SSK members gained access to private pharmacies. Social Security Institution
(SSI) was established; SSK, Bag-Kur and GERF were integrated into one institution.
2 Additional sources of funding are payments of non-members for using SSK facilities (such as Bag-Kur members).3 However, neither of the insurance schemes were charging for the long-term outpatient drug therapies (such as cancer, chronic illnesses). 4 Copay amount was equal to ‘civil servants wage multiplier’ times 20. Civil servants wage multiplier, which is a constant less than one, renewed every 6 months by the Council of Ministers.
7

Most significantly, in 2008 UHI was initiated. UHI aims to extend GERF benefits to all
insured people. Thus, the benefit generosity across the various health insurance schemes is
unified under UHI. Ultimately, UHI will cover the whole population. However, the reform
will take some time; active civil servants and green card holders will be covered by UHI in
three years.5
Methods and Data
We used data from the 2002-2003 National Household Health and Expenditure Survey. This
survey was administered to help develop and implement the ‘National Health Accounts’ that
are in line with the standards of the European Union and OECD Health Accounts System.6
The household survey contains detailed information on health insurance coverage, health
utilization, and out of pocket spending (OOPS) on healthcare as well as other
sociodemographic variables. Two rounds of the survey were administered during September-
October 2002 and during March-April 2003. The survey had a 92 percent response rate with
9,805 out of 10,675 households completing the survey.7 Sample size is 39,411 for the
nonelderly (younger than 65 years) population used in this study. Our results are weighted to
be nationally representative of the Turkish civilian, noninstitutionalized population younger
than 65 years.8 Sandard errors have been corrected for the complex design of the survey.
Health care burdens are defined as the share of out of pocket health care expenditures within
family income. Burdens are contructed at the family level and then assigned to individuals
5 Please see references [2] and [4] for more detailed information on HTP reforms. 6 Turkish Institute of Health (TUSAK), the MoH Turkey, conducted the National Health Accounts study with a consortium of Harvard Public Health School and Health Management Resaearch Company. The consortium assigned BİGTAŞ research company to conduct the 2002-2003 National Household Health and Expenditure Survey. The Survey’s sample has been developed by the Turkish Statistical Institute (TUIK). 7 The sample chosen with random probability sample technique to represent Turkey’s population and its five regions. Turkey is composed of 7 geographical regions: North (Karadeniz Region), South (Akdeniz Region), South East, Central Anatolia, East Anatolia, Aegean and Marmara Regions. This survey combines South East and East Anatolia regions as ‘East’; and Aegean and Marmara Regions as ‘West’. 8 The weights were constructed by Turkish Statsistical Institute (TUIK).
8

within the family. The burden measure includes all out of pocket payments for healthcare
products and services. Premium payments and indirect health expenditures are not included.9
The survey did not collected data on premiums for public insurance schemes.10 Thus we
could not include premiums in the financial burden measure.
Following previous literature, we define high burdens as OOP spending above 10 and 20
percent of family income11 [see 9, 10]. The survey data have been previously edited by the
MoH of Turkey. In order to construct the burden measure (dividing health expenses by
income), we replace income for families that report zero income (7.6% of the sample) with a
week’s minimum wage. 12
We also present burdens by demographic characteristics and by poverty status. We use
TUIK’s poverty line (PL) based on food and non-food expenses:13 poor (income< P), low-
income (100% PL <income<200% PL), middle-income (200% Pl<income< 400% Pl), and
high-income (income > 400% PL).14
9The expenses for transportation, meal and hospital attendant are called as indirect expenses. In literature these expenses are not included directly in the OOPS on health. 10 The survey collected only premium for private insurance. Only 0.4% of non-elderly population were privately insured in Turkey in 2002-2003. Thus we did not include the premium payments in the financial burden measure. 11 Annual family income is the sum of annual personal income of all family members. Annual personal income is composed of the sum of income received during last 12 months such as salary, wage or crop share, interest income, rental income, remittance, any payment from public aid programs in cash or in kind and inheritance (or lotteries in cash or in kind). 12 Since our survey has winter-2002 and summer-2003 rounds we calculate the related minimum weekly wages for these years separately. Yearly minimum wage was $1468.3 in 2002 and $1816.4 in 2003. Thus a weekly minimum wage is $30.5 in 2002 and $37.8 in 2003.
13 TUIK provides poverty lines for families composed of at most 10 persons. In our analyze families crowded than 10 persons constitutes 4% of our sample. Indeed, only 3% of them incurred health care expenses greater than 10% of family income. Thus, we did not consider families crowded than 10 persons, and this does not affect our results represented in this section.
14 Note that the size of the lower income groups are higher than the official estimates, but it is within the poverty estimates for Turkey. According to TUIK, 18.6 % of the population was below the poverty line. Accroding to the Worl dBank, in 2003 29.6 of the population was below the poverty line. According to Ankara Business Bureau, 74 percent of the population is below the poverty line. Underreporting of income in the household survey may also partially explain the discrepancy.
9

Results
Burdens by Insurance Status
Exhibit 1 shows that the publicly provided health insurances schemes covered 65.4% of the
nonelderly population (43.3 million). SSK covered 33.6% of the population (active SSK and
pensioned), Bag-Kur insured 11.0% of the population (active and pensioned), and GERF
covered 4.4% of the population. Active civil servants and their dependants account for 7.8%
and Green Card holders account for 8.7% of the population. Uninsured population (22
million) accounts for 33.7% of the nonelderly population. Three hundred thousand
individuals, 0.4% of non-elderly population, had private insurance. The remaining, 0.5% of
non-elderly population, had other health coverage15.
Overall, 19 percent of the nonelderly population (12.6 million) was living in families
spending more than 10 percent of family income on health care. In other words,
approximately one out of every five persons incurred burdens that exceeded 10 percent of
family income. Moreover, 14 percent of the nonelderly population was living in families
spending more than 20 percent of family income on health care.
Second, there are significant differences in the risk of high burdens by insurance type. Green
Card holders are the most likely and active civil servants are the least likely to bear high
burdens. Among the active members, Bag-Kur actives had the greatest risk, while active civil
servants had the lowest risk of high burdens. Active civil servants had the highest income
($6112) and lowest OOP spending ($209). Similarly, among retirees Bag-Kur retirees had the
greatest risk while retired civil servants (GERF) had the lowest risk. Retired civil servants
(GERF) had higher income ($5179) and lower OOP spending ($211) compared to Bag-Kur
15 Other health coverages are mainly foreign health insurance and the Turkish Armed Forces’ health insurance for military personnel and veterans.
10

and SSK retirees. However, the difference in out of pocket payments among the retired
insurees are not statistically significantly different from each other.
Exhibit 1 also shows that Green Card holders faced the greatest risk of high burdens. Green
Holders had the lowest average income level ($1671). More significantly, their average out
of-pocket spending ($286) is higher than oop spending among active civil servants and retired
civil servants (GERF) who had the highest income among the nonelderly population. We
should indicate that the difference among oop health spending is not statistically significant.
Burdens by demographic characteristics and poverty status
Exhibit 2 shows risk of high burdens by demographic characteristics and poverty status.
Differences in risk of high burdens by age, sex region, urbanicity, by cities and by poverty
status are significant. Adults aged 55 to 64 years are the least likely (%16.6) and the children
aged 0 to 17 years are most likely (%20.7) to incur health care financial burdens exceeding
10% of family income. High burden among children are due to high rates of uninsurance and
low income. People living in the East region were most likely (24.2%) and those living in
Central Anatolia region were least likely (15.7%) to bear high burdens. East region of Turkey
is economically less developed and the number of insured people is low compared to other
regions. Furthermore, in the east region there is a shortage of health care providers. [2].
Exhibit 2 also shows that people living in rural areas have greater risk of incuring high
burdens compared to those in urban areas. People living in Ankara and Izmir (second and
third largest cities) were less likely to incur high burdens compared to those in Istanbul. While
the overall uninsurance rate for urban areas was 28.2%, 32.8 % of the population in Istanbul
was uninsured. The risk of high burdens are greater among lower income groups.
11

Distribution of out of pocket spending by service type
Exhibit 3 shows average out of pocket expenditures and the distribution of out of pocket
spending by service type. For this analysis we use person-level out of pocket expenditures.
Average out of pocket spending was significantly higher among those with burdens at the 20
percent threshold ($435) compared to persons with burdens below the 20 percent threshold
($14). Among those with burdens above 20 percent of income, ambulatory care accounted for
46.8 percent and prescription medications accounted for 30.8 percent of out of pocket
expenditures. Mean out of pocket expenditures were not significantly different among active
civil servants compared to SSK and Bag-Kur actives. Among active civil servants, hospital
stays accounted for 14.4 percent, ambulatory care visits accounted for 27.8 percent,
prescription medications accounted for 48.3 percent and other services accounted for 9.5
percent of out of pocket expenditures. Exhibit 3 also shows that among all insurance types,
ambulatory care visits and prescription medications account for the largest share of out of
pocket expenditures.
Utilization of health services by insurance coverage
Exhibit 4 shows that the percent with any health care use was significantly higher among the
active civil servants compared to SSK actives, Bag-Kur actives and Green card holders.
Similarly, the percent with any health care use were significantly higher among the retired
civil servants (GERF) compared to SSK and Bag-Kur retirees. There was no significant
difference among the public health insurance schemes in access to inpatient care except for
Green card holders. The percent with any inpatient care was significantly higher for Green
card holders compared to active civil servants. Before the HTP only inpatient care was
covered for Green card holders. Consequently, percent with any outpatient care, any
preventive care and any medication were significantly lower among Green card holders
12

compared to active civil servants. Exhibit 4 also shows that the percent with any medication
use was significantly lower among the SSK actives compared to active civil servants. Prior
the HTP system, SSK members had limited access to medication as they could only use SSK
pharmacies. Lastly, the percent with any outpatient care, any medication use, any preventive
care, any inpatient care and any health care use were significantly lower among the uninsured
compared to among the active civil servants.
Self-reported health status by insurance coverage
Exhibit 5 shows the differences in self-reported health status by insurance type. As with the
utilization measures, we find that the percent reporting good or very good health is higher
among active civil servants compared to Green card holders and the uninsured. Similarly, the
percent reporting good or very good health is higher among retired civil servants compared to
SSK and Bag-Kur retirees suggesting lower satisfaction with the health care system among
those with SSK, Bag-Kur coverage, Green card holders and the uninsured.
Discussion
We examined whether and to what extent the health insurance system in Turkey provided
adequate protection against high out of pocket expenditures in the period prior to “The Health
Transformation Programme” (HTP) for the non-elderly population. We found that 18.9 (14.4)
percent of the nonelderly population were living in families spending more than 10 percent of
family income on health care and 14.4 percent of the nonelderly population were living in
families spending more than 20 percent of family income on health care. Furthermore, those
with lower income, those living in rural area, those living in the eastern region, those living in
Istanbul and those who are younger had greater risk of having high out of pocket burdens.
More significantly, we found that the risk of high financial burden varied among the five
13

separate public schemes that provided health insurance in the pre-reform period. We also
found wide variation in terms of access to care and self-reported health status between the
different insurance schemes. GERF provided the best financial protection against high out-of
pocket health spending, followed by SSK and Bag-Kur. We did not include health insurance
premiums in our burden measure due to lack of data. However, due to high premium
contribution requirements by Bag-Kur, some of its members did not participate in its health
care insurance program (which was not mandatory). Thus, some with Bag-Kur coverage
might not have had access its health insurance benefits.
During the same period, out of pocket burdens among the nonelderly population in the United
States were significantly lower. Banthin and Bernard found that 8.5 percent of the nonelderly
population were living in families spending more than 10 percent of family income on health
care and 4.3 percent of the nonelderly population were living in families spending more than
20 percent of family income on health care in 2003 [9].
Our findings are generally in line with previous literature. Tatar et. al. examined informal
health care expenditures in Turkey in 2002 employing a survey of 900 households. They find
that the informal payments of the poor are significantly greater than that of non-poor. [5].
Their result is consistent with our findings and confirms the inadequency of the health care
system prior to HTP reforms. A recent report by the World Bank emphasizes that access to
health care services was lower in rural areas prior the HTP period. The Report also underlines
the inefficiency of health care personel and services in the east part of Turkey. [7]. Our results
that those living in rural area and living in the eastern region have greater risk of having high
out of pocket burdens are also consistent with the World bank report.
14

We are aware of only one other study on health expenditure burdens in Turkey during the
HTP period. Using Turkey’s Household Budget Survey, Aran and Hentschel found that only
5.3% of households were spending more than 10% of their household expenditure on health
care in 2006 [11]. However, we cannot conclude that catastrophic health spending has
declined over this period. Health care expenditure data collected as part of a general survey of
expenditures are generally underreported compared to expenditure data collected by surveys
specifically focus on health care. Thus, we believe that the National Household Health
Expenditure Survey is a more reliable source for estimating health care expenditure burdens.
The goal of the health care reform is to reduce the variation in the level of health related
burdens and to improve access to care for all. The next ‘National Household Health and
Expenditure Survey’ will be conducted in 2010 by the Turkish Statistical Institute. By
replicating our analysis with data from 2010, we plan to investigate the extent to which the
healthcare reform will succeed in lowering health care burdens. Thus, this study will provide
the benchmark against which researchers can measure the success of the health care reform in
terms of providing financial protection.
15

REFERENCES
[1] Future for Turkish health sector under 21 aims. (21 hedefte Türkiye sağlıkta gelecek).
Ankara, Turkey: Ministry of Health and Refik Saydam Hygiene Center School of Public
Health; 2007.
[2] OECD. OECD Reviews of health systems Turkey, OECD and the International Bank for
Reconstruction and Development, The World Bank; 2009.
[3] Organisation for Economic Co-operation and Development (OECD) health data 2008:
statistics and indicators for 30 countries. Paris, France: OECD; 2008.
[4] Health 2006. (Sağlık 2006). Ankara, Turkey: Ministry of Health; 2006.
[5] Tatar MH, Ozgen B, Sahin PB, Berman P. Informal payments in the health sector: a case
study from Turkey. Health Affairs 2007; 26: 1029-39.
[6] Savas, SB, Karahan Ö, Saka Ö. Health care systems in transition: Turkey. In: Thomson S,
and Mossialos E, editors. Copenhagen, European Observatory on Health Care Systems; 4(4)
2002.
[7] World Bank. Turkey: reforming the health sector for improved access and efficiency.
Volume 1 and 2, report no. 24358-TU.2003. Washington DC: International Bank for
Reconstruction and Development, The World Bank; 2003.
[8] Social Security Institution. 2007 Activity report. (2007 Yılı Faaliyet Raporu). Social
Security Institution; 2008. Available at http://www.sgk.gov.tr/wps/wcm/connect/2c354400
4c1667138480846156da2d6a/2007FaaliyetRaporu.pdf?MOD=AJPERES.
[9] Banthin JS, Bernard DM. Changes in financial burdens for health care national estimates
for the population younger than 65 years, 1996 to 2003. Journal of the American Medical
Association 2006; 22: 2712-9.
[10] Banthin JS, Cunningham P, Bernard DM. Financial burden of health care, 2001-2004.
Health Affairs 2008, 27: 188- 95.
16

[11] Aran M, Hentschel J. Household level health expenditures and health ınsurance coverage
of the poor in Turkey. Washington DC: World Bank; forthcoming.
17

Insurance Status
Population
(*1000)
Family Income
(US $)†
Out-of-pocket spending on care (US $)†
Percent in families with out-of-pocket burden
greater than 10 %
Percent in families with out-of-pocket burden
greater than 20 % Total Turkey Sample
66085 3904 (162.4)
351 (21.9)
18.9 (0.6)
14.4 (0.6)
Active Civil Servants
5150 6112 (467.0)
209 (48.2)
8.8 (1.1)
5.7 (0.9)
SSK active 15181 4571** (197.4)
367* (59.9)
15.9** (0.9)
10.6** (0.8)
Bag-Kur active 5562 5229 (894.3)
387* (51.7)
21.5** (1.7)
16.8** (1.6)
GERF 2899 5179(209.8)
211(36.1)
10(1.3)
6.5(1.1)
SSK retirees 7012 4064** (121.3)
299 (43.1)
15.2** (1.1)
9.8** (0.9)
Bag-Kur retirees 1696 3784** (259.3)
331 (93.0)
17.6** (2.1)
12.2** (1.7)
Green Card 5752 1671** (101.3)
286 (34.5)
25.9** (1.8)
22.2** (1.7)
Uninsured 22239 2867**(184.8)
424**(33.2)
23.4**(1.1)
19.3**(1.0)
Private Insurance 273 13360** (2495.6)
153 (53.3)
5.5 (2.7)
1.5** (1.0)
3382**(446.3)
178(53.1)
13.4(3.5)
5.7(2.1)
Others 323
Exhibit 1. Components of Family Out-of-pocket Burdens among the Nonelderly Population, Turkey: 2002-2003
Source: Authors’ calculations using data from the 2002-2003 National Household Health and Expenditure Survey. Survey was conducted in September 2002/ April 2003. average exchange rate for this period (1 US $ = 1.6 YTL) is used to convert family income and OOP spending on health into US dollars. Notes: †Standard errors of means are in parentheses. Statistical significance denotes difference from the reference category, active civil servants. *p<0.05 **p<0.01
18

Exhibit 2.a Risk of High Burdens By Demographic Characteristics and by Poverty Status, Among the Nonelderly Population, Turkey: 2002-2003
Persons with total family burden Population
(Thousands) >0.10 of Family
Income >0.20 of Family
Income Characteristics Total 66,085 Age 0-17 23,834 20.7
(0.8) 16.3
(0.8)
18-34 20,826 18.8
(0.7) 14.2*
(0.6)
35-54 17,052 17**
(0.6) 12.4**
(0.5)
55-64 4,374 16.6**
(1.0) 12.8**
(0.8)
Sex Male 33,182 18.6
(0.6) 14.2
(0.6)
Female 32,903 19.2
(0.6) 14.6
(0.6)
Region West 28,531 18.5
(1.0) 13.5
(0.8)
South 7,763 18.7
(1.4) 15
(1.4)
Middle 11,216 15.7*
(1.0) 10.8*
(0.8)
North 7,179 17
(1.4) 13.2
(1.5)
East -South East 11,396 24.2*
(2.0) 20.6**
(2.0)
Urbanicity Rural 20,738 21.5
(1.4) 17.7
(1.4)
Urban 27,258 17.2**
(0.8)12.8** (0.6)
Major cities Ankara 3,423 14.6
(1.9)9.2
(1.3) İstanbul 11,757 20.5*
(1.5) 14.6**
(1.4)
İzmir 2,909 14.2
(1.6) 11.1
(1.3)
Source: Authors’ calculations using data from the 2002-2003 National Household Health and Expenditure Survey. Note: †Standard errors of means are in parentheses. Statistical significance denotes difference from the reference category which is the first row of each panel. *p<0.05 **p<0.01
19

Exhibit 2.b Risk of High Burdens By by Poverty Status, Among the Nonelderly Population, Turkey: 2002-2003
Persons with total family burden
Family Income (FI)† Population (Thousands)
>0.10 of Family Income
>0.20 of Family Income
Poor 34,043 23.3 19.4 (FI<100% poverty line) (0.8) (0.7)
Low Income 17,699 14.3** 9** (100%< FI<200% poverty line) (0.8) (0.7)
Middle Income 8,507 13** 7.3** (200%< FI<400% poverty line) (1.1) (0.9)
High Income 3,311 5.6** 2.6** (FI≥400% poverty line) (1.2) (0.8)
Source: Authors’ calculations using data from the 2002-2003 National Household Health and Expenditure Survey. Note: †Poverty line by household size from Turkish Statistical Institute, (TUIK)). Poverty line is calculated including food and non-food expenses. †Standard errors of means are in parentheses. Statistical significance denotes difference from the reference category which is poor. *p<0.05 **p<0.01
20

Exhibit 3. Distribution of Out-of-Pocket Expenditures by Service Type, Among the Nonelderly Population, Turkey: 2002-2003
US$ average
oop expenses
(%) Distribution of average OOP
Hospital Stays
Ambulatory Care Visits
Prescription Medication
Other Services
Total 74.3(4.4)
17.3(0.8)
37.3(2.4)
39.3(2.4)
6.1(0.5)
persons with burden≤ %20 of income persons with burden> %20 of income
13.5 (0.7)
435.3** (27.9)
18.5 (1.0) 15.8 (1.1)
30 (4.2)
46.8** (1.5)
45.9 (4.2)
30.8** (1.4)
5.6 (0.7) 6.7
(0.7)
Active Civil Servants 62.6 (20.6)
insurance coverage 14.4 (2.5)
27.8 (3.1)
48.3 (3.6)
9.5 (1.9)
SSK active 79.8 (10.4)
16 (1.4)
39.9** (2.0)
35.9** (2.0)
8.2 (1.2)
Bag-Kur active
GERF
88.9 (14.0) 46.9
(11.1)
15.1 (2.2) 20.1(3.8)
40.2* (4.8) 29
(5.4)
41 (4.6) 46
(5.4)
3.6** (1.0) 4.9
(2.1)
SSK pensioned
Bag-Kur pensioned
Green Card
89.9 (15.8) 99.3
(27.7) 48.1 (5.3)
13.6 (1.4) 17.2 (3.3)
32.4** (2.7)
41.6** (2.1) 41.4* (4.6) 29
(2.7)
41.3 (2.1) 37.9 (4.8)
34.8** (2.8)
3.6** (1.1) 3.4* (1.5) 3.8** (1.1)
Uninsured 73.9(5.9)
17.2(1.3)
37.7(8.5)
38.8(8.5)
6.3(1.0)
Source: Authors’ calculations using data from the 2002-2003 National Household Health and Expenditure Survey. Notes: Standard errors of means are in parentheses. ** [*] Difference from the reference category is significant at 1 [5] percent level. Those with burden <20% of income are the reference category. The reference category in the lower panel is active civil servants.
21

Insurance Coverage
Outpatient (%)
Inpatient (%)
Preventive Care (%)
Medication† (%)
Any Health Care Use(%)‡
Total(Turkey Sample)
9.3(0.2)
3.1(0.1)
1.1(0.1)
6.5(0.2)
12.9(0.3)
Active Civil Servants
12.8 (0.7)
3.2 (0.4)
1.7 (0.2)
8.3 (0.6)
16.6 (0.7)
SSK active 9.6** (0.4)
3.6 (0.2)
1.3 (0.1)
6.5** (0.3)
13.9** (0.4)
Bag-Kur active GERF
9.9 (0.7)
17.9**(1.1)
2.9 (0.3) 3.4
(0.5)
0.8** (0.2) 1.4
(0.4)
7.5 (0.6)
13.1**(0.9)
13** (0.7)
21.5**(1.1)
SSK retirees 14 (0.7)
3.8 (0.3)
0.8** (0.1)
9.7 (0.6)
17.5 (0.8)
Bag-Kur retirees Green Card
15.6 (1.3) 8.1** (0.6)
4.4 (0.7) 5.6** (0.5)
0.6** (0.3) 0.9** (0.2)
11.9** (1.3) 4.7** (0.4)
19.4 (1.6)
13.7** (0.8)
Uninsured 5.5**(0.3)
1.8**(0.1)
1.1*(0.1)
4**(0.2)
8**(0.3)
Exhibit 4. Percent with Any Use of Health Care Services by Insurance Type Among the Nonelderly Population, Turkey: 2002-2003
Source: Authors’ calculations using data from the 2002-2003 National Household Health and Expenditure Survey. Notes: † Included prescription medication during hospitalization, outpatient and/or preventive health care. ‡: Any outpatient, any inpatient, any preventive care and any prescription medication. Standard errors of means are in parentheses. ** [*] Difference from the reference category (active civil servants) is significant at 1 [5] percent level.
22

Total†
50820
100
0.3
(0.0) 3.6
(0.2) 13.6 (0.4)
82.5(0.5)
Active Civil Servants
3906
7.7
0.1 (0.1)
1.9 (0.3)
10.8 (0.9)
87.2 (1.1)
SSK active
11150
21.9
0.2 (0.1)
1.9 (0.2)
11.0 (0.6)
86.9 (0.6)
Bag-Kur active
4218
8.3
0.2 (0.1)
2.9 (0.4)
11.1 (0.9)
85.8 (1.1)
GERF
2678
5.3
0.4 (0.2)
4.8 (0.6)
15.8 (1.1)
79**(1.3)
SSK retirees
6553
12.9
0.4 (0.1)
5.1 (0.4)
18.9 (0.9)
75.6** (1.0)
Bag-Kur retirees
1598
3.1
0.6 (0.3)
4.6 (0.7)
20.6 (1.6)
74.2** (1.8)
Green Card
4050
8
0.8 (0.2)
5.6 (0.5)
16.6 (1.1)
77.1** (1.3)
Uninsured
16161
31.8
0.2 (0.0)
4.1 (0.3)
12.9 (0.6)
82.7**(0.8)
Exhibit 5. Self Reported Health Status by Insurance Type Among the Nonelderly Population, Turkey: 2002-2003
Number of Persons (x1000)
Percent of total
population
Good or very good
(in %) Very Bad
(in %) Bad
(in %) Average (in %) Insurance Status
Source: Authors’ calculations using data from the 2002-2003 National Household Health and Expenditure Survey. Notes: † Total population for self reported health status (51 million) is less than our nonelderly total population (which is 66 million), due to missing values, ** [*] Difference from the reference category (active civil servants) is significant at 1 [5] percent level.
23

ACKNOWLEDGEMENTS
We are grateful to the Strategy Development Headship of the Ministry of Health (MoH) for sponsoring Seher
Nur Sulku’s visit to US Department of Health and Human Services Agency for Healthcare Research and Quality
(AHRQ). We thank the MoH Turkey Turkish Institute of Health (TUSAK) for providing access to the 2002
2003 National Household Health and Expenditure Survey data and TUSAK specialists for technical assistance.
We are grateful to Memet Atasever, head of MOH Strategy Development Headship, MoH Turkey, Steve Cohen,
Director of the Center for Financing, Access and Cost Trends (CFACT), AHRQ, Jessica Banthin, Director of the
Division of Modeling and Simulation, CFACT, AHRQ, and Joel Cohen, Director of the Division for Economic
and Social Studies, CFACT, AHRQ, for helpful comments. Any remaining errors are our own.
24