Workforce and Global Health H Edu 5100. Workforce Hospital employees # of occupations/professions...
34
Workforce and Global Health H Edu 5100
-
date post
22-Dec-2015 -
Category
Documents
-
view
218 -
download
3
Transcript of Workforce and Global Health H Edu 5100. Workforce Hospital employees # of occupations/professions...

Workforce andGlobal Health
H Edu 5100

Workforce
Hospital employees # of occupations/professions Growth of health care employment

Distribution of Health Care Employment by Settings
Setting % of Total
Hospitals 55.3%
Nursing and personal care facilities 17.2%
MD offices and clinics 16.5%
Dental offices and clinics 6%
Home health care 5%

Turnover - HospitalsTurnover - Hospitals
Overall = Overall = 17.58 %17.58 % Turnover by ageTurnover by age
– 29 or younger =29 or younger = 23.50 %23.50 %– 30-39 =30-39 = 13.96 %13.96 %– 40-49 =40-49 = 11.46 %11.46 %– 50 and older =50 and older = 6.86 % 6.86 %

Turnover – Hospitals Turnover – Hospitals by size and typeby size and type
0 - 100 beds = 0 - 100 beds = 16.97 %16.97 % 101 - 200 beds =101 - 200 beds = 17.22 %17.22 % 201 - 300 beds =201 - 300 beds = 20.61 %20.61 % Urban =Urban = 18.93 %18.93 % Rural =Rural = 16.99 %16.99 %

LPNsLPNs
Tenure = Tenure = 5.59 years5.59 years Openings = 3.82Openings = 3.82 Age = Age = 38.6238.62 18-24 = 18-24 = 6.77 6.77
individualsindividuals 50+ = 50+ = 4.23 4.23
individualsindividuals

RNsRNs
Tenure =Tenure =9.00 years9.00 years Openings =Openings = 23.1223.12 Age =Age = 40.2640.26 18-24 =18-24 = 29.00 29.00
individualsindividuals 50+ =50+ = 52.67 52.67
individualsindividuals

Radiologic Radiologic TechnologistsTechnologists
Tenure = Tenure = 7.317.31 Openings =Openings = 1.401.40 Age =Age = 35.6635.66 18-24 =18-24 = 2.422.42 50+ =50+ = 1.921.92

Physical TherapistsPhysical Therapists
Tenure =Tenure =5.09 years5.09 years Openings =Openings = 0.330.33 Age =Age = 35.44 35.44 18-24 =18-24 = 0.23 individuals0.23 individuals 50+ =50+ = 0.62 0.62
individualsindividuals

PharmacistsPharmacists
Tenure =Tenure =9.10 years9.10 years Openings =Openings = 0.860.86 Age =Age = 39.1139.11 18-24 =18-24 = 0.40 individuals0.40 individuals 50+ =50+ = 2.20 2.20
individualsindividuals
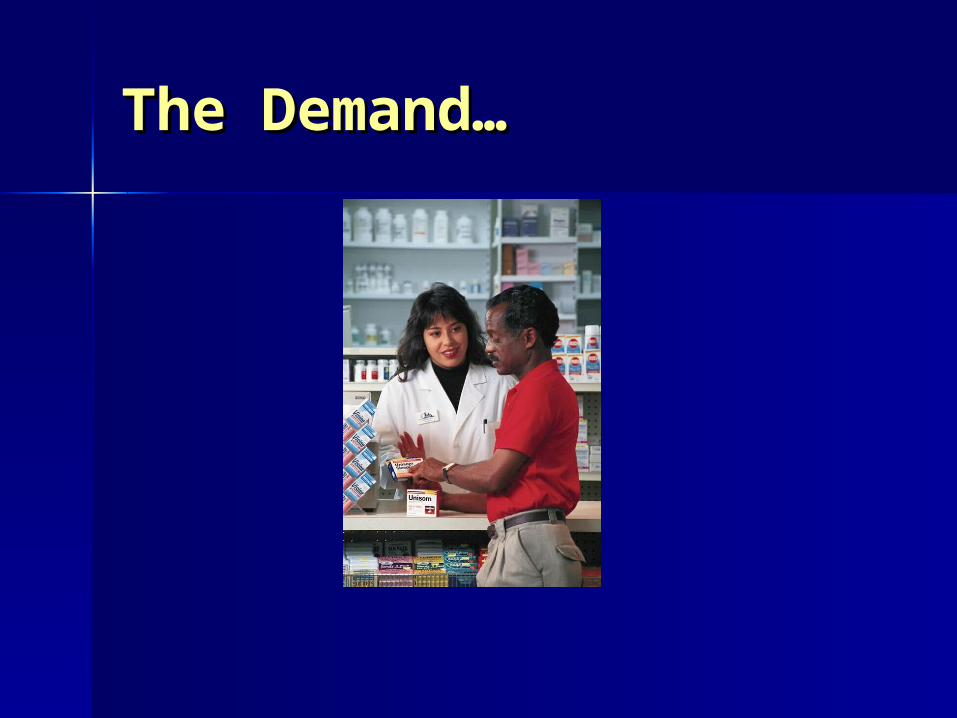
The Demand…The Demand…
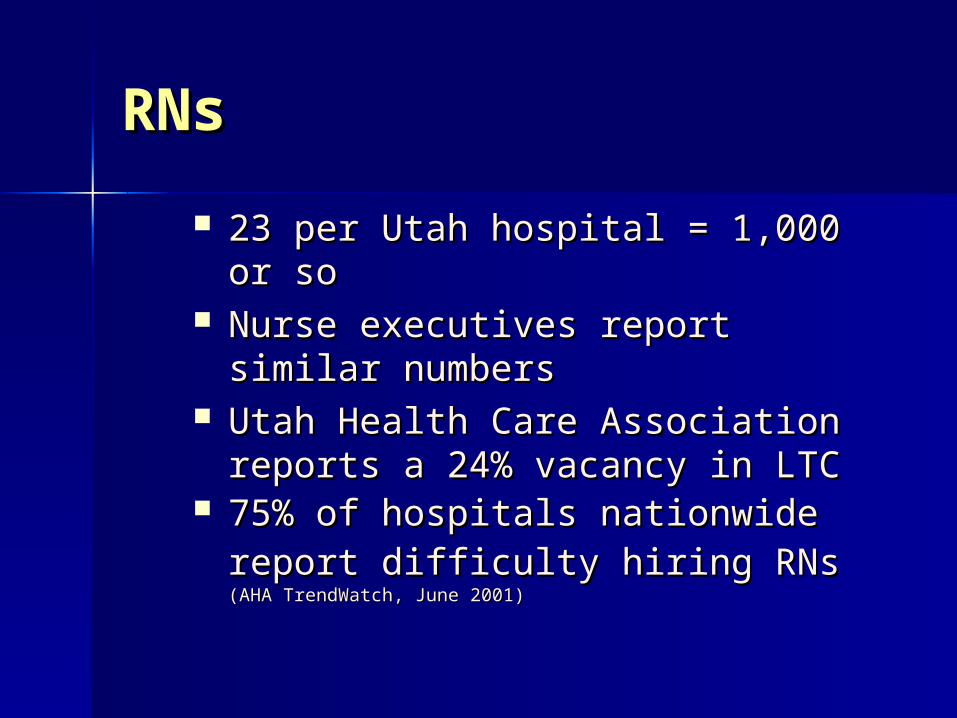
RNsRNs
23 per Utah hospital = 1,000 or 23 per Utah hospital = 1,000 or soso
Nurse executives report similar Nurse executives report similar numbersnumbers
Utah Health Care Association Utah Health Care Association reports a 24% vacancy in LTCreports a 24% vacancy in LTC
75% of hospitals nationwide 75% of hospitals nationwide report difficulty hiring RNsreport difficulty hiring RNs (AHA (AHA
TrendWatch, June 2001)TrendWatch, June 2001)

PharmacistsPharmacists
40 openings right now in 40 openings right now in hospitals.hospitals.
Consider retail pharmacyConsider retail pharmacy 21% vacancy rate nationwide 21% vacancy rate nationwide (AHA (AHA
Special Workforce Survey, June 2001)Special Workforce Survey, June 2001)
50% of hospitals nationwide 50% of hospitals nationwide report difficulty hiring report difficulty hiring pharmacistspharmacists (AHA TrendWatch, June 2001)(AHA TrendWatch, June 2001)

The Supply…The Supply…

Current Numbers Current Numbers (RNs)(RNs)
Total licensed RNs =Total licensed RNs =17,56617,566 Total Working =Total Working = 13,25713,257 Difference =Difference = 4,309 4,309
(Utah Medical Education Council, Feb 2002)

Higher Education Higher Education (RNs)(RNs)
Undergrad applicants = 1,400Undergrad applicants = 1,400 Undergrad admissions = 760Undergrad admissions = 760 Undergrad graduates = 615Undergrad graduates = 615
(2000-01 academic year)

Higher Education Higher Education Annual Utah GraduatesAnnual Utah Graduates
Respiratory Therapists = 50Respiratory Therapists = 50 Clinical Laboratory = 35Clinical Laboratory = 35 Radiologic Technologists = 85Radiologic Technologists = 85 Physical Therapists = 36Physical Therapists = 36 Pharmacists = 40Pharmacists = 40

Demand and SupplyDemand and Supply
948
615
0
100
200
300
400
500
600
700
800
900
1000
Hospital Openings Graduates
Registered Nurses

67
50
0
10
20
30
40
50
60
70
Hospital Openings Graduates
Respiratory Therapists
Demand and SupplyDemand and Supply

Demand and SupplyDemand and Supply
131
75
0
20
40
60
80
100
120
140
Hospital Openings Graduates
Radiologic Sciences

ConcernsConcerns
Aging workforceAging workforce Aging population = more Aging population = more
servicesservices Aging facultyAging faculty

ConcernsConcerns
2% of freshmen nationwide 2% of freshmen nationwide indicate nursing as a majorindicate nursing as a major
Number of pharmacy Number of pharmacy graduates has decreasedgraduates has decreased
Enrollment and graduates do Enrollment and graduates do not keep pace with demandnot keep pace with demand

Counting the workforce
Body count FTEs Paychecks

Credentialing
Why? Limitations Procedures
LicensureCertificationRegistration

Nursing
History Levels
PNRNADN/NP
Licensing

Medicine
# of schools Men vs. Women Internship/Residency Fellowship Primary Care

Other health workers
Dental Podiatry Chiropractors Optometrists

Allied health personnel
Pharmacists Clinical Lab Sciences Physical Therapy Radiologic Sciences Respiratory Therapy

Current Issues
Shortages California mandates

Global Health

Comparative Health Systems (pg. 112)
Health System
Private Pluralistic National health insurance
National health service
Socialized health service
General definition
Health care as item of personal consumption
Health care as predominantly a consumer good or service
Health care as an insured, guaranteed consumer good or service
Health care as a state-supported consumer good or service
Health care as a state-provided public service
Position of the physician
Solo entrepreneur
Solo entrepreneur and member of variety of groups, organizations
Solo entrepreneur and member of medical organizations
Solo entrepreneur and member of medical organizations
State employee and member of medical organizations
Professional associations
Powerful Very strong Strong Fairly strong Weak or nonexistent
Ownership of facilities
Private Private and public
Private and public
Mostly public Entirely public
Economic transfers
Direct Direct and indirect
Mostly indirect Indirect Entirely indirect
Prototypes U.S., Western Europe
U.S. in 20th century
Sweden, France, Canada
Great Britain Soviet Union in 20th century

Statistics
5 Billion people Distribution
U.S. = 5% of population, 40% of budgetChina = >20% of population, <1% of budget
Does more spending = better health?

Economist categorization
High income = $10,000 per capita Medium income = $1,000-$7,500 Low income = < $1,000
International Trade
Only a tiny fraction Products People and ideas